

Abstract
The organization of filamentous actin (F-actin) in the synaptic pedicle of depolarizing bipolar cells from the goldfish retina was studied using fluorescently labeled phalloidin. The amount of F-actin in the synaptic pedicle relative to the cell body increased from a ratio of 1.6 ± 0.1 in the dark to 2.1 ± 0.1 after exposure to light. Light also caused the retraction of spinules and processes elaborated by the synaptic pedicle in the dark.
Isolated bipolar cells were used to characterize the factors affecting the actin cytoskeleton. When the electrical effect of light was mimicked by depolarization in 50 mM K+, the actin network in the synaptic pedicle extended up to 2.5 μm from the plasma membrane. Formation of F-actin occurred on the time scale of minutes and required Ca2+ influx through L-type Ca2+ channels. Phorbol esters that activate protein kinase C (PKC) accelerated growth of F-actin. Agents that inhibit PKC hindered F-actin growth in response to Ca2+ influx and accelerated F-actin breakdown on removal of Ca2+.
To test whether activity-dependent changes in the organization of F-actin might regulate exocytosis or endocytosis, vesicles were labeled with the fluorescent membrane marker FM1-43. Disruption of F-actin with cytochalasin D did not affect the continuous cycle of exocytosis and endocytosis that was stimulated by maintained depolarization, nor the spatial distribution of recycled vesicles within the synaptic terminal. We suggest that the actions of Ca2+ and PKC on the organization of F-actin regulate the morphology of the synaptic pedicle under varying light conditions.
Keywords: actin, calcium, protein kinase C, synapse, vesicle
It is likely that the actin cytoskeleton is involved in activity-dependent changes in the structure of synapses (Lisman and Harris, 1993; Wagner and Djamgoz, 1993; Harris and Kater, 1994; Edwards, 1998; Fischer et al., 1998). One example of structural plasticity at synapses is the formation of spinules: thin finger-like extensions of the postsynaptic membrane that project into the presynaptic terminal to perforate the active zone. Spinules are formed in the hippocampus after the induction of long-term potentiation (Calverley and Jones, 1990; Schuster et al., 1990; Edwards, 1995), and in Aplysia, after sensitization (Bailey and Thompson, 1979), and so may aid the strengthening of synaptic connections (Calverley and Jones, 1990; Geinisman et al., 1993). Activity-dependent formation and retraction of spinules is particularly apparent in the retinae of fish (Wagner and Djamgoz, 1993). In response to light, horizontal cells project spinules into the synaptic pedicle of cone photoreceptors (Raynauld et al., 1979; Wagner, 1980) and hyperpolarizing bipolar cells project spinules into the synaptic processes of amacrine cells (Behrens and Wagner, 1996). In contrast, light causes the retraction of spinules in depolarizing bipolar cells (Yazulla and Studholme, 1992; Behrens and Wagner, 1996). These dramatic changes in the structure of retinal synapses are thought to reflect the alterations in the strength of synaptic connections that allow the retinal circuit to process visual signals with mean intensities varying by 10 orders of magnitude (De Vries and Baylor, 1993; Wagner and Djamgoz, 1993).
Horizontal cell spinules are eliminated if F-actin is disrupted (Ter-Margarian and Djamgoz, 1992; Weiler and Janssen-Bienhold, 1993) and Fischer et al. (1998) have shown that actin polymerization is necessary for growth and retraction of spines on the dendrites of hippocampal neurons in culture. Nonetheless, it is unclear how electrical activity might affect the organization of actin at mature synapses (Harris and Kater, 1994; Edwards, 1995). To approach this question we have investigated the regulation of the actin cytoskeleton in the synaptic terminal of depolarizing bipolar cells in the retinae of goldfish (von Gersdorff and Matthews, 1994). The large size of this synapse (∼12 μm in diameter) makes it particularly well-suited to studying how electrical activity might affect the organization of the cytoskeleton. The terminal (also termed the pedicle) is the site of specialized ribbon synapses that release glutamate onto ganglion cells and amacrine cells (Tachibana and Okada, 1991), but it is also a postsynaptic structure, receiving a large number of inhibitory (GABAergic) feedback connections from amacrine cells (Dowling, 1987). In the dark, the pedicle is irregular in shape and forms spinules that invaginate the presynaptic processes of amacrine cells. Light causes the pedicle to take on a much more regular shape and retract spinules (Yazulla and Studholme, 1992; Behrens and Wagner, 1996). Here we demonstrate that these morphological changes are associated with the growth of actin filaments. To characterize the events regulating the actin cytoskeleton more directly, we used cells isolated from the rest of the retinal circuit. When the electrical effect of light was mimicked by depolarization in 50 mM K+, the actin network under the plasma membrane extended up to 2.5 μm, and this effect was localized to the synaptic pedicle. Growth of the actin network was triggered by Ca2+ entry through L-type Ca2+ channels and accelerated by phorbol esters that activate protein kinase C (PKC).1 Removal of external Ca2+ caused the breakdown of F-actin, which was accelerated by inhibitors of PKC.
It has been suggested that actin is involved in the cycling of vesicles at the synapse. Ca2+ influx into rat brain synaptosomes causes the breakdown of F-actin under the plasma membrane (Bernstein and Bamburg, 1989), and similar behavior has been observed during stimulation of exocytosis in chromaffin cells (Burgoyne et al., 1989; Vitalé et al., 1995) and other nonneuronal secretory cells (Koffer et al., 1990; Muallem et al., 1995). In chromaffin cells, breakdown of cortical F-actin is thought to enable secretory granules to move to sites of exocytosis on the plasma membrane (Cheek and Burgoyne, 1987; Vitalé et al., 1995). Actin filaments have also been implicated in the recycling of synaptic vesicles (Heuser, 1989; Mundigl et al., 1998), an idea partly prompted by experiments indicating the involvement of F-actin in endocytosis in yeast (Geli and Riezman, 1996) and mammalian cells (Lamaze et al., 1997).
The giant synapse of depolarizing bipolar cells allows the role of actin during vesicle cycling to be tested directly, because it is one of the few synapses where it has been possible to apply direct physiological methods to monitor exocytosis and endocytosis of small vesicles (Tachibana and Okada, 1991; von Gersdorff and Matthews, 1994; Lagnado et al., 1996; Mennerick and Matthews, 1996; Burrone and Lagnado, 1997; Neves and Lagnado, 1998). Using the fluorescent dye FM1-43 to label synaptic vesicles in real time (Betz et al., 1996; Lagnado et al., 1996), we found that disruption of F-actin with cytochalasin D did not affect exocytosis or endocytosis, nor the spatial distribution of recycled vesicles within the terminal. Thus, the actin network did not regulate vesicle cycling at the bipolar cell synapse. We suggest that activity-dependent changes in the organization of F-actin normally regulate the morphology of this synaptic terminal in the retina.
Materials and Methods
Staining Depolarizing Bipolar Cells in the Retina
Goldfish were maintained on a 12-h light/dark cycle, and adapted to the light or dark for 3–4 h on the morning of an experiment. After decapitation and pithing, the eyeballs were removed and the retinae peeled from the eyecups and fixed in 4% paraformaldehyde in 0.1 M sodium phosphate buffer (pH 7.4) for 1 h at room temperature. Fixative was replaced with 20% sucrose overnight at 4°C and the tissue was then embedded in Cryo-M-Bed (Bright). 30-μm frozen sections were taken with a Bright cryostat and mounted on gelatin-coated slides for storage at −20°C.
F-Actin was stained with fluorophore-phalloidin. FITC- and TRITC-phalloidin were obtained from Sigma Chemical Co. (St. Louis, MO) and Oregon green–phalloidin was from Molecular Probes (Eugene, OR). The cytoskeletal buffer used contained 137 mM NaCl, 5 mM KCl, 1 mM Na2HPO4, 0.4 mM KH2PO4, 5.5 mM glucose, 4 mM NaHCO3, 2 mM MgCl2 · 6H2O, 2 mM EGTA, and 10 mM MES, pH 6.0. Slides with retinal sections were incubated with 5 μM fluorophore-phalloidin and 0.5% Triton X-100 for 2 d at 4°C and then 2 h at room temperature. Sections were then washed for 5 min before immunofluorescent staining of PKC to allow identification of depolarizing bipolar cells. Slides were fixed with 4% paraformaldehyde for 20 min at room temperature. A Tris-Triton buffered saline solution (TTBS) was used for antibody incubation and washes (0.1 M Tris-HCl, pH 7.4, 0.154 M NaCl, 0.3% Triton X-100). Sections were permeabilized with 10% Triton X-100 in TTBS for 4 min. Monoclonal PKCα antibody MC5 (Amersham International, Buckinghamshire, UK) was added at a dilution of 1:25 and slides were stored at 4°C for a minimum of 7 d. Anti–mouse biotin was added at 1:200 for 2 h and then avidin-fluorescein (Vecta) added at 1:1,000 for 15 min at room temperature. Sections were dried and mounted on Vectashield antifade mounting medium (Vecta).
Fluorescence images were obtained with an MRC-1024 confocal microscope with an argon/krypton laser mounted on a Nikon Optiphot microscope with a ×60 Nikon PlanApo oil objective (NA 1.4). Confocal sections were taken with an iris aperture of 4.0 at low magnification (see Fig. 1) and 2.0 at high magnification (see Fig. 2). Images were analyzed using IP Lab 3.0.1 (Signal Analytics, Vienna, VA). First, the boundaries of depolarizing bipolar cells were defined by applying the threshold function to images of PKCα immunoreactivity. This function sets to zero all pixels below a value defined by the user. The threshold was chosen so that the blacked-out region formed a continuous boundary around the cell. Next, changes in the shape of the synaptic pedicle were assessed by measuring its radial standard deviation (r.s.d.). This is the standard deviation of the distance from the centroid of the pedicle to its outer boundary, reported as a percentage of the mean radial distance. A perfect circle would have an r.s.d. of zero. Measurement of the r.s.d. to assess changes in the shape of the synaptic pedicle is simpler than the method of fractal dimension analysis used by Yazulla and Studholme (1992).
Figure 1.

Adaptation to light altered the morphology of the synaptic pedicle of depolarizing bipolar cells. (A) Fluorescence image of a transverse section of goldfish retina showing PKCα immunoreactivity in bipolar cells (green) and staining with TRITC-phalloidin (red). TRITC-phalloidin is concentrated in photoreceptors (PR), in the outer plexiform layer (OPL) containing horizontal cells and the inner plexiform layer (IPL) containing amacrine cells and the synaptic terminals of bipolar cells. The retina was dark-adapted. (B) Blow-up of the area in A indicated by the arrows, showing processes (arrowheads) and spinules (thin arrows) elaborated by synaptic pedicles in the dark. (C) An example of a light-adapted retina stained the same way. (D) Blow-up of the area in C indicated by the arrows, showing the smoother and more rounded shape of synaptic pedicles in the light. Bars, 30 μm.
Figure 2.
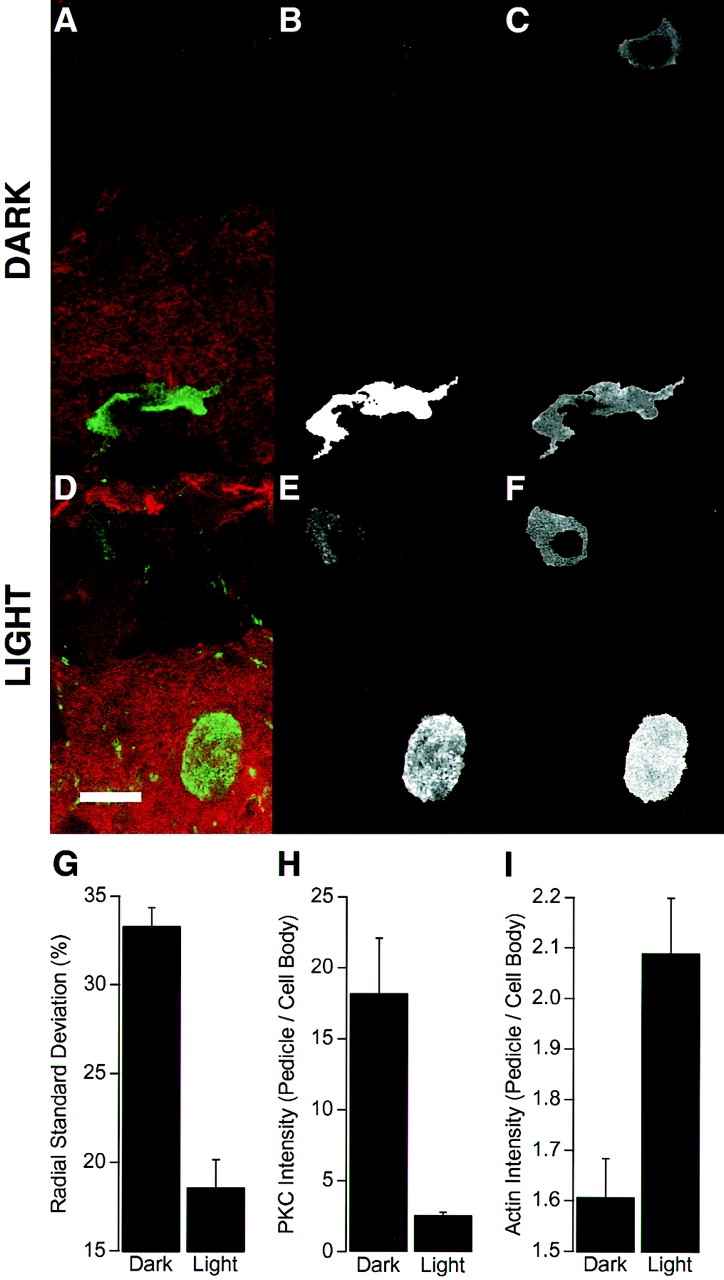
Light-dependent changes in the morphology of the synaptic pedicle were correlated with changes in the distribution of F-actin and PKCα. (A) Fluorescence image of a transverse section of goldfish retina showing PKCα immunoreactivity in a depolarizing bipolar cell (green) and staining with TRITC-phalloidin (red). The retina was dark-adapted. (B) The image of PKCα immunoreactivity from A after thresholding to define the boundary of the cell (see text). (C) The image of phalloidin staining from A after superimposition of the boundary defined in B. D–F show a similar treatment of images obtained from a light-adapted retina. Bar, 10 μm. (G) The r.s.d. of the pedicle (expressed as a percentage of the mean radius) in the dark and light. (H) The mean intensity of PKCα immunoreactivity in the pedicle relative to the cell body in the light and dark. (I) The mean intensity of phalloidin staining in the pedicle relative to the cell body in the light and dark. Results in G–I were obtained from at least 30 measurements in two or more retinae. Student's t tests indicate significant differences between light and dark conditions at the 0.1% confidence level.
The boundary of the depolarizing bipolar cell obtained from images of PKCα immunoreactivity was overlaid onto simultaneously taken images of phalloidin fluorescence, thus blacking-out F-actin stained in other retinal neurons. The mean intensities of PKCα and F-actin staining in the synaptic terminal were normalized to the values measured within the cell body of the same neuron (see text). All values are expressed as mean ± standard error of the mean.
Isolation and Stimulation of Depolarizing Bipolar Cells
Depolarizing bipolar cells were acutely dissociated from the retinae of goldfish by papain digestion, using methods described previously (Tachibana and Okada, 1991; Burrone and Lagnado, 1997). The standard Ringer's solution contained (mM): 120 NaCl, 2.5 CaCl2 (unless specified otherwise), 2.5 KCl, 1 MgCl2, 10 glucose, 10 Hepes, pH 7.3. Cells were plated onto coverslips in Ringer's solution containing 0.2 mM CaCl2 and 0.5 mg/ml BSA and used within 1–2 h. The coverslips contained a variety of retinal neurons. Note that these cells were not cultured. To mimic the electrical effect of light on depolarizing bipolar cells, they were depolarized using a Ringer's solution containing 50 mM KCl (prepared by iso-osmotic replacement of the NaCl with KCl) and 2.5 mM CaCl2. Solutions described in the text as 0 Ca2+ contained 1 mM EGTA and no added CaCl2.
Peptide Inhibitors of PKC and Pharmacological Agents
To assess the role of PKCα, two membrane-permeable peptide inhibitors of PKC were used: myristoylated epidermal growth factor receptor fragment (651–658) (myr-ψEGF-R) and myristoylated PKC inhibitor (19–27) (myr-ψPKC). The latter is the pseudosubstrate sequence from PKCα. The control for testing the effects of these substances was myristoylated protein kinase A inhibitor peptide (14–22) (myr-ψPKA). The use of these protein kinase inhibitors is described by Ward and O'Brian (1993) and Eicholtz et al. (1993). All peptides were obtained from Calbiochem (La Jolla, CA) and dissolved directly into Ringer's solution. Isolated bipolar cells were incubated in 10 μM myristoylated peptide for 45 min before an experiment.
Pharmacological agents were maintained as stocks in DMSO, and these stocks were diluted by at least 1,000-fold to achieve the final concentrations stated in the text. Nifedipine was obtained from Research Biochemicals, Inc. (Natick, MA). PMA, phorbol-12,13-dibutyrate (PDBu), 4-α-phorbol, and bisindolylmaleimide (bis) were all obtained from Calbiochem. Cytochalasin D and staurosporine were from Sigma.
Staining F-Actin in Isolated Cells
Coverslips onto which depolarizing bipolar cells had been plated were placed in ice-cold Ringer's solution containing 0.25% glutaraldehyde fixative (BDH) for 10 min. Cells were permeabilized with 0.5% Triton X-100 in cytoskeletal buffer for 2 min in the presence of 0.06% glutaraldehyde, then fixed with 0.25% glutaraldehyde for 10 min. After washing for 5 min, any remaining fixative was quenched with fresh sodium borohydride (0.5 mg/ml; Sigma) for 15 min on ice. Coverslips were then incubated in 10% normal goat serum (Vecta) for 15 min at room temperature before inversion onto 50 μl fluorophore-phalloidin (1 μM). Coverslips were left in a humid atmosphere at 4°C overnight and then washed and mounted on Vectashield.
Coverslips exposed to different test conditions were encoded by an independent member of the laboratory and imaging and quantitation of F-actin were performed blind. Fluorescence images were obtained with an MRC-1024 confocal microscope using an iris aperture of 2.0. Most coverslips contained 30–40 bipolar cells, so up to 35 cells were analyzed per coverslip in each experimental condition. To quantify the depth of the actin network, NIH Image 1.55 software was used to obtain a profile of intensity along a line drawn through the center of the synaptic pedicle, roughly orthogonal to the angle at which the axon was attached. These profile plots were then exported to Igor Pro 3.01 (Wavemetrics) and analyzed as described in the text (see Fig. 3 E).
Figure 3.
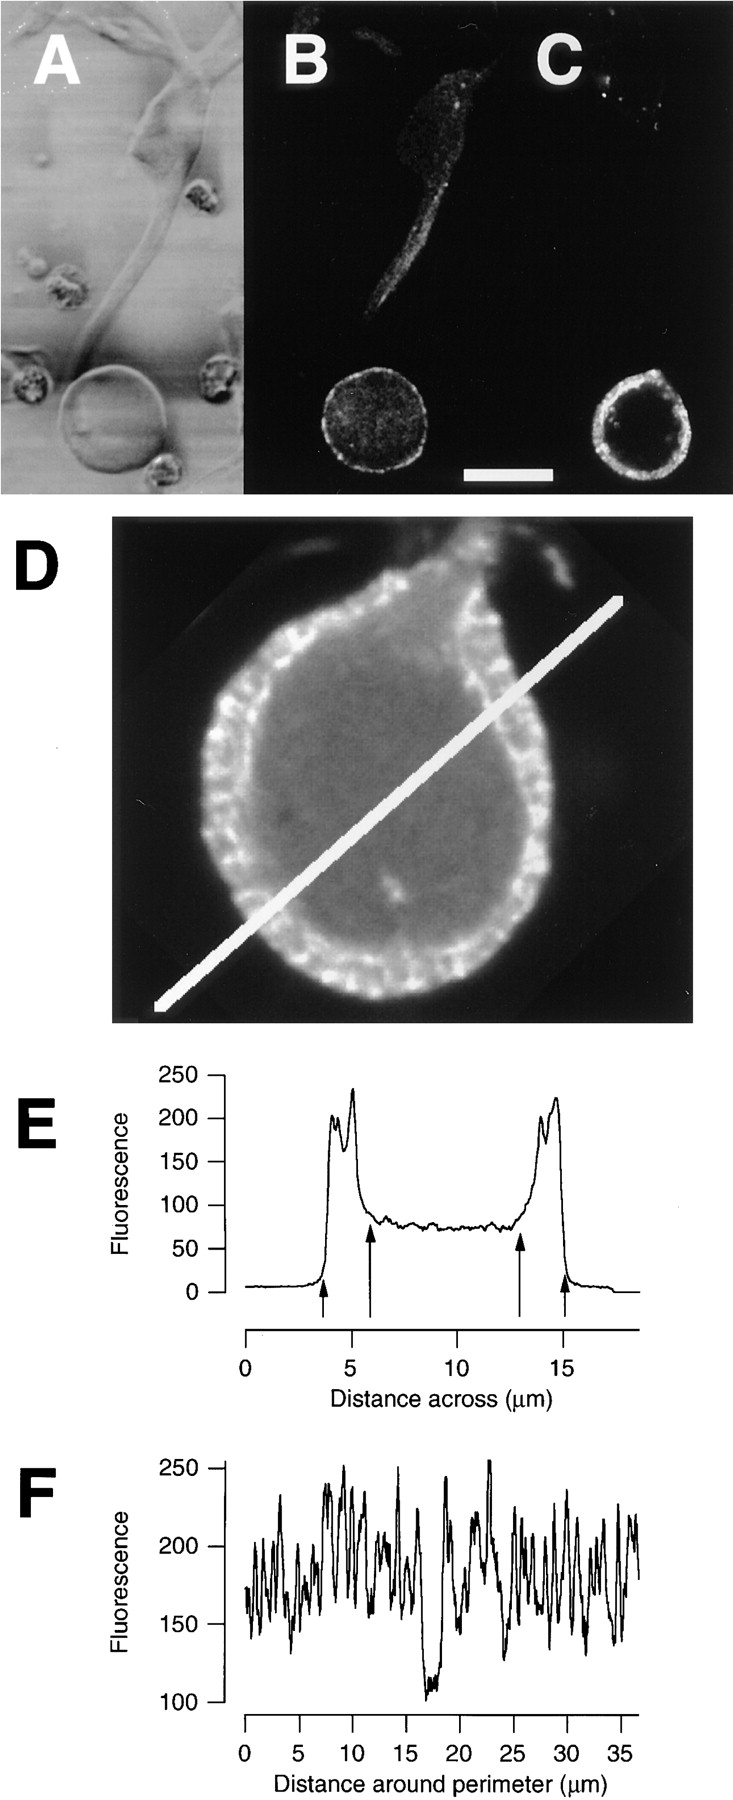
Depolarization stimulated the growth of an actin network in the synaptic pedicle of isolated bipolar cells. (A) DIC image of an isolated bipolar cell. (B) Fluorescence image of the same cell stained with phalloidin–Oregon green after incubation for 15 min in normal Ringer's solution. F-Actin was concentrated under the plasma membrane of the pedicle but not the cell body. (C) Fluorescence image of a cell stained with phalloidin–Oregon green after depolarization for 15 min in modified Ringer's solution containing 50 mM KCl. Note the growth of F-actin under the plasma membrane of the synaptic terminal. Bar, for A–C, 10 μm. (D) Confocal image of a synaptic pedicle stained with FITC-phalloidin after 20 min of depolarization in 50 mM KCl. Note the hotspots of F-actin at the plasma membrane and the sharp inner boundary of the network. (E) Intensity profile across the line shown in D. The depth of the F-actin network was estimated as the distances between the arrows (see text). (F) The intensity profile along a line drawn around the perimeter of the pedicle through the center of the network. The region containing significantly less F-actin corresponds to the area where the axon attaches to the pedicle. Note the relatively regular jumps in intensity indicating the existence of radially orientated actin filaments.
FM1-43 and Vesicle Cycling
Exocytosis and endocytosis in the synaptic terminal were assayed using the fluorescent membrane marker FM1-43 and a CCD camera, as described by Lagnado et al. (1996). The distribution of FM1-43 within terminals was observed with an MRC-600 confocal microscope with an argon laser mounted on a Nikon Optiphot upright microscope with a ×60 Nikon PlanApo oil objective (NA 1.4). Coverslips were mounted into a chamber with a fluid capacity of 100 μl. Confocal images of a single pedicle were taken at 10-s intervals over a period of several minutes while stimulating in a Ringer's solution containing 50 mM KCl, 2.5 mM CaCl2 in the presence of 10 μM FM1-43. In some experiments (see Fig. 8), the distribution of F-actin was measured in the same pedicle immediately after monitoring FM1-43 fluorescence. In these cases, ice-cold glutaraldehyde (0.25%) was washed onto the coverslip and transmission images were taken of the bipolar cell and surrounding retinal cells. The chamber was then transferred to ice for 10 min, the coverslip was carefully removed, and the cells were stained with fluorophore-phalloidin as described above. The bipolar cell in which FM1-43 fluorescence had been monitored before fixation was then identified using surrounding retinal cells as landmarks.
Figure 8.
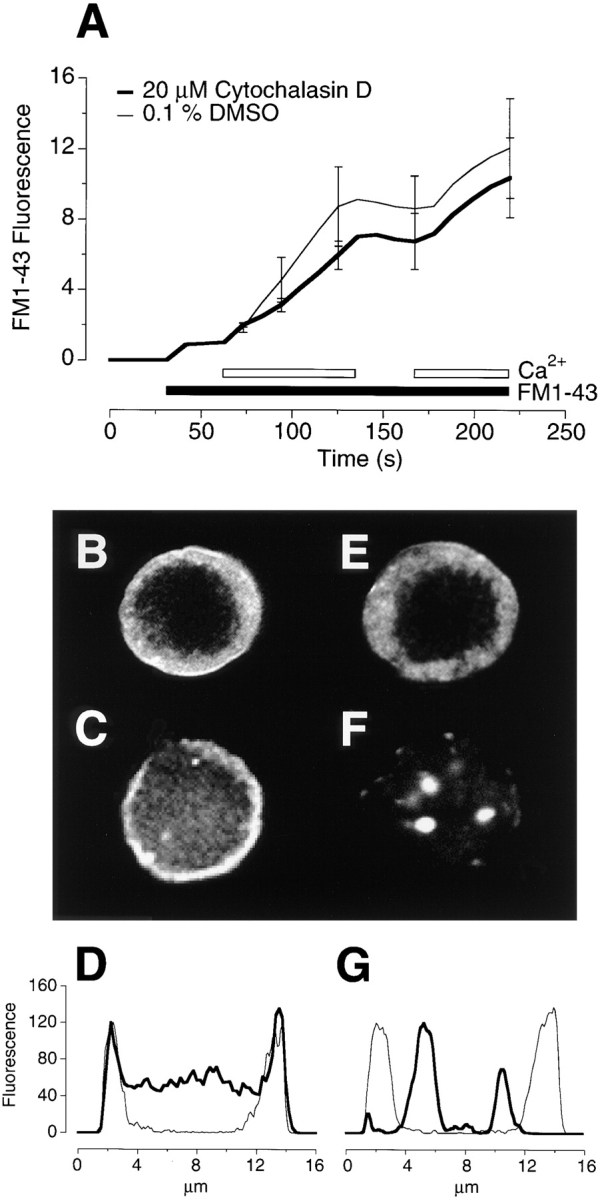
Disruption of the F-actin network did not alter the spatial distribution of recycled vesicles. (A) The time course of exocytosis measured from the increase in FM1-43 fluorescence. Experiments were carried out as in Fig. 7, except that a confocal microscope rather than a camera was used to image FM1-43 fluorescence. Each trace is the average of four experiments on different cells. (B) The distribution of FM1-43–labeled vesicles after 220 s in a control terminal. (C) The distribution of F-actin labeled with FITC-phalloidin in the same terminal as in B. (D) A plot of the intensity profile across the terminal in B and C. The thin line plots the FM1-43 fluorescence and the thick line plots phalloidin fluorescence. (E) The distribution of FM1-43–labeled vesicles after 220 s depolarization in a terminal treated with 20 μM cytochalasin D. (F) The distribution of F-actin labeled with FITC-phalloidin in the same terminal as in E. (G) A plot of the intensity profile across the terminal in E and F. Note that recycled vesicles labeled with FM1-43 remain concentrated in the periphery when the distribution of F-actin is completely disrupted.
Results
Light-dependent Changes in the Morphology of the Bipolar Cell Synaptic Terminal Were Correlated with an Increase in F-Actin
When the retina was exposed to light, the synaptic terminal of depolarizing bipolar cells changed shape (Yazulla and Studholme, 1992; Behrens and Wagner, 1996). An example of this behavior is illustrated in Fig. 1, which shows fluorescence images of transverse sections of retinae from goldfish. Sections were stained with an antibody to PKCα, since immunoreactivity to this isoform of PKC acts as a specific marker for depolarizing bipolar cells in the retinae of a variety of species (Suzuki and Keneko, 1991). Fig. 1 A shows a fluorescence image of a section from a dark-adapted retina, and Fig. 1 C is from a light-adapted retina. FITC-labeled bipolar cells extend from the outer plexiform layer (OPL; where their dendrites are entwined with the processes of horizontal cells), across the inner nuclear layer (INL; where their cell bodies lie) to the inner plexiform layer (IPL; where their axons end in a synaptic pedicle that contacts ganglion cells and amacrine cells). An outstanding feature of these neurons is the large size of their synaptic pedicles (10–14 μm in diameter; Tachibana and Okada, 1991).
In dark-adapted retinae, the synaptic pedicles were irregularly shaped (Fig. 1 B, arrowheads) and displayed a number of thin projections (Fig. 1 B, thin arrows), but adaptation to light caused the synaptic pedicle to become more rounded with smooth contours (Fig. 1, C and D). Behrens and Wagner (1996) and Yazulla and Studholme (1992) also observed these changes, describing the terminals in the dark as ameboid with finger-like extensions or spinules. To quantify changes in the shape of the pedicle, the limits of PKCα immunoreactivity were defined by thresholding the image of FITC fluorescence, that is, by setting to zero all pixels with intensities below a certain value (see Materials and Methods). PKCα immunoreactivity fills depolarizing bipolar cells (Yazulla and Studholme, 1992; Behrens and Wagner, 1996) and the intensity of PKC staining in our experiments was sufficient to obtain a continuous contour of the terminal and cell body (Fig. 1, A and B). It was rarely possible to obtain a continuous boundary of the axon from one confocal section, so this part of the cell was neglected. Examples of the cell boundaries defined in this way are shown in Fig. 2 B for a dark-adapted retina, and Fig. 2 E for a light-adapted retina. Changes in terminal morphology were assessed by measuring percent r.s.d., which is the standard deviation of the distance from the centroid of the terminal to its boundary (expressed as a percentage of the mean radius). This simple measure of shape does not differentiate between the formation of spinules and grosser changes in morphology, but takes both into account because they occur simultaneously (Yazulla and Studholme, 1992; Behrens and Wagner, 1996). In dark-adapted retinae, the r.s.d. of the pedicle was 33.3 ± 1.6%, reflecting its irregular, convoluted shape. In light-adapted retinae, the r.s.d. fell to 18.6 ± 1.0% as pedicles became more rounded and processes retracted (Fig. 2 G).
Given that PKC regulates actin dynamics (Rösner et al., 1995; Prekeris et al., 1996; He et al., 1997) and the actin cytoskeleton plays a key role in regulating synapse morphology (Ter-Margarian and Djamgoz, 1992; Weiler and Janssen-Bienhold, 1993; Fischer et al., 1998), we investigated whether changes in the actin cytoskeleton also occurred in response to light. Retinal sections were simultaneously stained with TRITC-labeled phalloidin to measure the distribution of F-actin (Fig. 2, A and D). Cell boundaries obtained from images of PKCα immunoreactivity were mapped to images of TRITC-phalloidin staining, as shown in Fig. 2, C and F. In both light- and dark-adapted retinae, the intensity of F-actin staining in the cell body of depolarizing bipolar cells was not significantly different to that measured in neighboring hyperpolarizing bipolar cells, indicating that light did not affect F-actin in the cell body. However, light did affect the amount of F-actin in the synaptic terminal. In dark-adapted retinae, the intensity of F-actin staining was 1.6 ± 0.1 times greater in the pedicle than the cell body, whereas in light-adapted retinae the ratio increased to 2.1 ± 0.1 (Fig. 2 I). Therefore, the more regular shape of the synaptic terminal in the light was correlated with the growth of actin filaments in this part of the cell.
Fig. 1 shows that adaptation to light was also accompanied by a change in the distribution of PKCα within the cell. In light-adapted retinae, the intensity of PKCα staining was 2.6 ± 0.2 times greater in the pedicle than the cell body, whereas in dark-adapted retinae the ratio was 18.2 ± 3.9 (Fig. 2 H). It seems unlikely that transport of PKCα will alter the actions of this enzyme in the synaptic terminal because there was significantly more PKCα in the terminal than in the cell body in both the dark (Fig. 2 B) and light (Fig. 2 E). Therefore, it seems that PKCα is always available to respond to signals that are localized to the synapse. The translocation of PKCα towards the cell body during exposure to light may be caused by the Ca2+-dependent binding of the enzyme to membranes (Mosior and Epand, 1997). When depolarizing bipolar cells respond to light, there is an influx of Ca2+ into the dendrites which leads to the activation of PKC and initiates light adaptation (Shiells and Falk, 1998).
Growth of F-Actin in the Synaptic Terminal of Isolated Bipolar Cells in Response to Maintained Depolarization
To investigate changes in the organization of the actin cytoskeleton under defined conditions, bipolar cells were isolated from the retina by enzymatic digestion (see Materials and Methods) and then fixed and stained with fluorophore-phalloidin. Fig. 3 A shows a DIC image of one such cell at rest. The synaptic terminals of isolated neurons were always circular and did not show any obvious changes in morphology in response to depolarization. Fig. 3 B shows a fluorescence image of the same cell stained with FITC-phalloidin. More F-actin was present in the pedicle than the cell body, as was the case for cells within the dark-adapted retina (Fig. 2, C and I).
Depolarizing bipolar cells do not fire action potentials, but instead respond to light with maintained depolarizations (Dowling, 1987). We tested whether the electrical effect of light was sufficient to stimulate growth of F-actin by depolarizing isolated cells with 50 mM KCl for 15 min. Fig. 3 C shows that this stimulus caused the F-actin network in the pedicle to become thicker, extending ∼2 μm from the plasma membrane. In the cell body, there was no tendency for actin filaments to form close to the plasma membrane (Fig. 3 C). Therefore, the effect of directly depolarizing isolated bipolar cells was qualitatively similar to the effect of light on cells in the retina (Fig. 2, F and I): in both cases there was a growth of actin filaments in the synaptic pedicle. Isolated bipolar cells therefore provided us with a relatively simple preparation in which to investigate the processes regulating the actin cytoskeleton in the synaptic pedicle.
The structure of the actin network stimulated by depolarization is shown in more detail in Fig. 3 D. There were a large number of hotspots at the plasma membrane and the inner boundary of the actin network was sharply demarcated from the center of the pedicle. There was no growth of F-actin in the region where the axon joins the pedicle. Fig. 3 E plots the intensity profile across the bold white line marked in Fig. 3 D. F-Actin was particularly concentrated in two zones: the plasma membrane and a boundary region ∼2 μm further in. Such profile plots allowed us to quantify changes in the organization of F-actin by measuring the depth of the actin network under the plasma membrane. The width of the two peaks representing F-actin at either side of the pedicle was measured as follows. First, the outer limit of a peak was defined as the point at which the intensity of phalloidin staining was two standard deviations greater than the background. Next, the inner limit of the peak was defined as the point at which the intensity was two standard deviations greater than the mean intensity in the central region of the pedicle. The distance between these two points (Fig. 3 E, arrows) was taken as the depth of the actin network.
Fig. 3 F plots the intensity of phalloidin staining around the periphery of the pedicle, ∼1 μm from the plasma membrane. The repetitive discrete jumps in fluorescence intensity indicate that radially orientated filaments were arranged at relatively regular intervals around the plasma membrane. Therefore, it appears that there was a large number of specialized sites on the plasma membrane to which the actin network attached.
The Time Scale of F-Actin Growth and Breakdown
To understand the possible role of changes in the actin cytoskeleton, it is important to know the time scale on which they occur. Fig. 4 A shows histograms of the depth of the F-actin network at three time points during continuous depolarization. Initially, the mean depth was 0.8 ± 0.1 μm, increasing to a maximum of 2.1 ± 0.1 μm with a time constant of 3.5 min (Fig. 4 B). Depolarization therefore caused actin filaments to grow inwards from the plasma membrane. In the retina, light-dependent changes in synapse morphology also occur over time scales of minutes. For example, spinule protrusion from horizontal cells into the synaptic pedicle of photoreceptors is maximal 40 min after exposure to light lasting just 1 min (Weiler and Wagner, 1984).
Figure 4.

The time course of growth and breakdown of the actin network. Bipolar cells were stimulated with Ringer's solution containing 50 mM KCl for various times, fixed and stained with fluorophore-phalloidin. The depth of the actin network was measured from profile plots of confocal images, as shown in Fig. 3. (A) Histograms of the depth of the actin network observed at rest (top), after 5 min of stimulation (middle), and 30 min of stimulation (bottom). Measurements from three experiments were pooled. (B) The mean depth of the actin network was plotted as a function of the duration of the depolarization. Each point was obtained from at least 90 measurements. The line drawn through the points is an exponential with a time constant of 3.5 min. (C) Bipolar cells were depolarized for 15 min in Ringer's solution containing 50 mM KCl with 2.5 mM Ca2+ and then transferred to a Ringer's solution containing 50 mM KCl with 0 Ca2+/1 mM EGTA for the times shown. The histograms show measurements of the depth of the actin network immediately after stimulation (top) and after 10 min (middle) and 30 min (bottom) in 0 Ca2+. (D) The mean depth of the actin network plotted as a function of time after removal of Ca2+. The solid line through the points is an exponential that approaches the dashed line (the mean depth of the actin network under resting conditions) with a time constant of 35 min.
The actin network within the synaptic pedicle was not stable after Ca2+ was removed from the external medium. Fig. 4, C and D, shows the results of experiments where, after 15 min of depolarization in the presence of 50 mM K+ and 2.5 mM Ca2+, Ca2+ was removed for various times before fixation and staining with fluorophore-phalloidin. Initially, the average depth of the actin network was 2.0 ± 0.1 μm, but after 30 min in 0 Ca2+ the depth was 1.4 ± 0.1 μm. Comparison of Fig. 4 D with Fig. 4 B shows that the rate of breakdown of the F-actin network was considerably slower than the rate of growth.
Growth of the Actin Network Required Ca2+ Influx
When bipolar cells depolarize in response to light, voltage-sensitive Ca2+ channels open to stimulate the exocytosis of small glutamate-containing vesicles (Tachibana and Okada, 1991). The only class of voltage-gated Ca2+ channel in bipolar cells are the L-type, and they are localized to the synaptic pedicle (Tachibana et al., 1993a ,b). Therefore, we tested whether Ca2+ influx might be the signal that triggered localized growth of actin filaments. The growth of F-actin caused by depolarization in 50 mM KCl was blocked by removing the 2.5 mM Ca2+ normally present in the solution, or by introducing nifedipine, an inhibitor of L-type Ca2+ channels (Fig. 5). In both cases, the distribution of F-actin resembled that seen in unstimulated cells (not shown), and the depth of the F-actin network was similar (∼0.8 μm). Therefore, depolarization-induced growth of the actin network was dependent on Ca2+ influx through L-type Ca2+ channels.
Figure 5.

Growth of the F-actin network in response to depolarization required Ca2+ influx. The bar chart plots the mean depth of the actin network in the synaptic pedicle of bipolar cells depolarized for 15 min in Ringer's solution containing 50 mM KCl with 2.5 mM Ca2+ and either 0.1% DMSO vehicle, 30 μM nifedipine, or 100 μM nifedipine. Also shown is the depth of the F-actin network after depolarization in a solution containing 0 Ca2+/1 mM EGTA. Removing external Ca2+ or blocking L-type Ca2+ channels prevented growth of the F-actin network.
PKC Stimulated Growth of the Actin Network
PKC is involved in regulating cell morphology by actions on the organization of submembranous actin (Hartwig et al., 1992; Rösner et al., 1995; Prekeris et al., 1996; He et al., 1997). Given that the Ca2+-dependent α isoform of PKC is present in the synaptic terminal (Figs. 1 and 2), we investigated the role that this enzyme might play in stimulating growth of F-actin in response to Ca2+ influx. Bipolar cells were depolarized in 50 mM KCl for 5 min in the presence of two phorbol esters known to activate PKC: PMA (100 nM) and PDBu (10 nM). In each case there was a significant increase in the depth of the F-actin network relative to controls in which cells were treated with 4α-phorbol (a phorbol ester which does not activate PKC) or DMSO (Fig. 6 A). After 15 min of depolarization, the depth of the F-actin network reached a maximum (Fig. 4 B), but phorbol esters did not increase this maximum (Fig. 6 B). These results indicate that activation of PKC accelerated growth of the F-actin network caused by Ca2+ influx.
Figure 6.
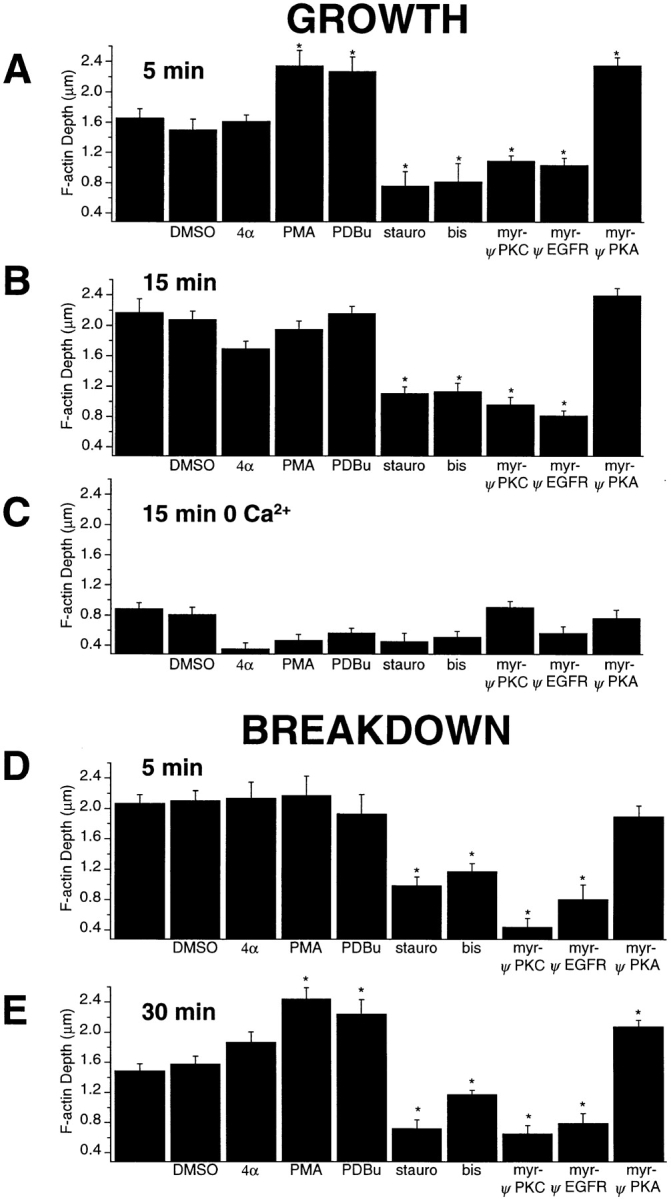
Activators and inhibitors of PKC affected growth and breakdown of the actin network in the synaptic pedicle. Bipolar cells were depolarized for 5 min in 50 mM KCl and 2.5 mM Ca2+ in the presence of the following substances: 0.1% DMSO, 100 nM 4α-phorbol (4α), 100 nM PMA, 10 nM PDBu, 1 μM staurosporine (stauro), 500 nM bis, 10 μM myr-ψEGF-R, 10 μM myr-ψPKC, and 10 μM myr-ψPKA. The bar charts plot the mean depth of the actin network in each condition. A–C show effects on growth of the actin network, and D and E show effects on breakdown. Asterisks mark test conditions in which there was a difference in the depth of the actin network compared with control conditions. (A) Effects on growth observed after 5 min of depolarization in the presence of 2.5 mM Ca2+. (B) Effects on growth observed after 15 min of depolarization in the presence of 2.5 mM Ca2+, when, under control conditions, the actin network reached maximal depth (Fig. 4). (C) Effects on growth observed after 15 min of depolarization in the presence of 0 Ca2+/1 mM EGTA, when there is normally no growth of the actin network (Fig. 5). (D and E) The bar charts plot the mean depth of the F-actin network in cells depolarized for 15 min in the presence of 2.5 mM Ca2+, then transferred to 0 Ca2+/1 mM EGTA for 5 min (D) and 30 min (E). Note that pharmacological agents were only applied during the period in 0 Ca2+.
Further evidence for the involvement of PKC was provided by the use of inhibitors, including staurosporine (1 μM), bis (500 nM), and two myristoylated peptides that are membrane permeable: myr-ψEGF-R and myr-ψPKC. Both these peptides acts as pseudosubstrate inhibitors (Eichholtz et al., 1993; Ward and O'Brian, 1993). The control for testing the effects of the peptides was myr-ψPKA. All these PKC inhibitors significantly reduced the depth of the F-actin network measured after 5 min (Fig. 6 A) or 15 min (Fig. 6 B) of depolarization in 50 mM K+.
PMA and PDBu are thought to activate PKC in a Ca2+-independent manner (Mosior and Newton, 1996). However, PMA and PDBu did not promote growth of an actin network during 15 min of depolarization in 0 Ca2+ (Fig. 6 C), indicating that Ca2+ influx was essential to initiate growth of actin filaments.
Agents that modify the activity of PKC also affected breakdown of the actin network (Fig. 6, D and E). Bipolar cells were first depolarized for 15 min in the presence of 50 mM K+ and 2.5 mM Ca2+, and then transferred to a solution containing 0 Ca2+ together with an activator or inhibitor of PKC. The four inhibitors of PKC all accelerated the breakdown of the F-actin network observed after 5 min (Fig. 6 D) and 30 min (Fig. 6 E) in 0 Ca2+. Activators of PKC, PMA and PDBu, reduced breakdown of the F-actin network observed after 30 min (Fig. 6 E).
Taken together, the results in Fig. 6 could be explained if actin polymerization was stimulated by the synergistic action of Ca2+ and PKC. This would be expected if the actin cytoskeleton were regulated by the conventional (i.e., Ca2+-dependent) α isoform of PKC that is present in the synaptic terminal (Figs. 1 and 2). The other conventional isoforms of PKC, βI, βII, and γ (Tanaka and Nishizuka, 1994), are not present in depolarizing bipolar cells (Suzuki and Kaneko, 1991; Usuda et al., 1991; Osborne et al., 1992). The observation that phorbol esters did not stimulate growth of F-actin in the absence of Ca2+ (Fig. 6 C) suggests that a novel (i.e., Ca2+-independent) isoform of PKC was not involved in mediating this action. Indeed, most of the novel or atypical isoforms of PKC do not appear to be present in depolarizing bipolar cells (Koistinaho and Sagar, 1994; Osborne et al., 1994; McCord et al., 1996), with the possible exception of the ζ isoform, which has been detected in depolarizing bipolar cells of the rabbit retina (Koistinaho and Sagar, 1994).
Disruption of the Actin Network Did Not Affect Continuous Vesicle Cycling
When the retina is exposed to light, depolarizing bipolar cells respond as long as the stimulus remains (Dowling, 1987). Maintained depolarization stimulates a continuous and balanced cycle of exocytosis and endocytosis that can be monitored by using the fluorescent dye FM1-43 to label synaptic vesicles (Lagnado et al., 1996). The time scale over which continuous vesicle cycling can be stimulated is similar to that over which depolarization stimulated growth of the actin network (Fig. 4). Several studies have suggested that the actin cytoskeleton might be involved in regulating the exocytosis (Bernstein and Bamburg, 1989; Mochida et al., 1994; Pieribone et al., 1995; Prekeris et al., 1996; Wang et al., 1996; Bernstein et al., 1998) and endocytosis (Heuser, 1989; Mundigl et al., 1998) of small synaptic vesicles. To test whether changes in the organization of F-actin in the synaptic terminal might alter vesicle cycling we disrupted the actin network using cytochalasin D.
Fig. 7 A shows the depth of the F-actin network after 2 min of depolarization under control conditions (0.1% DMSO) and in the presence of various concentrations of cytochalasin D (in which the cells were preincubated for 10 min). 2 μM cytochalasin D blocked the depolarization-induced growth of F-actin, and 20 μM completely disrupted the submembranous layer of F-actin that was normally present at rest.
Figure 7.

Cytochalasin D disrupted the actin network but did not affect continuous vesicle cycling. (A) The depth of the F-actin network after 2 min of depolarization under control conditions (0.1% DMSO) and in the presence of various concentrations of cytochalasin D (in which the cells were preincubated for 10 min). Representative images of phalloidin staining are shown above the corresponding bars. 2 μM cytochalasin D was sufficient to completely block growth of F-actin under the plasma membrane. The dashed line shows the mean depth of the actin network under resting conditions. Bar, 10 μm. (B) The time course of exocytosis measured with FM1-43. The graph plots the total FM1-43 fluorescence of the synaptic terminal (after subtraction of the background) under control conditions (0.1% DMSO, thin line) and in the presence of 20 μM cytochalasin D (thick line). Cells were continuously depolarized in 50 mM KCl. The filled bar shows addition of 10 μM FM1-43 and the open bar shows addition of 2.5 mM Ca2+. The rate of fluorescence increase on adding 2.5 mM Ca2+ was equivalent to 2.6 ± 0.8% s−1 of the plasma membrane area in cytochalasin D–treated pedicles and 2.3 ± 0.2% s−1 for controls. Each trace is the average of three experiments on different cells, and the bars show standard errors of the mean for two time points. All results were normalized to the resting fluorescence of the plasma membrane, which is plotted as a value of one.
Fig. 7 B shows the time course of FM1-43 staining in the synaptic pedicle of an isolated cell during a period of continuous depolarization in 50 mM K+. Fluorescence was measured with a CCD camera (see Materials and Methods). At the start of the experiment, the cell was maintained in 0 Ca2+, so that on addition of FM1-43 (filled bar) only the plasma membrane was stained, causing a rapid initial increase in fluorescence (see Lagnado et al., 1996). When 2.5 mM Ca2+ was added to the external medium to allow Ca2+ influx (open bar), there was an immediate increase in fluorescence in the terminal, representing the staining of vesicular membrane that made contact with the external medium by exocytosis. Continuous exocytosis could be reversibly blocked by removal of Ca2+. In three experiments, the initial rate of exocytosis was equivalent to 2.3 ± 0.2% of the initial membrane surface area per second, or ∼2,100 vesicles s−1 (see Lagnado et al., 1996). Fig. 7 B shows that simultaneous exposure to 20 μM cytochalasin D (after a 10-min preincubation) did not significantly affect the continuous vesicle cycle, although this treatment was sufficient to almost completely disrupt submembranous actin filaments (Fig. 7 A). The initial rate of exocytosis in 20 μM cytochalasin D was equivalent to 2.6 ± 0.8% of the membrane surface area per second, or 2,400 vesicles s−1. As would be expected, 2 μM cytochalasin D also had no effect on the continuous vesicle cycle.
Fig. 7 B also demonstrates that cytochalasin D did not significantly affect endocytosis. The removal of both FM1-43 and Ca2+ toward the end of the experiment caused the plasma membrane to rapidly destain, leaving the fluorescence associated with FM1-43 trapped within internalized vesicles (see Lagnado et al., 1996). The Ca2+-stimulated increase in fluorescence was retained within the pedicle under both control conditions and in the presence of 20 μM cytochalasin D, indicating that exocytosis and endocytosis remained balanced after disruption of F-actin. The continuation of endocytosis after disruption of the actin network could also be simply observed from confocal images demonstrating that the dye, which is membrane impermeant, was transported into the terminal (see Fig. 8, B and E, described below). Thus, endocytosis in the bipolar cell terminal does not involve actin filaments.
Disruption of the F-Actin Network Did Not Affect the Spatial Distribution of Recycled Vesicles
Lagnado et al. (1996) have shown that vesicles involved in the continuous vesicle cycle are distributed in an area extending ∼2 μm from the plasma membrane of the synaptic terminal. Strikingly, the actin network stimulated by depolarization occurred in the same region (Fig. 3). Several studies have suggested that small synaptic vesicles can associate with actin filaments (Hirokawa et al., 1989; Mochida et al., 1994; Li et al., 1995; Pieribone et al., 1995; Rosahl et al., 1995; Chieregatti et al., 1996; Wang et al., 1996), so we tested whether the distribution of vesicles might depend on the distribution of F-actin within the terminal.
FM1-43 fluorescence was imaged with a confocal microscope during depolarization, and the bipolar cells then rapidly fixed at 4°C and stained with FITC-phalloidin. Fig. 8 A shows the time course of the increase in FM1-43 fluorescence in the synaptic terminal under normal conditions (fine line, average of four cells) and in the presence of 20 μM cytochalasin D (bold line, four cells). The experimental protocol and the behavior of FM1-43–labeled vesicles was similar to that shown in Fig. 7 B. Fig. 8 B shows the distribution of FM1-43 fluorescence measured in a control cell at the end of the stimulation period, and Fig. 8 C shows the distribution of F-actin measured in the same cell after fixation. The two distributions are compared in the profile plot in Fig. 8 D. The peripheral region of particularly intense phalloidin staining (bold line) coincided with the area in which vesicles were labeled with FM1-43 (fine line). Similar behavior was observed in all four cells investigated in this way. Fig. 8, E–G, compares this behavior with that observed in a cell treated with 20 μM cytochalasin D. The submembranous localization of F-actin was completely disrupted (Fig. 8, F and G), but recycled vesicles were still localized to the peripheral region of the pedicle. Similar results were observed in three other cells treated with 20 μM cytochalasin D, as well as cells treated with lower concentrations.
The results in Figs. 7 and 8 indicate that the actin network in the synaptic terminal was not involved in regulating the cycling of vesicles since neither exocytosis, nor endocytosis, nor vesicle localization was significantly affected by disrupting actin filaments with cytochalasin D.
Discussion
Depolarizing bipolar cells generate maintained depolarizations in response to steady light (Dowling, 1987), accompanied by the retraction of spinules in the synaptic terminal (Yazulla and Studholme, 1992; Behrens and Wagner, 1996). In this paper we have demonstrated that this form of synaptic plasticity is correlated with the growth of actin filaments in the synaptic pedicle (Figs. 1 and 2), and then, using cells removed from the influences of the retinal circuit, we have characterized some of the factors controlling the growth and breakdown of F-actin actin (Figs. 3–6). Ca2+ influx during depolarization was sufficient to stimulate growth of an actin network under the plasma membrane of the synaptic pedicle and this effect required the activation of PKC. By monitoring vesicle cycling with FM1-43, we found that disruption of the actin cytoskeleton with cytochalasin D did not affect exocytosis, endocytosis, or the distribution of recycled vesicles within the terminal (Figs. 7 and 8). We suggest that activity-dependent growth of actin filaments normally regulates the structure of the synaptic terminal rather than the cycling of small vesicles.
Structural Plasticity of Synapses in the Retina
Three examples of changes in synaptic morphology have been described in the retina. In the light, horizontal cells project spinules into the synaptic pedicle of cone photoreceptors (Raynauld et al., 1979; Wagner, 1980; Wagner and Djamgoz, 1993), and hyperpolarizing bipolar cells project spinules into the synaptic processes of amacrine cells (Behrens and Wagner, 1996). In contrast, light causes retraction of processes from the synaptic pedicle of depolarizing bipolar cells (Yazulla and Studholme, 1992; Behrens and Wagner, 1996; Figs. 1–3). The common feature of all these three responses is that spinules are formed when the cell is hyperpolarized and Ca2+ influx is blocked, and then retracted when the cell is depolarized and Ca2+ channels open. Ca2+-triggered polymerization of actin in the synaptic terminal of depolarizing bipolar cells may cause the retraction of processes by constraining the synaptic pedicle to take on a regular and rounded shape (Figs. 1 and 2).
The synaptic terminals of depolarizing bipolar cells receive inhibitory (GABAergic) feedback connections from amacrine cells (Dowling, 1987). The fine spinules elaborated by depolarizing bipolar cells in the dark project into the active zones of amacrine cells, and so are thought to enhance the efficiency of these connections (Yazulla and Studholme, 1992; Behrens and Wagner, 1996). The extension of spinules into presynaptic membranes is also thought to strengthen synaptic connections in other neural circuits (Lisman and Harris, 1993; Wagner and Djamgoz, 1993; Harris and Kater, 1994; Edwards, 1998). After the induction of long-term potentiation in the hippocampus, there is an increase in the number of spinules extending from dendritic spines (Edwards, 1995). Similarly, after sensitization in Aplysia, synaptic vesicles at presynaptic membranes cluster about spinules extended from the postsynaptic site (Bailey and Thompson, 1979). The role of the actin cytoskeleton during these structural changes is still not clear, although actin filaments in the dendritic spines of cultured hippocampal neurons are thought to underlie rapid changes in spine morphology (Fischer et al., 1998).
Actions of Ca2+ and PKC on F-Actin
The growth of actin filaments stimulated by Ca2+ influx in the synaptic terminal of depolarizing bipolar cells contrasts strikingly with the breakdown of F-actin stimulated by Ca2+ influx in rat brain synaptosomes (Bernstein and Bamburg, 1989), chromaffin cells (Burgoyne et al., 1989; Vitalé et al., 1995), and other nonneuronal secretory cells (Koffer et al., 1990; Muallem et al., 1995). Electrical stimulation of developing growth cones also leads to a Ca2+-dependent breakdown of actin filaments and collapse of filopodia (Lu et al., 1997). Therefore, the action of Ca2+ on the organization of F-actin at developing synapses is quite distinct from its action in the mature synapse of bipolar cells.
The stimulation of F-actin growth by Ca2+ influx probably occurred through the activation of a Ca2+-dependent isoform of PKC (Fig. 6, A and B). The synaptic terminal of depolarizing bipolar cells contains the α isoform of PKC (Figs. 1 and 2), but none of the other conventional (Ca2+-dependent) isoforms (Suzuki and Kaneko, 1991; Usuda et al., 1991; Osborne et al., 1992). It seems unlikely that any of the novel isoforms of PKC were involved in regulating the actin cytoskeleton, since phorbol esters had no effect in the absence of Ca2+ influx (Fig. 6 C), although they activate novel isoforms of PKC independently of Ca2+ (Mosior and Newton, 1996). The novel or atypical isoforms of PKC do not appear to be present in depolarizing bipolar cells (Koistinaho and Sagar, 1994; Osborne et al., 1994; McCord et al., 1996).
PKC may have different actions on the actin cytoskeleton, depending on the substrates it acts through. For instance, activation of PKC with phorbol esters causes breakdown of cortical F-actin in chromaffin cells (Burgoyne et al., 1989; Vitalé et al., 1995), but growth of the actin network in growth cones of neuroblastoma cells (Rösner et al., 1995). One possible target of PKC in chromaffin cells might be myristylated alanine-rich C kinase substrate (MARCKS), which loses its ability to cross-link actin filaments when phosphorylated by PKC (Hartwig et al., 1992). Growth cones are particularly enriched in the protein GAP-43, which can be phosphorylated by PKC leading to the stabilization of actin filaments (He et al., 1997). The target of PKC in the synaptic terminal of depolarizing bipolar cells may be different, because it has not been possible to detect GAP-43 in these neurons (Kapfhammer et al., 1997).
Actin and Vesicle Cycling
Bipolar cells possess electron-dense structures called ribbons or dense bodies at synaptic release sites. As in photoreceptors and hair cells, small vesicles attach to ribbons by short filaments (Eccles, 1964; Usukura and Yamada, 1987). Although we observed actin hotspots on the plasma membrane (Figs. 4 and 5), it seems unlikely that these are associated with ribbons. Ribbons cannot be labeled by antibodies to actin (Schmitz and Kohler, 1993) and are unaffected by cytochalasins (Peschke et al., 1996). Further, there are ∼45–65 ribbons in the terminal of bipolar cells (von Gersdorff et al., 1996), but initial estimates indicate that there are considerably more sites of F-actin association on the plasma membrane. For instance, the single confocal section in Fig. 3 D contains ∼40 actin hotspots.
It has been suggested that the actin cytoskeleton may regulate secretion. Disassembly of submembranous actin in response to stimulation has been reported to enable exocytosis from synaptosomes (Bernstein and Bamburg, 1989), chromaffin cells (Burgoyne et al., 1989; Vitalé et al., 1995), mast cells (Koffer et al., 1990), and pancreatic acini (Muallem et al., 1995). Submembranous actin appears to act as a barrier to the exocytosis of large dense-core granules in these cells. Less is known about how the actin cytoskeleton might regulate the cycling of small vesicles at synapses. Our results demonstrate that the actin network in the terminal of depolarizing bipolar cells does not affect the continuous component of exocytosis that is stimulated during maintained depolarization (Fig. 7). Wang et al. (1996) tested the effects of disrupting F-actin at the developing neuromuscular junction using cytochalasin D, and also found that F-actin did not affect exocytosis.
When bipolar cells are depolarized, release sites on the plasma membrane are refilled from a pool of vesicles localized to a region extending 2 μM from the plasma membrane (Lagnado et al., 1996). Strikingly, the actin network that grew during depolarization colocalized with this pool of vesicles. It has been suggested that vesicle clustering is controlled by synapsin, a protein on the membrane of synaptic vesicles that is thought to tether them to actin filaments (Hirokawa et al., 1989; Greengard et al., 1993; Li et al., 1995; Chieregatti et al., 1996). However, when we disrupted F-actin with cytochalasin D, vesicles remained in the periphery of the terminal (Figs. 3 and 8). The fact that F-actin did not affect the localization of vesicles in bipolar cell terminals may be related to the observation that this is one of the few neurons that does not contain any known isoforms of synapsin (Mandell et al., 1990; Koontz and Hendrickson, 1993). However, Betz and Henkel (1994) found that cytochalasin D did not affect the localization of vesicles at the mature neuromuscular junction, which is rich in synapsin I. Furthermore, mice in which the synapsin I gene has been knocked out have correctly clustered synaptic vesicles (Rosahl et al., 1995).
The idea that actin might be involved in endocytosis at the synapse is more speculative (Heuser, 1989), although actin is involved in receptor-mediated endocytosis in yeast (Geli and Riezman, 1996) and mammalian cells (Lamaze et al., 1997). Mundigl et al. (1998) have shown that ampiphysin I and dynamin I, two proteins involved in endocytosis at the synapse, colocalize with patches of F-actin at the growth-cone of hippocampal neurons, but have not been able to detect any direct interaction with actin. The depolarizing bipolar cell is one of the few neurons in which it has been possible to monitor the recycling of small vesicles directly (von Gersdorff and Matthews, 1994; Lagnado et al., 1996) and our results indicate clearly that F-actin is not involved.
Abbreviations used in this paper
- bis
bisindolylmaleimide
- myr-ψEGF-R
myristoylated epidermal growth factor receptor fragment (651–658)
- myr-ψPKA
myristoylated protein kinase A inhibitor (14–22)
- myr-ψPKC
myristoylated protein kinase C inhibitor (19–27)
- PDBu
phorbol-12,13-dibutyrate
- PKC
protein kinase C
- r.s.d.
radial standard deviation
References
- Bailey CH, Thompson EB. Indented synapses in Aplysia. . Brain Res. 1979;173:13–20. doi: 10.1016/0006-8993(79)91091-6. [DOI] [PubMed] [Google Scholar]
- Behrens UD, Wagner HJ. Adaptation-dependent changes of bipolar cell terminals in fish retina: effects on overall morphology and spinule formation in Ma and Mb cells. Vision Res. 1996;36:3901–3911. doi: 10.1016/s0042-6989(96)00139-3. [DOI] [PubMed] [Google Scholar]
- Bernstein BW, Bamburg JR. Cycling of actin assembly in synaptosomes and neurotransmitter release. Neuron. 1989;3:257–265. doi: 10.1016/0896-6273(89)90039-1. [DOI] [PubMed] [Google Scholar]
- Bernstein BW, Dewit M, Bamburg JR. Actin disassembles reversibly during electrically induced recycling of synaptic vesicles in cultured neurons. Mol Brain Res. 1998;53:236–250. doi: 10.1016/s0169-328x(97)00319-7. [DOI] [PubMed] [Google Scholar]
- Betz WJ, Henkel AW. Okadaic acid disrupts clusters of synaptic vesicles in frog motor nerve terminals. J Cell Biol. 1994;124:843–854. doi: 10.1083/jcb.124.5.843. [DOI] [PMC free article] [PubMed] [Google Scholar]
- Betz WJ, Mao F, Smith CB. Imaging exocytosis and endocytosis. Curr Opin Neurobiol. 1996;6:365–371. doi: 10.1016/s0959-4388(96)80121-8. [DOI] [PubMed] [Google Scholar]
- Burgoyne RD, Morgan A, O'Sullivan AJ. The control of cytoskeletal actin and exocytosis in intact and permeabilized adrenal chromaffin cells: role of calcium and protein kinase C. Cell Signal. 1989;1:323–334. doi: 10.1016/0898-6568(89)90051-x. [DOI] [PubMed] [Google Scholar]
- Burrone J, Lagnado L. Electrical resonance and Ca2+influx in the synaptic terminal of depolarizing bipolar cells from the goldfish retina. J Physiol. 1997;505:571–584. doi: 10.1111/j.1469-7793.1997.571ba.x. [DOI] [PMC free article] [PubMed] [Google Scholar]
- Calverley RK, Jones DG. Contributions of dendritic spines and perforated synapses to synaptic plasticity. Brain Res Brain Res Rev. 1990;15:215–249. doi: 10.1016/0165-0173(90)90002-6. [DOI] [PubMed] [Google Scholar]
- Cheek TR, Burgoyne RD. Cyclic AMP inhibits both nicotine-induced actin disassembly and catecholamine secretion from bovine adrenal chromaffin cells. J Biol Chem. 1987;262:11663–11666. [PubMed] [Google Scholar]
- Chieregatti E, Ceccaldi PE, Benfenati F, Valtorta F. Effects of synaptic vesicles on actin polymerization. FEBS Lett. 1996;398:211–216. doi: 10.1016/s0014-5793(96)01240-9. [DOI] [PubMed] [Google Scholar]
- DeVries SH, Baylor DA. Synaptic circuitry of the retina and olfactory bulb. Cell. 1993;72:139–149. doi: 10.1016/s0092-8674(05)80033-9. [DOI] [PubMed] [Google Scholar]
- Dowling, J.E. 1987. The Retina. An Approachable Part of the Brain. Harvard University Press, Cambridge, MA.
- Eccles, J.C. 1964. Physiology of Synapses. Springer-Verlag, Berlin.
- Edwards FA. Anatomy and electrophysiology of fast central synapses lead to a structural model for long-term potentiation. Physiol Rev. 1995;75:759–787. doi: 10.1152/physrev.1995.75.4.759. [DOI] [PubMed] [Google Scholar]
- Edwards FA. Dancing dendrites. Nature. 1998;394:129–130. doi: 10.1038/28050. [DOI] [PubMed] [Google Scholar]
- Eichholtz T, deBont DB, de-Widt J, Liskamp RM, Ploegh HL. A myristoylated pseudosubstrate peptide, a novel protein kinase C inhibitor. J Biol Chem. 1993;268:1982–1986. [PubMed] [Google Scholar]
- Fischer M, Kaech S, Knutti D, Matus A. Rapid actin-based plasticity in dendritic spines. Neuron. 1998;20:847–854. doi: 10.1016/s0896-6273(00)80467-5. [DOI] [PubMed] [Google Scholar]
- Geinisman Y, de Toledo L, Morrell, Morrell F, Heller RE, Rossi M, Parshall RF. Structural synaptic correlate of long-term potentiation: formation of axospinous synapses with multiple, completely partitioned transmission zones. Hippocampus. 1993;3:435–445. doi: 10.1002/hipo.450030405. [DOI] [PubMed] [Google Scholar]
- Geli MI, Riezman H. Role of type I myosins in receptor-mediated endocytosis in yeast. Science. 1996;272:533–535. doi: 10.1126/science.272.5261.533. [DOI] [PubMed] [Google Scholar]
- Greengard P, Valtorta F, Czernik AJ, Benfanati F. Synaptic vesicle phosphoproteins and regulation of synaptic function. Science. 1993;259:780–785. doi: 10.1126/science.8430330. [DOI] [PubMed] [Google Scholar]
- Harris KM, Kater SB. Dendritic spines: cellular specializations imparting both stability and flexibility to synaptic function. Annu Rev Neurosci. 1994;17:341–371. doi: 10.1146/annurev.ne.17.030194.002013. [DOI] [PubMed] [Google Scholar]
- Hartwig JH, Thelen M, Rosen A, Janmey PA, Nairn AC, Aderem A. MARCKS is an actin filament crosslinking protein regulated by protein kinase C and calcium-calmodulin. Nature. 1992;356:618–622. doi: 10.1038/356618a0. [DOI] [PubMed] [Google Scholar]
- He Q, Dent EW, Meiri KF. Modulation of actin filament behavior by GAP-43 (neuromodulin) is dependent on the phosphorylation status of serine 41, the protein kinase C site. J Neurosci. 1997;17:3515–3524. doi: 10.1523/JNEUROSCI.17-10-03515.1997. [DOI] [PMC free article] [PubMed] [Google Scholar]
- Heuser J. The role of coated vesicles in recycling of synaptic vesicle membrane. Cell Biol Int Rep. 1989;13:1063–1076. doi: 10.1016/0309-1651(89)90020-9. [DOI] [PubMed] [Google Scholar]
- Hirokawa N, Sobue K, Kanda K, Harada A, Yorifuji H. The cytoskeletal architecture of the presynaptic terminal and molecular structure of synapsin 1. J Cell Biol. 1989;108:111–126. doi: 10.1083/jcb.108.1.111. [DOI] [PMC free article] [PubMed] [Google Scholar]
- Kapfhammer JP, Christ F, Schwab ME. The growth associated protein GAP-43 is specifically expressed in tyrosine hydroxylase-positive cells of rat retina. Brain Res Dev Brain Res. 1997;101:257–264. doi: 10.1016/s0165-3806(97)00081-3. [DOI] [PubMed] [Google Scholar]
- Koffer A, Tatham PE, Gomperts BD. Changes in the state of actin during the exocytotic reaction of permeabilized rat mast cells. J Cell Biol. 1990;111:919–927. doi: 10.1083/jcb.111.3.919. [DOI] [PMC free article] [PubMed] [Google Scholar]
- Koistinaho J, Sagar SM. Localization of protein kinase C subspecies in the rabbit retina. Neurosci Lett. 1994;177:15–18. doi: 10.1016/0304-3940(94)90033-7. [DOI] [PubMed] [Google Scholar]
- Koontz MA, Hendrickson AE. Comparison of immunolocalization patterns for the synaptic vesicle proteins p65 and synapsin I in macaque monkey retina. Synapse. 1993;14:268–282. doi: 10.1002/syn.890140405. [DOI] [PubMed] [Google Scholar]
- Lagnado L, Gomis A, Job C. Continuous vesicle cycling in the synaptic terminal of retinal bipolar cells. Neuron. 1996;17:957–967. doi: 10.1016/s0896-6273(00)80226-3. [DOI] [PubMed] [Google Scholar]
- Lamaze C, Fujimoto LM, Yin HL, Schmid SL. The actin cytoskeleton is required for receptor-mediated endocytosis in mammalian cells. J Biol Chem. 1997;272:20332–20335. doi: 10.1074/jbc.272.33.20332. [DOI] [PubMed] [Google Scholar]
- Li L, Chin LS, Shupliakov O, Brodin L, Sihra TS, Hvalby O, Jensen V, Zheng D, McNamara JO, Greengard P. Impairment of synaptic vesicle clustering and of synaptic transmission, and increased seizure propensity, in synapsin I-deficient mice. Proc Natl Acad Sci USA. 1995;92:9235–9239. doi: 10.1073/pnas.92.20.9235. [DOI] [PMC free article] [PubMed] [Google Scholar]
- Lisman JE, Harris KM. Quantal analysis and synaptic anatomy: integrating two views of hippocampal plasticity. Trends Neurosci. 1993;16:141–147. doi: 10.1016/0166-2236(93)90122-3. [DOI] [PubMed] [Google Scholar]
- Lu M, Witke W, Kwiatkowski DJ, Kosik KS. Delayed retraction of filopodia in gelsolin null mice. J Cell Biol. 1997;138:1279–1287. doi: 10.1083/jcb.138.6.1279. [DOI] [PMC free article] [PubMed] [Google Scholar]
- Mandell JW, Townes AE, Czernik AJ, Cameron R, Greengard P, De CP. Synapsins in the vertebrate retina: absence from ribbon synapses and heterogeneous distribution among conventional synapses. Neuron. 1990;5:19–33. doi: 10.1016/0896-6273(90)90030-j. [DOI] [PubMed] [Google Scholar]
- McCord R, Klein A, Osborne NN. The occurrence of protein kinase C theta and lambda isoforms in retina of different species. Neurochem Res. 1996;21:259–266. doi: 10.1007/BF02529143. [DOI] [PubMed] [Google Scholar]
- Mennerick S, Matthews G. Ultrafast exocytosis elicited by calcium current in synaptic terminals of retinal bipolar neurons. Neuron. 1996;17:1241–1249. doi: 10.1016/s0896-6273(00)80254-8. [DOI] [PubMed] [Google Scholar]
- Mochida S, Kobayashi H, Matsuda Y, Yuda Y, Muramoto K, Nonomura Y. Myosin II is involved in transmitter release at synapses formed between rat sympathetic neurons in culture. Neuron. 1994;13:1131–1142. doi: 10.1016/0896-6273(94)90051-5. [DOI] [PubMed] [Google Scholar]
- Mosior M, Newton AC. Calcium-independent binding to interfacial phorbol esters causes protein kinase C to associate with membranes in the absence of acidic lipids. Biochemistry. 1996;35:1612–1623. doi: 10.1021/bi952031q. [DOI] [PubMed] [Google Scholar]
- Mosior M, Epand RM. Protein kinase C: an example of a calcium-regulated protein binding to membranes. Mol Membr Biol. 1997;14:65–70. doi: 10.3109/09687689709068436. [DOI] [PubMed] [Google Scholar]
- Muallem S, Kwiatkowska K, Xu X, Yin HL. Actin filament disassembly is a sufficient final trigger for exocytosis in nonexcitable cells. J Cell Biol. 1995;128:589–598. doi: 10.1083/jcb.128.4.589. [DOI] [PMC free article] [PubMed] [Google Scholar]
- Mundigl O, Ochaoa GC, David C, Slepnev VI, Kabanov A, De Camilli P. Ampiphysin I antisense oligonucleotide inhibit neurite outgrowth in cultured hippocampal neurons. J Neurosci. 1998;18:93–103. doi: 10.1523/JNEUROSCI.18-01-00093.1998. [DOI] [PMC free article] [PubMed] [Google Scholar]
- Neves, G., and L. Lagnado. 1999. The kinetics of exocytosis and endocytosis in the synaptic terminal of retinal bipolar cells. J. Physiol. In press. [DOI] [PMC free article] [PubMed]
- Osborne NN, Barret NL, Morris NJ, Huang FL. The occurrence of three isoenzymes of protein kinase C (alpha, beta and gamma) in retinas of different species. Brain Res. 1992;570:161–166. doi: 10.1016/0006-8993(92)90577-v. [DOI] [PubMed] [Google Scholar]
- Osborne NN, Wood J, Groome N. The occurrence of three calcium-independent protein kinase C subspecies (delta, epsilon and zeta) in retina of different species. Brain Res. 1994;637:156–162. doi: 10.1016/0006-8993(94)91228-9. [DOI] [PubMed] [Google Scholar]
- Peschke E, Spessert R, Spiwoks BI, Dorner P, Vollrath L. Morphometry of pineal synaptic ribbon profile numbers after cytochalasin D treatment. Acta Anat Basel. 1996;156:94–98. doi: 10.1159/000147833. [DOI] [PubMed] [Google Scholar]
- Pieribone VA, Shupliakov O, Brodin L, Hilfiker RS, Czernik AJ, Greengard P. Distinct pools of synaptic vesicles in neurotransmitter release. Nature. 1995;375:493–497. doi: 10.1038/375493a0. [DOI] [PubMed] [Google Scholar]
- Prekeris R, Mayhew MW, Cooper JB, Terrian DM. Identification and localization of an actin-binding motif that is unique to the epsilon isoform of protein kinase C and participates in the regulation of synaptic function. J Cell Biol. 1996;132:77–90. doi: 10.1083/jcb.132.1.77. [DOI] [PMC free article] [PubMed] [Google Scholar]
- Raynauld JP, Laviolette JR, Wagner HJ. Goldfish retina: a correlate between cone activity and morphology of the horizontal cell in cone pedicules. Science. 1979;204:1436–1438. doi: 10.1126/science.451577. [DOI] [PubMed] [Google Scholar]
- Rosahl TW, Spillane D, Missler M, Herz J, Selig DK, Wolff JR, Hammer RE, Malenka RC, Sudhof TC. Essential functions of synapsins I and II in synaptic vesicle regulation. Nature. 1995;375:488–493. doi: 10.1038/375488a0. [DOI] [PubMed] [Google Scholar]
- Rösner H, Vacun G, Rebhan M. Muscarinic receptor–mediated induction of actin-driven lamellar protrusions in neuroblastoma cell somata and growth cones. Involvement of protein kinase C. Eur J Cell Biol. 1995;66:324–334. [PubMed] [Google Scholar]
- Schmitz Y, Kohler K. Spinule formulation in the fish retina: is there an involvement of actin and tubulin? An electronmicroscopic immunogold study. J Neurocytol. 1993;22:205–214. doi: 10.1007/BF01246359. [DOI] [PubMed] [Google Scholar]
- Schuster T, Krug M, Wenzel J. Spinules in axospinous synapses of the rat dentate gyrus: changes in density following long-term potentiation. Brain Res. 1990;16:171–174. doi: 10.1016/0006-8993(90)91654-y. [DOI] [PubMed] [Google Scholar]
- Shiells, R.A., and G. Falk. 1998. Ca2+ activation of protein kinase C (PKC) initiates light adaptation in dogfish retinal ON-bipolar cells. Proceedings of the Physiological Society, November meeting.
- Suzuki S, Kaneko A. Protein kinase C-like immunoreactivity of the ON-bipolar cell in goldfish and mammalian retina: a useful criterion for subtype identification of isolated cells. Neurosci Res Suppl. 1991;15:S107–S115. [PubMed] [Google Scholar]
- Tachibana M, Okada T. Release of endogenous excitatory amino acids from ON-type bipolar cells isolated from the goldfish retina. J Neurosci. 1991;11:2199–2208. doi: 10.1523/JNEUROSCI.11-07-02199.1991. [DOI] [PMC free article] [PubMed] [Google Scholar]
- Tachibana M, Okada T, Arimura T, Kobayashi K. Dihydropyridine-sensitive calcium current mediates neurotransmitter release from retinal bipolar cells. Ann NY Acad Sci. 1993a;707:359–361. doi: 10.1111/j.1749-6632.1993.tb38070.x. [DOI] [PubMed] [Google Scholar]
- Tachibana M, Okada T, Arimura T, Kobayashi K, Piccolino M. Dihydropyridine-sensitive calcium current mediates neurotransmitter release from bipolar cells of the goldfish retina. J Neurosci. 1993b;13:2898–2909. doi: 10.1523/JNEUROSCI.13-07-02898.1993. [DOI] [PMC free article] [PubMed] [Google Scholar]
- Tanaka C, Nishizuka Y. The protein kinase C family for neuronal signaling. Annu Rev Neurosci. 1994;17:551–567. doi: 10.1146/annurev.ne.17.030194.003003. [DOI] [PubMed] [Google Scholar]
- Ter-Margarian A, Djamgoz MB. Cytochalasin inhibits light-dependent synaptic plasticity of horizontal cells in teleost retina. Neurosci Lett. 1992;147:131–135. doi: 10.1016/0304-3940(92)90577-t. [DOI] [PubMed] [Google Scholar]
- Usuda N, Kong Y, Hagiwara M, Uchida C, Terasawa M, Nagata T, Hidaka H. Differential localization of protein kinase C isozymes in retinal neurons. J Cell Biol. 1991;112:1241–1247. doi: 10.1083/jcb.112.6.1241. [DOI] [PMC free article] [PubMed] [Google Scholar]
- Usukura J, Yamada E. Ultrastructure of the synaptic ribbons in photoreceptor cells of Rana catesbeianarevealed by freeze-etching and freeze-substitution. Cell Tissue Res. 1987;247:483–488. doi: 10.1007/BF00215740. [DOI] [PubMed] [Google Scholar]
- Vitalé ML, Seward EP, Trifaro JM. Chromaffin cell cortical actin network dynamics control the size of the release-ready vesicle pool and the initial rate of exocytosis. Neuron. 1995;14:353–363. doi: 10.1016/0896-6273(95)90291-0. [DOI] [PubMed] [Google Scholar]
- von Gersdorff H, Matthews G. Dynamics of synaptic vesicle fusion and membrane retrieval in synaptic terminals. Nature. 1994;367:735–739. doi: 10.1038/367735a0. [DOI] [PubMed] [Google Scholar]
- von Gersdorff H, Vardi E, Matthews G, Sterling P. Evidence that vesicles on the synaptic ribbon of retinal bipolar neurons can be rapidly released. Neuron. 1996;16:1221–1227. doi: 10.1016/s0896-6273(00)80148-8. [DOI] [PubMed] [Google Scholar]
- Wagner HJ. Light-dependent plasticity of the morphology of horizontal cell terminals in cone pedicles of fish retinas. J Neurocytol. 1980;9:573–590. doi: 10.1007/BF01205026. [DOI] [PubMed] [Google Scholar]
- Wagner HJ, Djamgoz MB. Spinules: a case for retinal synaptic plasticity. Trends Neurosci. 1993;16:201–206. doi: 10.1016/0166-2236(93)90155-f. [DOI] [PubMed] [Google Scholar]
- Wang XH, Zheng JQ, Poo MM. Effects of cytochalasin treatment on short-term synaptic plasticity at developing neuromuscular junctions in frogs. J Physiol Lond. 1996;491:187–195. doi: 10.1113/jphysiol.1996.sp021206. [DOI] [PMC free article] [PubMed] [Google Scholar]
- Ward NE, O'Brian CA. Inhibition of protein kinase C by N-myristoylated peptide substrate analogs. Biochemistry. 1993;32:11903–11909. doi: 10.1021/bi00095a020. [DOI] [PubMed] [Google Scholar]
- Weiler R, Wagner HJ. Light dependent change of cone-horizontal cell interactions in carp retina. Brain Res. 1984;298:1–9. doi: 10.1016/0006-8993(84)91141-7. [DOI] [PubMed] [Google Scholar]
- Weiler R, Janssen-Bienhold U. Spinule-type neurite outgrowth from horizontal cells during light adaptation in the carp retina: an actin-dependent process. J Neurocytol. 1993;22:129–139. doi: 10.1007/BF01181576. [DOI] [PubMed] [Google Scholar]
- Yazulla S, Studholme KM. Light-dependent plasticity of the synaptic terminals of Mb bipolar cells in goldfish retina. J Comp Neurol. 1992;320:521–530. doi: 10.1002/cne.903200409. [DOI] [PubMed] [Google Scholar]