

Abstract
To investigate the role of microtubules in regulating cell polarity in Schizosaccharomyces pombe, we have developed a system in which normally cylindrical fission yeast synchronously form branched cells at high frequency upon treatment with the microtubule-depolymerizing drug thiabendazole (TBZ). Branching depends on both elevated temperature and cell cycle state and occurs at high frequency only when TBZ is added to cells that have not yet passed through New-End Take-Off (NETO), the normal transition from monopolar to bipolar growth. This suggests that microtubules may be of greatest physiological importance for the maintenance of cell shape at specific points in the cell cycle. The localization of three different proteins normally found at cell ends—cortical F-actin, tea1, and an ral3 (scd2)–green fluorescent protein (GFP) fusion—is disrupted by TBZ treatment. However, these proteins can eventually return to cell ends in the absence of microtubules, indicating that although their localization to ends normally depends on microtubules, they may recover by alternative mechanisms. In addition, TBZ induces a shift in ral3–GFP distribution from cell ends to the cell middle, suggesting that a protein complex containing ral3 may be part of the cue that specifies the position of branch formation.
Keywords: S. pombe, microtubules, thiabendazole, actin, cell polarity
Microtubules of eukaryotic cells are involved in a multiplicity of functions requiring polarized, structural elements. During mitosis, they provide the structural framework for the accurate segregation of chromosomes, and during the interphase of most higher eukaryotes, the microtubule cytoskeleton plays both direct and indirect roles in the global organization of cytoplasm, serving as a system of tracks along which intracellular movements occur and upon which cytoplasmic organelles and subcellular compartments are distributed. Microtubules contribute to the generation of cell polarity in a number of ways, both in the general organization of specialized cell types such as neurons (Heidemann, 1996; Mandell and Banker, 1996), epithelial cells (Rodriguez-Boulan and Powell, 1992; Simons et al., 1992; Cole and Lippincott-Schwartz, 1995), and oocytes (Cooley and Theurkauf, 1994; Lehmann, 1995) and in specific behaviors such as cell migration (Bershadsky and Vasiliev, 1993), NK cell–mediated cell killing (Kupfer et al., 1983), and spindle positioning and the determination of cleavage planes in mitosis and meiosis (Hyman and White, 1987; Lutz et al., 1988; Palmer et al., 1992; Reinsch and Karsenti, 1994; Gard, 1995; McGrail and Hays, 1997).
Many of the molecular mechanisms controlling cell polarity are thought to be conserved from mammalian cells to simpler eukaryotes such as the yeasts, whose stereotyped patterns of growth reflect an underlying polarity (Drubin and Nelson, 1996). In the budding yeast Saccharomyces cerevisiae, controls on cell polarity are manifest in the processes of budding, bud site selection, and shmooing during mating (Pringle et al., 1995). Cell polarization is apparent in the fission yeast Schizosaccharomyces pombe in the faithful maintenance of a cylindrical cell shape and by growth occurring exclusively at cell ends (Mata and Nurse, 1998), as well as in the switch from monopolar to bipolar growth (New-End Take-Off [NETO]),1 which normally occurs in early G2 and depends on both a critical cell size and successful DNA replication (Mitchison and Nurse, 1985). What roles do microtubules play in these processes? In budding yeast, some cytoplasmic microtubules run from the spindle pole body into the growing bud (Botstein et al., 1997). However, there is good evidence that microtubules are not involved in the establishment and/or maintenance of cell polarity and budding patterns (Huffaker et al., 1988; Jacobs et al., 1988), although they contribute to nuclear orientation and migration of the nucleus to the bud neck in mitosis and to karyogamy during mating (Botstein et al., 1997).
Cytoplasmic microtubules in fission yeast show more striking changes in distribution during the cell cycle (Hagan and Hyams, 1988). At the completion of anaphase, an array of microtubules emanates from the medial division site, and subsequently, interphase microtubules extend along the length of the cell. In contrast to the situation in budding yeast, in fission yeast there is evidence for a role for microtubules in cell polarity, although the nature of this role remains unclear because of variation in morphology and the relatively low penetrance of phenotypes. Cold-sensitive tubulin mutants generate a variety of bent or misshapen cells, including branched cells, albeit at relatively low frequency and after many hours at the nonpermissive temperature (Toda et al., 1983; Umesono et al., 1983). Similar cell shape abnormalities have been observed in the presence of the microtubule inhibitor thiabendazole (TBZ) (Walker, 1982), as well as in tea2 mutants, which have abnormally short microtubules (Verde et al., 1995). Overexpression of the microtubule-associated protein dis1 also produces abnormally shaped cells (Nakaseko et al., 1996), as does mutation or deletion of the microtubule-associated protein mal3 (Beinhauer et al., 1997). Furthermore, deletion of the tea1 + gene, which is thought to be translocated by microtubules to cell ends, can lead to bent cells as well as branched cells, suggesting that microtubules may mediate delivery of important regulators of cell polarity (Mata and Nurse, 1997).
Here we describe an experimental system in which the role of microtubules in controlling cell polarity in fission yeast can be more easily studied. Under specific conditions that depend on both temperature and cell cycle state, the disruption of microtubules results in the establishment of a completely new axis of polarized growth, synchronously producing branched cells from normally cylindrical cells with high efficiency. Using this system, we also demonstrate that cortical filamentous actin as well as other proteins localized to the growing tips of fission yeast depend intimately on microtubules for their normal localization. Interestingly, these proteins eventually (although slowly) return to growing cell tips, apparently independently of the recovery of the microtubule cytoskeleton, suggesting that more than one mechanism may exist to localize components controlling polarized growth in fission yeast.
Materials and Methods
Yeast Strains and Plasmids
A list of strains used in this work is shown in Table I. Standard yeast genetic techniques were used throughout (Moreno et al., 1991). Crosses with ral3Δ strains, which are sterile, were performed by first transforming cells with a multicopy plasmid containing the ral3 + gene and then mating under selective conditions, later allowing plasmid loss to uncover the ral3Δ phenotype. The nda3-TB101 mutation was originally identified as ben1-TB101 (Yamamoto, 1980). To avoid confusion, we shall use the later and more commonly used gene designation nda3 (Toda et al., 1983; Umesono et al., 1983).
Table I.
Yeast Strains Used in This Study
| Strain | Genotype | Source | ||
|---|---|---|---|---|
| PN1 | 972 h − | 1 | ||
| PN7 | cdc25-22 h − | 1a | ||
| PN21 | ade6-704 h − | 1 | ||
| PN111 | cdc10-129 h + | 1b | ||
| PN135 | cdc17-K42 h + | 1c | ||
| PN136 | cdc18-K46 h + | 1c | ||
| PN137 | cdc19-P1 h + | 1c | ||
| PN138 | cdc20-M10 h + | 1c | ||
| PN139 | cdc21-M68 h + | 1c | ||
| PN140 | cdc22-M45 h + | 1c | ||
| PN359 | cdc25-22 ade6-704 | 1 | ||
| PN585 | wee1 + (3x) wee1 + ::LEU2 + leu1-32 h − | 1d | ||
| PN1089 | orb2-34 cdc10-129 ade6-M210 leu1-32 h − | 1e | ||
| PN1191 | cdc10-129 ade6-704 leu1-32 h + | 1 | ||
| PN1652 | ral3Δ::ura4 + ura4-D18 ade6-M210 leu1-32 h 90 | 2 | ||
| PN1733 | tea1Δ::ura4 + ura4-D18 ade6-M210 h − | 1f | ||
| JB110 | pom1Δ::ura4 + ura4-D18 h − | 3 | ||
| HM318 | nda3-TB101 ura1-61 leu1-32 ade6-M210 h + | 4 | ||
| KS153 | ral3Δ::ura4 + ura4-D18 cdc10-129 h 90 | 1g | ||
| KS189 | tea1Δ::ura4 + ura4-D18 cdc10-129 h + | 1g | ||
| KS179 | pom1Δ::ura4 + cdc10-129 h + | 1g | ||
| KS165 | nda3-TB101 cdc10-129 h + | 1g | ||
| KS101 | PN21 with integrated nmt1::ral3-GFP | 1g | ||
| KS110 | PN1191 with integrated nmt1::ral3-GFP | 1g | ||
| KS113 | PN359 with integrated nmt1::ral3-GFP | 1g | ||
| KS217 | nda3-TB101 cdc10-129 leu1-32 ade6-704 h + | 1g | ||
| with integrated nmt1::ral3-GFP |
Sources of strains: (1) Nurse laboratory stock, with references: (a) Thuriaux et al., 1980 (b) Nurse et al., 1976, (c) Nasmyth and Nurse, 1981, (d) Russell and Nurse, 1987, (e) Snell and Nurse, 1994, (f) Mata and Nurse, 1997, and (g) this study; (2) M. Yamamoto (University of Tokyo, Japan) (Fukui and Yamamoto, 1988); (3) J. Bähler (Imperial Cancer Research Fund) (Bähler and Pringle, 1998); (4) M. Yanagida (University of Kyoto, Japan) (Yamamoto, 1980).
For integrated expression of ral3–green fluorescent protein (GFP), the coding region of ral3/scd2 (Fukui and Yamamoto, 1988; Chang et al., 1994; for simplicity we shall refer to the gene as ral3 +) was amplified without a stop codon by PCR, using primers 5′-CCCCTCGAGATTCCAGTCTCTATGTTA-3′ at the 5′ end and 5′-GGGTTGCGGCCGCTGCTGCTGTTGCTGCAAACCTCCGTCTTTCTGC-3′ at the 3′ end, and a template plasmid containing the ral3 + gene (gift of M. Yamamoto). The 1.6-kb PCR product was digested with XhoI and NotI and cloned into pMGC (Sawin, 1998), also digested with XhoI and NotI, to create pMral3C. The plasmid pMral3GFP was constructed by subcloning an XhoI/BamHI fragment from pSGA (Sawin and Nurse, 1996) containing GFPmut2 (Cormack et al., 1996) into pMral3C digested with SalI and BamHI. pMral3GFP was digested with XhoI and BamHI, and the ral3– GFP coding sequence was then subcloned into the integrating plasmid REP6X. REP6X is a derivative of REP5 (Stern and Nurse, 1997), which drives expression from the nmt1 promoter (Maundrell, 1990) and contains a sup3-5 suppressor tRNA for selection in ade6-704 nonsense mutants. Cells were transformed with the resulting construct, pSral3GFPint, and stable Ade+ transformants that had integrated the constructs were selected and screened for expression of the fusion protein. All ral3 constructs rescued the sterility of the ral3Δ strain.
Physiological Experiments
Except where indicated, cells were grown in YE5S (Moreno et al., 1991). For branching experiments with cdc10-129 mutants and other strains (i.e., as in Figs. 1, 2, 3 A, 4, 5, 6, 7, A and C, 8, 9, 11, and 12), cells at a density of OD(595) 0.07–0.1 were incubated in flat-bottom flasks in shaking water baths (130–150 rpm) at 36°C for 4 h, at which time 1/100 vol of 10 mg/ml TBZ (made fresh in DMSO) was added to cultures. Cultures were incubated an additional 30 min and then shifted to a 25°C shaking water bath, with time points taken at various intervals. To count the frequency of branched cells, 0.2 ml of culture was added to 0.8 ml formol saline and stored indefinitely until counting. Cell branching was measured under the microscope by counting 200–300 cells per time point for each strain in a given experiment, with phase-contrast optics. Cells with small bumps easily recognizable as the beginning of branches were counted as branched cells, while bent or L-shaped cells (a very small minority; see Fig. 1) were not. Under these conditions, reorientation of growth polarity by TBZ was highly reproducible. In preliminary experiments, EMM2 minimal medium (Moreno et al., 1991) was also used, but it was only 50% as effective at producing branched cells and not as reproducibly. The reasons for this are not yet clear.
Figure 1.

Formation of branched cells in fission yeast cdc10-129 mutants by treatment with TBZ. (A) Experimental design (see Materials and Methods for further details). (B) Percentage of branched cells formed after addition of carrier DMSO to cdc10-129 mutants and TBZ to cdc10-129 mutants and cdc10-129 nda3-TB101 double mutants at different times after release from the 36°C cell cycle block. (C–H) Differential-interference contrast images of cdc10-129 cells treated with DMSO (C, E, and G) or TBZ (D, F, and H) at 0 (C and D), 2 (E and F), and 4 (G and H) h after release. The tiny extrusions seen at many cell tips are an artifact of lengthy formaldehyde fixation. Cells in D are shorter than those in C as a consequence of the 30-min exposure to TBZ. Bar, 20 μm.
Figure 2.

Branching depends on cell cycle state and coincides with cells not having undergone NETO. (A) Percentage of branched cells induced by TBZ in wild-type, G1-arrested cdc10-129, and G2-arrested cdc25-22 cells, at different times after shifting from 36 to 25°C, following the regime shown in Fig. 1. (B) TBZ-induced branching in other cell cycle mutants defective in G1/S functions, following the same regime. cdc18-K46 and cdc21-M68 mutants arrest with an incomplete or defective round of replication, while cdc10-129 and cdc20-M10 mutants arrest with a 1C DNA content; all mutants arrest in a pre-NETO state. (C) Branching induced by TBZ in different cell polarity mutants, following the same regime as above. Note that cdc10-129 orb2-34 double mutants show a great reduction in branching, while cdc10-129 ral3Δ mutants are less impaired. Note also that cdc10-129 tea1Δ and cdc10-129 pom1Δ mutants already have 5–6% branched cells at the time of release from the cell cycle block, but this increases to very high levels after release. In these experiments, results from cdc10-129 single mutants and wild-type cells (not shown) were comparable to those shown in Figs. 1 and 2 A.
Figure 3.

Branching requires elevated temperature. (A) Reduction of branching caused by adding TBZ at the time of release of the cdc10-129 cell cycle block (4.5 h) instead of at the normal time 30 min before release (4 h), following the regime of Fig. 1. (B) Branching induced by TBZ in wild-type cells in HU block-and-release experiments. Cells were blocked in HU for the total time shown, with TBZ addition 30 min before washing out HU (see text for further details). Extensive branching occurs after the 36°C HU block only. All temperatures produced G1-arrested cells at the time of TBZ addition (not shown). (C) Increases in cell length do not account for increased branching at high temperature. Cells were blocked for a total of 4 h in HU, adding TBZ 30 min before release by HU wash-out. Branching is reduced by dropping the temperature from 36°C to 25°C 15 min before TBZ addition. In addition, increased cell length at 25°C in a strain carrying extra copies of the wee1 + gene (wee1-3x) does not increase the frequency of branching (see text for further details).
Figure 4.

Microtubules in cdc10-129 cells treated with DMSO or TBZ, shown at different times after shifting from 36 to 25°C. (A–F) DMSO-treated cells. (A′–F′) TBZ-treated cells at 0 (A and A′), 0.5 (B and B′), 1.0 (C and C′), 1.5 (D and D′), 2.0 (E and E′), and 3.5 h (F and F′) after shift-down. Note that residual microtubules remain in TBZ-treated cells but do not reach cell ends as in DMSO-treated cells; note also bundles of microtubules around the cell nucleus at later times (E′ and F′). Images are maximum projections of series of confocal sections, all taken at the same exposure. Bar, 10 μm.
Figure 5.
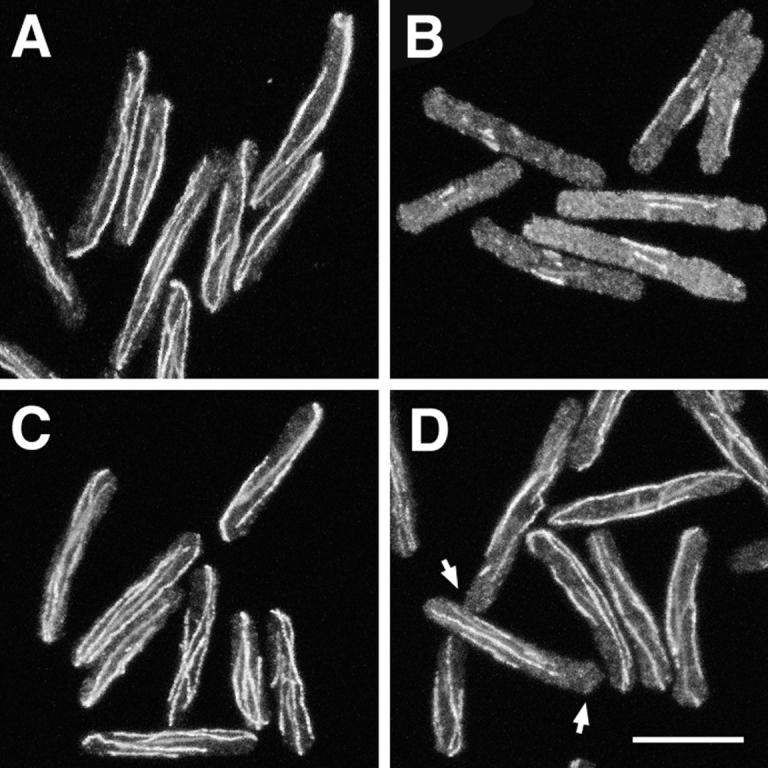
Microtubules in cdc10-129 (A and B) and cdc10-129 nda3-TB101 (C and D) cells in a branching experiment like that shown in Fig. 1. Cells are shown 30 min after addition of either DMSO (A and C) or 100 μg/ml TBZ (B and D). Note that microtubules are significantly less perturbed by TBZ in cdc10 nda3 double mutants, but in some cases microtubules do not completely reach the cell ends (D, arrows). Bar, 10 μm.
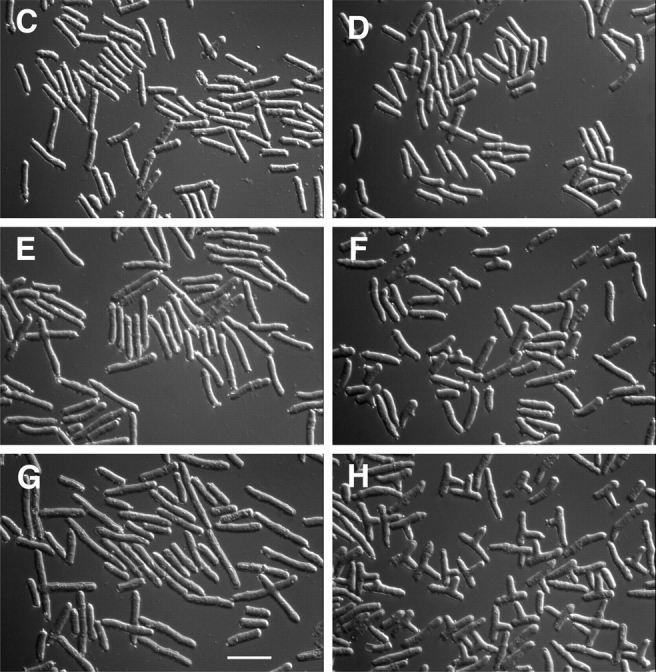
Figure 6.

Rhodamine-phalloidin staining of F-actin during TBZ-induced branching in cdc10-129 cells. Individual cells after 4 h at the restrictive temperature just before TBZ addition (A–D), at the time of temperature shift-down, 30 min after TBZ addition (E–H), and 1.0 (I–L), 2.0 (M–P), 3.0 (Q–T), and 4.0 (U–X) h after shift-down. Note the close apposition of actin to extreme cortical regions in A–D, in contrast to the more random appearance in E–H. Note also the appearance of actin patches at the cell middle in I–L, and the extensive actin filament networks, which are particularly obvious during branching. Bar, 10 μm.
Figure 7.

Time course of actin dispersal and subsequent recovery to cell ends upon TBZ treatment. Rhodamine-phalloidin stained cells. (A) Percentage of cells with actin closely apposed to cell ends after TBZ treatment, in wild-type, cdc10-129, cdc10-129 nda3-TB101, and cdc25-22 cells, following the regime in Fig. 1. Actin is transiently deranged in all nda3 + cells but recovers within 2–2.5 h of TBZ addition. cdc10 nda3 double mutants show only a little actin disorganization and recover quickly; data for cdc10 nda3 double mutants are from a separate experiment in which actin distribution in cdc10 single mutants with and without TBZ was as expected. Arrow marks the time of shift to 25°C to release the cell cycle block; dashed line indicates when actin can be found in cortical patches near cell middles in cdc10-129 cells. (B) Actin dispersal after TBZ addition to wild-type and cdc10-129 cells growing exponentially at 25 and 36°C. Note that effects of TBZ are independent of cell cycle and temperature. (C) Movement of cortical actin into cell ends in branching cdc10-129 cells. Time course based on counting rhodamine-phalloidin staining after shift-down to 25°C. Note that at the onset of branching, most branched cells have appreciable amounts of actin in the branch only. At later times, actin is enriched at the original cell ends as well.
Figure 8.

Return of actin to either “old” or “new” ends after dispersal by TBZ, in both branched and unbranched cells. Doubly-stained cells showing both cortical F-actin by rhodamine-phalloidin staining (A–H) and new-end growth beyond most recent birth scars, by Calcofluor staining (A′–H′). (A and B) Actin at branch and old end. (C and D) Actin at branch and new end. (E and F) Actin at old end in unbranched cells. (G and H) Actin at new end in unbranched cells. Bar, 10 μm.
Figure 9.

tea1 is delocalized by TBZ but returns to cell ends in the absence of microtubule recovery. cdc10-129 cells, produced by the methods shown in Fig. 1, at the time of TBZ addition (i.e., 30 min before shift-down; A) and 1 (B) and 4 h (C and D) after shift-down, showing antitubulin staining (A–D), anti-tea1 staining (A′–D′), and merged image of antitubulin and anti-tea1 staining (A″–D″). Note that in some cells in C and D, tea1 returns to high levels at cell ends without any obvious microtubules, although residual tea1 remains in the cytoplasm. Images are maximum projections of series of confocal optical sections, taken at the same exposure. This may exaggerate to some extent the amount of delocalized tea1 at later times. Bar, 10 μm.
Figure 11.
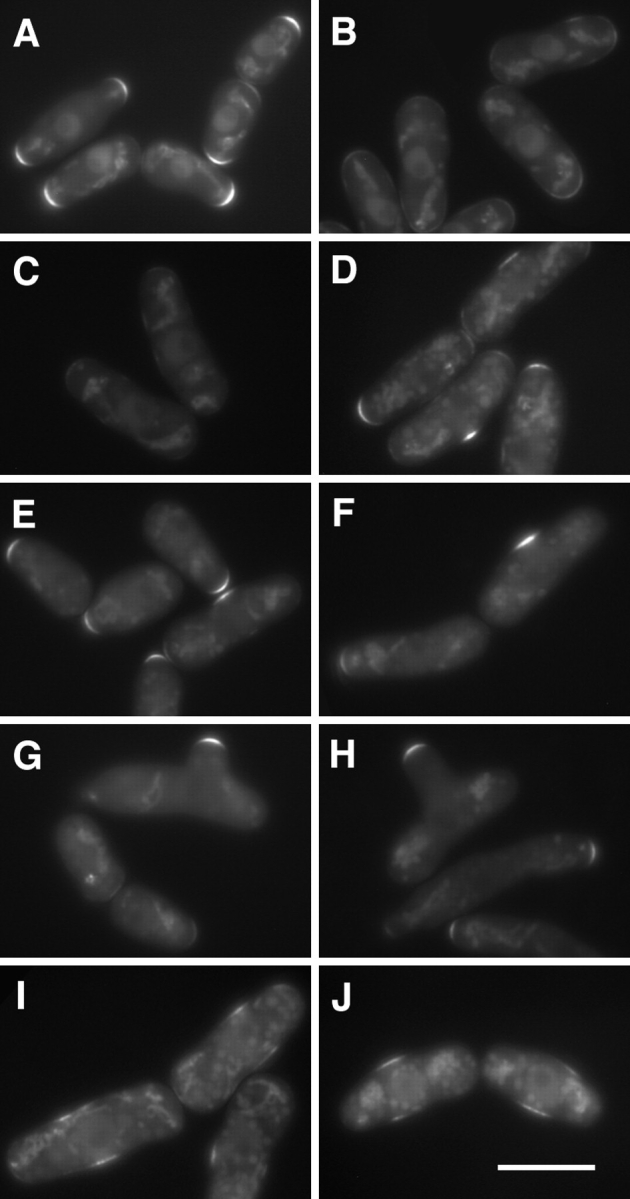
Redistribution of ral3–GFP to the cell middle upon addition of TBZ. (A–H) Localization of ral3–GFP in live cdc10-129 cells in a branching experiment, following the regime shown in Fig. 1. Cells are shown before TBZ addition (A) and 23 (B), 36 (C), 86 (D), 105 (E), 107 (F), 153 (G), and 216 (H) min after TBZ addition. Cells were shifted down to 25°C 30 min after TBZ addition. (I and J) Localization of ral3–GFP in a parallel experiment in which 100 μM LatA was added to cultures 15 min after TBZ addition. Note that at 63 (I) and 85 (J) min after TBZ addition, ral3–GFP is found in the cell middle, although it is more weak and diffuse. Some cells appear wider than normal in part because of flattening. Bar, 10 μm.
Figure 12.

Quantitation of ral3–GFP localization in a branching experiment, in cdc10-129 single mutants (A) and cdc10-129 nda3-TB101 double mutants (B), following the same regime shown in Fig. 1. Cells were shifted to 25°C 30 min after TBZ addition. Note that in the cdc10 nda3 double mutant, there is only a modest loss of ral3– GFP from cell ends and no accumulation of middle localization.
Full induction of ral3–GFP expression from the nmt1 promoter (i.e., in EMM2 minimal medium lacking thiamine) led to protein localization in the nucleus and cytoplasm as well as cell ends, and to small aberrancies in cell morphology (Sawin, 1998). Therefore, for physiological studies ral3–GFP was first induced to full levels in minimal medium, and then cells were transferred to YE5S just before temperature shift-up to shut off any further expression. Within 3–4 h after switching off expression, ral3–GFP was found only at cell ends. Subsequent treatments with TBZ were as described above.
For experiments involving hydroxyurea (HU) addition and removal, HU was added as a 1/100 vol of a 1.1-M stock, made fresh in distilled water, at the start of the experiment. In most cases, a similar amount of HU was added after 3 h as well, to counter adaptation of cells to the drug. For removal of HU, cells were rapidly filtered using a prewarmed filtration apparatus (Millipore Corp., Bedford, MA) and resuspended in their original volume with fresh prewarmed medium, containing TBZ as appropriate to the experiment. Wash-out of HU took 2–4 min from start to finish.
Addition of latrunculin A (LatA) to cells was from a 50 mM stock in DMSO (generously provided by K. Ayscough, University of Dundee, Dundee, UK), and it was added to cells at a final concentration of 100 μM.
Immunofluorescence and Actin Staining
For immunofluorescence, cells were harvested by rapid filtration and fixed by washing the filter with methanol at −20°C. Cells were further processed for immunofluorescence as described (Mata and Nurse, 1997). Antitubulin staining used the TAT1 monoclonal tissue culture supernatant (gift of Prof. K. Gull, University of Manchester, Manchester, UK; Woods et al., 1989) at 1:10 followed by Cy3-labeled Fab2′ sheep anti– mouse secondary antibody (C-2181; Sigma Chemical Co., St. Louis, MO) at 1:1,000. Anti-tea1 staining was as described (Mata and Nurse, 1997), using an antibody raised against the COOH terminus of tea1 at 1:20 and a secondary donkey anti–rabbit whole IgG (N-1034; Amersham Corp., Arlington Heights, IL) at 1:150.
Rhodamine-phalloidin staining of actin was done using a modification of the method of Marks and Hyams (1985). Growing cultures were added directly to 1/3 volume prewarmed 16% EM-grade formaldehyde and fixed for 1 h. Cells were washed three times in one culture vol of 0.1 M Na Pipes, pH 6.8, 1 mM EGTA, 1 mM MgCl2 (PEM), extracted for 30 s with PEM/1% Triton X-100, and washed three additional times in PEM. 300 U rhodamine-phalloidin (Molecular Probes, Eugene, OR) was resuspended in 1.5 ml methanol, divided into 15-μl aliquots, evaporated in a speed-vac, and stored at −20°C. For staining, one aliquot was resuspended in 50 μl PEM, and 7 μl of this was added to no more than 1 μl of a pellet of fixed, extracted cells. Cells stained in this manner could be stored for several days at 4°C. For mounting, 0.5 μl of stained cells was spotted onto a glass slide (in some cases precoated with 10 mg/ml polylysine; P-1524, Sigma Chemical Co.), followed by 2.5 μl of a mounting medium of PEM containing 1 mg/ml phenylene diamine as antifade, and in some cases also 50 μg/ ml Calcofluor (F-6259; Sigma Chemical Co.). The presence of glycerol in mounting medium resulted in relatively poor staining of actin, and slides were not coated with polylysine when Calcofluor was used. These procedures gave excellent, reproducible staining of actin, and with careful through-focusing we could see actin cables in essentially all cells, although these generate little contrast and are often out of the plane of focus. Small changes from this procedure, including growing cells in minimal medium, produced poorer results. Because the conditions for good-quality actin staining were incompatible with those for staining of cytoplasmic microtubules, double staining of actin and tubulin was not possible in this work. Similarly, since ral3–GFP visualization is not completely reliable in fixed cells, we could not visualize both actin and ral3–GFP in the same cells.
Changes in actin distribution (Fig. 7) were in some cases subtle and therefore scored blind. 100–200 rhodamine-phalloidin–stained cells were counted for each time point, with careful focusing through each cell to identify the presence or absence of cortical actin at cell ends. In Fig. 7 C, actin at cell ends was considered significant if found at levels at least roughly 20% of that found at the branch site, judging under the microscope. ral3–GFP localization (Figs. 10 and 12) was scored in living cells, counting 100 cells per time point.
Figure 10.
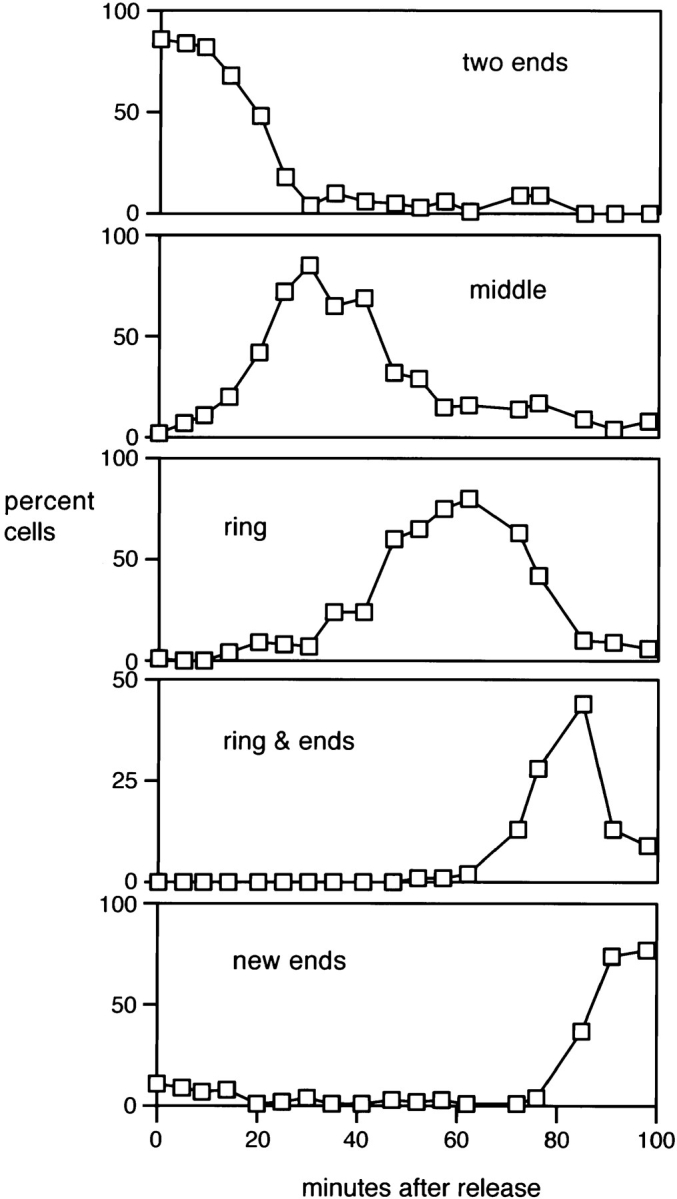
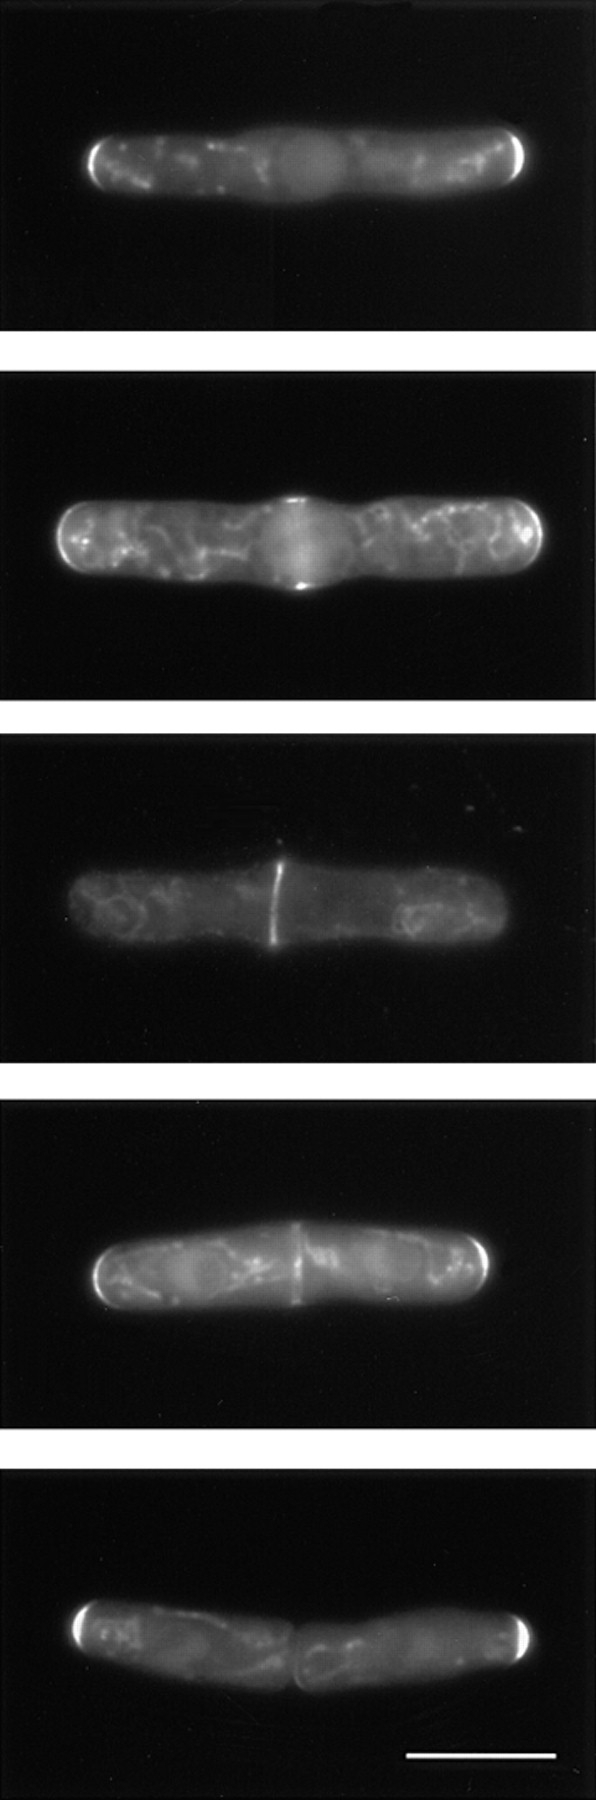
Redistribution of ral3–GFP to the cell middle after release from a G2 arrest. cdc25-22 mutants expressing an integrated ral3–GFP fusion protein were shifted to 36°C for 4 h and then shifted down to 25°C to enter mitosis synchronously. Right panels show different observed distributions of ral3–GFP in live cells after release, and the corresponding left panels show the frequency of different distributions over time. Note that “middle” localization represents an intermediate between the localization of ral3– GFP at cell ends in G2 and the ring formed at cytokinesis. After cell division, ral3–GFP returns to the “old” ends, which preexisted in the mother cell and which are the sites of initial extensile growth. Background fluorescence is predominantly mitochondrial autofluorescence. Some cells appear wider than normal because of flattening under the microscope. Bar, 10 μm.
Microscopy
For fluorescence microscopy, we used a Zeiss Axioplan microscope (Thornwood, NY) equipped with a Zeiss Fluar 100×/1.4 objective, an HBO100 mercury arc lamp, and HiQ fluorescence filters (Chroma Technology, Brattleboro, VT). Differential-interference contrast and fluorescent images were collected with a chilled video-rate CCD camera (model C5985; Hamamatsu, Bridgewater, NJ) controlled by an Apple Power Macintosh 8500 computer (Cupertino, CA) running Hamamatsu software. High-resolution images of actin (Fig. 6) were obtained using a cooled slow-scan CCD (Princeton Instruments, Trenton, NJ) controlled by Improvision software, on a Zeiss Axiovert microscope using a 100×/1.4 Planapochromat objective and Chroma Technology filter sets.
For confocal microscopy (Figs. 4, 5, and 9), fixed and stained cells were centrifuged onto polylysine-coated coverslips (Sawin and Nurse, 1996), rinsed to remove nonadherent cells, and mounted in 90% glycerol/20 mM Tris, pH 8.5, containing 1 mg/ml phenylene diamine. Images were collected with a confocal microscope (model TCSM; Leica, Deerfield, IL) and optical sections were projected using Leica software. Maximum projections are shown in Figs. 4 and 9, and a summation projection is shown in Fig. 5. All images were subsequently processed using Adobe Photoshop (San Jose, CA).
Results
Reorientation of Polarized Growth by TBZ
For reasons originally related to determining the potential role of cytoplasmic microtubules in the regulation of NETO, we added the microtubule inhibitor TBZ to cells in a cdc10-129 block-and-release experiment. cdc10-129 mutant cells were arrested in a G1 pre-NETO state (Nurse et al., 1976; Mitchison and Nurse, 1985) by a 4-h temperature shift to 36°C, at which time either TBZ or carrier DMSO alone was added to cultures. After an additional 30 min of incubation at 36°C, cultures were shifted down to the permissive temperature (25°C), and cell growth and morphology followed for an additional 4–5 h, in the continued presence of TBZ (Fig. 1 A). Most control and TBZ-treated cells appeared eventually to undergo NETO after shift-down, although TBZ delayed NETO slightly (data not shown). Strikingly, a considerable proportion of cells to which TBZ had been added also formed branches from their middles (Fig. 1, F and H). Branching occurred with high synchrony, reaching maximal levels of ∼35–40% branched cells within 2 h after shift-down (Fig. 1 B). Branches continued to grow throughout the experiment, and inspection of cell length at different times after shift-down showed that a significant fraction of subsequent extensile cell growth in branched cells was along this new axis of polarized growth (Fig. 1, D, F, and H). By contrast, cells to which only DMSO had been added did not form branches to any appreciable extent and merely elongated until cell division (Fig. 1, C, E, and G). We also performed the same experiments with strains carrying the nda3-TB101 allele of β-tubulin, which confers increased resistance to benzamidazole drugs (Yamamoto, 1980; Umesono et al., 1983; our unpublished data). Virtually no branches were seen in cdc10-129 nda3-TB101 double mutants treated either with DMSO or TBZ (Fig. 1 B and additional data not shown), confirming that the effects of TBZ on branching were specific to tubulin.
Cell Cycle Effects
We next sought to establish more clearly what specific conditions were required to reorient the growth axis. To examine the contribution of cell cycle state to branching, we repeated the same experiment with wild-type cells and with cdc25-22 mutants, which arrest in late G2, post-NETO (Thuriaux et al., 1980; Mitchison and Nurse, 1985). Under the conditions shown in Fig 1 A (we shall refer to this as a “branching experiment”), both wild-type and cdc25 mutant cells formed branches at only a low frequency (Fig. 2 A). These experiments indicate that the ability to reorient polarized growth in the presence of TBZ is strongly dependent on the cell cycle state.
Temperature-sensitive cell cycle mutants defective in G1/S functions in fission yeast can arrest either in G1 with a 1C DNA content (e.g., cdc10-129, cdc20-M10, and cdc22-M45 mutants) or with a 1C-2C DNA content (e.g., cdc17-K42, cdc18-K46, cdc19-P1, and cdc21-M68 mutants; Nasmyth and Nurse, 1981), although all of these mutants fail to execute NETO and thus exhibit only monopolar growth upon cell cycle arrest (Mitchison and Nurse, 1985). To investigate whether the ability to branch in TBZ was a specific consequence of the cdc10-129 mutation, a G1 state, or a pre-NETO state, we repeated branching experiments with these mutants. As shown in Fig. 2 B, both mutants that do not enter S-phase (cdc10 and cdc20) and mutants that initiate DNA replication (cdc18 and cdc21) formed branches at frequencies between 20 and 35%. Variation in branching frequency may reflect different extents of recovery from the cell cycle block. Similar results were obtained with cdc17, cdc19, and cdc22 mutants (not shown). This demonstrates that the ability to reorient polarized growth is not specific to cdc10 mutants or to a G1 or 1C state but rather is correlated with being in a pre-NETO state.
Cells carrying the orb2-34 mutation, a viable allele of the essential PAK kinase shk1/pak1 (Marcus et al., 1995; Ottilie et al., 1995; Verde et al., 1998), exhibit only monopolar growth throughout their life cycle (Snell and Nurse, 1994; Verde et al., 1995). Interestingly, in branching experiments orb2-34 cdc10-129 double mutants formed branches at only very low levels (Fig. 2 C), suggesting that molecules involved in regulating the transition to bipolar growth may also play important roles in reorienting polarized growth (see Discussion). We also tested branching in cells deleted for the ral3/scd2 + gene, which leads to a partial defect in polarized growth and a sterile phenotype (Fukui and Yamamoto, 1988; Chang et al., 1994). cdc10-129 ral3Δ double mutants were able to branch, albeit at lower frequencies than normal (Fig. 2 C). Mutants with a more pronounced loss of polarity (e.g., ras1Δ, ral1Δ/scd1Δ, and orb mutants; Fukui and Yamamoto, 1988; Chang et al., 1994; Snell and Nurse, 1994; Verde et al., 1995) could not be tested easily in this assay because of their round phenotype (data not shown).
Mutation of the tea1 + gene or the pom1 + gene can lead to bent or T-shaped cells at 36°C, as well as defects in bipolar growth, with varying penetrance (Verde et al., 1995; Mata and Nurse, 1997; Bähler and Pringle, 1998). Both cdc10-129 tea1Δ and cdc10-129 pom1Δ double mutants formed branches to the same extent as cdc10 single mutants in branching experiments (Fig. 2 C), indicating that neither of these gene products is required for efficient branching in TBZ. Moreover, the increase in branched double-mutant cells over time, relative to their initial release from the cell cycle block (i.e., after several hours at 36°C, which uncovers the mutant phenotype), implies that microtubules still make some contribution to maintaining normal cell polarity when tea1 or pom1 function is absent.
Temperature Effects
Because our experiments using cell cycle mutants involved temperature shifts, which could affect the cytoskeleton, or cell physiology in general, we investigated the possible contribution of temperature in the reorientation of polarized growth. Several experiments indicated that in addition to cell cycle state, elevated temperature is critical for branch formation. As shown in Fig. 3 A, if the addition of TBZ to cdc10-129 cells blocked at 36°C was delayed until the time of shift-down to 25°C, cells failed to form branches. Similarly, if TBZ was added after 4 h at 36°C, and cells were then chilled in an ice slurry for the next 30 min before being returned to 25°C, branches did not form (data not shown). In another approach, we used HU to block cells at G1/S in a temperature-independent fashion. Wild-type cultures grown at 25°C were supplemented with HU and shifted to 36°C for 3.5 h, at which time TBZ was added, and after 30 min cells were washed into HU-free medium containing TBZ, at 25°C. Under these conditions, we routinely observed reorientation of polarized growth in 15– 20% of cells, about half as much as in cdc10-129 cells (Fig. 3 B). However, if the HU block was carried out at 25 or 32°C, relatively little branching was seen (1–5%; Fig. 3, B and C).
These experiments strongly suggest that elevated temperature is important for efficient branching, but because cells grow more quickly at high temperature, it was possible that the role of temperature might simply be to produce longer pre-NETO cells, which, for reasons yet unknown, might be more likely to branch. We therefore repeated the experiment of blocking cells with HU at 36°C, but shifted cells down to 25°C 15 min before addition of TBZ, washing out HU 30 min after addition of TBZ. Under these conditions, cell length at the time of release from HU was essentially unchanged (by forward scattering data; not shown), but the frequency of branched cells decreased significantly, as shown in Fig. 3 C. We also repeated the HU experiments at 25°C using cells containing three copies of the wild-type wee1 + gene (Russell and Nurse, 1987). This increased gene dosage results in increased cell length at birth, and as a consequence, at the time of release from HU, wee1-3x cells blocked at 25°C were as long or longer than wild-type cells blocked at 36°C (data not shown). However, wee1-3x cells did not branch more than control wild-type cells (Fig. 3 C). These results indicate that efficient branching requires pre-NETO cells at 36°C, in which the normal interphase microtubule array has been disrupted. To investigate the structural basis for this branching, we next analyzed the localization of cytoskeletal elements that might be involved in the reorientation of cell growth polarity.
Microtubule Redistribution during Branching
We examined the distribution of microtubules in cdc10-129 branching experiments by indirect immunofluorescence (Fig. 4). In DMSO-treated cells, microtubules appeared normal and generally extended all the way to cell ends (Fig. 4, A–F). By contrast, in cells treated with TBZ, most microtubules disappeared (Ayscough et al., 1993), leaving short microtubules or microtubule stubs in the vicinity of the nucleus (Mata and Nurse, 1997) that remained there throughout the course of experiments (Fig. 4, A′–F′). In most cells, these short microtubules eventually became a more prominent bundle (judging by an increase in fluorescence intensity), usually associated with and sometimes wrapped around the outer nuclear surface. These bundles are not aberrant intranuclear spindles, as the appearance of bundles precedes the timing of mitosis in control cells, and bundles often leave the vicinity of the nucleus and extend into the cytoplasm (Fig 4 F′).
We also observed microtubules in cdc10-129 nda3-TB101 mutants under the same conditions. In DMSO, microtubules in cdc10 nda3 double mutants were indistinguishable from those in cdc10 single mutants. However, in contrast to cdc10 mutants, the normal microtubule distribution was only subtly affected by TBZ in cdc10 nda3 mutants. Double mutants showed somewhat higher soluble tubulin staining (Fig. 5, C and D), although the differences were not as pronounced as in nda3 + cells (Fig. 5, A and B), and in a few cases, microtubules no longer reached the very ends of cells (Fig. 5 D, arrows). These mild but detectable effects of (100 μg/ml) TBZ on microtubules in the cdc10-129 nda3-TB101 mutants were similar to those seen with 60 μg/ml TBZ in cdc10-129 single mutants, a concentration at which little or no branching occurs (data not shown).
The observations of microtubules in the TBZ-treated cdc10-129 mutants (Figs. 4 and 5) indicate that in TBZ-treated cells, a local concentration of microtubules remains in the cell middle, in a region where prospective branches may subsequently form. In addition, we note that when branches have extended and/or cell length is increased, microtubule ends are typically far away from sites of active growth. (We return to these issues in the Discussion.) It should also be noted that similar distributions of microtubules were seen in wild-type cells upon TBZ treatment, although these do not form branches (data not shown).
Multiple Modes of Actin Organization in the Absence of Microtubules
In fission yeast, actin is highly enriched at sites of polarized growth (Marks et al., 1986). We used a modified method of rhodamine-phalloidin staining (Marks and Hyams, 1985) to analyze changes in the F-actin cytoskeleton concomitant to the reorientation of polarized growth (see Materials and Methods). As described previously, in G1-arrested cdc10-129 cells, which are blocked before NETO, actin was strongly polarized to a single growing end; this is the “old” end preexisting in the mother cell, not the “new” end created by the most recent cell division, which remains dormant until NETO (Marks and Hyams, 1985; Mitchison and Nurse, 1985). Actin dots were closely apposed to the cell surface, and in many cases actin cables were seen directed into the end (Fig. 6, A–D). By contrast, after 30 min in TBZ (i.e., at time of shift-down), actin organization was considerably altered. Actin dots were either randomized throughout cells or, if still near cell ends, no longer tightly associated with the cell cortex (Fig. 6, E–H). Actin cables could still be observed but no longer pointed strongly to cell ends (not shown). 1–1.5 h after shift-down, we observed small patches of actin dots in cell middles (Fig. 6, I–L), in approximately the same fraction of cells as would later form branches (29/100 cells). By 2 h after shift-down, a recovery of actin to the extreme cell cortex became obvious, with an increase of actin in the ends of branches and also at either or both of the preexisting cell ends in both branched and unbranched cells (Fig. 6, M–P; see also Fig. 8). We note that at these times, residual microtubules remain far away from cell ends (see Fig. 4 E′). After 3 h, actin in branched cells appeared to be increased at cell ends as well as branches, and in many cases actin cables were highly pronounced, perhaps indicating an involvement in actin redistribution. At this time we could also see the beginnings of actin ring formation in DMSO-treated controls cells (not shown). By 4 h after shift-down, many cells in TBZ also had begun septation (see Chang et al., 1996), often creating aberrant actin rings reflecting their branched morphology (Fig. 6, U–X).
The dispersal of cortical actin soon after TBZ addition was striking and therefore investigated further in wild-type, cdc10-129, and cdc25-22 strains as well as cdc10-129 nda3-TB101 double mutants, scoring nonbranched cells together with branched cells. In all nda3 + strains, we observed a disruption of global actin organization, in most cases within 30 min after TBZ addition (Fig. 7 A), while in the cdc10 nda3 double mutant, only a mild loss in actin organization was apparent, which is consistent with the effects on microtubule distribution described above. (In the experiment shown in Fig. 7 A, wild-type cells seemed to disorganize more slowly, but this was not always reproduced; for example see Fig. 7 B.) Recovery of actin to the cortex in the presence of TBZ was also seen in all strains, although apparently more slowly in cdc10 mutants, and at times when actin patches at cell middles could be seen in cdc10 mutants (Fig. 6, I–L), the bulk of cortical actin remained disorganized (Fig. 7 A). We also examined whether the disruption of actin by thiabendazole was specific to the temperature shifts used in our experiments, using exponentially growing wild-type cells and cdc10-129 mutants. Under all conditions tested, actin became deranged within ∼30 min of TBZ addition, independent of temperature and cell cycle state (Fig. 7 B).
While quantitating the recovery of actin to the cortex, we noticed that most cells in early stages of branching contained appreciable amounts of actin only at the “branch end,” or at the branch end and one additional end, while at later times branched cells could accumulate actin at all three ends (Fig. 7 C; see also Fig. 6, M–V). To determine whether actin normally found at the old ends of cells before NETO and TBZ addition was returning faithfully to old ends during recovery to the cell cortex, we costained rhodamine-phalloidin–stained cdc10-129 cells with Calcofluor. Birth scars created by septum formation stain poorly with Calcofluor, and because new ends initiate growth later than old ends, the new end of a cell can be identified as the end closest to a birth scar (Streiblova and Wolf, 1972; Mitchison and Nurse, 1985). Interestingly, in cells containing actin at the branch and at one additional end, this was found to be either the old end or new end in roughly equal measure (28/52 cells vs 24/52 cells, respectively; Fig. 8, A–D), suggesting that after derangement of actin and other cortical components by TBZ (see below), the cues specifying preference for growth at old vs new ends are effectively randomized. This view was also supported by the patterns of actin and Calcofluor staining in cells that did not branch. Among cells with actin at a single end, this was very often the new end (35/100 cells; Fig. 8, E–H), whereas in DMSO-treated control cells, we never observed actin only at the new end (0/100 cells).
Disruption and Relocalization of Other Proteins Involved in Polarized Growth
The nature of the dispersal and return of actin in the presence of TBZ led us to examine two additional proteins that have similar localizations and are also involved in the control of polarized growth. Tea1 is localized to the ends of cells whether they are growing or not, and depolymerization of microtubules with TBZ has been shown to disrupt this localization (Mata and Nurse, 1997). Using cdc10-129 cells in branching experiments, we obtained similar results before and up to ∼1.5 h after TBZ addition (Fig. 9, A and B). However, at later times we observed a significant recovery of tea1 to cell ends, in both branched and unbranched cells, without any significant regrowth of microtubules (Fig. 9, C and D). The extent of recovery varied and, as shown in Fig. 9, was incomplete as judged by cytoplasmic tea1 staining. Nevertheless, these results indicate that tea1, like actin, can eventually return to cell ends in the absence of microtubules.
We also examined the effect of TBZ on the localization of a fusion protein between GFP and ral3 (Fukui and Yamamoto, 1988; Chang et al., 1994). Ral3 interacts with scd1/ral1 and cdc42sp (Chang et al., 1994), and as a homologue of the budding yeast polarity protein Bem1p, which is present at bud tips (Chenevert et al., 1992; Pringle et al., 1995), ral3 might be expected to be localized to cell ends. When expressed at moderate levels (see Materials and Methods), ral3–GFP was found exclusively in actively growing cortical regions, as shown in a cdc25 block-and- release experiment (Fig. 10). In cdc25 mutants blocked post-NETO in late G2, ral3–GFP was located at both ends of cells (Fig. 10, two ends), while after release from the cell cycle block, when growth is redirected to the middle of the cell in preparation for septation, ral3–GFP redistributed to form a ribbon in the cell middle during early mitosis, which later narrowed during cytokinesis (Fig. 10, middle and ring). Upon completion of septation, ral3–GFP returned to the previously existing old ends, where extensile growth initially occurs (Fig. 10, ring & ends and new ends).
In a branching experiment, ral3–GFP localization in cdc10 cells was quickly altered by addition of TBZ, leaving the growing old end and acquiring a weaker or random distribution in the cell cortex (Fig. 11, A–C). At later times, ral3–GFP recovered to the cortex, forming a small patch near the cell middle in some cells. This was seen in a similar number of cells as would later form branches and appeared to mark the future branch site, after which ral3– GFP was localized to the end of the branch. In cells that did not branch, ral3–GFP returned to the original cell ends (Figs. 11, D–H, and 12 A), and a similar disruption and recovery were observed in wild-type cells as well, with some cells localizing ral3–GFP to the cell middle (data not shown). By contrast, in cdc10 nda3 double mutants, a relatively small perturbation in ral3–GFP localization was seen, without a significant increase in cells bearing ral3– GFP at the cell middle (Fig. 12 B).
The kinetics of ral3–GFP arrival at this middle cortical site in cdc10-129 mutants (Fig. 12 A) suggested that localization of ral3–GFP to the cell middle might precede the formation of the actin patch that also appears before branch formation. To test this further, we added the actin inhibitor LatA (Ayscough et al., 1997) to cdc10 mutants treated with TBZ. Disruption of the F-actin cytoskeleton with LatA completely inhibited both cell growth and branching but did not prevent an accumulation of ral3– GFP at the cell middle (Fig. 11, I and J; additional data not shown), implying that ral3–GFP recruitment to the cell middle is independent of actin. However, in LatA-treated cells, ral3–GFP middle localization was typically found more as a ribbon than a patch and not as strongly consolidated to a single region, suggesting that actin may nevertheless play a role in concentrating ral3–GFP after its initial redistribution to the cell middle.
Discussion
We have shown that a new axis of polarized growth is established in fission yeast upon TBZ-induced disruption of cytoplasmic microtubules. This provides a simple system for studying the establishment of cell polarity, one in which the creation of a new growing end can be dissociated from the complexities of cytokinesis and septation. The extent and synchrony of branching seen in our experiments is much greater than has been described previously with cold-sensitive tubulin mutants or microtubule-destabilizing drugs (Walker, 1982; Toda et al., 1983; Umesono et al., 1983) and depends on the convergence of several conditions. Branching occurs at high frequency only when TBZ is added to cells that have not gone through NETO, the transition from monopolar to bipolar growth, which usually occurs in G2 (Mitchison and Nurse, 1985). This suggests that some of the mechanisms normally used in NETO are also involved in branching, which is consistent with our observation that orb2-34 mutants, defective in bipolar growth, are also defective in branching. However, other genes involved in bipolar growth, such as pom1 +, and to a lesser extent tea1 + (Verde et al., 1995; Bähler and Pringle, 1998), are not required for branching in TBZ.
In addition, branching is efficient only when TBZ is added to cells at elevated temperature (36°C). Why high temperature is required is not yet clear. This could be a consequence of general changes in cell physiology at constant elevated temperature, although transient “heat-shock” effects of elevated temperature are likely to be minimal after 4 h of incubation. It is also possible that there may be specific temperature-dependent effects of TBZ (Botstein et al., 1997), although we have not detected obvious differences in fission yeast by immunofluorescence (Sawin, K.E., unpublished data). We suspect there may be specific temperature-sensitive components in the pathways that lead to branching, and such components could be identified in future work. A similar temperature-dependent phenomenon is observed in tea1 and tea2 morphological mutants in the absence of TBZ: At 25°C, many cells are bent, but none branched, while at 36°C, up to 15% branched cells can form (Verde et al., 1995; Mata and Nurse, 1997). It should be noted, however, that the requirement for high temperature does not appear to be absolute since branching is seen, albeit at low frequencies, in cold-sensitive tubulin mutants at 18–20°C (Toda et al., 1983).
Dynamics of Actin and Cortical Components
Actin, tea1, and ral3–GFP all adopt aberrant distributions after the depolymerization of microtubules, suggesting a close coupling between microtubules and actin and other cortical components in fission yeast. Functional interactions between microtubules and actin filaments are recognized in many behaviors of higher eukaryotic cells, including neuronal growth cone and fibroblast cell motility (Goslin et al., 1989; Bershadsky and Vasiliev, 1993; Tanaka and Sabry, 1995; Challacombe et al., 1997) and cytokinesis (Fishkind and Wang, 1995; Rappaport, 1996; Wheatley and Wang, 1996). Relatively little is known about the molecules or mechanisms mediating these interactions (Gavin, 1997), although some microtubule-associated proteins may also bind to actin (see Cunningham et al., 1997), and more indirect links may also exist (see Luntz and Miller, 1998). The system described here offers the possibility of further investigating these issues from a genetic perspective.
We also observed that ral3–GFP, actin, and tea1 could return to cell ends in the absence of recovery of the microtubule cytoskeleton, tea1 more slowly than the others. This presents a paradox, for if localization of these proteins to cell ends normally depends on microtubules, how do they return in the absence of microtubule recovery? We can imagine two explanations. First, there may be sufficient recovery of microtubules, perhaps only transiently, to allow cortical markers such as tea1 and actin to return to cell ends in a microtubule-dependent manner. Since we have no evidence for even a modest recovery of microtubules, we consider this unlikely. We favor a second view, that additional, microtubule-independent mechanisms may exist to restore protein localization to cell ends. The observations that the recovery of tea1 was often incomplete and that in many cells actin was found at new ends but not old ends suggest that recovery may follow physiological principles different from those used before microtubule disruption, and/or that microtubule depolymerization makes two previously different ends the same. One candidate mechanism is that proteins remaining at cell ends in the presence of TBZ act as landmarks to direct the subsequent return of other proteins. For example, although most of tea1 is lost from cell ends during TBZ treatment, a small but clearly visible fraction remains behind in nearly all cells (Mata and Nurse, 1997 and Fig. 8).
The microtubule-dependent localization of tea1 at cell ends has been shown to be highly dynamic (Mata and Nurse, 1997), implying both a fast, microtubule-dependent on-rate and a relatively short residence time at cell ends. Our data showing the accumulation of tea1 to near-normal levels at cell ends in the absence of rapid microtubule-based delivery would seem to require that the residence time of tea1 at cell ends must increase during recovery. More generally, we would speculate that changes in turnover of cortical proteins at cell ends may be important for the recovery seen in our experiments. This could involve the activation of a specific program in response to microtubule depolymerization, as a kind of fail-safe mechanism; alternatively, changes in the dynamics of cortical protein complexes could simply be an indirect consequence of microtubule depolymerization, as would occur, for example, if the factors that promote turnover of complexes were themselves delivered by microtubules.
Mechanics of Branch Formation
Why do only some cells in a population form branches, and what determines the site of actin accumulation at cell middles before branching? Our experiments suggest two possible models (Fig. 13): First, by analogy to hypothesized microtubule function in normal cells (Mata and Nurse, 1997), residual microtubules left after TBZ treatment could contribute to branch formation by targeting the growth machinery to an incorrect place. Although residual microtubule ends do not seem to point to a specific cortical spot before branching in the way that microtubules point towards ends of untreated cells (see Fig. 4), a high local concentration of microtubules or microtubule ends in the middle of some cells could serve as a kind of attractor for components of the growth machinery. These might then diffuse to the nearby cortex and accumulate to an amount sufficient for the self-organization and maintenance of a new growth axis.
Figure 13.

A model for the reorganization of cellular architecture during branching. In A, before TBZ addition, microtubules extend the length of a pre-NETO cell. tea1 is found at both ends, and actin and ral3 are at the growing end. Upon depolymerization of microtubules in B, actin leaves the cell cortex, tea1 is mostly delocalized, and a complex containing ral3 is initially delocalized and later concentrated in the cell middle. In C, actin is recruited to a site in the cell middle, either through the high local concentration of microtubules in the vicinity of the nucleus or by the ectopic ral3 complex, resulting in the initiation of growth along a new axis in D. Growth continues in E, with continued recovery of tea1 and actin to cell ends in the absence of microtubules.
A second model emerges from the observation that before branching, ral3–GFP can move to the cell middle, temporally preceding and independent of the appearance of actin patches. This suggests that relocated cortical complexes containing ral3 and other proteins (“ral3 complexes”) may provide the initial cue for the recovery of actin and other components of the growth machinery, and cell-to-cell variation in the extent to which ral3 complexes relocate from ends might then determine whether, and where, a cell will branch. This second model requires some qualification. First, our results have been obtained with ral3–GFP rather than endogenous ral3 (although ral3– GFP rescues a ral3Δ strain; see Materials and Methods). Second, because ral3 itself is not required for branching, it seems more plausible that a protein in the ral3 complex other than ral3 itself may be a critical determinant. In budding yeast, the ral3 homologue Bem1p is thought to play a scaffolding role and interacts with many proteins involved in cell polarity and signal transduction (Peterson et al., 1994; Leeuw et al., 1995; Lyons et al., 1996; Park et al., 1997). These include Ste20p, the homologue of shk1/pak1/ orb2, which we have shown to be important for branching. Finally, as even nonbranching wild-type cells show some delocalization of ral3–GFP upon microtubule disruption, we should emphasize that the relocation of a ral3 complex would be interpreted as a cue for branching only when cells are generally capable of branching, i.e., subject to cell cycle and temperature controls.
These two views of the mechanisms underlying branching are not mutually exclusive, as ral3–GFP localization could itself be dependent on residual microtubules left by TBZ treatment. However, tea1, whose localization in wild-type cells depends on microtubules, does not behave like ral3–GFP, and thus a simple model based on microtubule distributions seems unlikely. In addition, it is not yet clear to what extent ral3–GFP localization in TBZ is a direct consequence of microtubule depolymerization or an indirect consequence in response to actin reorganization. In both cdc10-129 and wild-type cells, ral3–GFP localization to cell ends is altered by LatA-induced actin disruption, but these effects are not as pronounced as those seen in TBZ; tea1 localization is only subtly affected by actin disruption (Sawin, K.E., unpublished data; see also Mata and Nurse, 1997). From this it seems likely that several factors contribute to branch site selection and establishment. Further analysis of the localization of ral3 and its associated proteins will help to address these questions, as well as whether a specific role is played by the position of the nucleus, which roughly corresponds to the site of cortical patches and branching (Sawin, K.E., unpublished data).
Implications for Microtubule Function in Cell Polarity
Why do fission yeast normally grow only at their ends? One idea is that cell form may be dictated by microtubules constantly exploring the three-dimensional space of the cell and aligning along its long axis, thereby defining sites for new growth, presumably through microtubule-dependent transport of determinants or components of cell growth machinery. Evidence for this view comes from a molecular analysis of the tea1 protein, which is required for accurate cell shape and whose localization to cell ends depends on an intact microtubule cytoskeleton (Mata and Nurse, 1997). However, because cells deleted for the tea1 gene often grow close to normal positions of growth (Mata and Nurse, 1997) and in many cases disruption of microtubules either by drug or mutation does not radically alter cell shape (Toda et al., 1983; Umesono et al., 1983; our data for wild-type cells), it is likely that there are additional mechanisms that define intracellular space and sites of growth. Opposing a microtubule-centric dynamic view is the view that specific cortical proteins might act as more static landmarks, or “tags,” to mark regions of the cell surface, as in current models of bud-site selection in S. cerevisiae (Pringle et al., 1995; Roemer et al., 1996; Mata and Nurse, 1998) and implied here by the return of actin and tea1 to cell ends in the absence of microtubule recovery. Our experiments argue for a compromise between these two extremes, and we suggest that both models may apply. From our observations of cell–cycle dependent branching, we would argue that the relative importance of microtubules for cell polarity may vary in the cell cycle, and that microtubules are needed most during periods of transition of the actin cytoskeleton—that is, during NETO, and perhaps after cytokinesis as well. The reason for this microtubule requirement could be that during transition periods, the overhaul of the actin cytoskeleton may be so extreme that landmarks are damaged, and microtubules are thus needed to deliver components such as tea1, either to help stabilize landmarks or to complement their function. Outside these transitions, proteins normally delivered by microtubules may no longer be as essential as helpers or place-holders, and mechanisms involving landmarks, which might be established at cell ends, for example, during cytokinesis (Mata and Nurse, 1998) may be sufficient to maintain a roughly normal cell shape. Working in concert, these two mechanisms would serve to maintain fission yeast morphology throughout the cell cycle.
Relation to Higher Eukaryotes
As microtubules contribute to many aspects of polarity in eukaryotic cells (see Introduction), it remains to be seen how similar these functions are between fission yeast and higher eukaryotes. However, two parallels may be worth noting. The first relates to the loss and subsequent redistribution of actin, tea1, and ral3–GFP in TBZ. In human intestinal epithelial cells, microtubule disruption has drastic effects on the rate of polarized delivery of newly synthesized apical proteins, by both the direct and indirect pathways (Matter et al., 1990; Gilbert et al., 1991). Under such conditions, while some apical proteins nevertheless eventually achieve a polarized distribution, others are less successful and end up in basolateral regions, which can often assume apical characteristics, including the formation of microvilli (Matter et al., 1990; Gilbert et al., 1991). We would suggest that in both these cells and in fission yeast, proper polarization depends on combining microtubule-independent targeting with an important kinetic component provided by microtubule-dependent transport, and that changes in kinetics can have long-lasting effects. The second parallel relates to the phenomenon of branching itself. In cultured neurons from embryonic chick dorsal root ganglia, disruption of microtubules leads to a branched morphology in preterminal regions of the neurite, as a result of the ectopic formation of lamellar regions resembling growth cones in both morphology and behavior (Bray et al., 1978). This implies that one “role” of a normal microtubule distribution in neurites may be to locally suppress the formation of new growth cones in regions away from the existing growth cone, and by analogy, in fission yeast, a normal microtubule distribution may act to suppress the formation of a new axis of polarized growth in regions away from the ends of cells.
Acknowledgments
We thank J. Mata and K. Gull for antibodies, Y. Nakaseko, M. Yanagida, and M. Yamamoto for strains and plasmids, K. Ayscough for latrunculin A, A. Stokes and R. Pepperkok for help with CCD imaging, and P. Jordan for help with confocal imaging. We also thank D. Brunner, J. Mata, A. Murray, and G. Warren for critical reading of the manuscript, and members of the cell cycle laboratory, including J. Mata and D. Brunner, for discussions.
This work was supported by the ICRF, the Helen Hay Whitney Foundation, and the Leukemia Society of America. K.E. Sawin initiated this work as a Fellow of the Helen Hay Whitney Foundation and continued as a Special Fellow of the Leukemia Society of America.
Abbreviations used in this paper
- GFP
green fluorescent protein
- HU
hydroxyurea
- LatA
latrunculin A
- NETO
New-End Take-Off
- TBZ
thiabendazole
Footnotes
Address all correspondence to K.E. Sawin, Imperial Cancer Research Fund, 44 Lincoln's Inn Fields, London WC2A 3PX, UK. Tel.: 44-171-269-3276. Fax: 44-171-269-3610. E-mail: sawin@europa.lif.icnet.uk
References
- Ayscough K, Hajibagheri NM, Watson R, Warren G. Stacking of Golgi cisternae in Schizosaccharomyces pomberequires intact microtubules. J Cell Sci. 1993;106:1227–1237. doi: 10.1242/jcs.106.4.1227. [DOI] [PubMed] [Google Scholar]
- Ayscough KR, Stryker J, Pokala N, Sanders M, Crews P, Drubin DG. High rates of actin filament turnover in budding yeast and roles for actin in establishment and maintenance of cell polarity revealed using the actin inhibitor latrunculin-A. J Cell Biol. 1997;137:399–416. doi: 10.1083/jcb.137.2.399. [DOI] [PMC free article] [PubMed] [Google Scholar]
- Bähler J, Pringle JR. Pom1, a fission yeast protein kinase that provides positional information for both polarized growth and cytokinesis. Genes Dev. 1998;2:1356–1370. doi: 10.1101/gad.12.9.1356. [DOI] [PMC free article] [PubMed] [Google Scholar]
- Beinhauer JD, Hagan IM, Hegemann JH, Fleig U. Mal3, the fission yeast homologue of the human APC-interacting protein EB-1 is required for microtubule integrity and the maintenance of cell form. J Cell Biol. 1997;139:717–728. doi: 10.1083/jcb.139.3.717. [DOI] [PMC free article] [PubMed] [Google Scholar]
- Bershadsky AD, Vasiliev JM. Mechanisms of regulation of pseudopodial activity by the microtubule system. Symp Soc Exp Biol. 1993;47:353–373. [PubMed] [Google Scholar]
- Botstein, D., D. Amberg, J. Mulholland, T. Huffaker, A. Adams, D. Drubin, and T. Stearns. 1997. The yeast cytoskeleton. In The Molecular and Cellular Biology of the Yeast Saccharomyces. J.R. Pringle, J.R. Broach, and E.W. Jones, editors. Cold Spring Harbor Laboratory Press, Cold Spring Harbor, NY. 1–90.
- Bray D, Thomas C, Shaw G. Growth cone formation in cultures of sensory neurons. Proc Natl Acad Sci USA. 1978;75:5226–5229. doi: 10.1073/pnas.75.10.5226. [DOI] [PMC free article] [PubMed] [Google Scholar]
- Challacombe JF, Snow DM, Letourneau PC. Dynamic microtubule ends are required for growth cone turning to avoid an inhibitory guidance cue. J Neurosci. 1997;17:3085–3095. doi: 10.1523/JNEUROSCI.17-09-03085.1997. [DOI] [PMC free article] [PubMed] [Google Scholar]
- Chang EC, Barr M, Wang Y, Jung V, Xu H-P, Wigler MH. Cooperative interaction of S. pombeproteins required for mating and morphogenesis. Cell. 1994;79:131–141. doi: 10.1016/0092-8674(94)90406-5. [DOI] [PubMed] [Google Scholar]
- Chang F, Woollard A, Nurse P. Identification and characterization of fission yeast mutants defective in actin ring assembly and placement. J Cell Sci. 1996;109:131–142. doi: 10.1242/jcs.109.1.131. [DOI] [PubMed] [Google Scholar]
- Chenevert J, Corrado K, Bender A, Pringle J, Herskowitz I. A yeast gene (BEM1) necessary for cell polarization whose product contains two SH3 domains. Nature. 1992;356:77–79. doi: 10.1038/356077a0. [DOI] [PubMed] [Google Scholar]
- Cole NB, Lippincott-Schwartz J. Organization of organelles and membrane traffic by microtubules. Curr Opin Cell Biol. 1995;7:55–64. doi: 10.1016/0955-0674(95)80045-x. [DOI] [PubMed] [Google Scholar]
- Cooley L, Theurkauf WE. Cytoskeletal functions during Drosophila oogenesis. Science. 1994;266:590–596. doi: 10.1126/science.7939713. [DOI] [PubMed] [Google Scholar]
- Cormack B, Valdivia RH, Falkow S. FACS-optimized mutants of the green fluorescent protein. Gene. 1996;173:33–38. doi: 10.1016/0378-1119(95)00685-0. [DOI] [PubMed] [Google Scholar]
- Cunningham CC, Leclerc N, Flanagan LA, Lu M, Janmey PA, Kosik KS. Microtubule-associated protein 2c reorganized both microtubules and microfilaments into distinct cytological structures in an actin-binding protein-280–deficient melanoma cell line. J Cell Biol. 1997;136:845–857. doi: 10.1083/jcb.136.4.845. [DOI] [PMC free article] [PubMed] [Google Scholar]
- Drubin DG, Nelson WJ. Origins of cell polarity. Cell. 1996;84:335–344. doi: 10.1016/s0092-8674(00)81278-7. [DOI] [PubMed] [Google Scholar]
- Fishkind DJ, Wang Y-L. New horizons for cytokinesis. Curr Opin Cell Biol. 1995;7:23–31. doi: 10.1016/0955-0674(95)80041-7. [DOI] [PubMed] [Google Scholar]
- Fukui Y, Yamamoto M. Isolation and characterization of Schizosaccharomyces pombemutants phenotypically similar to ras1−. Mol Gen Genet. 1988;215:26–31. doi: 10.1007/BF00331298. [DOI] [PubMed] [Google Scholar]
- Gard DL. Axis formation during amphibian oogenesis: re-evaluating the role of the cytoskeleton. Curr Top Dev Biol. 1995;30:213–250. [PubMed] [Google Scholar]
- Gavin RH. Microtubule-microfilament synergy in the cytoskeleton. Int Rev Cytol. 1997;173:207–242. doi: 10.1016/s0074-7696(08)62478-x. [DOI] [PubMed] [Google Scholar]
- Gilbert T, Le Bivic A, Quaroni A, Rodriguez-Boulan E. Microtubule organization and its involvement in the biogenetic pathways of plasma membrane proteins in Caco-2 intestinal epithelial cells. J Cell Biol. 1991;113:275–288. doi: 10.1083/jcb.113.2.275. [DOI] [PMC free article] [PubMed] [Google Scholar]
- Goslin K, Birgbauer E, Banker G, Solomon F. The role of cytoskeleton in organizing growth cones: a microfilament-associated growth cone component depends upon microtubules for its localization. J Cell Biol. 1989;109:1621–1631. doi: 10.1083/jcb.109.4.1621. [DOI] [PMC free article] [PubMed] [Google Scholar]
- Hagan IM, Hyams JS. The use of cell division cycle mutants to investigate the control of microtubule distribution in the fission yeast Schizosaccharomyces pombe. . J Cell Sci. 1988;89:343–357. doi: 10.1242/jcs.89.3.343. [DOI] [PubMed] [Google Scholar]
- Heidemann SR. Cytoplasmic mechanisms of axonal and dendritic growth in neurons. Int Rev Cytol. 1996;165:235–296. doi: 10.1016/s0074-7696(08)62224-x. [DOI] [PubMed] [Google Scholar]
- Huffaker TC, Thomas JC, Botstein D. Diverse effects of β-tubulin mutations on microtubule formation and function. J Cell Biol. 1988;107:1997–2010. doi: 10.1083/jcb.106.6.1997. [DOI] [PMC free article] [PubMed] [Google Scholar]
- Hyman AA, White JG. Determination of cell division axes in the early embryogenesis of Caenorhabditis elegans. . J Cell Biol. 1987;105:2123–2135. doi: 10.1083/jcb.105.5.2123. [DOI] [PMC free article] [PubMed] [Google Scholar]
- Jacobs CW, Adams AE, Szaniszlo PJ, Pringle JR. Functions of microtubules in the Saccharomyces cerevisiaecell cycle. J Cell Biol. 1988;107:1409–1426. doi: 10.1083/jcb.107.4.1409. [DOI] [PMC free article] [PubMed] [Google Scholar]
- Kupfer A, Dennert G, Singer SJ. Polarization of the Golgi apparatus and the microtubule-organizing center within cloned natural killer cells bound to their targets. Proc Natl Acad Sci USA. 1983;80:7224–7228. doi: 10.1073/pnas.80.23.7224. [DOI] [PMC free article] [PubMed] [Google Scholar]
- Leeuw T, Forest-Lieuvin A, Wu C, Chanevert J, Clark K, Whiteway M, Thomas DY, Leberer E. Pheromone response in yeast: association of Bem1p with proteins of the MAP kinase cascade and actin. Science. 1995;270:1210–1212. doi: 10.1126/science.270.5239.1210. [DOI] [PubMed] [Google Scholar]
- Lehmann R. Cell-cell signalling, microtubules, and the loss of symmetry in the Drosophila oocyte. Cell. 1995;83:353–356. doi: 10.1016/0092-8674(95)90111-6. [DOI] [PubMed] [Google Scholar]
- Luntz VA, Miller KG. A Class VI unconventional myosin is associated with a homologue of a microtubule-binding protein, cytoplasmic linker protein 170, in neurons and at the posterior pole of Drosophilaembryos. J Cell Biol. 1998;140:897–910. doi: 10.1083/jcb.140.4.897. [DOI] [PMC free article] [PubMed] [Google Scholar]
- Lutz DA, Hamaguchi Y, Inoue S. Micromanipulation studies of the asymmetric positioning of the maturation spindle in Chaetopterus sp. oocytes: I. Anchorage of the spindle to the cortex and migration of a displaced spindle. Cell Motil Cytoskel. 1988;11:83–96. doi: 10.1002/cm.970110202. [DOI] [PubMed] [Google Scholar]
- Lyons DM, Mahanty SK, Choi KY, Manandhar M, Elion EA. The SH3-domain protein Bem1 coordinates mitogen-activated protein kinase cascade activation with cell cycle control in Saccharomyces cerevisiae. . Mol Cell Biol. 1996;16:4095–4106. doi: 10.1128/mcb.16.8.4095. [DOI] [PMC free article] [PubMed] [Google Scholar]
- Mandell JW, Banker GA. Microtubule-associated proteins, phosphorylation gradients, and the establishment of neuronal polarity. Perspect Dev Neurobiol. 1996;4:125–135. [PubMed] [Google Scholar]
- Marcus S, Polverino A, Chang E, Robbins D, Cobb MH, Wigler MH. Shk1, a homolog of the Saccharomyces cerevisiae Ste20 and mammalian p65PAK protein kinases, is a component of a Ras/Cdc42 signaling module in the fission yeast Schizosaccharomyces pombe. . Proc Natl Acad Sci USA. 1995;92:6180–6184. doi: 10.1073/pnas.92.13.6180. [DOI] [PMC free article] [PubMed] [Google Scholar]
- Marks J, Hyams JS. Localisation of F-actin through the cell-division cycle of Schizosaccharomyces pombe. . Eur J Cell Biol. 1985;39:27–32. [Google Scholar]
- Marks, J., I.M. Hagan, and J.S. Hyams. 1986. Growth polarity and cytokinesis in fission yeast: the role of the cytoskeleton. J. Cell Sci. l5(Suppl.):229–241. [DOI] [PubMed]
- Mata J, Nurse P. tea1 and the microtubular cytoskeleton are important for generating global spatial order with the fission yeast cell. Cell. 1997;89:939–949. doi: 10.1016/s0092-8674(00)80279-2. [DOI] [PubMed] [Google Scholar]
- Mata J, Nurse P. Discovering the poles in yeast. Trends Cell Biol. 1998;8:163–167. doi: 10.1016/s0962-8924(98)01224-0. [DOI] [PubMed] [Google Scholar]
- Matter K, Bucher K, Hauri HP. Microtubule perturbation retards both the direct and the indirect pathway but does not affect sorting of plasma membrane proteins in intestinal epithelial cells (Caco-2) EMBO (Eur Mol Biol Organ) J. 1990;9:3163–3170. doi: 10.1002/j.1460-2075.1990.tb07514.x. [DOI] [PMC free article] [PubMed] [Google Scholar]
- Maundrell K. nmt1 of fission yeast: a highly transcribed gene completely repressed by thiamine. J Biol Chem. 1990;265:10857–10864. [PubMed] [Google Scholar]
- McGrail M, Hays TS. The microtubule motor cytoplasmic dynein is required for spindle orientation during germline cell divisions and oocyte differentiation in Drosophila. . Development (Camb) 1997;124:2409–2419. doi: 10.1242/dev.124.12.2409. [DOI] [PubMed] [Google Scholar]
- Mitchison J, Nurse P. Growth in cell length in the fission yeast Schizosaccharomyces pombe. . J Cell Sci. 1985;75:357–376. doi: 10.1242/jcs.75.1.357. [DOI] [PubMed] [Google Scholar]
- Moreno S, Klar A, Nurse P. Molecular genetic analysis of fission yeast Schizosaccharomyces pombe. . Methods Enzymol. 1991;194:795–823. doi: 10.1016/0076-6879(91)94059-l. [DOI] [PubMed] [Google Scholar]
- Nakaseko Y, Nabeshima K, Kinoshita K, Yanagida M. Dissection of fission yeast microtubule associating protein p93dis1: regions implicated in regulated localization and microtubule interaction. Genes Cells. 1996;1:633–644. doi: 10.1046/j.1365-2443.1996.00253.x. [DOI] [PubMed] [Google Scholar]
- Nasmyth K, Nurse P. Cell division cycle mutants altered in DNA replication and mitosis in the fission yeast Schizosaccharomyces pombe. . Mol Gen Genet. 1981;182:119–124. doi: 10.1007/BF00422777. [DOI] [PubMed] [Google Scholar]
- Nurse P, Thuriaux P, Nasmyth K. Genetic control of the cell division cycle in the fission yeast Schizosaccharomyces pombe. . Mol Gen Genet. 1976;146:167–178. doi: 10.1007/BF00268085. [DOI] [PubMed] [Google Scholar]
- Ottilie S, Miller PJ, Johnson DI, Creasy CL, Sells MA, Bagrodia S, Forsburg SL, Chernoff J. Fission yeast pak1 +encodes a protein kinase that interacts with Cdc42p and is involved in the control of cell polarity and mating. EMBO (Eur Mol Biol Organ) J. 1995;14:5908–5919. doi: 10.1002/j.1460-2075.1995.tb00278.x. [DOI] [PMC free article] [PubMed] [Google Scholar]
- Palmer RE, Sullivan DS, Huffaker T, Koshland D. Role of astral microtubules and actin in spindle orientation and migration. J Cell Biol. 1992;119:583–593. doi: 10.1083/jcb.119.3.583. [DOI] [PMC free article] [PubMed] [Google Scholar]
- Park HO, Bi E, Pringle JR, Herskowitz I. Two active states of the Ras-related Bud1/Rsr1 protein bind to different effectors to determine yeast cell polarity. Proc Natl Acad Sci USA. 1997;94:4463–4468. doi: 10.1073/pnas.94.9.4463. [DOI] [PMC free article] [PubMed] [Google Scholar]
- Peterson J, Zheng Y, Bender L, Myers A, Cerione R, Bender A. Interactions between the bud emergence proteins Bem1p and Bem2p and Rho-type GTPases in yeast. J Cell Biol. 1994;127:1395–1406. doi: 10.1083/jcb.127.5.1395. [DOI] [PMC free article] [PubMed] [Google Scholar]
- Pringle JR, Bi E, Harkins HA, Zahner JE, DeVirgilio C, Chant J, Corrado K, Fares H. Establishment of cell polarity in yeast. Cold Spring Harbor Symp Quant Biol. 1995;60:729–744. doi: 10.1101/sqb.1995.060.01.079. [DOI] [PubMed] [Google Scholar]
- Rappaport, R. 1996. Cytokinesis in Animal Cells. Cambridge University Press, Cambridge. 386 pp.
- Reinsch S, Karsenti E. Orientation of spindle axis and distribution of plasma membrane proteins during cell division in polarized MDCKII cells. J Cell Biol. 1994;126:1509–1526. doi: 10.1083/jcb.126.6.1509. [DOI] [PMC free article] [PubMed] [Google Scholar]
- Rodriguez-Boulan E, Powell SK. Polarity of epithelial and neuronal cells. Annu Rev Cell Biol. 1992;8:395–427. doi: 10.1146/annurev.cb.08.110192.002143. [DOI] [PubMed] [Google Scholar]
- Roemer T, Vallier LG, Snyder M. Selection of polarized growth sites in yeast. Trends Cell Biol. 1996;6:434–441. doi: 10.1016/s0962-8924(96)10039-8. [DOI] [PubMed] [Google Scholar]
- Russell P, Nurse P. Negative regulation of mitosis by wee1+, a gene encoding a protein kinase homolog. Cell. 1987;49:559–567. doi: 10.1016/0092-8674(87)90458-2. [DOI] [PubMed] [Google Scholar]
- Sawin, K.E. 1998. GFP-fusion proteins as probes for cytology in fission yeast. Methods Cell Biol. In press. [DOI] [PubMed]
- Sawin KE, Nurse P. Identification of fission yeast nuclear markers using random polypeptide fusions with green fluorescent protein. Proc Natl Acad Sci USA. 1996;94:15146–15151. doi: 10.1073/pnas.93.26.15146. [DOI] [PMC free article] [PubMed] [Google Scholar]
- Simons K, Dupree P, Fiedler K, Huber LA, Kobayashi T, Kurzchalia T, Olkkonen V, Pimiplikar S, Parton R, Dotti C. Biogenesis of cell-surface polarity in epithelial cells and neurons. Cold Spring Harbor Symp Quant Biol. 1992;57:611–619. doi: 10.1101/sqb.1992.057.01.067. [DOI] [PubMed] [Google Scholar]
- Snell V, Nurse P. Genetic analysis of cell morphogenesis in fission yeast—a role for casein kinase II in the establishment of polarized growth. EMBO (Eur Mol Biol Organ) J. 1994;13:2074. doi: 10.1002/j.1460-2075.1994.tb06481.x. [DOI] [PMC free article] [PubMed] [Google Scholar]
- Stern B, Nurse P. Fission yeast pheromone blocks S-phase progression by inhibiting the G1 cyclin B-p34cdc2 kinase. EMBO (Eur Mol Biol Organ) J. 1997;16:534–544. doi: 10.1093/emboj/16.3.534. [DOI] [PMC free article] [PubMed] [Google Scholar]
- Streiblova E, Wolf A. Cell wall growth during the cell cycle of Schizosaccharomyces pombe. . Z Allg Mikrobiol. 1972;12:673–684. [PubMed] [Google Scholar]
- Tanaka E, Sabry J. Making the connection: cytoskeletal rearrangements during growth cone guidance. Cell. 1995;83:171–176. doi: 10.1016/0092-8674(95)90158-2. [DOI] [PubMed] [Google Scholar]
- Thuriaux P, Sipiczki M, Fantes PA. Genetical analysis of a sterile mutant by protoplast fusion in the fission yeast Schizosaccharomyces pombe. . J Gen Microbiol. 1980;116:525–528. doi: 10.1099/00221287-116-2-525. [DOI] [PubMed] [Google Scholar]
- Toda T, Umesono K, Hirata A, Yanagida M. Cold-sensitive nuclear division arrest mutants of the fission yeast Schizosaccharomyces pombe. . J Mol Biol. 1983;168:251–270. doi: 10.1016/s0022-2836(83)80017-5. [DOI] [PubMed] [Google Scholar]
- Umesono K, Toda T, Hayashi S, Yanagida M. Two cell division cycle genes NDA2 and NDA3 of the fission yeast Schizosaccharomyces pombecontrol microtubular organization and sensitivity to anti-mitotic benzimidazole compounds. J Mol Biol. 1983;168:271–284. doi: 10.1016/s0022-2836(83)80018-7. [DOI] [PubMed] [Google Scholar]
- Verde F, Wiley DJ, Nurse P. Fission yeast orb6, a ser/thr protein kinase related to mammalian rho-kinase and myotonic dystrophy kinase, is required for maintenance of cell polarity and co-ordinates cell morphogenesis with the cell cycle. Proc Natl Acad Sci USA. 1998;95:7526–7531. doi: 10.1073/pnas.95.13.7526. [DOI] [PMC free article] [PubMed] [Google Scholar]
- Verde F, Mata J, Nurse P. Fission yeast cell morphogenesis: identification of new genes and analysis of their roles during the cell cycle. J Cell Biol. 1995;131:1529–1538. doi: 10.1083/jcb.131.6.1529. [DOI] [PMC free article] [PubMed] [Google Scholar]
- Walker GM. Cell cycle specificity of certain antimicrotubular drugs in Schizosaccharomyces pombe. . J Gen Microbiol. 1982;128:61–71. doi: 10.1099/00221287-128-1-61. [DOI] [PubMed] [Google Scholar]
- Wheatley SP, Wang Y-L. Midzone microtubule bundles are continuously required for cytokinesis in cultured epithelial cells. J Cell Biol. 1996;135:981–989. doi: 10.1083/jcb.135.4.981. [DOI] [PMC free article] [PubMed] [Google Scholar]
- Woods A, Sherwin T, Sasse R, MacRae T, Baines A, Gull K. Definition of individual components within the cytoskeleton of Trypanosoma brucei by a library of monoclonal antibodies. J Cell Sci. 1989;93:491–500. doi: 10.1242/jcs.93.3.491. [DOI] [PubMed] [Google Scholar]
- Yamamoto M. Genetic analysis of resistant mutants to antimitotic benzimidazole compounds in Schizosaccharomyces pombe. . Mol Gen Genet. 1980;180:231–234. doi: 10.1007/BF00267375. [DOI] [PubMed] [Google Scholar]