

Abstract
The L1 CAM family of cell adhesion molecules and the ankyrin family of spectrin-binding proteins are candidates to collaborate in transcellular complexes used in diverse contexts in nervous systems of vertebrates and invertebrates. This report presents evidence for functional coupling between L1 and 440-kD ankyrinB in premyelinated axons in the mouse nervous system. L1 and 440-kD ankyrinB are colocalized in premyelinated axon tracts in the developing nervous system and are both down-regulated after myelination. AnkyrinB (−/−) mice exhibit a phenotype similar to, but more severe, than L1 (−/−) mice and share features of human patients with L1 mutations. AnkyrinB (−/−) mice exhibit hypoplasia of the corpus callosum and pyramidal tracts, dilated ventricles, and extensive degeneration of the optic nerve, and they die by postnatal day 21. AnkyrinB (−/−) mice have reduced L1 in premyelinated axons of long fiber tracts, including the corpus callosum, fimbria, and internal capsule in the brain, and pyramidal tracts and lateral columns of the spinal cord. L1 was evident in the optic nerve at postnatal day 1 but disappeared by postnatal day 7 in mutant mice while NCAM was unchanged. Optic nerve axons of ankyrinB (−/−) mice become dilated with diameters up to eightfold greater than normal, and they degenerated by day 20. These findings provide the first evidence for a role of ankyrinB in the nervous system and support an interaction between 440-kD ankyrinB and L1 that is essential for maintenance of premyelinated axons in vivo.
Keywords: ankyrin, L1, cell adhesion molecule, mental retardation, gene knock-out
The L1 CAM1 family of cell adhesion molecules (comprised of L1, NgCAM, NrCAM, CHL1, and neurofascin) is a major contributor to intercellular interactions in the vertebrate nervous system (Hortsch, 1996; Brummendorf et al., 1998). L1 CAM molecules, which are represented in Drosophila by neuroglian (Bieber et al., 1989), possess variable extracellular domains composed of six Ig domains, three to five fibronectin type III domains, and a relatively conserved cytoplasmic domain (Sonderegger and Rathjen, 1992; Hortsch, 1996). Extracellular domains of L1 CAMs participate in homophilic interactions as well as a variety of interactions with soluble proteins and other cell adhesion molecules (Hortsch, 1996; Brummendorf et al., 1998). Extensive diversity in extracellular interactions of L1 CAM family members is provided by divergence between extracellular domains encoded by different genes as well as multiple alternatively spliced variants of each gene (as many as 50 estimated in the case of neurofascin) (Hassel et al., 1997). Consistent with the diverse extracellular domains, a range of functions has been attributed to the L1 CAM family, including axon fasciculation, axonal guidance, neurite extension, a role in long term potentiation, synaptogenesis, and myelination (Hortsch, 1996; Walsh and Doherty, 1997; Brummendorf et al., 1998).
Mutations in the human L1 gene, located on the X chromosome, are responsible for mental retardation, as well as hydrocephalus, abnormal development of major axon pathways in the corpus callosum and corticocospinal tract, and motor deficits (Rosenthal et al., 1992; Jouet et al., 1994; Wong et al., 1995; Fransen et al., 1997). Penetrance of L1 mutations is variable, except for mental retardation, which is the most common abnormality. The term CRASH (corpus callosum agenesis, mental retardation, adducted thumbs, spastic paraplegia, and hydrocephalus) has been used to describe general features of L1 mutations (Fransen et al., 1995). Over 35 mutations in L1 have currently been characterized, and these are distributed in all domains, including several in the cytoplasmic domain (Van Camp et al., 1996; Fransen et al., 1998a ). Disruption of the L1 gene in mice results in abnormal axon guidance in the corticospinal tract, brain malformations (including dilated ventricles), and behavioral deficits (Dahme et al., 1997; Cohen et al., 1998; Fransen et al., 1998b ). These observations demonstrate the physiological importance of L1 in normal development of the nervous system as well as a role of L1 in human disorders.
The cytoplasmic domains of L1 CAM family members share a conserved sequence that has been demonstrated to associate with high affinity with ankyrins, a family of spectrin-binding proteins located on the cytoplasmic surface of the plasma membrane (Davis and Bennett, 1994; Dubreuil et al., 1996; Garver et al., 1997; Hortsch et al., 1998; Zhang et al., 1998). The association between ankyrins and L1 CAMs is regulated by phosphorylation of the FIGQY tyrosine, a site which is conserved among vertebrate and invertebrate members of the L1CAM family (Garver et al., 1997; Tuvia et al., 1997). Ankyrins also associate with the voltage-gated Na channel, Na/K ATPase, anion channel, and Na/Ca exchanger. Ankyrins have been proposed to form lateral complexes between these ion channels and members of the L1 CAM family (Michaely and Bennett, 1995a ,b; Bennett et al., 1997).
The ankyrin family currently includes three genes encoding ankyrinR, ankyrinB, and ankyrinG polypeptides as well as multiple alternatively spliced variants encoded by each gene (Peters and Lux, 1993; Bennett et al., 1997). 440-kD ankyrinB and 480-kD ankyrinG polypeptides are the major isoforms in the developing nervous system and are localized in premyelinated and unmyelinated axons (Kunimoto et al., 1991; Otto et al., 1991; Chan et al., 1993; Kunimoto, 1995; Lambert et al., 1997). These axonal ankyrins have a predicted ball-and-chain configuration, with an extended tail domain inserted between the COOH- terminal death domain and globular head domain. The head domain is composed of membrane- and spectrin-binding domains (Chan et al., 1993; Kordeli et al., 1995). The extended tail domains of axonal ankyrins have the potential to interact with cytoskeletal elements, and thus to couple L1 CAM molecules to cytoplasmic proteins in addition to the membrane-associated spectrin–actin network.
L1 CAMs and ankyrins are candidates to collaborate in a major structural pathway, involving both extracellular and intracellular interactions, which is used in diverse contexts in the developing and adult nervous system. This report presents evidence for functional coupling between L1 and 440-kD ankyrinB in premyelinated axon tracts in the neonatal mouse nervous system. Disruption of the ankyrinB gene in the mouse results in a phenotype similar to, but more severe, than the L1 knock-out in mice and L1 mutations in humans, as well as loss of L1 from premyelinated axon tracts. These findings provide evidence that ankyrins and L1CAMs associate in vivo, and furthermore identify the genes and alternatively spliced variants involved in L1 CAM–ankyrin interactions in premyelinated axons.
Materials and Methods
Gene Targeting
A clone containing 17 kb of the ank2 gene was isolated from a 129SVJ genomic lambda fix II library using a probe that covers nucleotides 2443– 2805 of the human ankyrinB cDNA. A novel NotI site was introduced within an exon in the spectrin-binding domain, and this site was used to introduce a cassette that included the neomycin resistance gene (pMC1neo polyA vector; Stratagene, La Jolla, CA), an in-frame HA epitope, and a stop codon. An XhoI/HindIII fragment containing the thymidine kinase gene (from the vector pIC19R) was added to the construct. ES cells were transfected by electroporation with the linearized targeting construct, neomycin- and gancycolivir-resistant clones were isolated, and homologous recombination was verified by Southern blotting (see Fig. 1 B). ES cells were injected into blastocysts from C57Bl/6 mice and implanted in C57Bl/6 pseudopregnant mothers. Male chimeric progeny were mated with C57Bl/6 females to generate heterozygous mice. Homozygous mice were produced from none-littermate heterozygous mice. ES cell culture, transfection, and blastocyst injection were performed in the laboratory of Dr. Beverly Koller (University of North Carolina, Chapel Hill, NC) (Mansour et al., 1988; Koller et al., 1991).
Figure 1.
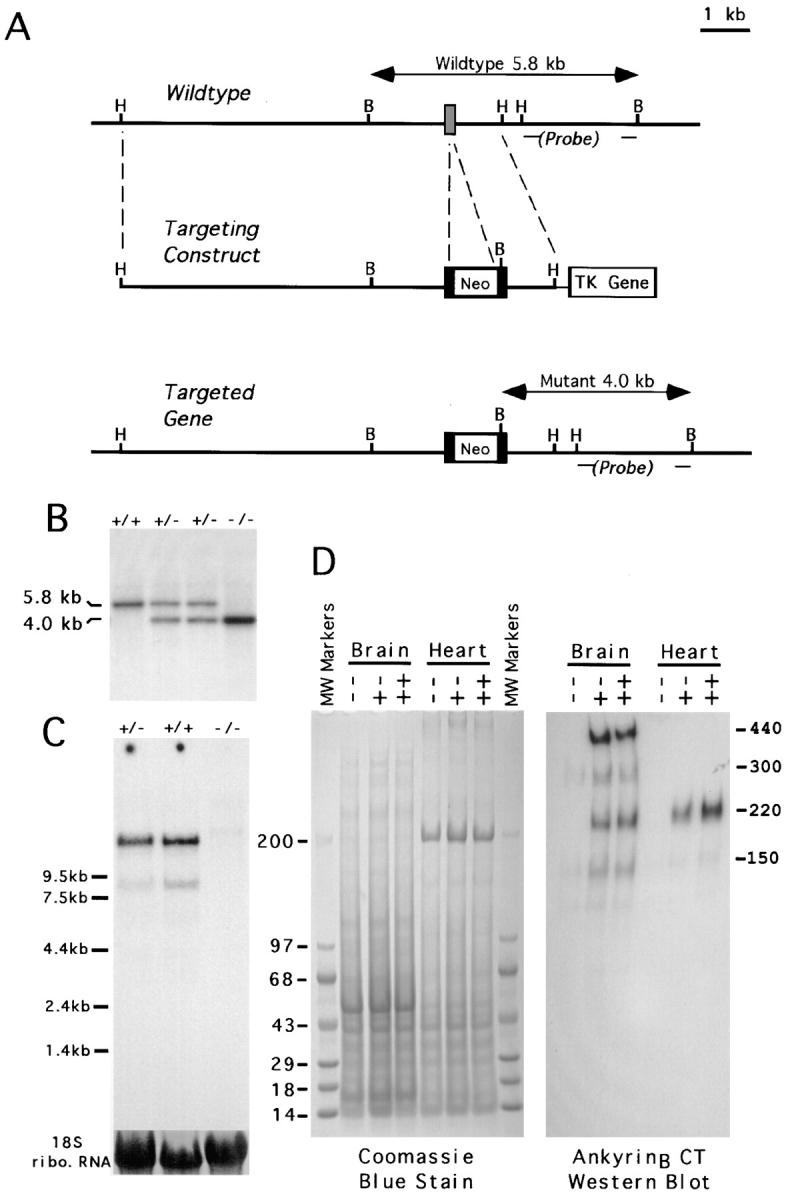
Generation of ankyrinB (−/−) mice by homologous recombination. (A) The strategy for placing the neomycin resistance cassette into an exon of the ank2 gene. The probe for the Southern blot is indicated. Sites for restriction enzymes, HindIII (H) and BamHI (B) are indicated. (B) Southern blot demonstrating homologous recombination using a probe as indicated in A. The insertion of an extra BamHI site in the targeted locus produces a band at 4.0 kb. (C) Northern blot with a probe derived from cDNA encoding the spectrin-binding domain of ankyrinB, demonstrating loss of ankyrinB transcripts in (−/−) animals. The amount of total RNA loaded on each lane was indicated by the 18S ribosomal RNA, which was stained with methylene blue. (D) Immunoblotting of brain and heart homogenate using an antibody to the COOH terminus of ankyrinB that recognizes all known alternatively spliced variants.
Magnetic Resonance Imaging
Magnetic resonance (MR) microscopy was performed on a General Electric (Fremont, CA) 7.1 Tesla unit, 15-cm bore size, equipped with shielded gradient coils. A Helmholtz coil especially designed for MR microscopy of fixed specimens at 300 MHz was used for imaging (Banson et al., 1992). Formalin-fixed brains were suspended in Fomblin (perfluoropolyether; Ausimont, Inc., Morristown, NJ) to minimize dehydration and to limit susceptibility effects at the surface. Data was acquired as anisotropic arrays with an aspect ratio of 1:1:2 with the following acquisition parameters: (a) 18.2-h scan time; (b) 20-ms echo time; (c) 1,000-ms repetition time, diffusion gradient pulse (sine bell-shaped) durations of 5 ms; (d) diffusion gradient separation of 12.2 ms; (e) large diffusion gradients of 35 Gauss/cm, resulting in a diffusion-weighting factor of 965 s/mm2, 256 × 256 × 128 digital resolution; and (f) voxel size of 39 × 39 × 78 μm. All images were analyzed using NIH Image 1.68 (public domain from The National Institutes of Health) and VoxelView Ultra (Vital Images, Inc., Fairfield, IA) for three-dimensional rendering.
Analysis of Tissues
Immunofluorescence was performed with 5–10-μm frozen brain sections, which were prepared and stained as described (Lambert et al., 1997). Affinity-purified rabbit antibodies were raised against the human COOH-terminal domain (residues 1551–1813) and 440-kD–specific tail domain (Chan et al., 1993) of ankyrinB using recombinant proteins expressed in bacteria as antigens as described (Lambert et al., 1997). Chick antibody against the 270/480-kD ankyrinG has been described elsewhere (Lambert et al., 1997). Rabbit polyclonal antibody against neurofascin was described in Davis et al. (1996). Antibody against L1 was purchased from Boehringer Mannheim Corp. (Indianapolis, IN). Electron microscopy was performed with optic nerve fixed with 4% glutaraldehyde and subsequently embedded in Epon. To determine the sizes of axons in the knock-out and the control mouse optic nerves, a sheet of paper containing a hole with dimensions of 8 × 8 cm was mounted on the electron micrographs, and the number of axons that appeared in the hole were counted. Northern and Southern blots (Sambrook et al., 1989) and immunoblots (Lambert et al., 1997) were performed as described. Antibodies used in immunoblotting experiments are anti-L1, a protein A affinity-purified polyclonal antibody (a generous gift from Dr. Patricia Manness of the University of North Carolina at Chapel Hill); polyclonal antispectrin and polyclonal antineurofascin as described in previous reports (Hu et al., 1995; Davis et al., 1996); and polyclonal anti-NCAM, purchased from Chemicon (Temecula, CA).
Results
AnkyrinB (−/−) Mice Exhibit Brain Malformations Resembling Defects Caused by L1 Mutations in Humans and Mice
The ank2 gene encoding ankyrinB was disrupted by homologous recombination (Fig. 1 A), and ankyrinB +/+, +/−, and −/− mice (n = 325) were identified by Southern blots (Fig. 1 B) (Materials and Methods). This study is based on the first-generation progeny with a genetic background of 1:1 129SVJ to C57Bl/6. Brains of ankyrinB (−/−) mice exhibited nearly complete loss of a major 13-kb mRNA transcript encoding the 440-kD ankyrinB (Kunimoto et al., 1991) as well as loss of less abundant 8- and 5-kb transcripts encoding 220- and 150-kD ankyrinB polypeptides, respectively (Fig. 1 C). 440- and 220-kD ankyrinB polypeptides were undetectable in homogenates of brains of ankyrinB (−/−) mice by immunoblotting (Fig. 1 D). A minor 150-kD polypeptide in the ankyrinB (−/−) mice still is barely detectable in original gels, although not in the published version. 150-kD ankyrinB lacks a membrane-binding domain (Otto et al., 1991). Apparently expression of the 150-kD ankyrinB transcript is less affected by disruption of an exon in the spectrin binding domain (Materials and Methods).
440-kD ankyrinB is a major isoform in the early postnatal period, as noted previously (Kunimoto et al., 1991). AnkyrinB is also expressed in heart where the major isoform of 220 kD was undetectable in ankyrinB (−/−) mice (Fig. 1 D).
AnkyrinB (−/−) mice were born in nearly Mendelian ratios of 1:3 (81/325), demonstrating normal survival during fetal development. However, over half of the ankyrinB (−/−) animals were dead or dying (and therefore killed) on the first postnatal day, and 95% by 8 d (n = 81) (Fig. 2 B). A few mutant mice survived until postnatal day 20 (4 out of 81). Mice that did survive to 2 wk were about 25% of the weight of littermates (n = 8) and exhibited abnormal locomotion and balance (Fig. 2 A).
Figure 2.


Photograph of an ankyrinB (−/−) mouse and a normal littermate (A) and postnatal survival of ankyrinB (−/−) mice (B). Animals shown in A were 11 d old. The mutant mouse was 25% of the weight of the normal animal.
Three-dimensional diffusion-weighted magnetic resonance microscopy (DWM) of formalin-fixed brains from a litter of 1-d-old mice (three mutant and three normal) was performed to obtain general information on gross morphology and accurate measurements of ventricle volumes. We used DWM, which measures diffusion of free proton spins to get optimal anatomical resolution. Brain anatomy is revealed in detail with DWM because proton diffusion within regions composed of oriented axon fiber tracts and those comprised of cell bodies is markedly different (Beaulieu and Allen, 1996).
Total brain and cerebellar volumes in the ankyrinB (−/−) brains were nearly identical to those of (+/+) and (+/−) littermates (Table I). However, volumetric measurements of the ventricular systems revealed a significant sevenfold enlargement of the lateral ventricles in the ankyrinB (−/−) brains compared with controls (Table I; Fig. 3). In addition, an enlarged lateral ventricle is easily visualized in Fig. 3. Enlargement of lateral ventricles of ankyrinB (−/−) mice was not associated with occlusion of the cerebral aqueduct, which is closed in Fig. 3 but was patent in other sections (not shown). The extent of lateral ventricle dilation in neonatal ankyrinB (−/−) mice is in agreement with that reported for some strains of adult L1 (−/−) mice (Dahme et al., 1997; Fransen et al., 1998b ). Fransen et al. (1998b) found a twofold enlargement of both the frontolateral and fourth ventricle in adult L1 (−/−) mice. AnkyrinB (−/−) mice did not exhibit fourth ventricle enlargement; however, they did not survive beyond day 21, and the full extent of enlargement of brain ventricles could therefore not be determined. L1 (−/−) mice in some genetic backgrounds do not exhibit enlarged ventricles (Dahme et al., 1997). Hydrocephalus is also variable in extent in humans with L1 mutations, even within the same kindred (Fransen et al., 1997). L1 hydrocephalus also is associated with a patent aqueduct of Sylvius in some cases (Fransen et al., 1995; Wong et al., 1995).
Table I.
Volume of Brain Regions by MRM
| Parameter | AnkyrinB (−/−) (n = 3) | Wild-type (n = 3) | P value | |||
|---|---|---|---|---|---|---|
| mm 3 | mm 3 | |||||
| Total brain volume | 82 ± 10 | 98 ± 10 | 0.14 | |||
| Cerebellar volume | 4.6 ± 0.4 | 4.9 ± 0.4 | 0.32 | |||
| Fourth ventricle volume | 0.13 ± 0.03 | 0.11 ± 0.03 | 0.36 | |||
| Lateral ventricle volume | 0.20 ± 0.07 | 0.03 ± 0.01 | 0.017 |
Figure 3.
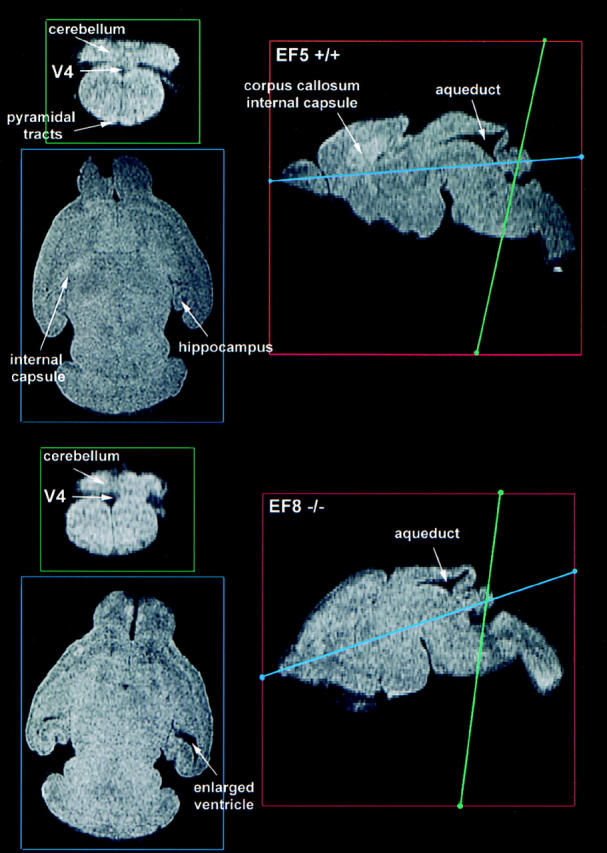
MR microscopy images of brains of normal littermate and ankyrinB (−/−) mice. Parasagittal of brains from a normal littermate (EF5 +/+) and an ankyrinB (−/−) mouse are in red boxes on the right. Sections indicated by blue and green lines are displayed on the left. Although unmyelinated, the internal capsule and pyramidal tracts are clearly visible in the normal brain (top left, blue and green panels) and were not evident in the mutant (bottom left, blue and green panels). The internal capsule and corpus callosum are also visualized in the parasagittal sections of the normal brain (top right, red panel) and could not be resolved in the mutant (bottom right, red panel). The lateral ventricles were abnormally enlarged in mutant brains (bottom left, blue panel). One ankyrinB (−/−) brain exhibited severe malformation of most brain structures and is not shown. These images represent a milder phenotype.
L1 mutations in mice and humans are associated with abnormalities in the pyramidal tracts and corpus callosum (Fransen et al., 1997; Cohen et al., 1998). DWM images revealed the presence of the corpus callosum and internal capsule in sagittal sections as well as pyramidal tracts in coronal sections in control mice (Fig. 3). The corpus callosum, internal capsule, and pyramidal tracts could not be resolved in brains of ankyrinB (−/−) mice (Fig. 3). Histological brain sections also reveal a reduction in the corpus callosum in ankyrinB (−/−) mice, with nearly complete absence of the anterior portion revealed in a sagittal section (Fig. 5). The corpus callosum also was greatly reduced in coronal sections of ankyrinB mutant brain (Fig. 5). Hypoplasia of the corpus callosum was observed in 16/26 (postnatal days 1–5) mutant mouse brains examined by coronal sections. Some of the variability in detection of reduction of the corpus callosum may be due to selective loss of anterior relative to posterior regions.
Figure 5.

L1 staining is reduced in long fiber tracts in brains of ankyrinB (−/−) mice. Coronal sections of brains close to the optic chiasm (A) and parasagittal sections (B) of normal littermate (top rows) and ankyrinB (−/−) (bottom rows) mice stained by immunofluorescence using an antibody against the ankyrinB COOH terminus cross-reacting with all known ankyrinB polypeptides (left column) and an antibody against L1 (middle column). The composite staining for both ankyrinB (red) and L1 CAM (green) is in the right column. The corresponding anterior and posterior portions of corpus callosum in wild-type littermate and the knock-out mice are indicated by the arrow and arrowhead, respectively. Similar results were obtained with antibody against the tail domain specific for the 440-kD ankyrinB (not shown). CC, corpus callosum; Fo, fornix; Fi, fimbria; IC, internal capsule; CPu, caudate putamen; ST, stria medullaris. Bars: (A) 100 μm; (B) 50 μm.
Loss of L1 in Premyelinated Axon Tracts in the Central Nervous System of AnkyrinB (−/−) Mice
The similarities in phenotype of ankyrinB (−/−) mice and L1 (−/−) mice suggested the possibility that ankyrinB and L1 are coexpressed in the nervous system. Evidence in support of segregation of L1 with ankyrinB and of neurofascin with ankyrinG is presented in Fig. 4. Neurofascin has previously been identified at axon initial segments and nodes of Ranvier, which are sites that also contain high local concentrations of 270/480-kD isoforms of ankyrinG (Davis et al., 1996; Lambert et al., 1997). Neurofascin and 270/480 ankyrinG are colocalized at axon initial segments in the neonatal cerebral cortex (Fig. 4). However, in neonatal mouse brain, neurofascin and 270/480 ankyrinG were absent from premyelinated axon tracts, including the corpus callosum (Fig. 4, lower panels) as well the optic nerve and other sites in the central nervous system (data not shown). L1 and 440 ankyrinB, in contrast, codistributed in premyelinated axon fiber tracts in the cerebral cortex (Fig. 4) and throughout the CNS (Figs. 5 and 6).
Figure 4.
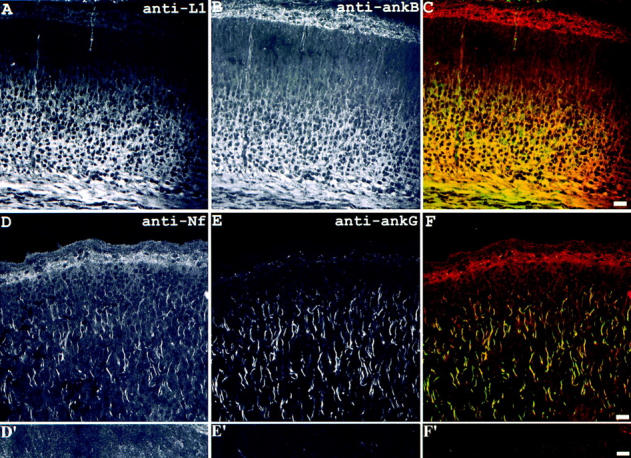
Codistribution of L1 with ankyrinB in premyelinated axon tracts and codistribution of neurofascin with ankyrinG in axon initial segments in neonatal mouse brain. The sections through cerebral cortex of neonatal mouse brain were double labeled with antibodies to L1 (A) and ankyrinB (B, composite image shown in C) or antibodies to neurofascin (D and D′) and ankyrinG (E and E′, composite images shown in F and F′). The results show L1 and ankyrinB codistributed in the axon tracts while neurofascin and ankyrinG colocalized at initial segments of axons. The images shown in D′–F′ were taken from the corpus callosum portion of the same section shown in D–F. Bars, 10 μm.
Figure 6.

L1 staining is reduced in the pyramidal tracts and lateral columns in the spinal cords of ankyrinB (−/−) mice. Transverse sections of spinal cords at thoracic vertebrae 8 of normal littermate (top row) and ankyrinB (−/−) (bottom row) mice were double stained with an antibody against the ankyrinB COOH terminus cross-reacting with all known ankyrinB polypeptides (left column) and an antibody against L1 (middle column). The composite staining for both ankyrinB (red) and L1 CAM (green) is in the right column. PT, pyramidal tract; LC, lateral column. Bars, 100 μm.
440-kD ankyrinB and L1 are colocalized in premyelinated axons located in long fiber tracts in brain (corpus callosum, internal capsule, fornix, striatum, and olfactory tract) (Fig. 5) as well as spinal cord (pyramidal tract and lateral columns) (Fig. 6). Similar patterns of ankyrinB staining in axon tracts were observed with antibodies against the COOH terminus, which react with all known alternatively spliced forms as with antibodies against 440-kD ankyrinB (not shown). These patterns of distribution of L1 are consistent with previous studies (Bartsch et al., 1989; Joosten and Gribnau, 1989; Martini, 1994). Brain and spinal cord sections of ankyrinB (−/−) mice exhibited no staining with antibody against the COOH terminus of ankyrinB, confirming both the efficacy of gene disruption and specificity of the antibody.
L1 staining is reduced in premyelinated axon tracts in brains and spinal cords of ankyrinB (−/−) mice (Figs. 5 and 6). The corpus callosum and internal capsule are reduced or absent in mutant animals (Fig. 5) (16/26), as noted above. However, fiber tracts in the brain that still were present and exhibited major reduction in L1 staining include the fimbria and stria terminalis (Fig. 5 A). L1 staining in the pyramidal tract and lateral columns of the spinal cord also is greatly reduced (Fig. 6). AnkyrinB (−/−) animals exhibited variability with respect to L1 staining, with about 50% having less pronounced differences. For example, L1 staining still is evident in the sagittal section shown in Fig. 5 B. However, littermate control animals always exhibited strong L1 staining.
Loss of L1 in ankyrinB (−/−) mice is also demonstrated by immunoblotting of brain tissue (Fig. 7). It was not feasible to obtain tissue samples from particular anatomical sites such as corpus callosum or optic nerve (see below), where loss of L1 is most prominent. Therefore, intact brains of a control and a mutant postnatal day 7 mouse were evaluated for levels of L1, neurofascin, NCAM, and spectrin (n = 1) (Fig. 7). Expression levels of neurofascin and NCAM exhibited no detectable change in the brain of the ankyrinB (−/−) mouse. Moreover, levels of βG-spectrin also were unchanged (Fig. 7). However, immunoblots of the same gel samples with antibody against L1 revealed a 30–40% percent reduction in amounts of 200-, 135-, and 43-kD cross-reacting polypeptides (Fig. 7). These results demonstrating partial loss of L1 are consistent with reduction of L1 in localized sites detected by immunofluorescence.
Figure 7.

Immunoblots of neurofascin, NCAM, βG spectrin, and L1 in brain tissue from ankyrinB (+/+) and (−/−) mice. Polypeptides in total brain homogenates of an ankyrinB mouse (−/−) (left lanes) and a (+/+) littermate (right lanes) mouse were separated on a 3.5–17.5% SDS–polyacrylamide gel and either stained with Coomassie blue or transferred to a nitrocellulose membrane. Duplicate membranes were blotted with polyclonal antibodies to ankyrinB (ankB), spectrin (spec), neurofascin (Nf), NCAM, and L1, and bound antibodies were detected with 125I-labeled protein A. L1 polypeptides of 200, 135, and 43 kD are marked on the left. The extent of labeling was quantitated by a phosphoimager. Immunoblots were scanned to a phosphoimager and analyzed using ImageQuant software developed by Molecular Dynamics (Sunnyvale, CA). Compared with the wild-type littermate, L1 polypeptides of 200, 135, and 43 kD were reduced by 38, 29, and 27%, respectively, in ankyrinB (−/−) brain samples. The relative amounts of spectrin, neurofascin, and NCAM in the ankyrinB (−/−) samples were 0.95, 1.01, and 1.06 that of wild-type samples, respectively.
Loss of L1 staining in ankyrinB (−/−) brain and spinal cord raises questions of whether lack of ankyrinB impairs delivery of L1 to axons, whether L1-expressing axon tracts never form and are simply absent, and/or whether L1-expressing axons are present initially but subsequently degenerate. The optic nerve provides a simplified, easily identifiable anatomical site for addressing issues related to L1 behavior and axonal degeneration in ankyrinB (−/−) mice. The premyelinated optic nerve has previously been identified as a site where the 440-kD ankyrinB is the sole ankyrin (Chan et al., 1993), and also expresses high levels of L1 (Bartsch et al., 1989). 440-kD ankyrinB and L1 both exhibit a dramatic down-regulation coincident with myelination and are not expressed in adult myelinated axons of the optic nerve (Bartsch et al., 1989; Chan et al., 1993).
Transverse sections through optic nerve at postnatal days 1–3 revealed unreduced staining for L1 in ankyrinB (−/−) mice, even though ankyrinB staining was absent (n = 7) (Fig. 8). These observations establish that at least early in the postnatal period, optic nerve axons are present, and that L1 is delivered to axons in the absence of ankyrinB. However, L1 staining disappeared from optic nerves of ankyrinB (−/−) mice by around postnatal day 7, although the nerve itself was still present (Fig. 8) (n = 6). Optic nerves of normal mice retained L1 and ankyrinB (Fig. 8). In contrast to L1, levels of NCAM were unchanged in the optic nerve section of ankyrinB (−/−) mice at postnatal day 7 (Fig. 8). Neurofascin was only found at the initial segments of the premyelinated optic nerve axons and was absent from the optic nerves of both control and ankyrinB (−/−) mice. Electron micrographs (see below; Fig. 9) reveal that myelination occurred with only a few axons at this stage and was limited to a few loops of myelin. The normal loss of L1 accompanying myelination therefore had not yet begun at the time when L1 disappeared from ankyrinB (−/−) optic nerves.
Figure 8.

L1 is initially expressed and subsequently lost in premyelinated optic nerves of ankyrinB (−/−) mice. Transverse sections through the optic nerves of postnatal day 1 mice (P1) and day 7 mice (P7) were double stained with antibodies against ankyrinB COOH terminus (top row) and L1 (middle row). The P7 optic nerve sections also were double stained with antibodies to NCAM (right top panels) and L1 (right middle panels). The composite images for both ankyrinB (red) and L1 CAM (green) or NCAM (red) and L1 (green) were shown in the bottom row. The genotype of the mice was marked with −/− for the knock-out mouse and WT for the wild-type mouse. Bars, 10 μm.
Figure 9.
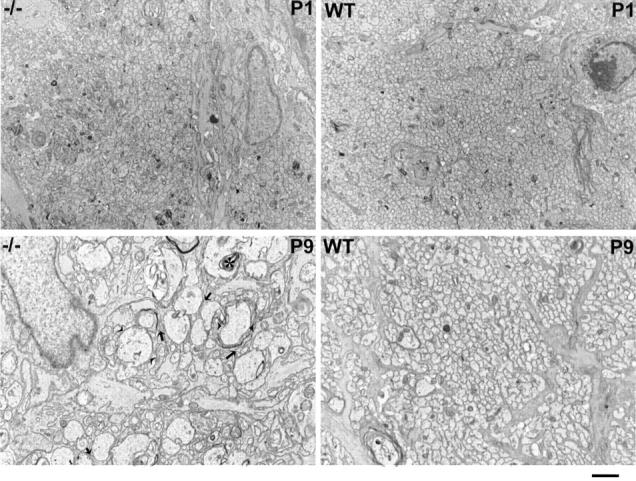
Electron micrographs of transverse sections of optic nerves of day 1 (top row) and day 9 (bottom row) normal mice (right) and ankyrinB (−/−) mice (left). Sections of optic nerves were obtained within 1 mm of the optic chiasm and matched as closely as possible between mutant and control animals. Several dilated axons are outlined between the two arrowheads. Arrows denote sites where axons are not in contact with each other. A mulivescicular body in a day 9 mutant axon is marked by an asterisk. Bar, 1 μm.
Degeneration of the Optic Nerve in AnkyrinB (−/−) Mice
Electron microscopy of transverse sections of the postnatal day 1 optic nerve revealed relatively normal axon profiles in ankyrinB (−/−) mice, although the average axon cross-sectional area was increased about 20% (see Materials and Methods; data not shown). Axons were packed in tightly assembled arrays, indicating that some level of axon fasciculation occurs in the absence of ankyrinB. Sections of postnatal day 9 optic nerve reveal a major change in axons of ankyrinB (−/−) mice (Fig. 9). Many axons were increased in diameter up to eightfold compared with the normal axon and contained multivescicular bodies. Longitudinal sections demonstrated increased diameter along the length of ankyrinB (−/−) axons (not shown). Axon fasciculation also was impaired in sections of ankyrinB (−/−) optic nerve with many examples of loss of direct axon–axon contacts (Fig. 9).
All ankyrinB (−/−) mice surviving until postnatal day 21 exhibited nearly complete degeneration of the optic nerve (n = 8) (Fig. 10). The optic nerve of ankyrinB (−/−) mice thus forms initially with normal axonal delivery of L1 and subsequently degenerates. AnkyrinB and ankyrinG are coexpressed before myelination in most other nerves, including the trigeminal nerve (Lambert et al., 1997). The optic nerve, which only has ankyrinB, apparently is especially vulnerable in ankyrinB (−/−) mice.
Figure 10.
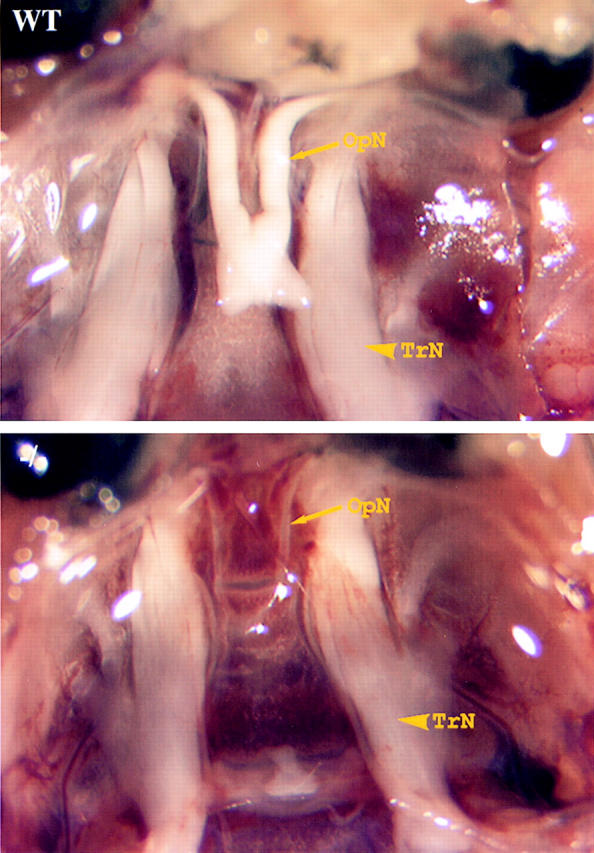
Degeneration of optic nerves of ankyrinB (−/−) mice. Photograph of optic nerves (OpN) and trigeminal nerves (TrN) of postnatal day 20 normal littermate (top) and ankyrinB (−/−) (bottom) mice. Note the nearly complete loss of the optic nerve in the mutant mouse.
Discussion
This study describes dramatic consequences of deficiency of ankyrinB in mice that allow survival until birth but result in hypoplasia of the corpus callosum and pyramidal tracts, dilated lateral ventricles, followed by extensive degeneration of the optic nerve, and death by postnatal day 21. This phenotype is similar to, but more severe, than those observed in L1 (−/−) mice and human patients with L1 mutations. L1 was reduced or absent in ankyrinB (−/−) mutant mice in premyelinated axons of long fiber tracts in the brain and spinal cord as well as optic nerve at postnatal day 7. These findings provide the first evidence for a role of ankyrinB in the vertebrate nervous system and support a functional connection between ankyrinB and L1 that is required for maintenance of premyelinated axons in vivo.
L1 deficiency in mice is compatible with survival to adulthood (Dahme et al., 1997; Cohen et al., 1998; Fransen et al., 1998b ) and represents a much less severe phenotype than ankyrinB deficiency. Other L1 CAM family members (CHL1, NrCAM, NgCAM, and neurofascin) may functionally compensate for L1 in L1 (−/−) mice. In addition, ankyrinB is likely to have additional roles unrelated to L1, particularly early in development when some L1 CAMs are tyrosine phosphorylated and therefore incapable of binding to ankyrin (Garver et al., 1997; Zisch et al., 1997; Heiland et al., 1998). Conversely, L1 and other members of the family are likely to have ankyrin-independent functions when these proteins are tyrosine phosphorylated. This study demonstrates that early in development, L1 is capable of axonal transport to the optic nerves of ankyrinB (−/−) mice, implying that its delivery to the plasma membrane and axonal targeting are independent of ankyrinB. It will be of interest to determine the phosphorylation state of L1 in the early postnatal optic nerve, where this protein is transported to axons in the absence of ankyrinB (Fig. 6).
The mechanism for loss of L1 in ankyrinB (−/−) axons is not known, but it could result from reduced stability of L1 in the absence of ankyrinB. A similar situation in which loss of a cytoskeletal protein results in reduction of integral proteins has been found in mdx mice, where absence of dystrophin results in reduction of dystrophin-associated proteins (Matsumura et al., 1992). A practical consequence of reduced expression of interacting proteins is that a characterization of patterns of gene or protein expression in the ankyrinB (−/−) mouse brain may yield heretofore unidentified proteins whose functions involve ankyrinB.
The striking increase in axonal diameter of optic nerve axons suggests the hypothesis that the absence of ankyrinB leads to loss of mechanical stability of axons. AnkyrinB could contribute to axonal membrane support by connecting the spectrin–actin network to the plasma membrane, as occurs in erythrocytes (Peters and Lux, 1993). In this case, axonal swelling would be analogous to hereditary spherocytosis of erythrocytes observed in cases of ankyrinR mutations (Eber et al., 1996). The tail domain of the 440-kD ankyrinB potentially could extend several hundred nanometers into the axoplasm and also mediate interactions with structural proteins in addition to the spectrin skeleton. L1-mediated connections between axons combined with coupling to the spectrin–actin network via ankyrin could provide an additional level of mechanical support for axon bundles. Such a transcellular network based on L1 and ankyrin is analogous, in a formal sense, to the epidermis, where keratinocytes are connected through desmosomes on their outer surfaces, and desmosomes are interconnected via intermediate filaments. The consequence in both cases is a mechanical buffering system capable of distributing shear stresses throughout the tissue. It is of interest in this regard that the brains of ankyrinB (−/−) are much more fragile and susceptible to damage during dissection compared with brains of normal mice (data not shown).
AnkyrinB and L1 are coexpressed and may interact at sites in addition to premyelinated axons. Unmyelinated axons in the molecular layer of the adult cerebellum express 440-kD ankyrinB as well as L1 (Kunimoto et al., 1991; Martini, 1994; Kunimoto, 1995). 220-kD ankyrinB is expressed in glial cells, including Schwann cells and astrocytes (Kordeli et al., 1990; Kunimoto et al., 1991; Kunimoto, 1995), and could associate with alternatively spliced forms of L1 present in these cells (Martini, 1994). L1 is expressed outside of the nervous system in cells including lymphocytes (Kowitz et al., 1992). It will be of interest in future experiments to examine L1 distribution and function in ankyrinB (−/−) mice at sites of axo–glial contact and in the immune system.
Ankyrin and L1 have both been implicated in axon guidance. L1-deficient mice exhibit defects in guidance of corticospinal axons across the pyramidal decussation (Cohen et al., 1998). Ankyrin (Unc-44) mutations in Caenorhabditis elegans result in abnormal axon outgrowth and guidance (Otsuka et al., 1995). It is not clear from the current data if ankyrinB and L1 collaborate in axonal guidance, or if ankyrinB has any role in axonal guidance. It will be of interest to trace the paths of axons in the optic nerve and corticospinal tracts of ankyrinB (−/−) mice to determine possible defects in decussation and in final arrival at neuronal targets. Consequences of ankyrinB deficiency, including degeneration of the optic nerve, could be secondary to defective targeting of axons to their normal sites accompanied by apoptosis caused by lack of retrograde transport of appropriate factors.
The accumulated L1 mutations characterized in human families provide a valuable database for structure–function studies of the L1 molecule (Fransen et al., 1998a ). One missense mutation in the L1 cytoplasmic domain results in conversion of Y1229 to H and clinical disease (Van Camp et al., 1996). The Y1229H mutation of the FIGQY tyrosine is of particular interest with respect to ankyrin. Recent analysis of structural requirements for L1 CAM binding to ankyrin has demonstrated that the FIGQY tyrosine is essential for ankyrin binding (Hortsch et al., 1998; Zhang et al., 1998). Moreover, mutation of the FIGQY tyrosine to histidine abolishes ankyrin binding activity of neurofascin (Zhang et al., 1998). These considerations suggest the possibility that ankyrin binding activity of L1 is also abolished by the Y1229H mutation, and that loss of ankyrin binding results in loss of L1 function in humans.
Abbreviations used in this paper
- CAM
cell adhesion molecule
- DWM
diffusion-weighted MR microscopy
- MR
magnetic resonance
Footnotes
Dr. Beverly Koller is gratefully acknowledged for performing ES cell manipulations as well as advice in design of the targeting construct. Susan Hester of the Duke Microscopy facility performed electron microscopy. Scott Carpenter is acknowledged for technical assistance.
MRM was performed at the Duke Center for In Vivo Microscopy, National Institutes of Health (NIH) National Center for Research Resources No. P41RR05959. This study was funded in part by a grant from the NIH.
Paula Scotland and Daixing Zhou each made major contributions.
Address all correspondence to Vann Bennett, Box 3892, Duke University Medical Center, Durham, NC 27710. Tel.: (919) 684-3538. Fax: (919) 684-3590. E-mail: benne012@mc.duke.edu
References
- Banson ML, Cofer GP, Black R, Johnson GA. A probe for specimen magnetic resonance microscopy. Investig Radiol. 1992;27:57–164. doi: 10.1097/00004424-199202000-00013. [DOI] [PubMed] [Google Scholar]
- Bartsch U, Kirchhoff F, Schachner M. Immunohistological localization of the adhesion molecules L1, N-CAM, and MAG in the developing and adult optic nerve of mice. J Comp Neurol. 1989;284:451–462. doi: 10.1002/cne.902840310. [DOI] [PubMed] [Google Scholar]
- Beaulieu C, Allen PS. An in vitro evaluation of the effects of local magnetic-susceptibility-induced gradients on anisotropic water diffusion in nerve. Magn Res Med. 1996;36:39–44. doi: 10.1002/mrm.1910360108. [DOI] [PubMed] [Google Scholar]
- Bennett V, Lambert S, Davis JQ, Zhang X. Molecular architecture of the specialized axonal membrane at the node of Ranvier. Soc Gen Physiol. 1997;52:107–120. [PubMed] [Google Scholar]
- Bieber AJ, Snow PM, Hortsch M, Patel NH, Jacobs JR, Traquina ZR, Schilling J, Goodman CS. Drosophilaneuroglian: a member of the immunoglobulin superfamily with extensive homology to the vertebrate neural adhesion molecule L1. Cell. 1989;59:447–460. doi: 10.1016/0092-8674(89)90029-9. [DOI] [PubMed] [Google Scholar]
- Brummendorf T, Kenwrick S, Rathjen FG. Neural cell recognition molecule L1: from cell biology to human hereditary brain malformations . Curr Opin Neurobiol. 1998;8:87–97. doi: 10.1016/s0959-4388(98)80012-3. [DOI] [PubMed] [Google Scholar]
- Chan W, Kordeli E, Bennett V. 440-kD ankyrin-B: structure of the major developmentally regulated domain and selective localization in unmyelinated axons. J Cell Biol. 1993;123:1463–1473. doi: 10.1083/jcb.123.6.1463. [DOI] [PMC free article] [PubMed] [Google Scholar]
- Cohen NR, Taylor JS, Scott LB, Guillery RW, Soriano P, Furley AJ. Errors in corticospinal axon guidance in mice lacking the neural cell adhesion molecule L1. Curr Biol. 1998;8:26–33. doi: 10.1016/s0960-9822(98)70017-x. [DOI] [PubMed] [Google Scholar]
- Dahme M, Bartsch U, Martini R, Anliker B, Schachner M, Mantei N. Disruption of the mouse L1 gene leads to malformations of the nervous system. Nat Genet. 1997;17:346–349. doi: 10.1038/ng1197-346. [DOI] [PubMed] [Google Scholar]
- Davis JQ, Bennett V. Ankyrin binding activity shared by the neurofascin/L1/NrCAM family of nervous system cell adhesion molecules. J Biol Chem. 1994;269:27163–27166. [PubMed] [Google Scholar]
- Davis JQ, Lambert S, Bennett V. Molecular composition of the node of Ranvier: identification of ankyrin-binding cell adhesion molecules neurofascin (mucin+/third FNIII domain−) and NrCAM at nodal axon segments. J Cell Biol. 1996;135:1355–1367. doi: 10.1083/jcb.135.5.1355. [DOI] [PMC free article] [PubMed] [Google Scholar]
- Dubreuil RR, MacVicar G, Dissannyake S, Liu C, Homer D, Hortsch M. Neuroglian-mediated cell adhesion induces assembly of the membrane skeleton at cell contact sites. J Cell Biol. 1996;133:647–655. doi: 10.1083/jcb.133.3.647. [DOI] [PMC free article] [PubMed] [Google Scholar]
- Eber SW, Gonzalez JM, Lux ML, Scarpa AL, Tse WT, Dornwell M, Herbers J, Kugler W, Ozcan R, Pekrun A, et al. Ankyrin-1 mutations are a major cause of dominant and recessive hereditary spherocytosis. Nat Genet. 1996;13:214–218. doi: 10.1038/ng0696-214. [DOI] [PubMed] [Google Scholar]
- Fransen E, Lemmon V, Van Camp G, Vits L, Coucke P, Willems PJ. CRASH syndrome: clinical spectrum of corpus callosum hypoplasia, retardation, adducted thumbs, spastic paraparesis and hydrocephalus due to mutations in one single gene, L1. Eur J Hum Genet. 1995;3:273–284. doi: 10.1159/000472311. [DOI] [PubMed] [Google Scholar]
- Fransen E, Van Camp G, Vits L, Willems PJ. L1-associated diseases: clinical geneticists divide, molecular geneticists unite. Hum Mol Genet. 1997;6:1625–1632. doi: 10.1093/hmg/6.10.1625. [DOI] [PubMed] [Google Scholar]
- Fransen E, Van Camp G, D'Hooge R, Vits L, Willems PJ. Genotype-phenotype correlation in L1 associated diseases. J Med Genet. 1998a;35:399–404. doi: 10.1136/jmg.35.5.399. [DOI] [PMC free article] [PubMed] [Google Scholar]
- Fransen E, D'Hooge R, Van Camp G, Verhoye M, Sijbers J, Reyniers E, Soriano P, Kamiguchi H, Willemsen R, Koekkoek SK, et al. L1 knockout mice show dilated ventricles, vermis hypoplasia and impaired exploration patterns. Hum Mol Genet. 1998b;7:999–1009. doi: 10.1093/hmg/7.6.999. [DOI] [PubMed] [Google Scholar]
- Garver TD, Ren Q, Tuvia S, Bennett V. Tyrosine phosphorylation at a site highly conserved in the L1 family of cell adhesion molecules abolishes ankyrin binding and increases lateral mobility of neurofascin. J Cell Biol. 1997;137:703–714. doi: 10.1083/jcb.137.3.703. [DOI] [PMC free article] [PubMed] [Google Scholar]
- Hassel B, Rathjen FG, Volkmer H. Organization of the neurofascin gene and analysis of developmentally regulated alternative splicing. J Biol Chem. 1997;272:28742–28749. doi: 10.1074/jbc.272.45.28742. [DOI] [PubMed] [Google Scholar]
- Heiland PC, Griffith LS, Lange R, Schachner M, Hertlein B, Traub O, Schmitz B. Tyrosine and serine phosphorylation of the neural cell adhesion molecule L1 is implicated in its oligomannosidic glycan dependent association with NCAM and neurite outgrowth. Eur J Cell Biol. 1998;75:97–106. doi: 10.1016/S0171-9335(98)80052-6. [DOI] [PubMed] [Google Scholar]
- Hortsch M. The L1 family of neural cell adhesion molecules: old proteins performing new tricks. Neuron. 1996;17:587–593. doi: 10.1016/s0896-6273(00)80192-0. [DOI] [PubMed] [Google Scholar]
- Hortsch M, Homer D, Malhotra JD, Chang S, Frankel J, Jefford G, Dubreuil RR. Structural requirements for outside-in and inside-out signaling by Drosophilaneuroglian, a member of the L1 family of cell adhesion molecules. J Cell Biol. 1998;142:251–261. doi: 10.1083/jcb.142.1.251. [DOI] [PMC free article] [PubMed] [Google Scholar]
- Hu R-J, Moorthy S, Bennett V. Expression of functional domains of β-G spectrin disrupts epithelial morphology in cultured cells. J Cell Biol. 1995;128:1069–1080. doi: 10.1083/jcb.128.6.1069. [DOI] [PMC free article] [PubMed] [Google Scholar]
- Johnson GA, Benveniste H, Black RD, Hedlund LW, Maronpot RR, Smith BR. Histology by magnetic resonance microscopy. Magn Reson. 1993;9:1–30. [PubMed] [Google Scholar]
- Joosten EA, Gribnau AA. Immunocytochemical localization of cell adhesion molecule L1 in developing rat pyramidal tract. Neurosci Lett. 1989;100:94–98. doi: 10.1016/0304-3940(89)90666-6. [DOI] [PubMed] [Google Scholar]
- Jouet M, Rosenthal A, Armstrong G, MacFarlane J, Stevenson R, Paterson J, Metzenberg A, Ionasescu V, Temple K, Kenwrick S. X-linked spastic paraplegia (SPG1), MASA syndrome and X-linked hydrocephalus result from mutations in the L1 gene. Nat Genet. 1994;7:402–407. doi: 10.1038/ng0794-402. [DOI] [PubMed] [Google Scholar]
- Koller BH, Kim HS, Latour AM, Brigman K, Boucher RC, Jr, Scambler P, Wainwright B, Smithies O. Toward an animal model of cystic fibrosis: targeted interruption of exon 10 of the cystic fibrosis transmembrane regulator gene in embryonic stem cells. Proc Natl Acad Sci USA. 1991;88:10730–10734. doi: 10.1073/pnas.88.23.10730. [DOI] [PMC free article] [PubMed] [Google Scholar]
- Kordeli E, Lambert S, Bennett V. Ankyrin-G. A new ankyrin gene with neural-specific isoforms localized at the axonal initial segment and node of Ranvier. J Biol Chem. 1995;270:2352–2359. doi: 10.1074/jbc.270.5.2352. [DOI] [PubMed] [Google Scholar]
- Kowitz A, Kadmon G, Eckert M, Schirrmacher V, Schachner M, Altevogt P. Expression and function of the neural cell adhesion molecule L1 in mouse leukocytes. Eur J Immunol. 1992;22:1199–1205. doi: 10.1002/eji.1830220514. [DOI] [PubMed] [Google Scholar]
- Kunimoto M. A neuron-specific isoform of brain ankyrin, 440-kD ankyrin-B, is targeted to the axons of rat cerebellar neurons. J Cell Biol. 1995;131:1821–1829. doi: 10.1083/jcb.131.6.1821. [DOI] [PMC free article] [PubMed] [Google Scholar]
- Kunimoto M, Otto E, Bennett V. A new 440-kD isoform is the major ankyrin in neonatal rat brain. J Cell Biol. 1991;115:1319–1331. doi: 10.1083/jcb.115.5.1319. [DOI] [PMC free article] [PubMed] [Google Scholar]
- Lambert S, Davis JQ, Bennett V. Morphogenesis of the node of Ranvier: co-clusters of ankyrin and ankyrin-binding integral proteins define early developmental intermediates. J Neurosci. 1997;17:7025–7036. doi: 10.1523/JNEUROSCI.17-18-07025.1997. [DOI] [PMC free article] [PubMed] [Google Scholar]
- Mansour SL, Thomas KR, Capecchi MR. Disruption of the proto-oncogene int-2 in mouse embryo-derived stem cells: a general strategy for targeting mutations to non-selectable genes. Nature. 1988;336:348–352. doi: 10.1038/336348a0. [DOI] [PubMed] [Google Scholar]
- Martini R. Expression and functional roles of neural cell surface molecules and extracellular matrix components during development and regeneration of peripheral nerves. J Neurocytol. 1994;23:1–28. doi: 10.1007/BF01189813. [DOI] [PubMed] [Google Scholar]
- Matsumura K, Ervasti JM, Ohlendieck K, Kahl SD, Campbell KP. Association of dystrophin-related protein with dystrophin-associated proteins in mdxmouse muscle. Nature. 1992;360:588–591. doi: 10.1038/360588a0. [DOI] [PubMed] [Google Scholar]
- Michaely P, Bennett V. The ANK repeats of erythrocyte ankyrin form two distinct but cooperative binding sites for the erythrocyte anion exchanger. J Biol Chem. 1995a;270:22050–22057. doi: 10.1074/jbc.270.37.22050. [DOI] [PubMed] [Google Scholar]
- Michaely P, Bennett V. Mechanism for binding site diversity on ankyrin: comparison of binding sites on ankyrin for neurofascin and the Cl−/ HCO3 −anion exchanger. J Biol Chem. 1995b;270:31298–31302. doi: 10.1074/jbc.270.52.31298. [DOI] [PubMed] [Google Scholar]
- Otsuka AJ, Franco R, Yang B, Shim KH, Tang LZ, Zhang YY, Boontrakulpoontawee P, Jeyaprakash A, Hedgecock E, Wheaton VI, Sobery A. An ankyrin-related gene (unc-44) is necessary for proper axonal guidance in Caenorhabditis elegans. . J Cell Biol. 1995;129:1081–1092. doi: 10.1083/jcb.129.4.1081. [DOI] [PMC free article] [PubMed] [Google Scholar]
- Otto E, Kunimoto M, McLaughlin T, Bennett V. Isolation and characterization of cDNAs encoding human brain ankyrins reveal a family of alternatively spliced genes. J Cell Biol. 1991;114:241–253. doi: 10.1083/jcb.114.2.241. [DOI] [PMC free article] [PubMed] [Google Scholar]
- Peters LL, Lux SE. Ankyrins: structure and function in normal cells and hereditary spherocytes. Semin Hematol. 1993;30:85–118. [PubMed] [Google Scholar]
- Rosenthal A, Jouet M, Kenwrick S. Aberrant splicing of neural cell adhesion molecule L1 mRNA in a family with X-linked hydrocephalus. Nat Genet. 1992;2:107–112. doi: 10.1038/ng1092-107. [DOI] [PubMed] [Google Scholar]
- Sambrook, J., E.F. Fritsch, and T. Maniatis. 1989. Molecular Cloning: A Laboratory Manual. 2nd edition. Cold Spring Harbor Laboratory Press, Cold Spring Harbor, NY. 545 pp.
- Sonderegger P, Rathjen FG. Regulation of axonal growth in the vertebrate nervous system by interactions between glycoproteins belonging to two subgroups of the immunoglobulin superfamily. J Cell Biol. 1992;119:1387–1394. doi: 10.1083/jcb.119.6.1387. [DOI] [PMC free article] [PubMed] [Google Scholar]
- Tuvia S, Garver TD, Bennett V. The phosphorylation state of the FIGQY tyrosine of neurofascin determines ankyrin-binding activity and patterns of cell segregation. Proc Natl Acad Sci USA. 1997;94:12957–12962. doi: 10.1073/pnas.94.24.12957. [DOI] [PMC free article] [PubMed] [Google Scholar]
- Van Camp G, Fransen E, Vits L, Raes G, Willems PJ. A locus-specific mutation database for the neural cell adhesion molecule L1CAM (Xq28) Hum Mut. 1996;8:391. doi: 10.1002/(SICI)1098-1004(1996)8:4<391::AID-HUMU19>3.0.CO;2-Y. [DOI] [PubMed] [Google Scholar]
- Walsh FS, Doherty P. Neural cell adhesion molecules of the immunoglobulin superfamily: role in axon growth and guidance. Annu Rev Cell Dev Biol. 1997;13:425–456. doi: 10.1146/annurev.cellbio.13.1.425. [DOI] [PubMed] [Google Scholar]
- Wong EV, Kenwrick S, Willems P, Lemmon V. Mutations in the cell adhesion molecule L1 cause mental retardation. Trends Neurosci. 1995;18:168–172. doi: 10.1016/0166-2236(95)93896-6. [DOI] [PubMed] [Google Scholar]
- Zhang X, Davis J, Carpenter S, Bennett V. Structural requirements for association of neurofascin with ankyrin. J Biol Chem. 1998;273:30785–30794. doi: 10.1074/jbc.273.46.30785. [DOI] [PubMed] [Google Scholar]
- Zisch AH, Stallcup WB, Chong LD, Dahlin-Huppe K, Voshol J, Schachner M, Pasquale EB. Tyrosine phosphorylation of L1 family adhesion molecules: implication of the Eph kinase Cek5. J Neurosci. 1997;47:655–665. doi: 10.1002/(sici)1097-4547(19970315)47:6<655::aid-jnr12>3.0.co;2-u. [DOI] [PubMed] [Google Scholar]