

Abstract
We previously demonstrated that CALNUC, a Ca2+-binding protein with two EF-hands, is the major Ca2+-binding protein in the Golgi by 45Ca2+ overlay (Lin, P., H. Le-Niculescu, R. Hofmeister, J.M. McCaffery, M. Jin, H. Henneman, T. McQuistan, L. De Vries, and M. Farquhar. 1998. J. Cell Biol. 141:1515–1527). In this study we investigated CALNUC's properties and the Golgi Ca2+ storage pool in vivo. CALNUC was found to be a highly abundant Golgi protein (3.8 μg CALNUC/mg Golgi protein, 2.5 × 10⁵ CALNUC molecules/NRK cell) and to have a single high affinity, low capacity Ca2+-binding site (K d = 6.6 μM, binding capacity = 1.1 μmol Ca2+/μmol CALNUC). 45Ca2+ storage was increased by 2.5- and 3-fold, respectively, in HeLa cells transiently overexpressing CALNUC-GFP and in EcR-CHO cells stably overexpressing CALNUC. Deletion of the first EF-hand α helix from CALNUC completely abolished its Ca2+-binding capability. CALNUC was correctly targeted to the Golgi in transfected cells as it colocalized and cosedimented with the Golgi marker, α-mannosidase II (Man II). Approximately 70% of the 45Ca2+ taken up by HeLa and CHO cells overexpressing CALNUC was released by treatment with thapsigargin, a sarcoplasmic/endoplasmic reticulum calcium ATPase (SERCA) (Ca2+ pump) blocker. Stimulation of transfected cells with the agonist ATP or IP3 alone (permeabilized cells) also resulted in a significant increase in Ca2+ release from Golgi stores. By immunofluorescence, the IP3 receptor type 1 (IP3R-1) was distributed over the endoplasmic reticulum and codistributed with CALNUC in the Golgi. These results provide direct evidence that CALNUC binds Ca2+ in vivo and together with SERCA and IP3R is involved in establishment of the agonist-mobilizable Golgi Ca2+ store.
Keywords: Golgi resident calcium-binding protein, EF-hand, IP3 receptor, SERCA, nucleobindin
The Golgi complex is involved in posttranslational modification of newly synthesized proteins and serves as the main sorting station for protein and vesicular traffic (Farquhar and Hauri, 1997; Farquhar and Palade, 1998). Calcium is well known to be essential for cell signaling (Tsien and Tsien, 1990; Meldolesi and Pozzan, 1998) but also for cell processes such as protein processing and membrane traffic to and through the Golgi (Davidson et al., 1988; Ivessa et al., 1995; Duncan and Burgoyne, 1996). Recently the Golgi has been identified as a Ca2+-enriched compartment using ion microscopy and electron energy loss spectroscopy-electron spectroscopic imaging (EELS-ESI) (Chandra et al., 1991; Grohovaz et al., 1996; Pezzati et al., 1997). Ca2+ can be released from the Golgi by the Ca2+ ionophore A23187 (Chandra et al., 1991), the Ca2+ channel blocker La3+ (Zha and Morrison, 1995), and histamine, an agonist known to be coupled to IP3 generation (Pinton et al., 1998). How the high level of Ca2+ in the Golgi is maintained is unknown at present.
The ER Ca2+ pool (or Ca2+ store) has been studied more extensively and is known to be maintained by organelle-associated Ca2+ ATPase (Ca2+ pumps) and lumenal Ca2+-binding proteins of which there are many (Bastianutto et al., 1995; Meldolesi and Pozzan, 1998). There is also evidence for the existence of Ca2+ pumps on the Golgi based on ATP-dependent Ca2+ uptake into mammalian (Baumrucker and Keenan, 1975; Hodson, 1978; Neville et al., 1981; Virk et al., 1985) and yeast (Sorin et al., 1997) Golgi fractions. Both sarcoplasmic/ER calcium ATPase (SERCA)1 and plasma membrane calcium ATPase en route to the plasma membrane are essential for Ca2+ uptake into isolated Golgi fractions (Taylor et al., 1997). However, information on Golgi calcium-binding proteins is still limited and the detailed mechanisms of Ca2+ uptake, storage, and release from the Golgi apparatus remain to be elucidated. Previously, we demonstrated that CALNUC (nucleobindin) (Miura et al., 1992; Wendel et al., 1995), a Golgi resident protein that faces the Golgi lumen, is the major Ca2+-binding protein in the Golgi based on 45Ca2+ overlay (Lin et al., 1998).
In this study we have investigated the role of CALNUC in establishing the Golgi Ca2+ pool in vivo by examining the effects of overexpression of CALNUC on Ca2+ uptake. We provide direct evidence that CALNUC possesses high affinity/low capacity Ca2+ binding properties and binds Ca2+ in the Golgi in vivo. The finding that the majority of the Ca2+ sequestered by overexpressed CALNUC is released by thapsigargin (Tg), ATP, and IP3 provides additional in vivo evidence for the existence of SERCA and inositol 1, 4, 5 trisphosphate receptor (IP3R) on the Golgi. CALNUC together with SERCA and IP3R on Golgi membranes constitute a cellular Ca2+ pool in the Golgi which may have distinct functions.
Materials and Methods
Materials
Polyclonal antibody (F-5059) against full-length, recombinant CALNUC was generated and affinity purified as previously described (Lin et al., 1998). Polyclonal anti–α-mannosidase II (Man II) was prepared as described (Velasco et al., 1993). Monoclonal anti–Man II (53FC3) and polyclonal antibody against denatured Man II were gifts from Drs. B. Burke (University of Alberta, Alberta, Canada) and K. Moremen (University of Georgia, Athens, GA), respectively. Monoclonal anti–mouse IP3R-1 (18A10) was kindly provided by Drs. A. Miyawaki and K. Mikoshiba (University of Tokyo, Tokyo, Japan) (Furuichi et al., 1989). Polyclonal antibody against calnexin was a gift from Dr. J.J.M. Bergeron (McGill University, Montreal, Canada). Cross-absorbed Texas red–conjugated donkey anti–rabbit F(ab′)2 was obtained from Jackson ImmunoResearch Laboratories, and affinity-purified goat anti–rabbit IgG (H+L) conjugated to HRP was from Bio-Rad. 45CaCl2 was obtained from NEN Life Science Products. Supersignal chemiluminescent reagent was purchased from Pierce. All chemical reagents were from Sigma Chemical Co. except as indicated.
Preparation and Purification of His6-CALNUC
Full-length CALNUC cDNA was amplified by PCR using 5′-CGCGCGGCAGCCATATGCCTACCTCTGTG-3′ and 5′-CGGAATTCGGATCCTTATAAATGCTGAGAATC-3′ as primers. PCR was carried out using 100 pmol of each primer, 2 ng CALNUC cDNA, 200 μM dNTP, 2.5 U PFU polymerase (Stratagene), and PCR reaction buffer in a total volume of 50 μl. PCR products were purified using a QIAquick PCR Purification kit (Qiagen) and subcloned into the pET-28a(+) vector (Novagen) at BamHI/NdeI restriction sites, followed by transformation into Escherichia coli BL21(DE3). Expression of CALNUC protein was induced with 1 mM isopropyl β-d-thiogalactoside (IPTG) (Pharmacia Biotech) at 18°C for 4 h at a bacterial density of OD600 ≥ 1.0.
To purify His6-CALNUC protein, transformed E. coli were suspended in binding buffer containing 20 mM sodium phosphate and 500 mM NaCl (pH 7.5), and sonicated using a Microson Ultrasonic Cell Disrupter (Heat Systems). Lysates were incubated with Ni-NTA agarose (Qiagen), washed with 20 mM sodium phosphate, 500 mM NaCl at decreasing pH (8.0, 6.0, and 5.3), and bound proteins were sequentially eluted with an imidazole step gradient (10 mM to 1 M). Fractions containing a single band of purified CALNUC detected by silver staining were pooled and dialyzed against TBS containing 150 mM NaCl and 10 mM Tris-HCl (pH 7.4) at 4°C, and subsequently concentrated using an Ultrafree-15 (Biomax-50K) filter (Millipore). Highly purified His6-CALNUC [0.6 mg/liter of transformed BL21(DE3)] was obtained.
Ca2+-binding Analysis
Equilibrium dialysis was performed essentially as previously published (MacLennan and Wong, 1971; Baksh and Michalak, 1991). Ca2+-free solution was prepared by treatment of deionized water with a UniPure I Water Purification System (Solution Consultants) and Chelex 100 ion exchange resin (Bio-Rad) (Thielens et al., 1990). Equilibrium dialysis was performed using a Dialysis System (GIBCO BRL). 0.25 mg Ca2+-depleted CALNUC (Thielens et al., 1990) was incubated with 0.35 μCi/ml 45CaCl2 and different concentrations of cold Ca2+ at 4°C for 16 h, followed by assessment of radioactivity using a LS 6000IC Liquid Scintillation System (Beckman Instruments) in EcoLume liquid scintillation cocktail (ICN). Scatchard analysis was performed using CA Cricket Graph III software (Computer Associates International).
Primary Structure Comparison
Amino acid sequences of CALNUC, Cab45 (Scherer et al., 1996), and calmodulin (CaM) were obtained through Entrez on the National Center for Biotechnology Information's (NCBI) World Wide Web home page. Alignment of EF-hand motifs was performed using MacVector 6.0 software (Oxford Molecular Groups-IBI).
Cell Culture
HeLa cells were maintained in DME high glucose medium (Irvine Scientific) supplemented with 10% FCS (Life Technologies Inc.). Cells were used as 80% confluent monolayers for transfection. Transfected EcR-CHO cells were cultured in Ham's F12 medium (CORE Cell Culture Facility, University of California, San Diego, CA) with 10% FCS (Life Technologies), 250 μg/ml Zeocin (Invitrogen), and 750 μg/ml G418 sulfate (Calbiochem). All media contained 100 U/ml of penicillin G and 100 μg/ ml of streptomycin sulfate. NRK cells were cultured as previously described (Lin et al., 1998).
Transient Overexpression of CALNUC-Green Fluorescent Protein (GFP) or Truncated CALNUC-GFP in HeLa Cells
CALNUC cDNA was amplified by PCR with the primers 5′-CGCGGATCCATGCCTACCTCTGTG-3′ and 5′-CCATGCCATGGCTAAATGCTGAGAATCC-3′. GFP cDNA was also amplified by PCR with the primers 5′-TCATGCCATGGTGAGCAAGGG-3′ and 5′-ATAGTTTAGCGGCCGCTTACTTGTACAGCTC-3′. PCR products were purified and digested, respectively, with BamHI, NcoI, and NotI (New England Biolabs). CALNUC and GFP cDNA were subcloned into the pcDNA3 vector (Invitrogen) by three-fragment ligation to obtain a CALNUC-GFP/pcDNA3 construct with GFP ligated to the 3′ (COOH terminus) of CALNUC.
CALNUC(ΔEF-1), in which the α helix (Asp227–Leu239) of the first EF-hand (EF-1) domain (see Fig. 1) was deleted, was obtained by PCR with the primers 5′-CGCGGATCCATGCCTACCTCTGTG-3′/5′-CCCAAGCTTATGCAGTATGAAGAA-3′, and 5′-CCCAAGCTTGAAGCTCTGTTTACC-3′ / 5 ′ -CCATGCCATGGCTAAATGCTGAGAATCC-3 ′ . CALNUC(ΔEFs-1,2), in which both EF-1 and EF-2 domains (Asp227– Phe291) (see Fig. 1) were deleted, was prepared with primers of 5′-CGCGGATCCATGCC TACC TCTGTG- 3 ′ / 5 ′ -CCCAAGCT TATGCAGTATGAAGAA-3′, and 5′-CCCAAGCTTCTGGCATCCACACAG-3′/5′-CCA- TGCCATGGCTAAATGCTGAGAATCC-3′. CALNUC mutants and the GFP tag were subcloned into the pcDNA3 vector by four-fragment ligation with HindIII and NcoI as internal restriction linker sites. Fidelity of the constructs was verified by automated DNA sequencing (CFAR, University of California, San Diego, CA). cDNA constructs were transformed into E. coli DH5α, followed by extraction and purification using QIAGEN Plasmid Midi/Mega Kits (Qiagen) and UltraPure CsCl (optical grade) (GIBCO BRL).
Figure 1.
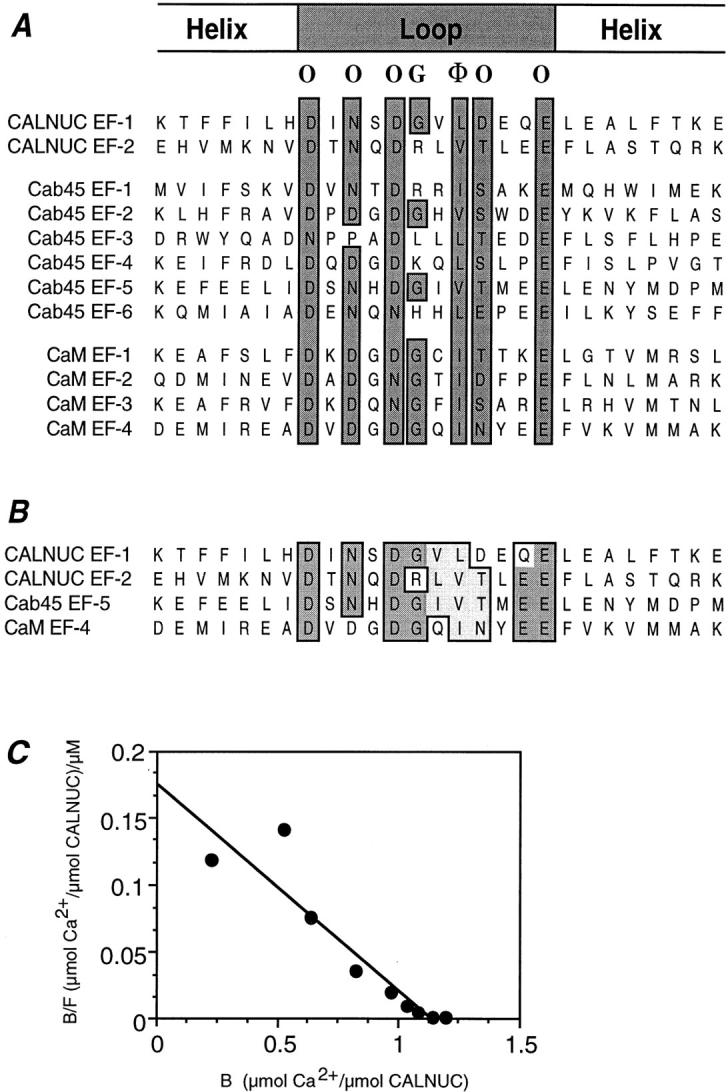
CALNUC EF-1 is an ideal EF-hand Ca2+-binding motif. (A) Alignment of the EF-hand loop domains constituting the key Ca2+-binding sites in CALNUC, Cab45, and CaM. Consensus amino acids characteristic of ideal EF-hand motifs with oxygen atom–containing side chains (O), a hydrophobic amino acid (Φ), and Gly (G) are boxed. Amino acid numbering corresponding to each EF-hand is as follows: CALNUC (220–246 and 272– 298, Z36277), Cab45 (103–129, 142–168, 201–227, 238–264, 283– 309, 319–345, U45977), and CaM (14–40, 50–76, 87–113, 124–150, M26151). Numbers in parentheses refer to the amino acid positions and the GenBank accession numbers, respectively. (B) Primary structure of EF-hands in CALNUC, Cab45, and CaM. Sequence comparison shows that CALNUC EF-1 and EF-2 have the highest similarity to Cab45 EF-5 and CaM EF-4, except that CALNUC EF-2 has an Arg (R) instead of a Gly at residue 6 of the loop region. (C) Binding of Ca2+ to CALNUC is high affinity and low capacity. CALNUC binding to Ca2+ was examined by equilibrium dialysis. Scatchard analysis reveals the existence of one high affinity (K d = 6.6 μM)/low capacity (∼1.1 μmol Ca2+/ μmol of protein) Ca2+-binding site on CALNUC. Results represent the average of values from six separate experiments performed in triplicate.
To express wild-type or truncated CALNUC-GFP in HeLa cells, 1 μg purified DNA was transfected into HeLa cells (33-mm dish, 80% confluence) using 6 μg lipofectamine (GIBCO BRL). Transfected cells were grown in serum and antibiotic-free high glucose DME medium for 5 h followed by replacement with regular culture medium.
Establishment of a Stable HeLa Cell Line Overexpressing GFP Using Flow Cytometry
GFP cDNA amplified by PCR with the primers 5′-TCGCGGATCCATGGTGAGCAAGGG-3′ and 5′-ATAGTTTAGCGGCCGCTTACTTGTACAGCTC-3′ was subcloned into the pcDNA3 vector at BamHI/ NotI restriction sites, followed by transfection into HeLa cells as described above and G418 selection (0.75 mg/ml) for 4 d. Cells expressing GFP were sorted by flow cytometry (Ex/Em: 488/530 ± 15) (FACStar Plus®; Becton Dickinson) in the UCSD Flow Cytometry Core Facility. The top 0.12% of the positive cells was collected and maintained in media containing 0.75 mg/ml G418 until confluent. Selection by sorting was repeated three times until 100% of the cells (HeLa-GFP, GPH-1216) expressed GFP (data not shown).
Establishment of Stable Cell Lines Overexpressing CALNUC in the Ecdysone-inducible Mammalian Expression System
CALNUC cDNA was amplified by PCR and subcloned into the pIND vector (Invitrogen) at BamHI/NotI restriction sites. EcR-CHO cells (Invitrogen) stably expressing the ecdysone receptor (RxR and VgEcR) were transfected with CALNUC/pIND plasmid DNA using lipofectamine as described above followed by selection for G418 resistance (0.4 mg/ml) for 18 d. Cells were split into 96-well plates by serial dilution, 0.5 cells/well, and subsequently reselected with G418 (0.75 mg/ml). Four clones overexpressing CALNUC after induction with muristerone A (Invitrogen) were obtained; one of these, EcR-CHO-CALNUC-1 (CPC-22A), was used for these experiments.
Immunocytochemistry
CALNUC-GFP was directly visualized using a Zeiss Axiophot microscope and an FITC-filter (Ex/Em: 485/510). For immunofluorescence, cells on coverslips were fixed with 2% paraformaldehyde (50 min), permeabilized with 0.1% Triton X-100 (10 min), and incubated with affinity-purified anti-CALNUC IgG (6 μg/ml), anti–Man II serum (1:300), or anticalnexin serum (1:100) as previously described (Lin et al., 1998). Detection was with Texas red– or FITC-conjugated donkey anti–rabbit F(ab′)2. In some cases cells were doubly stained for CALNUC and either a mouse mAb against Man II (40 μg/ml) or the IP3R-1 (1.25 μg/ml) and appropriate secondary antibodies. Specimens were examined with either a Zeiss Axiophot equipped for epifluorescence or a Bio-Rad confocal microscopy (MRC 1024) equipped with Lasersharp 3.1 software (Bio-Rad) and a krypton-argon laser. Images were processed with Scion Image and Adobe Photoshop (Adobe Systems) software.
Subcellular Fractionation
Sucrose gradient flotation of Golgi fractions was carried out using a protocol similar to those previously published (Fries and Rothman, 1980; Brown and Farquhar, 1987) with minor modifications. In brief, microsomal membranes were resuspended in 1.5 ml 55% sucrose (wt/wt), loaded at the bottom of a sucrose step gradient consisting of 40, 35, 30, 25, and 20% (wt/wt in 1 mM Tris-HCl, pH 7.5), and centrifuged at 85,500 g for 16 h at 4°C using a SW-40Ti rotor (Beckman). 20 fractions were collected from the bottom, followed by SDS-PAGE and immunoblotting for calnexin (an ER marker), Man II (a Golgi marker), and CALNUC.
Rat liver Golgi fractions, membrane (100,000 g pellet) and cytosolic (100,000 g supernatant) fractions were prepared from postnuclear supernatants of transfected HeLa or EcR-CHO-CALNUC cells as previously described (Saucan and Palade, 1994; Jin et al., 1996; Lin et al., 1998).
Immunoblotting and SDS-PAGE
Proteins were separated by 5 or 10% SDS-PAGE, transferred to PVDF membranes, and immunoblotted with affinity-purified anti-CALNUC IgG, anticalnexin, and anti–Man II serum followed by HRP-conjugated anti–rabbit IgG and detection by ECL (Lin et al., 1998).
45Ca2+ Equilibrium Uptake and Release
The procedures followed were those reported previously (Bastianutto et al., 1995). Cells (2 × 10⁶) transfected with CALNUC-GFP or GFP alone were incubated with 45Ca2+ (2 μCi/ml) for 48 h to reach 45Ca2+ equilibrium after which they were washed three times in Krebs-Ringer-Hepes (KRH) buffer (125 mM NaCl, 5 mM KCl, 1.2 mM KH2PO4, 1.2 mM MgSO4, 2 mM CaCl2, 6 mM glucose, and 25 mM Hepes, pH 7.4) and five times with PBS. 45Ca2+ was extracted with 0.1 N HCl (30 min at room temperature) and radioactivity assessed as described above. To examine 45Ca2+ release after stimulation, washed cells were resuspended in KRH supplemented with 3 mM EGTA and stimulated at room temperature with 100 μM ATP or sequentially stimulated with 0.1 μM Tg, 2 μM ionomycin, and 2 μM monensin, 5 min each. Equal aliquots (106 cells) were collected after each stimulation, followed by centrifugation at 14,000 rpm (30 s) and quantification of 45Ca2+ in the supernatant.
Ca2+ Imaging
Noninduced or induced EcR-CHO-CALNUC cells were loaded with 1 mM Fura-2 AM (Molecular Probes Inc.) in Ham's F12 medium/0.5% FCS at 22°C for 1 h, washed with Ca2+-free HBSS (Irvine Scientific) followed by addition of 100 μM ATP. Ca2+ release was monitored by Ca2+ imaging performed on a Zeiss Axiovert microscope equipped with a cooled charge-coupled CCD camera (Photometrics) and MetaFluor software (Universal Imaging). Dual-excitation ratio imaging was obtained using two excitation filters (340DF20 and 380DF20) (Omega Optical and Chroma Technology) mounted on a filter wheel (Lambda 10-2; Sutter Instruments), a 420DRLP dichroic mirror, and a 510DF80 emission filter.
Assessment and Mobilization of Stored Ca2+ by IP3 in Permeabilized Cells
The procedures used were basically similar to those published (Berridge et al., 1984; De Smedt et al., 1997) with minor modifications. To examine equilibrium 45Ca2+ uptake, EcR-CHO-CALNUC cells induced with 5 μM ponasterone A for 24 h in a 6-well culture plate (106 cells/well) were permeabilized at 20°C for 4 min with saponin (50 μg/ml) in loading buffer (140 mM KCl, 20 mM NaCl, 2 mM MgCl2, 2 mM ATP, 0.1 mM EGTA, 20 mM Pipes, pH 6.80), and 0.13 μM free Ca2+ calculated for conditions of pH 6.80, at 20°C (Tsien and Pozzan, 1989). Cells were washed four times with loading buffer and subsequently loaded with 45Ca2+ (10 μCi/ml) for various times (10–60 min). They were then rinsed five times with loading buffer (30 s), stored 45Ca2+ was extracted with 1 ml 0.1 N HCl for 30 min, and 0.5-ml aliquots were counted.
To investigate 45Ca2+ mobilization by IP3, induced and permeabilized EcR-CHO-CALNUC cells were loaded with 10 μCi/ml of 45Ca2+ as above for 45 min. After washing (five times over 1–1.5 min), cells were challenged with 10 μM IP3 (d-myo-inositol 1,4,5-trisphosphate potassium salt) in loading buffer, 1 ml/well. Solutions were collected at 2-min intervals, replaced with loading buffer containing IP3, and counted.
Results
Quantification of Endogenous CALNUC in Rat Liver Golgi Fractions and NRK Cells
To quantify endogenous CALNUC in rat liver Golgi fractions, a linear standard curve was obtained for purified His6-CALNUC (1.3–40 ng) by immunoblotting and densitometric analysis (data not shown). Endogenous CALNUC was found to be present in pooled Golgi light and heavy fractions from rat liver (Saucan and Palade, 1994; Jin et al., 1996) at a concentration of 3.8 μg/mg Golgi protein, i.e., ∼0.4% of the total Golgi protein (includes both Golgi resident proteins and cargo in transit through the Golgi). NRK cells were found to have 0.02 μg CALNUC/ 106 cells, or 2.5 × 10⁵ CALNUC molecules/NRK cell.
CALNUC EF-1 Is an Ideal EF-Hand Ca2+-binding Motif and Constitutes a High Affinity, Low Capacity Ca2+-binding Site
An ideal EF-hand Ca2+-binding motif has an α helix– loop–α helix structure in which oxygen ligands (O) provided by carboxy side chains of Asp (D)/Glu (E), carbonyl groups (C′O) of the peptide main chain and H2O constitute the Ca2+-binding site, and a hydrophobic amino acid (φ) and a Gly (G) are essential for Ca2+ binding (Kretsinger, 1987; Branden and Tooze, 1991). CALNUC and Cab45 (Scherer et al., 1996) are the only EF-hand, Ca2+-binding proteins identified so far in the Golgi. Since their Ca2+-binding constants are not yet known, in order to predict and compare the Ca2+-binding properties of these two proteins, we compared the EF-hand primary structures of CALNUC (two EF-hands), Cab45 (six EF-hands), and CaM (four EF-hands). Cab45's and CaM's EF-hand motifs are similar (Scherer et al., 1996), and CaM's Ca2+-binding properties have been well characterized.
As shown in Fig. 1 A, CALNUC EF-1, Cab45 EF-2 and -5, and all four CaM EF-hand structures constitute ideal EF-hand motifs. CALNUC EF-1 and EF-2 are strikingly similar to CaM EF-4 and Cab45 EF-5, but CALNUC EF-2 has an Arg (R) instead of Gly at residue 6 (Fig. 1 B). This suggests that CALNUC has only a single ideal EF-hand motif, EF-1.
To investigate the binding affinity of CALNUC for Ca2+, we performed equilibrium dialysis. Purified recombinant His6-CALNUC was used based on a report that recombinant calreticulin (CRT) was comparable to native CRT in its Ca2+-binding capability (Baksh and Michalak, 1991). Scatchard analysis of the binding curve (Fig. 1 C) indicates that CALNUC binds Ca2+ with a high affinity binding constant (K d = 6.6 μM) and a low capacity, ∼1.1 μmol Ca2+/μmol protein, suggesting only one high affinity, low capacity Ca2+-binding site on CALNUC.
Overexpressed CALNUC Colocalizes with the Golgi Marker Man II
To further investigate Ca2+ binding to CALNUC in vivo, we expressed CALNUC-GFP by transient transfection in HeLa cells and generated an inducible cell line, EcR-CHO-CALNUC, stably expressing CALNUC. By immunoblotting, CALNUC-GFP (90 kD) was detected in transiently transfected HeLa cells but not in nontransfected cells (Fig. 2 A). The majority of the CALNUC (∼85%) was associated with membranes (100,000 g pellet) and the remainder (15%) was present in the cytosolic fraction (100,000 g supernatant). Three additional bands (Fig. 2 A), also visualized after in vitro translation (data not shown), were also seen. They could be products of protein degradation or mistranslated CALNUC retained in the cytosol. By immunofluorescence the distribution of CALNUC-GFP overlapped with that of the Golgi marker Man II (Fig. 3 A), indicating that the majority of the CALNUC-GFP is correctly targeted to the Golgi.
Figure 2.

Biochemical analysis of CALNUC expression in transfected cells. (A) HeLa cells transiently transfected with CALNUC-GFP. By immunoblotting (50 μg protein), ∼85% of the CALNUC-GFP (90 kD) is associated with the membrane pellet (M), and the remaining 15% is found in the cytosolic fraction (Cyt). No signal was detected in nontransfected HeLa cells (N.T.) when the same amount of protein was examined. HeLa cells transfected with CALNUC-GFP cDNA (48 h) were homogenized and membrane (100,000 g pellet) and cytosolic (100,000 g supernatant) fractions were prepared from the postnuclear supernatant. The pellet was resuspended in the same volume as the supernatant, and equal volumes of the membrane and cytosolic fractions were analyzed by SDS-PAGE and immunoblotted with affinity-purified anti-CALNUC IgG. (B) Expression of CALNUC in inducible, stably transfected EcR-CHO-CALNUC cells. By immunoblotting increasing amounts of CALNUC were detected in cell lysates (80 μg) after induction with increasing amounts (0.5–10 μM) of muristerone A. Cells stably transfected with CALNUC were lysed in 1% Triton X-100. Lysates (80 μg) were separated by SDS-PAGE and immunoblotted with affinity-purified anti-CALNUC IgG.
Figure 3.
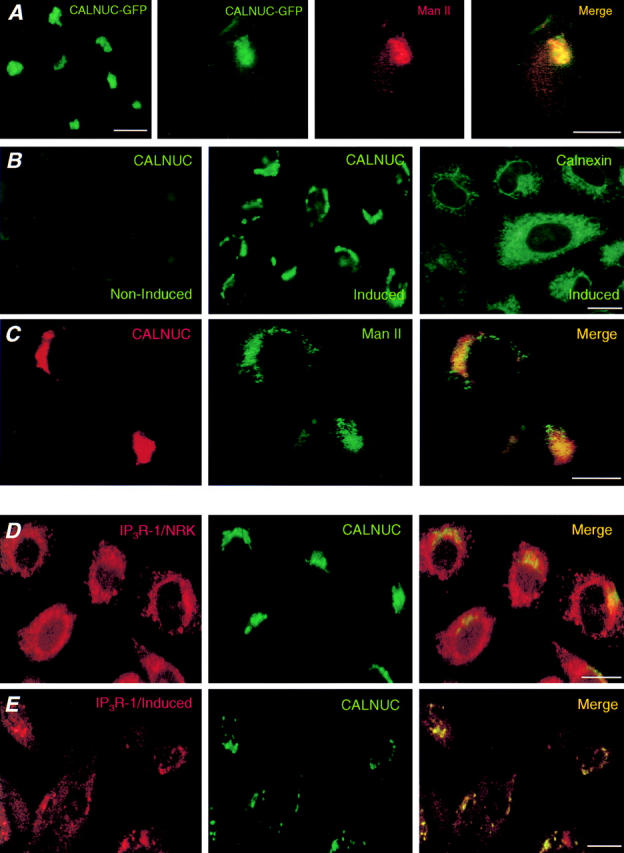
(A–C) Overexpressed CALNUC is correctly targeted to the Golgi. (A) HeLa cells transiently expressing CALNUC-GFP. CALNUC-GFP is concentrated in the Golgi region where it partially overlaps with the Golgi marker Man II. Cells were fixed in paraformaldehyde, permeabilized, and incubated with anti–Man II serum followed by Texas red–conjugated donkey anti–rabbit F(ab′)2 as described in Materials and Methods. (B) Induced or noninduced EcR-CHO-CALNUC cells. Overexpressed CALNUC is concentrated in the Golgi region in the induced cells in a pattern distinct from that of the ER marker, calnexin. Virtually no signal is detected in noninduced cells. Induced (muristerone A, 10 μM for 24 h) or noninduced cells were labeled with affinity-purified anti-CALNUC or anticalnexin serum and processed as in A. (C) Double labeling of induced EcR-CHO-CALNUC cells with anti-CALNUC IgG and anti–Man II mAb. The distribution of overexpressed CALNUC overlaps with that of Man II in the Golgi. Detection was with Texas red–conjugated donkey anti–mouse IgG and FITC-conjugated donkey anti–rabbit IgG. (D) Codistribution of IP3R with both ER and Golgi. NRK cells coimmunostained as above with anti-CALNUC IgG and mAb anti–IP3R-1 (18A10). IP3R-1 has an ER-type distribution and also overlaps with CALNUC in the Golgi region. Analysis was carried out on whole cells. (E) Similar preparation of induced EcR-CHO-CALNUC cells analyzed by confocal microscopy, showing overlap of staining for IP3R and CALNUC. Bars, 10 μm.
In EcR-CHO-CALNUC cells induced with muristerone A or ponasterone A (0.1–10 μM) for 24 h, we found a linear increase in the expression of CALNUC with increasing amounts of added hormone (Fig. 2 B). The ratio of CALNUC in membrane versus cytosolic fractions was similar to that of CALNUC-GFP in HeLa cells (data not shown). By immunofluorescence the distribution of CALNUC again overlapped with that of Man II in the Golgi region (Fig. 3 C) in EcR-CHO-CALNUC cells induced with 10 μM muristerone A for 24 h, and was distinct from that of the ER marker, calnexin (Fig. 3 B).
Cosedimentation of Overexpressed CALNUC and Man II in Sucrose Gradients
Next we analyzed the distribution of CALNUC in induced EcR-CHO-CALNUC cells using an established procedure for flotation of Golgi membranes and their separation from ER membranes. As shown in Fig. 4, we found that CALNUC and Man II cosedimented and peaked in fractions 12–15 with sucrose densities similar to those previously reported (1.10–1.14 g/ml) (Dunphy and Rothman, 1983; Brown and Farquhar, 1987) for CHO cells. By contrast, the ER marker, calnexin, peaked in denser fractions 7–11 (1.16–1.19 g/ml). These results together with the immunofluorescence findings demonstrate that overexpressed CALNUC is found in the Golgi and is consistent with our previous conclusion (Lin et al., 1998) that overexpression does not lead to mistargeting of CALNUC.
Figure 4.

CALNUC cosediments with Man II in sucrose gradients. Total microsomes prepared from induced EcR-CHO-CALNUC cells were subjected to sucrose gradient flotation (85,500 g for 16 h) as described in Materials and Methods. 20 fractions were collected from the bottom, followed by 5 or 10% SDS-PAGE and immunoblotting analysis. CALNUC peaked in fractions 12–15 where it cosedimented with the Golgi marker Man II, whereas the ER marker calnexin peaked in denser fractions 7–11.
Overexpression of CALNUC-GFP or CALNUC in the Golgi Increases 45Ca2+ Uptake
To assess whether overexpressed CALNUC-GFP binds Ca2+ in the Golgi, we carried out in vivo equilibrium Ca2+ uptake. The 45Ca2+ loading time was ∼48 h, the time shown previously to be long enough to reach 45Ca2+ equilibrium in cultured cells (Mery et al., 1996). 45Ca2+ uptake by HeLa cells transiently overexpressing CALNUC-GFP was 2.5-fold that of nontransfected HeLa cells or those stably expressing GFP alone (Fig. 5 A). Similarly, there was a threefold increase in 45Ca2+ taken up by induced (5 μM muristerone A for 48 h) versus noninduced EcR-CHO-CALNUC cells (Fig. 5 B). These results demonstrate that Golgi-associated CALNUC binds Ca2+ in vivo and most likely is responsible for sequestering Ca2+ in the Golgi lumen.
Figure 5.

Overexpression of CALNUC increases 45Ca2+ uptake. (A) Nontransfected HeLa cells (N.T.), or those stably transfected with GFP alone, or transiently expressing CALNUC-GFP or CALNUC-GFP deletion mutants were incubated with 2 μCi/ml 45Ca2+ for 48 h to reach 45Ca2+ equilibrium. 45Ca2+ uptake by cells overexpressing CALNUC-GFP was 2.5-fold (2,500 vs. 1,000 cpm) greater than that found in nontransfected cells or those expressing GFP alone. Truncated CALNUC in which both EF-1 [CN(ΔEF-1)-GFP] or EF-1 and EF-2 [CN(ΔEF-1, 2)-GFP] were deleted completely lost Ca2+-binding capability. (B) EcR-CHO cells stably transfected with CALNUC cDNA (EcR-CHO-CALNUC) were loaded with 45Ca2+ as in A. 45Ca2+ uptake in induced cells (10 μM muristerone A) was threefold that found in noninduced cells (7,400 vs. 2,500 cpm). Results (mean ± SD) represent the average of values obtained in three separate experiments performed in duplicate.
To investigate whether EF-1 is indeed the sole Ca2+-binding motif in CALNUC, we examined Ca2+ binding in HeLa cells transiently transfected with truncated CALNUC-GFP mutants. When the α helix of EF-1 (Asp227– Leu239) or both EF-1 and EF-2 (Asp227–Phe291) were deleted from CALNUC, its Ca2+-binding capability was completely abolished (Fig. 5 A). Mistargeting could be ruled out since the majority of the mutant CALNUC-GFP was detected in the Golgi region by fluorescence. The results obtained from this in vivo Ca2+-binding analysis provide direct evidence that CALNUC binds Ca2+ in the Golgi, and EF-1 constitutes the sole Ca2+-binding site on CALNUC. The latter is in agreement with the data shown in Fig. 1.
Release of Sequestered 45Ca2+ by the SERCA Inhibitor, Tg
To further investigate the characteristics of the Golgi Ca2+ pool, we performed experiments similar to those done previously to characterize the ER Ca2+ pool in cells overexpressing CRT (Bastianutto et al., 1995; Mery et al., 1996). When HeLa cells transiently overexpressing CALNUC-GFP or EcR-CHO-CALNUC cells stably expressing CALNUC were treated with the SERCA inhibitor Tg (Thastrup et al., 1990), ∼73% and 70%, respectively, of the 45Ca2+ was released (Fig. 6), suggesting the existence of SERCA on Golgi membranes. Since some Tg-insensitive organelles are capable of retaining Ca2+ after Tg treatment, we subsequently treated cells with the Ca2+ ionophore ionomycin to release the remaining stored 45Ca2+. Nearly all the remaining 45Ca2+ (∼20–25%) was released by ionomycin (Fig. 6). In view of the fact that ionomycin is inactivated in acidic compartments such as secretory granules and endosomes, we further treated cells with monensin, a carboxylic sodium proton ionophore which releases Ca2+ from acidic compartments (Bastianutto et al., 1995; Mery et al., 1996) and found <5% of the 45Ca2+ was released. Cells overexpressing CALNUC-GFP or induced EcR-CHO-CALNUC cells released twice as much 45Ca2+ as nontransfected HeLa cells, HeLa cells stably expressing GFP alone, or noninduced EcR-CHO-CALNUC cells. The fact that the majority of the 45Ca2+ taken up by CALNUC was released by Tg suggests that both CALNUC and SERCA play a key role in sequestering 45Ca2+ in the Golgi, a conclusion in agreement with the recent description of SERCA associated with isolated Golgi fractions (Taylor et al., 1997).
Figure 6.
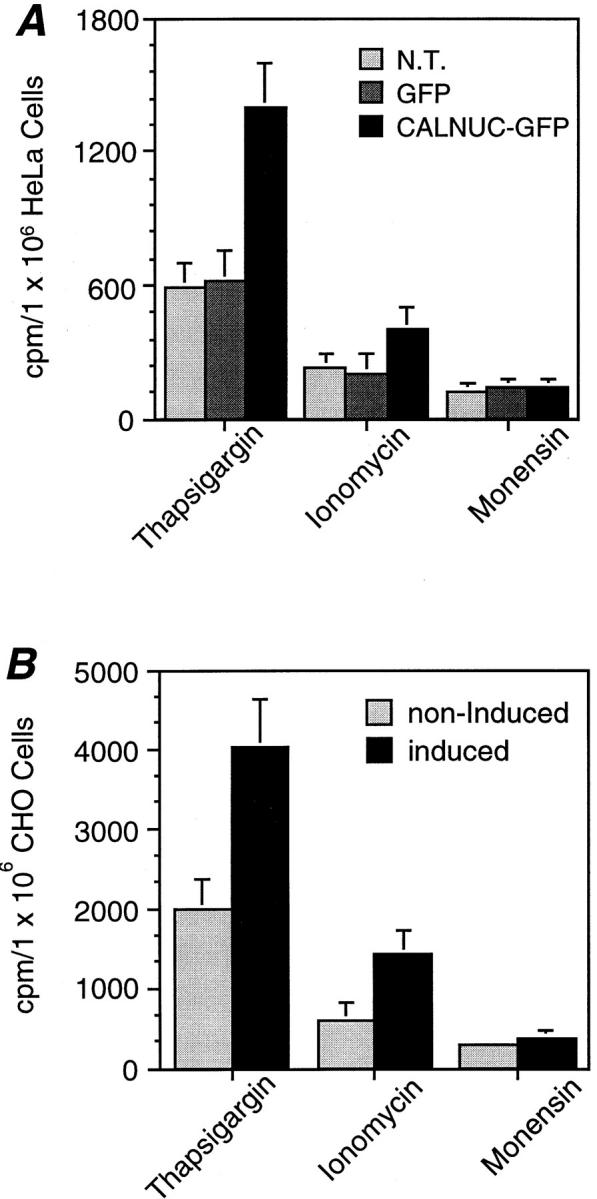
Most of the 45Ca2+ taken up by CALNUC in the Golgi is released by the SERCA inhibitor Tg. Cells were incubated with 45Ca2+ for 48 h as in Fig. 5 and sequentially treated with 0.1 μM Tg, 2 μM ionomycin, and 2 μM monensin. 45Ca2+ release into the medium was measured after each treatment. (A) ∼73%, ∼20%, and 7% of the 45Ca2+ was released from HeLa cells transiently overexpressing CALNUC-GFP after Tg, ionomycin, and monensin treatments, respectively. Nontransfected HeLa cells (N.T.) or those stably expressing GFP alone did not release as much 45Ca2+ as HeLa cells overexpressing CALNUC-GFP. (B) Similar results (70%, 25%, and 5%) for Ca2+ release were obtained for induced (5 μm ponasterone A for 24 h) EcR-CHO-CALNUC cells following sequential treatment as above. Induced cells release twice as much 45Ca2+ as noninduced cells. Results (mean ± SD) represent the average of values obtained in three separate experiments performed in duplicate.
Release of Sequestered Ca2+ from the Golgi by Extracellular ATP
We next examined whether or not Ca2+ sequestered in the Golgi is released after agonist challenge. Extracellular ATP is known to activate phospholipase C (PLC) (Brown et al., 1991) via binding to G protein–coupled nucleotide receptors on the cell surface (O'Connor, 1992). Activated PLC promotes production of IP3 which binds to IP3R on the ER and triggers Ca2+ mobilization. To investigate whether Ca2+ sequestered by overexpressed CALNUC in the Golgi could be released by agonist, we examined Ca2+ release in EcR-CHO-CALNUC cells by Ca2+ imaging after ATP challenge. The results (Fig. 7 A) demonstrated that the ratio, 340:380, was doubled in cells induced with 2.5 μM ponasterone A for 24 h compared with noninduced cells, suggesting that more Ca2+ was released from induced cells. Similar results were also obtained when induced EcR-CHO-CALNUC cells were loaded with 45Ca2+ (Fig. 7 B). These results obtained by two different methods suggest that the Golgi Ca2+ store is sensitive to IP3 generated after ATP binding.
Figure 7.
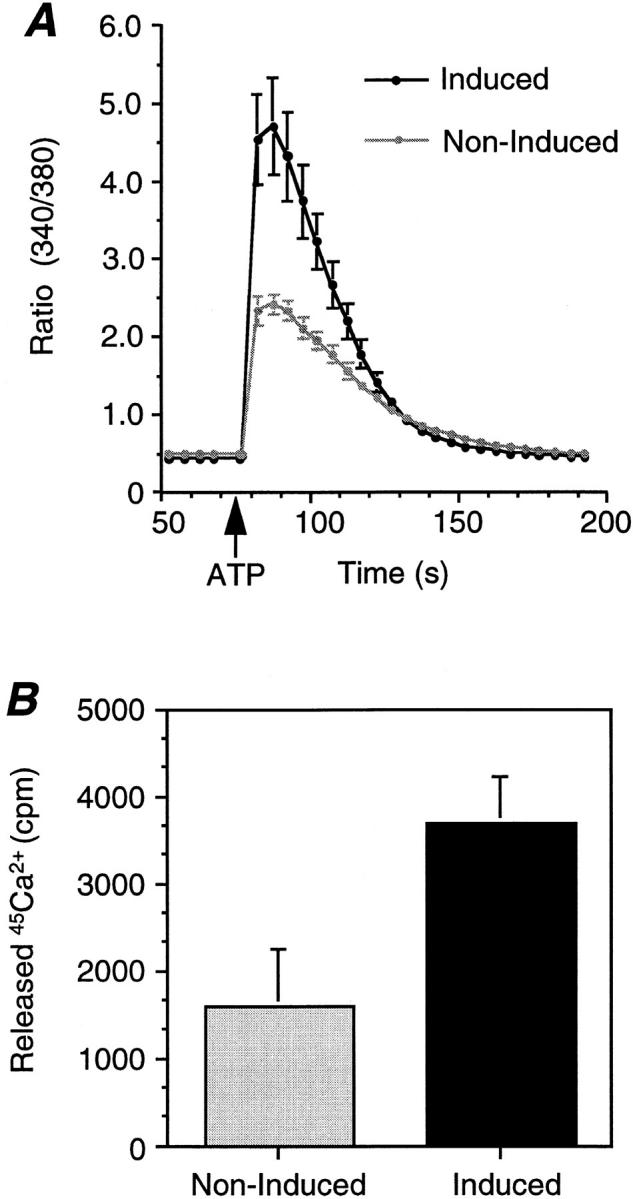
The Golgi Ca2+ pool is sensitive to stimulation with ATP. (A) Induced (2.5 μM ponasterone A for 24 h) or noninduced EcR-CHO-CALNUC cells were loaded with 1 μM Fura-2 AM for 1 h, followed by challenge with 100 μM ATP. Released Ca2+ was monitored by Ca2+ imaging. More Ca2+ was released after ATP stimulation from cells overexpressing CALNUC than from noninduced cells. Results represent the average of values from 14 induced cells and 15 noninduced cells. Reproducible results were obtained from experiments repeated twice. (B) Noninduced or induced EcR-CHO-CALNUC cells were loaded with 45Ca2+ (2 μCi/ml) for 48 h to reach 45Ca2+ equilibrium. Cells were washed and resuspended in KRH buffer supplemented with 3 mM EGTA, followed by stimulation with 100 μM ATP for 5 min at room temperature. Aliquots of 106 cells were subsequently removed, the cells were sedimented, and 45Ca2+ in supernatants and pellets was assessed. Compared with noninduced cells, there was a twofold increase in the 45Ca2+ released in cells overexpressing CALNUC. Results (mean ± SD) represent the average of values obtained in three separate experiments performed in duplicate.
Release of 45Ca2+ Sequestered in the Golgi by IP3
To obtain direct evidence that IP3 is able to release Ca2+ from the Golgi, 45Ca2+ uptake and release studies were performed on permeabilized EcR-CHO-CALNUC cells. Fig. 8 A reveals that 45Ca2+ is rapidly taken up by both induced and noninduced permeabilized cells, but approximately twice the amount of 45Ca2+ was sequestered by cells overexpressing CALNUC. Steady state was achieved 45 min after loading, which was slower than reported for Swiss 3T3 cells (20 min) (Berridge et al., 1984). 45Ca2+ release was then stimulated by addition of IP3 (Fig. 8 B). The ratio of 45Ca2+ released from induced versus noninduced cells was ∼2:1. These results support the previous report of Pinton and colleagues (1998) suggesting that both Golgi membranes and ER membranes bear IP3R.
Figure 8.
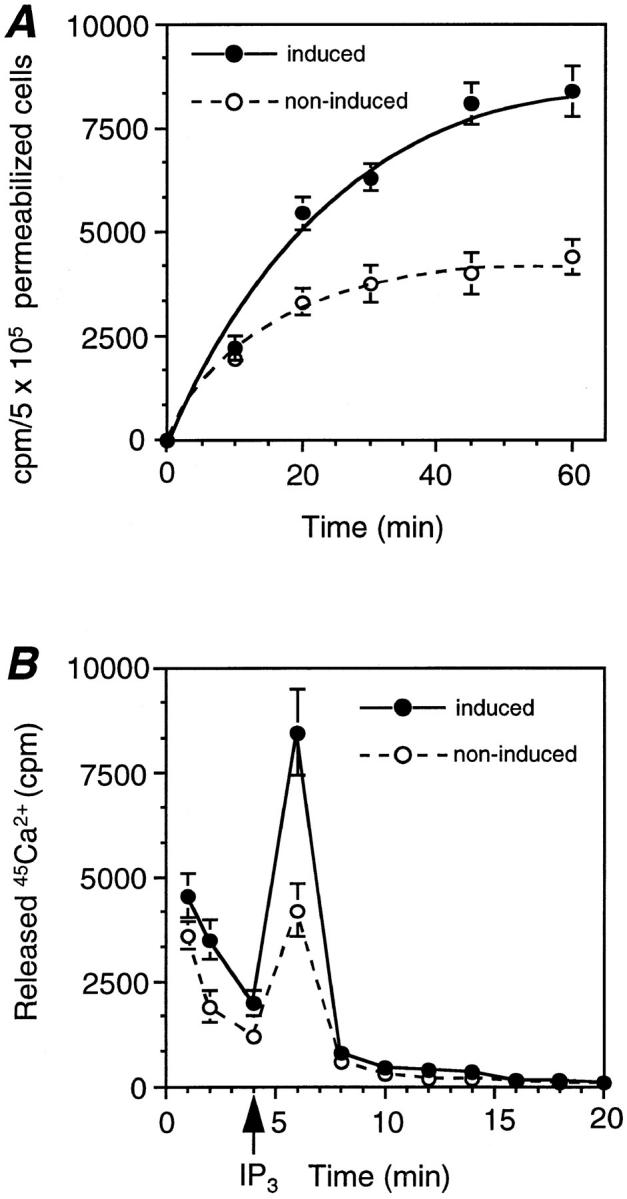
Ca2+ sequestered by CALNUC in the Golgi was released directly by IP3 treatment of permeabilized cells. (A) 45Ca2+ uptake. Noninduced or induced EcR-CHO-CALNUC cells (106 cells/well) were permeabilized with 50 μg/ml saponin for 4 min, followed by loading with 45Ca2+ (10 μCi/ml) for the times indicated. Stored 45Ca2+ was extracted with 1 ml 0.1 N HCl for 30 min, and 0.5-ml aliquots were counted. Induced cells took up twice as much 45Ca2+ as noninduced cells. 45Ca2+ uptake reached equilibrium at ∼45 min after loading. (B) 45Ca2+ release. Induced or noninduced EcR-CHO-CALNUC cells (106 cells/ well) were permeabilized and loaded with 10 μCi/ml of 45Ca2+ for 45 min to reach equilibrium and IP3 (10 μM) was added. Aliquots (10) were collected at 2-min intervals. Stored 45Ca2+ could be directly released by IP3. Twice as much 45Ca2+ was released from induced as noninduced cells. Results (mean ± SD) represent the average of values obtained in three separate experiments performed in duplicate.
Localization of the IP3 Receptor on the Golgi and ER by Immunofluorescence
In view of the functional evidence for the existence of IP3R on the Golgi, we carried out immunofluorescence studies on NRK cells and induced EcR-CHO-CALNUC cells using a mAb that recognizes IP3R-1. IP3R-1 was found throughout the cytoplasm and concentrated in the Golgi region (Fig. 3 D) which is compatible with both an ER and Golgi localization. Confocal analysis (Fig. 3 E) showed that the distribution of IP3R-1 overlaps with that of CALNUC in the juxtanuclear region, suggesting that IP3R-1 and CALNUC colocalize on Golgi membranes. As mentioned by Pinton and co-workers (1998), it was not possible to carry out reproducible immunogold localization by immunoelectron microscopy with the antibody available.
Discussion
The Golgi complex has been recently identified as a Ca2+-enriched compartment whose total Ca2+ concentration is >0.1 mM (Chandra et al., 1991; Pezzati et al., 1997; Pinton et al., 1998), but the question of how Ca2+ is sequestered in the Golgi has remained unanswered. Previously we showed that CALNUC is the major Ca2+-binding protein in Golgi fractions from rat liver detected by 45Ca2+ overlay (Lin et al., 1998). In this study we provide evidence that CALNUC binds Ca2+ in the Golgi in vivo, because overexpression of CALNUC in the Golgi led to a two- to threefold increase in Ca2+ storage based on Ca2+ equilibrium loading. This suggests that CALNUC is directly involved in maintenance of Ca2+ storage and thereby in Ca2+ homeostasis in the Golgi. Equilibrium dialysis demonstrated the existence of only a single high affinity (K d = 6.6 μM)/low capacity (∼1 mol Ca2+/mol protein) binding site on recombinant CALNUC. CALNUC's low Ca2+-binding capacity in the Golgi might be compensated for by its abundance (3.8 μg/mg Golgi protein).
The demonstration of a single, high affinity Ca2+-binding site is in keeping with the fact that CALNUC possesses two EF-hand motifs but only one, EF-1, has the structure expected for high affinity calcium binding. EF-2 has an Arg (R) instead of a Gly (G) at residue 6 of the EF-hand loop region. Arg is supposed to disrupt the EF-hand motif and abolish its Ca2+-binding capacity (Branden and Tooze, 1991). CALNUC's EF-1 has the highest homology to the COOH-terminal EF-4 of CaM which constitutes the high affinity Ca2+-binding site of CaM (Crouch and Klee, 1980). Moreover, the Ca2+-binding capability of CALNUC EF-1 was demonstrated previously by 45Ca2+ overlay on truncated CALNUC. When EF-2 was deleted, Ca2+ binding was maintained, but when both EF-1 and EF-2 were deleted, Ca2+-binding capability was lost (Miura et al., 1994). In this study, we further demonstrated that truncated CALNUC with either the EF-1 α helix (Asp227– Leu239) or both EF-1 and EF-2 domains (Asp227–Phe291) deleted lost Ca2+-binding capability completely. The majority of each of the CALNUC mutant proteins was still targeted to the Golgi region as monitored via the GFP tag. Collectively, these data suggest that EF-1 may constitute the sole high affinity Ca2+-binding site on CALNUC.
Characterization of the Ca2+ pool in HeLa and CHO cells overexpressing CALNUC provides several important new pieces of information. 45Ca2+ sequestered in the Golgi in cells overexpressing CALNUC was largely released by Tg, an irreversible inhibitor of the SERCA Ca2+ pump, providing in vivo evidence for the existence of SERCAs on Golgi membranes. SERCAs were also assumed to be localized on Golgi membranes because it was shown previously that the p-type, Tg-sensitive SERCA Ca2+ pump was essential for Ca2+ uptake into isolated Golgi fractions in vitro (Taylor et al., 1997). Our results also suggest that the increase in 45Ca2+ uptake in cells overexpressing CALNUC is not likely to be due to the presence of CALNUC in the cytosol or another recently reported Tg- and IP3-insensitive Ca2+ pool (Pizzo et al., 1997) since the majority of the Ca2+ was released only after SERCA was inhibited.
Our finding that only a small amount of the Ca2+ remaining after Tg treatment was released by subsequent ionomycin treatment might be due to incomplete depletion of Ca2+ from the Golgi by Tg, since the existence of a Tg-insensitive/ionomycin-sensitive–plasma membrane calcium ATPase Ca2+ pump on Golgi membranes has also been reported recently (Taylor et al., 1997). The fact that monensin treatment which depletes Ca2+ from acidic compartments (secretory vesicles, granules, trans-Golgi network) (Fasolato et al., 1991) did not release a significant amount of Ca2+ demonstrates that Ca2+ was not sequestered in an acidic compartment. Thus, our current results from in vivo studies suggest that the Ca2+-binding protein CALNUC together with SERCA Ca2+ pumps are responsible for the maintenance of the Golgi Ca2+ storage pool.
We also investigated the agonist sensitivity of the Golgi Ca2+ pool. It was shown recently that the Golgi Ca2+ store is sensitive to histamine, an agonist known to be coupled to IP3 generation (Pinton et al., 1998), suggesting that there may be IP3R on Golgi membranes. Here we used extracellular ATP, another agonist known to generate IP3 after binding to plasma membrane nucleotide receptors (P2y-purinoceptors) (O'Connor, 1992), to investigate the sensitivity of the Golgi Ca2+ store to IP3. ATP challenge is coupled to IP3 production via activation of PLC (Brown et al., 1991), and binding of IP3 to IP3R on the surface of Ca2+ pool releases intracellular Ca2+ (Iredale and Hill, 1993). When ATP was added to induced EcR-CHO-CALNUC cells, there was a rapid release of sequestered Ca2+ revealed by both Ca2+ imaging and 45Ca2+ which far exceeded that released from noninduced cells. Moreover, IP3 directly triggered 45Ca2+ mobilization from the Golgi in permeabilized EcR-CHO-CALNUC cells. Thus, our biochemical results and those of Pinton et al. (1998) using histamine as agonist suggest that the Golgi apparatus bears IP3R. The assumption that IP3R are expressed on the Golgi is supported by our immunofluorescence observations suggesting a dual localization of IP3R-1 on both ER and Golgi membranes. CHO cells were found previously to express ample IP3R-1 by immunoprecipitation (Monkawa et al., 1995) using mAb 18A10 (Furuichi et al., 1989) which specifically recognizes the COOH terminus of IP3R-1.
A major controversy in the physiology of intracellular Ca2+ stores concerns the mechanism by which their depletion triggers influx of Ca2+ through the plasma membrane. In vertebrate cells, it has been assumed generally that the relevant store is the ER (Randriamampita and Tsien, 1993; Parekh and Penner, 1997). However, because both ER and Golgi accumulate Ca2+ via SERCAs and release Ca2+ via IP3 receptors, both should undergo depletion roughly in parallel, so one cannot yet exclude a role for the Golgi in controlling plasma membrane Ca2+ influx. In yeast, store-operated Ca2+ influx appears to be controlled mainly at the Golgi, because genetic deletion of the Golgi Ca2+ pump encoded by PMR1 increases the influx of extracellular Ca2+ (Halachmi and Eilam, 1996). Therefore, we tried to distinguish between ER and Golgi contributions by testing whether overexpression of CALNUC in Xenopus oocytes affected the store-operated Ca2+ current, Isoc (Yao and Tsien, 1997). If the Golgi were important, increasing the quantity of Ca2+ buffer in its lumen should diminish or delay Isoc (Mery et al., 1996; Fasolato et al., 1998). Overexpression of CALNUC (via microinjection of its mRNA) increased the 45Ca2+ content of oocytes analogously with Fig. 5 and appeared by fluorescence microscopy to be colocalized with the Golgi marker galactosyltransferase fused to GFP (Llopis et al., 1998). However, CALNUC overexpression did not significantly affect Isoc, either partially activated by the membrane-permeant Ca2+ buffer TPEN (Arslan et al., 1985; Hofer et al., 1998) or maximally activated by the ionophore ionomycin. This negative result might seem to argue against a major role for the Golgi in controlling Ca2+ influx into oocytes, but a firm conclusion would require additional controls such as immunoelectron microscopic localization of CALNUC and evidence that comparable increases in ER buffering do affect Isoc.
Previously, we demonstrated significant homology between CALNUC and CRT and two conserved motifs, AY(I/A)EE and QRLX(Q/E)E(I/E)E, located in the C-domain of CRT (aa337–341 and 365–372) (Lin et al., 1998). However, the homologous regions do not involve Ca2+-binding domains. CRT lacks EF-hand motifs but possesses a high affinity/low capacity and a low affinity (K d = 2 mM)/ high capacity (21 μmol Ca2+/μmol protein) Ca2+-binding site (Baksh and Michalak, 1991) constituted by clusters of ∼35 Asp (D)/Glu (E) located in CRT's C-domain. In the future it will be of interest to examine whether CALNUC can function like CRT, its ER-resident counterpart (Lin et al., 1998), to maintain a high Ca2+ concentration required for Golgi functions, e.g., sorting, lectin binding, budding, and concentration of cargo into regulated secretory granules.
In summary, this study demonstrates that CALNUC, an abundant Golgi resident protein and the major Golgi Ca2+-binding protein, together with SERCA Ca2+ pumps and IP3R are involved in the maintenance of the Ca2+ storage pool in the Golgi. Further investigation of several remaining intriguing questions including whether the binding of Ca2+ to CALNUC regulates membrane traffic or posttranslational processing events in the Golgi, should shed light on the biological functions of CALNUC and on the Golgi Ca2+ pool.
Acknowledgments
We thank Dr. Larry Goldstein (Howard Hughes Medical Institute, UCSD) for use of his confocal microscope, and Dr. Ralf-Peter Czekay for assistance in the confocal analysis. We also thank Michele Wilhite and Tammie McQuistan (Immunoelectron Microscopy Core Facility) for their valuable assistance in the immunocytochemical studies, and Dennis Young (Flow Cytometry Core Facility, UCSD) for assistance in FACS® sorting.
This work was supported by National Institutes of Health grants DK17780 and CA58689 to M.G. Farquhar, and National Institutes of Health grant NS27177 and a Human Frontiers Science Program Grant to R.Y. Tsien.
Abbreviations used in this paper
- CaM
calmodulin
- CRT
calreticulin
- GFP
green fluorescent protein
- IP3R
inositol 1, 4, 5 trisphosphate receptor
- Man II
α-mannosidase II
- PLC
phospholipase C
- SERCA
sarcoplasmic/ER calcium ATPase
- Tg
thapsigargin
References
- Arslan P, Di Virgilio F, Beltrame M, Tsien RY, Pozzan T. Cytosolic Ca2+ homeostasis in Ehrlich and Yoshida carcinomas. A new, membrane-permeant chelator of heavy metals reveals that these ascites tumor cell lines have normal cytosolic free Ca2+ . J Biol Chem. 1985;260:2719–2727. [PubMed] [Google Scholar]
- Baksh S, Michalak M. Expression of calreticulin in Escherichia coli and identification of its Ca2+binding domains. J Biol Chem. 1991;266:21458–21465. [PubMed] [Google Scholar]
- Bastianutto C, Clementi E, Codazzi F, Podini P, De Giorgi F, Rizzuto R, Meldolesi J, Pozzan T. Overexpression of calreticulin increases the Ca2+ capacity of rapidly exchanging Ca2+stores and reveals aspects of their lumenal microenvironment and function. J Cell Biol. 1995;130:847–855. doi: 10.1083/jcb.130.4.847. [DOI] [PMC free article] [PubMed] [Google Scholar]
- Baumrucker CR, Keenan TW. Membranes of mammary gland. X. Adenosine triphosphate dependent calcium accumulation by Golgi apparatus rich fractions from bovine mammary gland. Exp Cell Res. 1975;90:253–260. doi: 10.1016/0014-4827(75)90314-6. [DOI] [PubMed] [Google Scholar]
- Berridge MJ, Heslop JP, Irvine RF, Brown KD. Inositol trisphosphate formation and calcium mobilization in Swiss 3T3 cells in response to platelet-derived growth factor. Biochem J. 1984;222:195–201. doi: 10.1042/bj2220195. [DOI] [PMC free article] [PubMed] [Google Scholar]
- Branden, C., and J. Tooze. 1991. Motifs of protein structure. In Introduction to Protein Structure. C. Branden and J. Tooze, editors. Garland Publishing, New York.
- Brown HA, Lazarowski ER, Boucher RC, Harden TK. Evidence that UTP and ATP regulate phospholipase C through a common extracellular 5′-nucleotide receptor in human airway epithelial cells. Mol Pharmacol. 1991;40:648–655. [PubMed] [Google Scholar]
- Brown WJ, Farquhar MG. The distribution of 215-kilodalton mannose 6-phosphate receptors within cis (heavy) and trans (light) Golgi subfractions varies in different cell types. Proc Natl Acad Sci USA. 1987;84:9001–9005. doi: 10.1073/pnas.84.24.9001. [DOI] [PMC free article] [PubMed] [Google Scholar]
- Chandra S, Kable EP, Morrison GH, Webb WW. Calcium sequestration in the Golgi apparatus of cultured mammalian cells revealed by laser scanning confocal microscopy and ion microscopy. J Cell Sci. 1991;100:747–752. doi: 10.1242/jcs.100.4.747. [DOI] [PubMed] [Google Scholar]
- Crouch TH, Klee CB. Positive cooperative binding of calcium to bovine brain calmodulin. Biochemistry. 1980;19:3692–3698. doi: 10.1021/bi00557a009. [DOI] [PubMed] [Google Scholar]
- Davidson HW, Rhodes CJ, Hutton JC. Intraorganellar calcium and pH control proinsulin cleavage in the pancreatic beta cell via two distinct site-specific endopeptidases. Nature. 1988;333:93–96. doi: 10.1038/333093a0. [DOI] [PubMed] [Google Scholar]
- De Smedt F, Missiaen L, Parys JB, Vanweyenberg V, De Smedt H, Erneux C. Isoprenylated human brain type I inositol 1,4,5-trisphosphate 5-phosphatase controls Ca2+oscillations induced by ATP in Chinese hamster ovary cells. J Biol Chem. 1997;272:17367–17375. doi: 10.1074/jbc.272.28.17367. [DOI] [PubMed] [Google Scholar]
- Duncan JS, Burgoyne RD. Characterization of the effects of Ca2+depletion on the synthesis, phosphorylation and secretion of caseins in lactating mammary epithelial cells. Biochem J. 1996;317:487–493. doi: 10.1042/bj3170487. [DOI] [PMC free article] [PubMed] [Google Scholar]
- Dunphy WG, Rothman JE. Compartmentation of asparagine-linked oligosaccharide processing in the Golgi apparatus. J Cell Biol. 1983;97:270–275. doi: 10.1083/jcb.97.1.270. [DOI] [PMC free article] [PubMed] [Google Scholar]
- Farquhar, M.G., and H.-P. Hauri. 1997. Protein sorting and vesicular traffic in the Golgi apparatus. In The Golgi Apparatus. E.G. Berger and J. Roth, editors. Birkhauser Verlag, Basel. 63–129.
- Farquhar MG, Palade GE. The Golgi apparatus: 100 years of progress and controversy. Trends Cell Biol. 1998;8:2–11. doi: 10.1016/S0962-8924(97)01187-2. [DOI] [PMC free article] [PubMed] [Google Scholar]
- Fasolato C, Zottini M, Clementi E, Zacchetti D, Meldolesi J, Pozzan T. Intracellular Ca2+ pools in PC12 cells. Three intracellular pools are distinguished by their turnover and mechanisms of Ca2+accumulation, storage, and release. J Biol Chem. 1991;266:20159–20167. [PubMed] [Google Scholar]
- Fasolato C, Pizzo P, Pozzan T. Delayed activation of the store-operated calcium current induced by calreticulin overexpression in RBL-1 cells. Mol Biol Cell. 1998;9:1513–1522. doi: 10.1091/mbc.9.6.1513. [DOI] [PMC free article] [PubMed] [Google Scholar]
- Fries E, Rothman JE. Transport of vesicular stomatitis virus glycoprotein in a cell-free extract. Proc Natl Acad Sci USA. 1980;77:3870–3874. doi: 10.1073/pnas.77.7.3870. [DOI] [PMC free article] [PubMed] [Google Scholar]
- Furuichi T, Yoshikawa S, Miyawaki A, Wada K, Maeda N, Mikoshiba K. Primary structure and functional expression of the inositol 1,4,5–trisphosphate-binding protein P400. Nature. 1989;342:32–38. doi: 10.1038/342032a0. [DOI] [PubMed] [Google Scholar]
- Grohovaz F, Bossi M, Pezzati R, Meldolesi J, Tarelli FT. High resolution ultrastructural mapping of total calcium: electron spectroscopic imaging/electron energy loss spectroscopy analysis of a physically/chemically processed nerve-muscle preparation. Proc Natl Acad Sci USA. 1996;93:4799–4803. doi: 10.1073/pnas.93.10.4799. [DOI] [PMC free article] [PubMed] [Google Scholar]
- Halachmi D, Eilam Y. Elevated cytosolic free Ca2+ concentrations and massive Ca2+ accumulation within vacuoles, in yeast mutant lacking PMR1, a homolog of Ca2+-ATPase. FEBS Lett. 1996;392:194–200. doi: 10.1016/0014-5793(96)00799-5. [DOI] [PubMed] [Google Scholar]
- Hodson S. The ATP-dependent concentration of calcium by a Golgi apparatus-rich fraction isolated from rat liver. J Cell Sci. 1978;30:117–128. doi: 10.1242/jcs.30.1.117. [DOI] [PubMed] [Google Scholar]
- Hofer AM, Fasolato C, Pozzan T. Capacitative Ca2+ entry is closely linked to the filling state of internal Ca2+ stores: a study using simultaneous measurements of ICRAC and intraluminal [Ca2+] J Cell Biol. 1998;140:325–334. doi: 10.1083/jcb.140.2.325. [DOI] [PMC free article] [PubMed] [Google Scholar]
- Iredale PA, Hill SJ. Increases in intracellular calcium via activation of an endogenous P2–purinoceptor in cultured CHO-K1 cells. Br J Pharmacol. 1993;110:1305–1310. doi: 10.1111/j.1476-5381.1993.tb13960.x. [DOI] [PMC free article] [PubMed] [Google Scholar]
- Ivessa NE, De Lemos-Chiarandini C, Gravotta D, Sabatini DD, Kreibich G. The Brefeldin A-induced retrograde transport from the Golgi apparatus to the endoplasmic reticulum depends on calcium sequestered to intracellular stores. J Biol Chem. 1995;270:25960–25967. doi: 10.1074/jbc.270.43.25960. [DOI] [PubMed] [Google Scholar]
- Jin M, Saucan L, Farquhar MG, Palade GE. Rab1a and multiple other Rab proteins are associated with the transcytotic pathway in rat liver. J Biol Chem. 1996;271:30105–30113. doi: 10.1074/jbc.271.47.30105. [DOI] [PubMed] [Google Scholar]
- Kretsinger RH. Calcium coordination and the calmodulin fold: divergent versus convergent evolution. Cold Spring Harbor Symp Quant Biol. 1987;52:499–510. doi: 10.1101/sqb.1987.052.01.057. [DOI] [PubMed] [Google Scholar]
- Lin P, Le-Niculescu H, Hofmeister R, McCaffery JM, Jin M, Henneman H, McQuistan T, De Vries L, Farquhar M. The mammalian calcium-binding protein, nucleobindin (CALNUC), is a Golgi resident protein. J Cell Biol. 1998;141:1515–1527. doi: 10.1083/jcb.141.7.1515. [DOI] [PMC free article] [PubMed] [Google Scholar]
- Llopis J, McCaffery JM, Miyawaki A, Farquhar MG, Tsien RY. Measurement of cytosolic, mitochondrial, and Golgi pH in single living cells with green fluorescent proteins. Proc Natl Acad Sci USA. 1998;95:6803–6808. doi: 10.1073/pnas.95.12.6803. [DOI] [PMC free article] [PubMed] [Google Scholar]
- MacLennan DH, Wong PT. Isolation of a calcium-sequestering protein from sarcoplasmic reticulum. Proc Natl Acad Sci USA. 1971;68:1231–1235. doi: 10.1073/pnas.68.6.1231. [DOI] [PMC free article] [PubMed] [Google Scholar]
- Meldolesi J, Pozzan T. The endoplasmic reticulum Ca2+store: a view from the lumen. Trends Biochem Sci. 1998;23:10–14. doi: 10.1016/s0968-0004(97)01143-2. [DOI] [PubMed] [Google Scholar]
- Mery L, Mesaeli N, Michalak M, Opas M, Lew DP, Krause KH. Overexpression of calreticulin increases intracellular Ca2+ storage and decreases store-operated Ca2+influx. J Biol Chem. 1996;271:9332–9339. doi: 10.1074/jbc.271.16.9332. [DOI] [PubMed] [Google Scholar]
- Miura K, Titani K, Kurosawa Y, Kanai Y. Molecular cloning of nucleobindin, a novel DNA-binding protein that contains both a signal peptide and a leucine zipper structure. Biochem Biophys Res Commun. 1992;187:375–380. doi: 10.1016/s0006-291x(05)81503-7. [DOI] [PubMed] [Google Scholar]
- Miura K, Kurosawa Y, Kanai Y. Calcium-binding activity of nucleobindin mediated by an EF hand moiety. Biochem Biophys Res Commun. 1994;199:1388–1393. doi: 10.1006/bbrc.1994.1384. [DOI] [PubMed] [Google Scholar]
- Monkawa T, Miyawaki A, Sugiyama T, Yoneshima H, Yamamoto-Hino M, Furuichi T, Saruta T, Hasegawa M, Mikoshiba K. Heterotetrameric complex formation of inositol 1,4,5-trisphosphate receptor subunits. J Biol Chem. 1995;270:14700–14704. doi: 10.1074/jbc.270.24.14700. [DOI] [PubMed] [Google Scholar]
- Neville MC, Selker F, Semple K, Watters C. ATP-dependent calcium transport by a Golgi-enriched membrane fraction from mouse mammary gland. J Membr Biol. 1981;61:97–105. doi: 10.1007/BF02007636. [DOI] [PubMed] [Google Scholar]
- O'Connor SE. Recent developments in the classification and functional significance of receptors for ATP and UTP, evidence for nucleotide receptors. Life Sci. 1992;50:1657–1664. doi: 10.1016/0024-3205(92)90420-t. [DOI] [PubMed] [Google Scholar]
- Parekh AB, Penner R. Store depletion and calcium influx. Physiol Rev. 1997;77:901–930. doi: 10.1152/physrev.1997.77.4.901. [DOI] [PubMed] [Google Scholar]
- Pezzati R, Bossi M, Podini P, Meldolesi J, Grohovaz F. High-resolution calcium mapping of the endoplasmic reticulum-Golgi-exocytic membrane system. Electron energy loss imaging analysis of quick frozen-freeze dried PC12 cells. Mol Biol Cell. 1997;8:1501–1512. doi: 10.1091/mbc.8.8.1501. [DOI] [PMC free article] [PubMed] [Google Scholar]
- Pinton P, Pozzan T, Rizzuto R. The Golgi apparatus is an inositol 1,4,5-trisphosphate-sensitive Ca2+store, with functional properties distinct from those of the endoplasmic reticulum. EMBO (Eur Mol Biol Organ) J. 1998;17:5298–5308. doi: 10.1093/emboj/17.18.5298. [DOI] [PMC free article] [PubMed] [Google Scholar]
- Pizzo P, Fasolato C, Pozzan T. Dynamic properties of an inositol 1,4,5-trisphosphate– and thapsigargin-insensitive calcium pool in mammalian cell lines. J Cell Biol. 1997;136:355–366. doi: 10.1083/jcb.136.2.355. [DOI] [PMC free article] [PubMed] [Google Scholar]
- Randriamampita C, Tsien RY. Emptying of intracellular Ca2+ stores releases a novel small messenger that stimulates Ca2+influx. Nature. 1993;364:809–814. doi: 10.1038/364809a0. [DOI] [PubMed] [Google Scholar]
- Saucan L, Palade GE. Membrane and secretory proteins are transported from the Golgi complex to the sinusoidal plasmalemma of hepatocytes by distinct vesicular carriers. J Cell Biol. 1994;125:733–741. doi: 10.1083/jcb.125.4.733. [DOI] [PMC free article] [PubMed] [Google Scholar]
- Scherer PE, Lederkremer GZ, Williams S, Fogliano M, Baldini G, Lodish HF. Cab45, a novel Ca2+-binding protein localized to the Golgi lumen. J Cell Biol. 1996;133:257–268. doi: 10.1083/jcb.133.2.257. [DOI] [PMC free article] [PubMed] [Google Scholar]
- Sorin A, Rosas G, Rao R. PMR1, a Ca2+-ATPase in yeast Golgi, has properties distinct from sarco/endoplasmic reticulum and plasma membrane calcium pumps. J Biol Chem. 1997;272:9895–9901. doi: 10.1074/jbc.272.15.9895. [DOI] [PubMed] [Google Scholar]
- Taylor RS, Jones SM, Dahl RH, Nordeen MH, Howell KE. Characterization of the Golgi complex cleared of proteins in transit and examination of calcium uptake activities. Mol Biol Cell. 1997;8:1911–1931. doi: 10.1091/mbc.8.10.1911. [DOI] [PMC free article] [PubMed] [Google Scholar]
- Thastrup O, Cullen PJ, Drobak BK, Hanley MR, Dawson AP. Thapsigargin, a tumor promoter, discharges intracellular Ca2+ stores by specific inhibition of the endoplasmic reticulum Ca2+-ATPase. Proc Natl Acad Sci USA. 1990;87:2466–2470. doi: 10.1073/pnas.87.7.2466. [DOI] [PMC free article] [PubMed] [Google Scholar]
- Thielens NM, Van Dorsselaer A, Gagnon J, Arlaud GJ. Chemical and functional characterization of a fragment of C1-s containing the epidermal growth factor homology region. Biochemistry. 1990;29:3570–3578. doi: 10.1021/bi00466a021. [DOI] [PubMed] [Google Scholar]
- Tsien RW, Tsien RY. Calcium channels, stores, and oscillations. Annu Rev Cell Biol. 1990;6:715–760. doi: 10.1146/annurev.cb.06.110190.003435. [DOI] [PubMed] [Google Scholar]
- Tsien RY, Pozzan T. Measurement of cytosolic free Ca2+with Quin2. Methods Enzymol. 1989;172:230–262. doi: 10.1016/s0076-6879(89)72017-6. [DOI] [PubMed] [Google Scholar]
- Velasco A, Hendricks L, Moremen KW, Tulsiani DR, Touster O, Farquhar MG. Cell type–dependent variations in the subcellular distribution of α-mannosidase I and II. J Cell Biol. 1993;122:39–51. doi: 10.1083/jcb.122.1.39. [DOI] [PMC free article] [PubMed] [Google Scholar]
- Virk SS, Kirk CJ, Shears SB. Ca2+ transport and Ca2+-dependent ATP hydrolysis by Golgi vesicles from lactating rat mammary glands. Biochem J. 1985;226:741–748. doi: 10.1042/bj2260741. [DOI] [PMC free article] [PubMed] [Google Scholar]
- Wendel M, Sommarin Y, Bergman T, Heinegard D. Isolation, characterization, and primary structure of a calcium-binding 63-kD bone protein. J Biol Chem. 1995;270:6125–6133. doi: 10.1074/jbc.270.11.6125. [DOI] [PubMed] [Google Scholar]
- Yao Y, Tsien RY. Calcium current activated by depletion of calcium stores in Xenopusoocytes. J Gen Physiol. 1997;109:703–715. doi: 10.1085/jgp.109.6.703. [DOI] [PMC free article] [PubMed] [Google Scholar]
- Zha X, Morrison GH. Ion microscopy evidence that La3+ releases Ca2+from Golgi complex in LLC-PK1 cells. Am J Physiol. 1995;269:C923–C928. doi: 10.1152/ajpcell.1995.269.4.C923. [DOI] [PubMed] [Google Scholar]