

Abstract
Using both light and high resolution electron microscopy, we analyzed the spatial and temporal relationships between the Arp2/3 complex and the nucleation activity that is required for lamellipod extension in mammary carcinoma cells after epidermal growth factor stimulation. A rapid two- to fourfold increase in filament barbed end number occurs transiently after stimulation and remains confined almost exclusively to the extreme outer edge of the extending lamellipod (within 100–200 nm of the plasma membrane). This is accompanied by an increase in filament density at the leading edge and a general decrease in filament length, with a specific loss of long filaments. Concomitantly, the Arp2/3 complex is recruited with a 1.5-fold increase throughout the entire cortical filament network extending 1–1.5 μm in depth from the membrane at the leading edge. The recruitment of the Arp2/3 complex at the membrane of the extending lamellipod indicates that Arp2/3 may be involved in initial generation of growing filaments. However, only a small subset of the complex present in the cortical network colocalizes near free barbed ends. This suggests that the 100–200-nm submembraneous compartment at the leading edge of the extending lamellipod constitutes a special biochemical microenvironment that favors the generation and maintenance of free barbed ends, possibly through the locally active Arp2/3 complex, severing or decreasing the on-rate of capping protein. Our results are inconsistent with the hypothesis suggesting uncapping is the dominant mechanism responsible for the generation of nucleation activity. However, they support the hypothesis of an Arp2/3-mediated capture of actin oligomers that formed close to the membrane by other mechanisms such as severing. They also support pointed-end capping by the Arp2/3 complex, accounting for its wide distribution at the leading edge.
Keywords: Arp2/3 complex, actin, nucleation sites, ultrastructure, chemotaxis
Motility is an essential property of cells that is mandatory for normal and pathological processes such as embryonic development, inflammatory responses, or tumor metastasis. In vitro, cell motility is largely associated with the ability to extend F-actin–rich protrusions, usually in the form of lamellipods (Abercrombie et al., 1970; Chen et al., 1994; Verschueren et al., 1994; Xie et al., 1995; Lauffenburger and Horwitz, 1996; Mitchison and Cramer, 1996; Segall et al., 1996; Condeelis, 1998). It is believed that motility is largely dependent on localized actin polymerization at the leading edge of these structures (Mitchison and Cramer, 1996; Mogilner and Oster, 1996; Chan et al., 1998; Condeelis, 1998), whereas further traction of the cell body is achieved through myosin motors (Lee et al., 1993; Oliver et al., 1994; Lauffenburger and Horwitz, 1996; Svitkina et al., 1997). However, the mechanisms controlling actin polymerization at the leading edge are still unclear. For actin to polymerize into filaments, some free ends must be created locally at the leading edge. Efficient polymerization requires that these ends are the fast growing barbed ends of the filaments.
Three potential mechanisms can account for the generation of free barbed ends (for review see Eddy et al., 1997): uncapping preexisting filaments, severing preexisting filaments, or de novo nucleation of new filaments. Although some of these mechanisms appear more likely than others (Eddy et al., 1997), the mechanism dominating generation of the nucleation sites at the leading edge and its associated molecules (e.g., capping, severing, or nucleating molecules) have yet to be determined. Biochemical analyses have been very useful in giving insights into the potential mechanisms of actin polymerization. However, their relevance to the leading edge is unclear because they can only analyze whole cells. Since mammalian cells are highly compartmentalized, a detailed ultrastructural analysis of the leading edge is necessary. Some of this information has been provided for constitutively moving cells (Small and Celis, 1978; Karlsson et al., 1984; Small, 1988; Small et al., 1995; Svitkina et al., 1995, 1997) and stimulated cells (Hartwig and Shevlin, 1986; Hartwig and Yin, 1988; Hartwig and DeSisto, 1991; Rinnerthaler et al., 1991; Cox et al., 1995), but none of those studies gave clear answers as to where and how the nucleation sites at the leading edge are generated.
Previous studies have demonstrated, using cells microinjected with or permeabilized in the presence of labeled G-actin, that most of the nucleation activity in constitutively moving cells is located at the leading edge of the cell (Okabe and Hirokawa, 1989; Symons and Mitchison, 1991). Okabe and Hirokawa (1989) used electron microscopy to analyze the distribution of microinjected biotin- labeled actin, but focused more on internal structures such as stress fibers and focal contacts. They did show that labeled actin incorporation occurred initially at the “membrane-associated, distal margin of actin meshworks.” However, 5 min after injection, all lamellipodia actin filaments were labeled homogeneously (Okabe and Hirokawa, 1989), making it impossible to determine if the nucleation sites stayed stationary as the cell moved or if they moved with the membrane. A convenient way to control nucleation activity is to use a system where lamellipod extension and cell motility can be stimulated with known reproducible kinetics (Segall et al., 1996; Bailly et al., 1998). Under such conditions, we showed that the newly generated nucleation sites localize at the tips of lamellipods that extend after stimulation (Chan et al., 1998). We present in this paper a comprehensive study of this phenomenon at the electron microscope level, analyzing the position of the nucleation sites relative to the membrane and the ultrastructure of the actin network at the leading edge as the lamellipod advances.
Recently, it was shown that one of the major players controlling actin polymerization at the leading edge might be the Arp2/3 complex, a structure first described in Acanthamoeba castellani. It is composed of two actin-related proteins, Arp2 and Arp3, and five polypeptides, p40, p35, p19, p18, and p14, all present in approximately equal stoichiometry (Machesky et al., 1994; Mullins et al., 1997). This complex appears to be conserved highly throughout evolution (Machesky et al., 1997; Welch et al., 1997a), and a number of studies suggest that it might play a crucial role in promoting actin assembly in extending lamellipods (Machesky et al., 1997; Welch et al., 1997a,b, 1998; Machesky and Insall, 1998). The Arp2/3 complex has been shown in vitro to interact with actin to increase nucleation activity, cap the pointed ends efficiently, and form branching networks of filaments (Mullins et al., 1998). Its ability to nucleate actin filaments can be enhanced greatly by additional factors (Welch et al., 1998). This has led to the elaboration of a model attempting to describe how the Arp2/3 complex promotes actin polymerization and lamellipod extension (Machesky and Way, 1998; Mullins et al., 1998; Zigmond, 1998). We describe here the first study analyzing the temporal and spatial relationships between the Arp2/3 complex and the actin nucleation sites at the leading edge of cells after stimulation of lamellipod extension, using high resolution electron microscopy. This analysis enables the development of more refined models that account for the control of actin polymerization at the leading edge, including how the nucleation sites might be generated and what role the Arp2/3 complex might play in the complete process.
Materials and Methods
Cells
MTLn3 metastatic rat mammary adenocarcinoma cells were provided by Dr. Garth Nicholson (M.D. Anderson Cancer Center, Houston, TX). Cells were grown in alpha-MEM (Gibco Laboratories), supplemented with 5% FCS and antibiotics, as previously described (Segall et al., 1996). Unless otherwise mentioned, MTLn3 cells were prepared for all experiments as follows: cells were plated at low density in complete medium for ∼24 h and starved for 3 h before the experiment in alpha-MEM medium supplemented with 0.35% BSA and 12 mM Hepes (starvation medium). Stimulation was done with a final concentration of 5 nM murine epidermal growth factor (EGF1; Life Technologies, Inc.) in starvation medium.
Antibodies
Monospecific anti-Arp3, anti-p21, and anti-p34 rabbit polyclonal antibodies were provided by Dr. Matthew Welch (Department of Molecular and Cell Biology, University of California, Berkeley, CA), and have been characterized previously (Welch et al., 1997a). Anti-actin mAb was purchased from Boehringer Mannheim. Cy5-conjugated goat anti–mouse IgG was purchased from Accurate Laboratories and Scientific Corp. Fluorescein-conjugated goat anti–rabbit IgG was purchased from Cappel Laboratories. Goat antibiotin antibodies coupled to 5 nm gold particles, and goat anti–rabbit antibodies coupled to 10 nm gold particles were purchased from Nanoprobes.
Light Microscopy
Immunofluorescence.
Cells were plated on dishes (Mattek) or coverslips as previously described (Bailly et al., 1998) and stimulated with EGF or left untreated. They were fixed for 5 min at 37°C with 3.7% formaldehyde in a buffer containing 5 mM KCl, 137 mM NaCl, 4 mM NaHCO3, 0.4 mM KH2PO4, 1.1 mM Na2HPO4, 2 mM MgCl2, 5 mM Pipes, 2 mM EGTA, and 5.5 mM glucose (cytoskeleton stabilization buffer, pH 6.1; Small and Celis, 1978). They were treated with cold methanol for 2 min, rinsed, and permeabilized for 20 min at room temperature in 0.5% Triton X-100 in stabilization buffer. Next, the cells were rinsed once with 0.1 M glycine in stabilization buffer and incubated for an additional 10 min in glycine. After five washes with TBS (Tris 20 mM, NaCl 154 mM, pH 8), the preparations were blocked/stabilized by incubation for 20 min with 5 μM phalloidin (Calbiochem-Novabiochem Corp.) in TBS, pH 8, supplemented with 1% BSA and 1% FCS. Cells were incubated further for 1 h with primary antibodies followed by five rinses in TBS plus 1% BSA and incubation for 1 h with Cy5-conjugated anti–mouse antibodies and FITC-conjugated anti– rabbit antibodies. After final washes, the coverslips were mounted in 50% glycerol in TBS supplemented with 6 mg/ml N-propyl gallate.
Nucleation Site Visualization and Arp2/3 Colocalization.
Nucleation sites were visualized using a previously described protocol (Chan et al., 1998) with slight modifications. Briefly, cells grown on Mattek dishes were stimulated with EGF, and permeabilized in the presence of 0.45 μM rhodamine-labeled actin (Chan et al., 1998) in buffer C (138 mM KCl, 10 mM Pipes, pH 6.9, 0.1 mM ATP, 3 mM EGTA, pH 6.9, 4 mM MgCl2) with 0.025% saponin and 1% BSA for 1 min. After a brief rinse in buffer C cells were fixed in 3.7% formaldehyde in cytoskeleton stabilization buffer (see above) for 5 min, followed by a 10 min incubation in 0.1 M glycine in cytoskeleton stabilization buffer. After a rinse in TBS, samples were incubated with 5 μM phalloidin for 20 min in TBS/BSA/FCS (pH 8.1, see above), washed five times for 5 min with TBS/BSA, and mounted in 50% glycerol in TBS, pH 8.1, and 6 mg/ml N-propyl gallate. For colocalization of nucleation sites and Arp3 or p21, cells were permeabilized in the presence of rhodamine-labeled actin and fixed with formaldehyde as above. The samples were treated further with methanol for 2 min before being processed for immunolabeling as described in the immunofluorescence protocol above, with the Triton permeabilization step omitted.
Fluorescence Quantification.
Images were taken using constant settings on an Olympus IX70 microscope with 60× NA 1.4 infinity-corrected optics coupled to a computer-driven cooled CCD camera using IPLab Spectrum software (VayTek). The digitized images were converted linearly in NIH Image (program developed at the National Institutes of Health and available on the internet at http://rsb.info.nih.gov/nih-image/) and analyzed using different macros. For measurement of the fluorescence from the leading edge back to ∼3 μm inside the cell, the macro gives the mean of pixel intensity within 1 pixel concentric perimeter, running from the outside of the cell to the inside (Chan et al., 1998). For the kinetic experiment, rhodamine fluorescence was expressed as the mean pixel intensity within a 1.1-μm band covering the whole cell perimeter at the leading edge. As shown previously (Bailly et al., 1998; Chan et al., 1998), lamellipods are flat and of uniform thickness so that variations in cell thickness do not contribute to fluorescence signal intensity. The same results were obtained using conventional imaging, confocal or digital deconvolution methods.
Electron Microscopy
Preparation of Biotin-labeled Actin.
Biotin-labeled actin was prepared according to Okabe and Hirokawa (1989) with modifications. 25 mg of G-actin (alpha/rabbit skeletal muscle) was dialyzed for 24 h in depolymerization buffer (2 mM Tris-HCl, pH 7.5, 0.1 mM CaCl2, 0.2 mM ATP). It was clarified for 20 min at 95,000 rpm in a centrifuge (TL100 Ultracentrifuge; Beckman), diluted to 3 mg/ml in depolymerization buffer above, and polymerized at room temperature for 2 h by adding final concentrations of: 10 mM Tris-HCl, pH 7.5, 2 mM MgCl2, 100 mM KCl, and 1 mM ATP. 8 mg N-hydroxysuccinimidobiotin (Pierce Chemical) was added to the solution and biotinylation was allowed to proceed for 10 min at room temperature. The reaction was quenched by adding 100 mg of sodium glutamate and F-actin was pelleted. Afterwards, F-actin was run through two cycles of polymerization/depolymerization, where the G-actin suspension was polymerized by adding 2 mM MgCl2, 50 mM KCl, 10 mM Pipes, pH 7, in a water bath at room temperature for 1 h, and depolymerized in buffer A (2 mM Tris, pH 8, 0.2 mM CaCl2, 0.02% NaN3, 0.2 mM ATP, 0.5 mM DTT). Actin was purified on a gel filtration column (Sephadex G180; Pharmacia) in buffer A. Storage was done in liquid nitrogen in 1 M sucrose. The initial coupling ratio was ∼2 mol (biotin)/mol (actin), but some loss occurred on storage. The biotin-labeled actin had a polymerization activity comparable to that of unlabeled actin, both in terms of percent polymerizable at equilibrium (>90%) and polymerization rates (as measured by viscometry).
Preparation of Biotin-labeled Gelsolin–Actin Complexes (b-GA2).
b-GA2 was prepared as described previously (Chan et al., 1998) using G-actin labeled with biotin as described above. For immunoelectron microscopy and colocalization with the Arp2/3 complex, 100 nM of the complexes was used in place of biotin–actin in the permeabilization buffer and the preparations were further processed as described below.
Preparation of Samples for Negative Staining.
MTLn3 cells were grown on formvar or parlodion–carbon-coated gold square support grids (Electron Microscopy Science) on coverslips for 18–24 h. The immunoelectron microscopy was based on a previously described protocol (Ursitti and Wade, 1993; Ursitti and Fowler, 1994) with some modifications. Coverslips were treated with 0.25% Triton X-100 in buffer C in the presence of 1% BSA and 0.45 μM biotin-labeled actin for 1 min. After a rapid wash in buffer C, the preparations were fixed with 0.5% glutaraldehyde in cytoskeleton stabilization buffer, pH 6–6.1, in the presence of 5 μM phalloidin for 10 min. The grids were rinsed in cytoskeletal buffer and incubated for 15 min in 50 mM NH4Cl in PBS (145.5 mM NaCl, 4 mM NaH2PO4, 6 mM Na2HPO4 · 7 H2O), with a change to fresh solution after 7 min. This was followed by a 30-min incubation in 0.1% gelatin (IGSS gelatin; Amersham) in PBS, with a change to fresh solution after 15 min. The grids were incubated for 6 h with 5 nm gold-conjugated antibiotin antibodies. They were washed three times for 10 min in 0.1% gelatin, 1 min in 0.05% Triton in PBS, and four 1-min washes in PBS. They were postfixed in 1% glutaraldehyde/5 μM phalloidin in cytoskeleton stabilization buffer for 15 min, and transferred briefly in cytoskeleton stabilization buffer before being negatively stained.
For double labeling the actin and Arp2/3 complex, grids were treated additionally with methanol for 2 min before the NH4Cl step, blocked for 30 min with gelatin, and incubated for 1.5–2 h with anti-Arp3 or anti-p21 antibodies. The grids were rinsed three times for 10 min in 0.1% gelatin and incubated for 6 h in a mixture of 5 nm gold-conjugated antibiotin antibodies and 10 nm gold-conjugated anti–rabbit antibodies. They were washed and postfixed as described above. For negative staining, the grids were transferred sequentially through four drops of 40 μg/ml bacitracin in water and four drops of 1% phosphotungstic acid. The grids were blotted dry and observed using 100× transmission electron microscope (JEOL USA, Inc.) at 80 kV.
Preparation of Samples for Rapid Freezing, Freeze Drying, and Rotary Shadowing (FDS).
MTLn3 cells were grown on 5-mm glass coverslips and processed for immunoelectron microscopy as described above. For better preservation of the actin cytoskeleton, methanol treatment during the double labeling with anti-Arp2/3 complex antibodies was done with 70% methanol. After the postfixation step, coverslips were rinsed three times in water and processed for FDS based on the procedure described by Hartwig (1992). Briefly, fixed coverslips were washed with two changes of distilled water. They were placed on a specimen mount of the rapid freezing apparatus (CF100; Life Cell Corp.) and frozen by slamming them into a liquid nitrogen–cooled copper block. Freezing tabs containing the frozen coverslips were transferred to a liquid nitrogen–cooled stage of a freeze fracture apparatus (CFE-50; Cressington), the stage temperature raised to −90°C for 90 min, and rotary shadowed at a 45° angle with 1.2–1.3 nm tantalum-tungsten, and 2.5 nm carbon at 90°. Replicas were separated from the coverslip with 25% hydrofluoric acid, washed into distilled water, and picked up on the surface of formvar-coated copper grids. The samples were observed using a JEOL 100CX transmission electron microscope at 100 kV. Images were viewed as negatives for better contrast, the gold particles appearing white.
Morphometric Analysis.
Morphometric analysis was done on randomly chosen intact cytoskeletons. Leading edges of lamellipodia were identified at low magnification and their typical lamellipodial character, as defined by the presence of a dense orthogonal network of actin filaments (see Figs. 5 and 7), was confirmed at high magnification. In some instances, two different areas of the cell periphery were analyzed for unstimulated cells: nonlamellipodial areas, representing cell edges that did not possess the characteristics of lamellipodia (see Figs. 5 A and 7 B); and typical leading edges (see Fig. 5 B). Unless those two categories are mentioned specifically, all data for unstimulated cells (EGF0) were obtained from typical lamellipodial areas.
Figure 5.
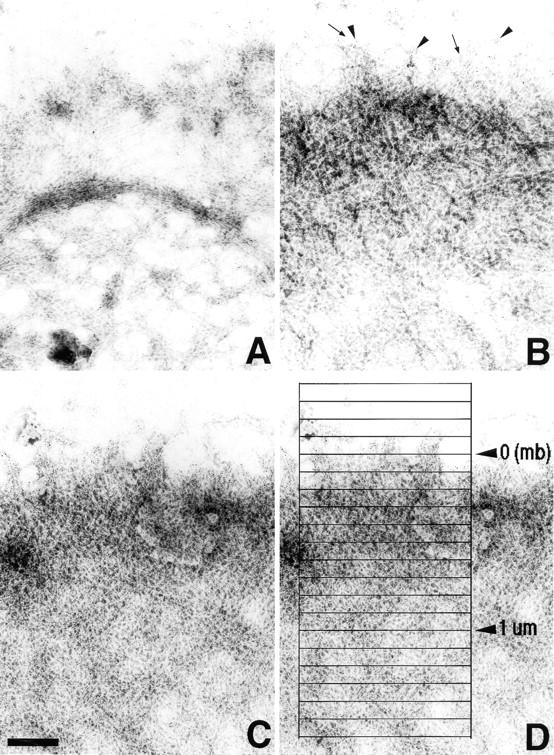
Ultrastructural localization of nucleation sites in negatively stained leading edges. Cells were processed as described in Fig. 4. (A) An unstimulated cell edge not organized as a typical lamellipod is shown. Note the loose network and occasional bundling of the filaments, and very low biotin-labeled actin incorporation. (B) The leading edge of a lamellipod in a polarized unstimulated cell organized as a network of dense filaments is shown. Note the filaments growing radially from the edge (arrows), and the biotin-labeled actin incorporation (arrowheads). (C) The leading edge of a cell 1 min after stimulation with EGF is shown. The network of actin filament is denser and the biotin-labeled actin incorporation is abundant. (D) A schematic description of the way the distribution of gold particles was analyzed at the leading edge for morphometrical analysis: boxes of 1 × 0.1 μm2 are shown here as an example. All the analyses were done with 2 × 0.1 μm2 boxes (see Materials and Methods). mb, membrane position (see Fig. 4). Bar, 0.3 μm.
Figure 7.
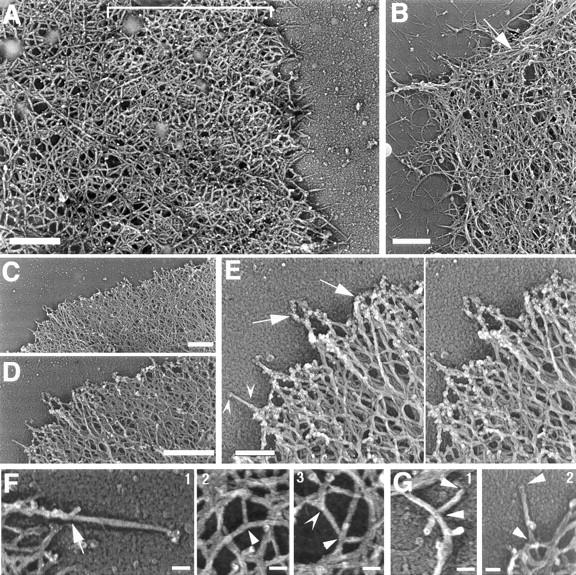
Three-dimensional organization of the cytoskeleton at the leading edge. Cells were stimulated with EGF, permeabilized in the presence of 0.45 μM biotin–actin, and fixed and processed for immunostaining with 5 nm gold-conjugated antibiotin antibodies. Postfixed samples were treated for rotary shadow as described in Materials and Methods. (A) General architecture of the cytoskeleton at the leading edge of the cells 1 min after stimulation with EGF is shown. Note the high density network at the extreme edge (brackets), and the decrease in filament density away from the edge. (B) Bundles of actin filaments at the periphery of a resting cell (arrow). (C) Leading edge of a lamellipod in a cell 1 min after EGF stimulation. (D) A higher magnification of C is shown and (E) a higher magnification of D (stereo view). Note the gold particles decorating the filaments at the extreme edge of the lamellipod (arrows). (F) Different types of branching observed at the leading edge: branching (arrow) on a filament growing radially from the edge that had incorporated exogenous biotin–actin (frame 1); T-branching inside the network at the leading edge (frame 2, arrowhead); ∼70° (Arp2/3-type) branching on unlabeled filaments inside the network (frame 3, arrowhead); Y-branching with small angles inside the network (frame 3, concave arrowhead). (G, frames 1 and 2) Examples of filament length measurement at the leading edge are shown. Filaments were traced to their origin as shown and the length was measured using NIH Image. Arrowheads mark the two ends of the filaments. Bars, A–D, 0.5 μm; E, 0.2 μm; F and G, 0.05 μm.
Quantitation was done using blind (see Figs. 6 and 9) or double-blind (see Figs. 8 and 10) methods. The negatives were scanned at high resolution and the digitized images were transferred to NIH image. A macro was written that enabled us to analyze the distribution of the gold particles: within a given area, the position of each particle was marked and we counted the particles in contiguous boxes. The size of the boxes was adjustable so that we could analyze the distribution of the particles along the leading edge (not shown), or across the leading edge. Typically boxes 2-μm wide were run at 0.1-μm steps into the leading edge, starting outside the cell (see Fig. 5 E). Two different sizes of particles could be analyzed simultaneously on the same image. This allowed direct colocalization of actin and Arp2/3 on the same image, with the same reference for the membrane.
Figure 6.

Morphometric analysis of the distribution of nucleation sites and filament density at the leading edge. (A) Quantitation of nucleation activity at the leading edge was done on negatively stained samples by analyzing the distribution of the gold particles reflecting biotin-labeled actin incorporation, using a macro designed for NIH Image, as described in Fig. 5. All the counts were performed blind: (squares) unstimulated cells, nonlamellipod-like edges (see Fig. 5 A); (open circles) leading edges in unstimulated cells (see Fig. 5 B); (triangles) EGF 30 s; (diamonds) EGF 1 min (see Fig. 5 C); (stars) EGF 3 min; and (closed circles) EGF 5 min. The data shown are from one representative experiment using 5–8 cells per time point. Additional examples of the distribution of barbed ends at the leading edge are shown in Figs. 9 and 10. (B) Quantitation of filament density was performed on the same set of negatively stained samples as in A, with a slight adaptation of the method (see Materials and Methods). The legend is the same as in A, except that (squares) unstimulated cells in regions with no typical leading edge are not shown.
Figure 9.


Arp3 and p21 are recruited to the leading edge after stimulation. Cells were permeabilized in the presence of 0.45 μM biotin–actin, fixed, and processed for immunostaining with 5 nm gold-conjugated antibiotin antibodies and rabbit anti-Arp3 or rabbit anti-p21 antibodies followed by 10 nm gold-conjugated anti–rabbit antibodies. Samples were processed for FDS (A) or negatively stained with 1% phosphotungstic acid and the distribution of the particles was analyzed in NIH Image (B) as described in Fig. 5 D. A shows the Arp2/3 complex localizing at the leading edge of filament intersections and along the side of individual filaments (frame 1, stereo view). Frames 2–4 show examples of localization of Arp2/3 complex at the vertices of actin filaments (arrowheads) or along the side of the filaments (star). Images shown are from the leading edge of a cell 1 min after stimulation: large (−10 nm gold) particles, p21 distribution (examples shown at large arrowheads), small (−5 nm gold) particles, and biotin–actin distribution (small arrows). Bright patches are vertical filaments containing biotin–actin gold particles that are not resolved in this axis of rotation. (B) Comparative distribution of Arp2/3 complex and free barbed ends at the leading edge. Both 5 nm and 10 nm gold particle distributions were recorded on the same samples, with the same reference towards the membrane. EGF0, unstimulated cells; EGF1, cells stimulated for 1 min with EGF; EGF3, cells stimulated for 3 min with EGF. The vertical bar marks the position of the membrane. The data were from one experiment for each Arp2/3 subunit in which 5–10 cells were analyzed for each time point. Only one representative distribution is shown for biotin–actin (which corresponds to the Arp3 data set), since the two distributions from the two sets of data (with Arp3 or p21) were identical. Bars, A, frame 1, 0.1 μm; A, frames 2–4, 0.05 μm.
Figure 8.
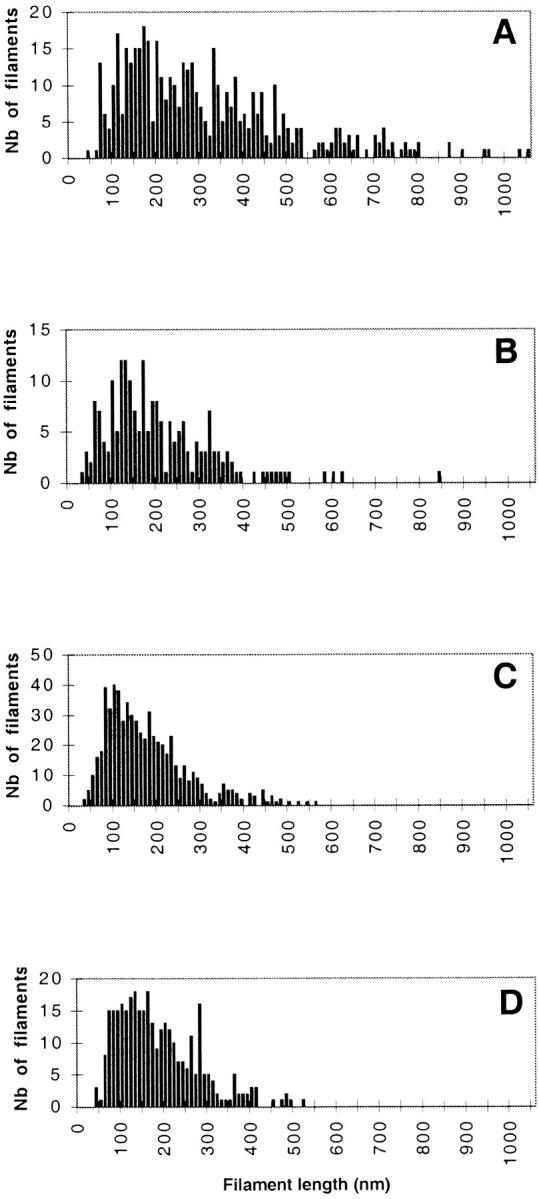
Filament length distribution within a 1-μm zone at the leading edge. Filament length was measured on samples processed for FDS using NIH Image (see Materials and Methods and Table I). The data correspond to data set #1 in Table I. (A) Cell edges not organized as typical leading edges in resting cells are shown (Fig. 7 B). (B) Leading edges in resting cells are shown. (C) Leading edges in cells stimulated with EGF for 1 min (Fig. 7 C) and (D) leading edges in cells stimulated with EGF for 3 min are shown.
Figure 10.

Colocalization of Arp3 and gelsolin-capped actin barbed ends at the leading edge. Cells were permeabilized in presence of 100 nM b-GA2 (GA2), fixed, and processed for immunostaining as in Fig. 9. Samples were negatively stained with 1% phosphotungstic acid. Squares represent unstimulated cells and circles represent cells stimulated with EGF for 1 min. The vertical bar marks the position of the membrane. The top frames show barbed end (GA2) distribution and the bottom frames show matching Arp subunit distribution (left, Arp3; right, p21). The data for the Arp3 set are pooled from three experiments with a total of 28 and 29 cells for EGF0 and EGF1, respectively. The data from the p21 set are from one experiment with a total of 9 and 10 cells for EGF0 and EGF1, respectively.
Since the cells were Triton-permeabilized and exogenous actin had polymerized onto preexisting filaments, the membrane position was assigned as the external edge of the dense filament network at the leading edge. This was done easily and reproducibly at low magnification (see Fig. 4). (A) Analysis of the distribution of the nucleation sites and/or Arp2/3 complex (see Figs. 6 A, 9, and 10). Consecutive boxes of 2 × 0.1 μm were drawn at the leading edge from the outside to the inside of the cells (see Fig. 5 E) and the number of particles in each box was plotted as a function of the distance of the box from the membrane. (B) Analysis of the filament density at the leading edge (see Fig. 6 B). Five lines were drawn perpendicular to the membrane at the leading edge and the filaments crossing the lines were marked. The macro described above was run with 0.1-μm steps along the lines and the total number of filaments crossing each of the five lines was counted in each 0.1 μm interval. (C) Analysis of filament length (see Fig. 8, Table I). Measurements were done using the standard length feature in NIH Image. Since most of the actin network at the leading edge is within a single plane (only a small proportion of the filaments are growing perpendicular to the lamellipod), the tracings and corresponding measurements were done in two dimensions only as shown in Fig. 7 G. Two complementary sets of data were generated: the global filament population terminating within 0.5–1 μm at the leading edge was analyzed, both filaments with a free end and filaments within the network with no free end (but showing distinctive origin and end at the intersection with another filament) were followed carefully inside the network to their origin. The second analysis involved exclusive measurements of filaments with one free end terminating within 0.2–0.3 μm at the leading edge and presenting an easily identifiable origin (Fig. 7 G). The F-actin concentration at the leading edge was calculated from the total length of filaments within a 1 × 1 μm square at the leading edge, assuming a thickness of 176 ± 14 nm for the lamellipod in that particular zone (Lanni, F., personal communication), and a monomer size within the filament of 2.75 nm (Kabsch and Vandekerckhove, 1992).
Figure 4.

Negative staining of MTLn3 cells permeabilized in presence of biotin-labeled actin. Cells were stimulated with EGF and permeabilized for 1 min in the presence of 0.45 μM biotin-labeled actin. They were then fixed, immunolabeled with anti-biotin antibodies coupled to 5 nm gold particles, and negatively stained with 1% phosphotungstic acid. The image shows a low magnification of a typical leading edge 1 min after EGF stimulation, where a dense actin network is visible at the extreme edge (facing arrows). The line shows where the membrane position was set for morphometric analysis. Bar, 1 μm.
Table I.
Filament Length Measurements at the Leading Edge
| Data set #1 | Data set #2 | |||
|---|---|---|---|---|
| Number of experiments Type of filaments analyzed* | 1 No free ends or 1 free end | 2 1 free end only | ||
| Mean filament length (nm)‡ | ||||
| EGF0/no LE§ | 314 ± 9 | 163 ± 14 | ||
| (n = 467) | (n = 200) | |||
| EGF0/LE§ | 208 ± 9 | 147 ± 12 | ||
| (n = 198) | (n = 118) | |||
| EGF1 | 179 ± 4 | 101 ± 4 | ||
| (n = 628) | (n = 335) | |||
| EGF3 | 189 ± 5 | 135 ± 7 | ||
| (n = 334) | (n = 245) |
Filaments were measured at the leading edge as described in Materials and Methods. For data set #1, filaments terminating within a 0.5–1 μm area at the leading edge were measured carefully using high magnification and control viewing in three dimensions using stereo images. Both filaments with a free end and filaments with no visible free ends (but terminating clearly on both ends at an intersection with another filament) were included in the study. In total, 51 cells (10–19 per time point) were analyzed for data set #1. For data set #2, only filaments with one free end terminating within 0.2– 0.3 μm at the leading edge and showing an easily identifiable origin were analyzed. 92 cells (20–32 per time point) from two different experiments were analyzed for data set #2.
Filament length is expressed as mean ± SE; n is the total number of filaments analyzed for each time point.
In unstimulated cells (EGF0), the peripheral regions of analyzed cells were divided in two categories: nonlamellipodial areas (EGF0/no LE), where no distinctive leading edge structure could be identified; and leading edge-type areas (EGF0/LE) that presented the characteristic aspect and the dense orthogonal actin network of a leading edge (see Materials and Methods).
Results
Distribution of Actin, Actin Nucleation Sites, and Arp2/3 Complex
MTLn3 cells stimulated with EGF undergo a broad lamellipod extension which is maximal within 3 min and driven by actin polymerization at the leading edge (Segall et al., 1996; Chan et al., 1998). Using this well characterized model, we investigated the relationship between sites of actin polymerization and Arp2/3 complex location in leading edges. We used antibodies raised against three different subunits of the Arp2/3 complex (Arp3, p21, and p34; Welch et al., 1997a) to analyze the distribution of the Arp2/3 complex in these cells. We first analyzed the localization of the Arp2/3 complex in MTLn3 cells in reference to actin distribution. Since these anti-Arp2/3 complex antibodies all require methanol fixation, which alters phalloidin binding, actin was visualized in the cells using anti-actin antibodies. The pattern obtained for actin using anti-actin antibodies was virtually identical to the F-actin pattern revealed by fluorescent phalloidin labeling (data not shown). Immunofluorescence data show that the Arp3 and p21 subunits of the Arp2/3 complex colocalize with actin at the leading edge of these stimulated cells (Fig. 1 A). Although the signal was somewhat weaker, p34 showed a similar distribution (data not shown). None of the proteins localized to stress fibers, though occasional weak staining of stress fibers was noticed with the anti-Arp3 antibodies (data not shown, see Fig. 3, EGF3). Some cytoplasmic staining was also observed, including staining in discrete particles that also contain F-actin, as demonstrated by FITC-phalloidin staining (data not shown). The nuclear staining represented mostly nonspecific binding of the secondary antibodies. Quantitative analysis of the distribution of actin and Arp3 or p21 at the leading edge showed very similar localization, both protein concentrations maximizing within <1 μm at the leading edge (Fig. 1 B).
Figure 1.

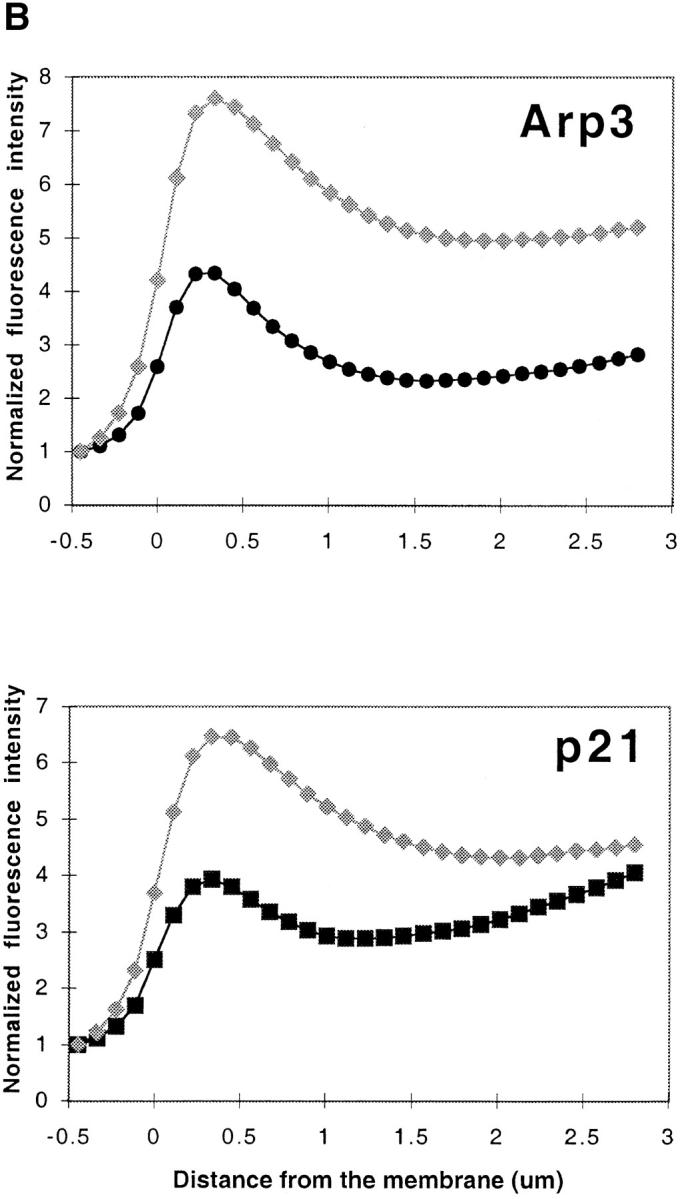
Arp2/3 complex colocalizes with F-actin at the leading edge of cells after stimulation. Cells were stimulated with EGF for 3 min, fixed, permeabilized, and immunostained for Arp2/3 and actin. (A) Both Arp3 and p21 localize in the actin-rich zone at the extreme periphery of the cells (matching arrowheads). Frames 1 and 3, actin; frame 2, Arp3; and frame 4, p21. The box indicates the size of the region at the leading edge where all further analyses were done, including electron microscopy. In cells stimulated with a uniform upshift of EGF, the entire periphery of the cell becomes a lamellipod, the leading edge of which is identical to the leading edge of a polarized cell (Segall et al., 1996; Bailly et al., 1998; Chan et al., 1998). Therefore, the box could be positioned at random sites on the periphery of a stimulated cell. (B) Quantitation of immunofluorescence showing colocalization of Arp2/3 and actin within 1.5 μm at the leading edge. The fluorescence intensity graphed is the mean of the entire cell perimeter for 1-pixel-wide steps (see Materials and Methods). Gray diamonds represent actin; circles, Arp3; and squares represent p21. Both Arp2/3 (Arp3 and p21) and actin concentrations peak within 0.5 μm of the leading edge. The increase in fluorescence intensity that is observed further back from the membrane occurs because of interference from stress fibers for the actin and dense particles for Arp3 and p21, which emphasizes the need to use electron microscopy in this analysis. Bar, 10 μm.
Figure 3.

Arp2/3 complex colocalizes with EGF-stimulated nucleation activity at the leading edge of the cells. Cells were stimulated with EGF and permeabilized in the presence of 0.45 μM rhodamine-labeled actin for 1 min, fixed, and stained for Arp2/3 localization. In unstimulated cells (EGF0), Arp3 is enriched in the peripheral submembraneous compartment, in conjunction with nucleation activity, and in ruffling areas (asterisk). 1 min after EGF stimulation (EGF1), Arp3 is recruited homogeneously to the extreme edge of the cells in conjunction with the newly created nucleation sites (arrowheads), as well as in particulate bodies (arrows). After 3 min (EGF3), nucleation activity remains confined to the very submembraneous compartment and the tips of the stress fibers (presumably focal contacts), whereas the Arp3 distribution is restricted to the leading edge where it tends to extend beyond the nucleation site location, further inside the cell (concave arrowheads). Bar, 20 μm.
We demonstrated previously that EGF-stimulated lamellipod extension is dependent on actin polymerization at the leading edge (Segall et al., 1996; Chan et al., 1998). By permeabilizing stimulated cells in the presence of 0.45 μM rhodamine-labeled actin stimulation, the sites of actin nucleation (i.e., free barbed ends) can be visualized directly (Chan et al., 1998). Since 0.45 μM is below the critical concentration for the pointed end (Pollard, 1986), only free barbed ends are visualized (Symons and Mitchison, 1991; Chan et al., 1998). As the polymerization of exogenous G-actin is not diffusion limited (Chan et al., 1998), exogenous and endogenous G-actin must be exchanged rapidly, and endogenous G-actin should fall to negligible levels quickly after permeabilization. This is consistent with the uniformity of rhodamine–actin incorporation into the leading edge observed in our experiments that would not occur if there were punctate pools of endogenous G-actin released during permeabilization. Under the current experimental conditions, most of the nucleation activity is localized within <2 μm at the leading edge after stimulation (see below). Quantitative analysis of fluorescence within that specific zone at the leading edge (Fig. 1 A, frame 2, boxed area) gives an accurate view of the kinetics of appearance of the nucleation sites: EGF stimulation generates a transient increase in nucleation activity, peaking sharply at 50 s, and generates an average 2.4-fold increase in nucleation activity at the leading edge (Fig. 2). Nucleation activity returns to residual levels 5–6 min after stimulation.
Figure 2.

Kinetics of appearance of nucleation sites at the leading edge after EGF stimulation. Cells were stimulated with EGF and permeabilized for 1 min in the presence of 0.45 μm rhodamine- actin. Nucleation activity was measured as rhodamine–actin incorporation within 1.1 μm of the circumferential membrane at the leading edge of the cells (Fig. 1 A, boxed area, and Materials and Methods). Results are the mean of three different experiments, with a total of 10–20 cells measured in each experiment.
We performed direct colocalization of these active nucleation sites and the Arp3 subunit in MTLn3 cells after stimulation (Fig. 3). In unstimulated cells (EGF0), Arp3 is enriched in the peripheral submembraneous compartment, in conjunction with nucleation activity, and in ruffling areas. After EGF stimulation (EGF1), Arp3 is recruited homogeneously to the extreme edge of cells in conjunction with newly created nucleation sites (Fig. 3, EGF1). After 3 min (EGF3), nucleation activity remains confined to the very submembraneous compartment and the tips of the stress fibers (presumably focal contacts). Arp3 distribution also is restricted mainly to the outermost part of the leading edge but sometimes tends to extend further inside the cell, beyond the nucleation site location. Some particulate staining is seen in these conditions that correspond to small dorsal protrusions containing F-actin, Arp3, and nucleation sites (Fig. 3, EGF1; Bailly et al., 1998). These are similar to the Arp-, capping protein-, and actin-containing dorsal protrusions recently described on fibroblasts (Schafer et al., 1998).
Ultrastructural Characterization of Actin Nucleation Activity at the Leading Edge
The above results showed that Arp2/3 complex and nucleation sites colocalize at the leading edge, but the resolution of light microscopy (∼0.3 μm) was not sufficient to determine if they actually overlapped. To study the distribution of the nucleation sites at the leading edge of lamellipods at high resolution as well as their spatial and temporal relationship with the Arp2/3 complex, we adapted the protocol used to visualize nucleation sites at the light microscope level and used biotin-labeled actin to visualize nucleation sites at the electron microscope level. We studied the leading edge where the lamellipod is flat enough to allow unequivocal identification of actin-containing structures relative to the plasma membrane. To obtain a comprehensive view of the cytoskeleton's ultrastructure at the leading edge, independent of technique-specific artifacts, we used both negative staining and FDS techniques. The kinetics, amplitude, and localization of the nucleation activity obtained with these techniques were strikingly similar to those measured at the light microscope level, as well as highly reproducible (data not shown). We used only light permeabilization (low detergent concentration and short extraction time) to minimalize extraction. Under such conditions, even omitting the exogenous actin in the permeabilization step does not affect the structure of the cytoskeleton at the leading edge markedly (Chan et al., 1998).
Negatively stained images show that the cytoskeleton at the leading edge is arranged as a dense network of filaments (Figs. 4 and 5). In unstimulated cells, two types of cytoskeleton organization are found: cell edges in nonlamellipodial areas (not organized as leading edges) contain loose networks of long filaments with little, if any, exogenous biotin-labeled actin incorporation (as revealed by the presence of 5 nm gold particles, Fig. 5 A); and typical leading edges of dense filament networks where individual filaments can be seen growing radially from the edge, with some exogenous biotin-labeled actin incorporation (Fig. 5 B). After stimulation, a large proportion of the cell periphery is arranged as a typical leading edge with a broad peripheral lamellipod extension (Figs. 1 and 2; Bailly et al., 1998). The filaments form a denser network of actin where intense biotin-labeled actin incorporation has occurred as a result of the increase in nucleation activity (Figs. 4 and 5 C). Morphometric analysis of the distribution of the nucleation sites was conducted using a macro running in NIH Image (see Materials and Methods). With the membrane position set as the extreme edge of the lamellipod when viewed at low magnification (Fig. 4), the macro enabled us to count the gold particles in contiguous 2 × 0.1 μm2 boxes from the outside to a few microns inside the cell (Fig. 5 D). The resulting distribution was plotted (Fig. 6 A). On the same negatives, the filament density at the leading edge was evaluated, with the same membrane reference as that taken for the gold particle counts (Fig. 6 B).
Quantitation of nucleation activity as biotin–actin density at the leading edge confirms a transient increase 1 min after stimulation and a rapid decrease back to resting levels after 3 min (Fig. 6 A and data not shown). The maximum nucleation activity generated after stimulation is confined within a 0.2–0.3 μm zone, directly at the membrane, and only residual (background) nucleation activity remains >1–1.5 μm away from the membrane (Fig. 6 A). As opposed to the sharp location and transient generation of nucleation sites, EGF stimulation results in an ∼1.5-fold increase in filament density within a 1.5–2-μm zone adjacent to the membrane. This high density remains for 5 min after stimulation (Fig. 6 B). Thus, the maximum nucleation activity generated after stimulation is confined to a narrower region than the one covered by the high filament density zone generated after stimulation.
To get greater insight into the three-dimensional filament architecture at the leading edge, we used the FDS technique. This technique allows a very high resolution of the cytoskeleton with minimum reorganization of the actin filaments, potentially minimizing the generation of artifacts. The results obtained using this technique were entirely consistent with those acquired on negatively stained samples. Furthermore, the diameter of the filaments observed in the replicas was routinely <11 nm, indicating that a high degree of resolution was achieved with minimal metal deposition.
We analyzed the filament architecture at the leading edge of the cells before and after stimulation with EGF. As with negative staining, leading edges could be identified easily by their typical orthogonal arrangement of filaments with a denser zone at the extreme edge (Fig. 7, A and C), as opposed to loose bundles of parallel filaments in other parts of the cells (Fig. 7 B). The 5 nm gold particle distribution reveals filaments that have incorporated biotin–actin, localizing the active nucleation sites at the extreme edge of the cells (Fig. 7, D and E, and data not shown), as shown previously with negative staining (Figs. 5 and 6 A). The network of actin filaments was denser after stimulation (Fig. 7 C). Different types of filament crossing and/or branching were observed (Fig. 7 F) including: branching with an angle of ∼70°, typical of the in vitro branching observed for Arp2/3 complex (Machesky and Way, 1998; Mullins et al., 1998) on filaments growing radially at the leading edge or within the network; T-branching inside the network at the leading edge (Niederman et al., 1983; Hartwig and Shevlin, 1986); and Y-branching and filament branching with smaller angles (Niederman et al., 1983; Hartwig and Shevlin, 1986). To evaluate the concentration of F-actin at the leading edge, the total length of actin filaments was evaluated in a 1 × 1 μm2 box at the leading edge, and was found to be 66 ± 6 μm/μm2. Assuming 176 ± 14 nm for the thickness of the lamellipod at the leading edge (Lanni, F., personal communication), this gave us an approximate concentration of 9.3 mg/ml for F-actin at the leading edge.
We measured the length of the filaments within 1 μm of the leading edge (see Materials and Methods). Two different sets of data were generated corresponding either to the total filament population at the leading edge (Fig. 8, Table I, data set #1), or a more restricted compartment corresponding exclusively to filaments with one free end (Table I, data set #2, Fig. 7 G). Both sets of data show an average 30% decrease in filament length at the leading edge 1 min after EGF stimulation compared with unstimulated cells (Table I, nonlamellipodial and lamellipodial areas combined). This is consistent with measurements made on negatively stained samples showing 32 and 28% decreases in length at 1 and 3 min, respectively (data not shown). The filament length distribution within a 1-μm zone behind the membrane of resting cells (nonlamellipodial-type and typical leading edges combined) is widely distributed with filaments ranging in size from 30 to 1,000 nm (Fig. 8, A and B). In contrast, after EGF stimulation the cell periphery consists of broad lamellipodial structures with typical leading edges containing mainly short filaments, ranging from 30 to <300 nm (Fig. 8 C). This particular arrangement of short filaments persists after 3 min of stimulation (Fig. 8 D), and is consistent with the maintenance of a high filament density (Fig. 6 B). The specific loss of long filaments that accompanies the general decrease in filament length after stimulation strongly suggests the intervention of a filament severing activity.
Spatial and Temporal Relationships between the Nucleation Sites and Arp2/3 Complex
The Arp2/3 complex is present at the leading edge (Fig. 9 A, frame 1) and shows the distribution expected (Mullins et al., 1997, 1998). It can be identified on the sides of filaments (Fig. 9 A, frames 1 and 4) and at filament intersections (Fig. 9 A, frames 1–4). As a control, the distribution of another cross-linking protein, ABP280, was also analyzed. As expected from previous work (Hartwig et al., 1980; Hartwig and Shevlin, 1986), ABP280 is present at the leading edge where it localizes at filament intersections, and unlike Arp2/3 complex, does not show any obvious side binding (data not shown).
Colocalization of the Arp2/3 complex (Arp3 and p21 subunits) and the nucleation sites was performed on negatively stained samples using the morphometric analysis described above. For each cell, Arp2/3 (10 nm gold particles) and the nucleation sites (5 nm gold particles) were measured on the same image with the same reference for the position of the membrane (determined as above). The amount of Arp3 at the leading edge approximately doubles 1 min after EGF stimulation and is distributed as a broad peak starting ∼100 nm back from the membrane (offset from the nucleation sites, Fig. 9 B). 3 min after stimulation, the amount of Arp3 at the leading edge is slightly reduced, but is still higher than before stimulation. p21 distribution follows the same trend as Arp3 (Fig. 9 B). During this 3-min interval of stimulation with EGF, the membrane has moved ∼5.2 μm to the left (data not shown).
To refine our positioning of the Arp2/3 complex relative to the barbed ends and obtain a precise count of the number of barbed ends, we used a different method to localize barbed ends. Since our usual method involves the growth of the actin filaments from exogenous actin, we designed an experiment where we could prevent actin polymerization, and label barbed ends directly where they are by capping them with b-GA2. As shown in Fig. 10, under these conditions the edge of Arp3 distribution is still offset from the membrane, whereas the barbed end distribution remains highly localized at the membrane. In addition, the concentration of the Arp2/3 complex at the leading edge barely doubles after stimulation, whereas there is a fivefold increase in barbed ends.
Discussion
Organization of the Leading Edge of Cells after Stimulation
Although the extreme edge of MTLn3 cells has some features comparable to those of constitutively moving cells such as keratocytes (Svitkina et al., 1997), the general organization of the actin cytoskeleton in these carcinoma cells more closely resembles that of chemotactic ameboid cells such as macrophages (Hartwig and Shevlin, 1986), leukocytes (Ryder et al., 1984), and Dictyostelium discoideum (Rubino and Small, 1987; Cox et al., 1995). In unstimulated cells, the cytoskeleton at the periphery is arranged as a loose network of long, occasionally bundled, filaments. Some cells are polarized and present a leading edge where filaments are arranged in a 1–1.5-μm wide, high density orthogonal network, similar to the leading edge of unstimulated fibroblasts (Small and Celis, 1978; Small, 1981, 1988; Svitkina et al., 1997). The density of filaments rapidly decreases a few microns away from the edge. After stimulation, the density and width of the orthogonal network at the edge increases and a clear zone, mostly devoid of actin filaments, is created behind the leading edge as the lamellipod advances. These are features that are not observed in keratocytes (Small et al., 1995; Svitkina et al., 1997). The network at the leading edge of MTLn3 cell is composed of tightly entangled interwoven filaments, featuring multiple intersections of two or more filaments, and its complexity increases with filament density after stimulation. Most of the filaments inside the network are relatively short (0.2–0.3 μm on average before stimulation and even less after stimulation). This is slightly shorter than previously reported filament lengths measured on quick frozen deep-etched macrophages (0.5 μm; Yin and Hartwig, 1988), or inferred from depolymerization kinetics in leukocytes (0.3 μm; Cano et al., 1991). However, it is remarkably similar to what has been measured in stimulated platelets (0.1–0.3 μm; Hartwig, 1992) or in Dictyostelium, where the mean filament length was 0.2 μm with a large proportion of small (<140 nm) filaments (Podolski and Steck, 1990).
The Arp2/3 complex can generate 70° angle branches between filaments in vitro (Mullins et al., 1998). In vivo, a large subset of the branches observed in the cytoskeleton of keratocytes displays similar 70° angles (Svitkina et al., 1997). This has drawn others to the conclusion that Arp2/3 could be a major component of cytoskeleton organization by nucleating and branching actin filaments (Machesky and Way, 1998; Mullins et al., 1998, Zigmond, 1998). Although we have noticed some 70° branching at the leading edge of MTLn3 cells, the organization of the cytoskeleton that we observed is more typical of what has been described in chemotactic ameboid cells, with a more complex set of branching, including T-, Y-, and X-branching (Ryder et al., 1984; Hartwig and Shevlin, 1986; Cox et al., 1995). This morphology does not appear to be technique dependent, but rather common to chemotactic cells as seen by different techniques such as critical point drying (Hartwig and Shevlin, 1986; Wolosewick and Condeelis, 1986), FDS (this study and Hartwig and Shevlin, 1986), or negative staining (this study and Small, 1988). Although we have localized the Arp2/3 complex at filament vertices, other cross-linkers like ABP280 are present at the leading edge (data not shown) where they can contribute to maintain the integrity of the cytoskeleton and define filament branching (Cunningham et al., 1992; Cox et al., 1995). Indeed, the three-dimensional architecture of the cytoskeleton, the distance between filament intersections (data not shown), and the actin concentration that we measured at the leading edge are consistent with a network of actin and filamin-type cross-linkers (Hartwig et al., 1980; Niederman et al., 1983). The relative contributions of these different molecules to filament organization might differ from one type of cell to the other, which could explain why a 70° Arp2/3 branching pattern is more common in the keratocyte (Svitkina et al., 1997). Alternatively, Arp2/3 branching might be more involved in constitutive movement, as shown in keratocytes, as opposed to transient and rapid reorganization of the cytoskeleton after EGF stimulation. Interestingly, we also see the Arp2/3 complex along the sides of filaments in the absence of any obvious branching, in agreement with previous in vitro observations (Mullins et al., 1997, 1998).
Spatial and Temporal Regulation of the Arp2/3 Complex
EGF stimulation triggers a transient increase in nucleation activity that is highly controlled in terms of kinetics (sharp peak at 50–60 s) and localization (within 100–200 nm at the extreme edge of the lamellipod). The position of the nucleation sites remains constant with respect to the membrane of the extending edge as the cells form lamellipods. The increase in nucleation activity after stimulation is accompanied by an increase in filament density at the leading edge, covering a zone extending up to 2–2.5 μm further inside the cells. Both light and electron microscopy show that the Arp2/3 complex is localized within this network, where its concentration increases after EGF stimulation. Although a subset is present close to the membrane where the nucleation sites are, the distribution of the Arp2/3 complex is not restricted to the 100–200-nm polymerization zone at the membrane, but extends 1.5–2 μm inside the dense F-actin network both before and after stimulation. Furthermore, in most cases, the increase in Arp2/3 concentration at the membrane does not reflect the increase in nucleation activity: the Arp2/3 amount never increases more than twofold in any of our experiments, whereas up to fivefold increases were observed for the number of free barbed ends (Fig. 10). 1 min after stimulation, the Arp2/3 concentration is maximum close to the membrane, and decreases back to the level measured in unstimulated cells within a distance of 2 μm from the growing edge. This corresponds to the site where the membrane was located before stimulation (since the lamellipod has extended 2.2 μm at 1 min and 5.2 μm at 3 min after stimulation, data not shown). Thus, we propose that the Arp2/3 distribution that we observed is the result of the progressive binding of Arp2/3 to filaments as the leading edge advances. The Arp2/3 complex is recruited to filaments under the membrane as the nucleation activity increases but, unlike the nucleation sites that continue to advance with the membrane, the majority of the Arp2/3 complex stays in place. This suggests that Arp2/3 is functioning as a pointed end capper, which would explain the broad peak of Arp2/3 distribution compared with the sharp peak of nucleation sites at the leading edge.
Interaction of Arp2/3 and the Nucleation Sites at the Leading Edge
The Arp2/3 complex caps the pointed ends of actin filaments with high affinity (Mullins et al., 1998). Could the Arp2/3 complex have only a passive role of pointed-end capping at the leading edge? In this model, the increase in Arp2/3 concentration at the leading edge after stimulation simply could reflect the increase in pointed ends that we observed (Chan et al., 1998). However, the Arp2/3 distribution does not follow exactly the filament distribution, as it tends to increase more than the filament number does, and drops more rapidly than the filament density within 2 μm of the leading edge. While we cannot rule out a simple pointed-end capping role for Arp2/3, it seems likely that the complex has a more active role in actin polymerization.
Altogether, the increase in the number of pointed ends observed after stimulation (Chan et al., 1998), the decrease in filament length, and disappearance of the long filaments shown here rule out uncapping as the dominant mechanism for generating the increase in nucleation activity observed at the leading edge after EGF stimulation. Nonetheless, uncapping could be the mechanism responsible for generating the nucleation sites that we see at the ends of the stress fibers, since the growth happens only at the extreme ends of the stress fibers (i.e., not consistent with severing) and does not seem to involve any Arp2/3 complex recruitment. The other two mechanisms capable of generating new nucleation sites after stimulation are de novo nucleation or severing (or both combined). Both mechanisms could account for the decrease in filament length that we observed: the former because it might generate a large population of filaments that will be shorter than the preexisting ones, and the latter because it actually cuts the preexisting filaments into smaller ones. However, the disappearance of the longer filaments that we observed immediately after stimulation is highly suggestive of a severing mechanism.
Original work on the Arp2/3 complex suggested that it could nucleate actin polymerization at the surface of the bacteria, Listeria monocytogenes (Welch et al., 1997b). However, the Arp2/3 complex probably is not a true nucleator, but rather captures and stabilizes unstable actin dimers (Mullins et al., 1998). The rate constants of assembly/disassembly of actin monomers into a dimer are such that the probability of generating actin dimers from free monomers or monomers bound to sequestering proteins in vivo is essentially null. Similarly, the formation of a complex between Arp2/3 and one actin monomer, as well as addition of a second actin monomer to this complex to create a nucleus is extremely unlikely (Fig. 11). However, capture and stabilization of actin dimers or oligomers by the capping of pointed ends by the Arp2/3 complex is a very efficient process that can lead to the stabilization of nucleation sites for actin polymerization. We propose that a severing activity occurs after stimulation that rapidly generates actin oligomers stabilized by the Arp2/3 (Fig. 11).
Figure 11.

Model of generation of nucleation sites at the leading edge after stimulation: cooperation of Arp2/3 complex and a cofilin-like severing activity. Numbers above arrows show the rate constants for each reaction (events/s), calculated from the molar on-rate constants presented in Mullins et al. (1998) and assuming a G-actin concentration of 1 μM. Longer arrows show preferred direction for the reactions. The rate constant of assembly of actin monomers into a dimer virtually precludes spontaneous generation of actin dimers in vivo (dotted line). Similarly, the formation of a complex between Arp2/3 and one actin monomer and the addition of a second actin monomer to this complex to create a nucleus is extremely unlikely. We propose that EGF stimulation triggers a signal that transiently and locally turns on cofilin activity at the leading edge. Activated cofilin severs preexisting filaments, generating small actin oligomers free both at their pointed ends and barbed ends (n designates two or more subunits). The oligomers are captured and stabilized by capping of pointed ends by the Arp2/3 complex to efficiently generate nucleation sites for actin polymerization. These stable nuclei can then polymerize very rapidly until their barbed ends are capped by capping protein (not shown).
A likely candidate for this severing activity is cofilin, which can generate severed filaments with free barbed ends. Cofilin activity is regulated by pH as well as its phosphorylation status, the phosphorylated form being unable to bind actin. Chemotactic peptides and PMA in neutrophils, as well as growth factors in epithelial cells, induce a dephosphorylation of cofilin that is associated with a shift of cofilin into F-actin–rich areas at the cell periphery. This suggests that cofilin could be a major component in generating nucleation activity after stimulation (Moon and Drubin, 1995; Nagaoka et al., 1996; Aizawa et al., 1997; Djafarzadeh and Niggli, 1997; Heyworth et al., 1997). Recently, the kinase that turns off cofilin activity has been identified as LIM kinase-1. Moreover, some data suggest that LIMK-1 is a component of the small, GTP protein rac signal transduction pathway leading to lamellipodia formation in fibroblasts (Arber et al., 1998; Yang et al., 1998). We have evidence that cofilin is recruited at the edge of the lamellipodia in MTLn3 cells after EGF stimulation (Chan, A., personal communication) and that expression of a constitutively active LIMK-1 in those cells abolishes the EGF-stimulated increase in nucleation activity and subsequent lamellipod extension (Zebda, N., personal communication). Altogether, these results suggest that cofilin could have a major role in generating a transient increase in nucleation activity after EGF stimulation, by severing the filaments to create small actin oligomers with free barbed ends that would be stabilized by Arp2/3 complex to generate nucleation sites for actin polymerization (Fig. 11).
On the other hand, we cannot exclude the possibility that only a subset of the Arp2/3 complex at the membrane is transiently activated to nucleate actin filaments. This could explain why we observed a relatively low increase in Arp2/3 concentration at the leading edge after stimulation compared with the increase in nucleation activity. Indeed, it has been suggested that the Arp2/3 complex could be activated in vivo by different partners, which would greatly enhance its nucleating activity (Zigmond, 1998). Welch et al. (1998) have reported previously that the bacterial protein ActA could have such an effect. More recently, Machesky and Insall (1998) described two mammalian proteins, Scar1 and WASP, that interact with the Arp2/3 complex to regulate the actin cytoskeleton. Further work is required to decipher the sequence of molecular interactions that lead to actin polymerization and leading edge advance, and determine which mechanism allows the Arp2/3 complex to influence the outcome of these processes.
Acknowledgments
The authors wish to thank Drs. Matthew Welch and Tim Mitchison for the antibodies against the Arp2/3 complex, and Dr. John Hartwig for the antibodies against BP280. They are also thankful to Drs. John Hartwig, Jeanine Ursitti, and Tatiana Svitkina for their helpful advice on the electron microscopy, to Drs. Fred Lanni and N. Zebda for sharing unpublished information, and to Dr. Alan Wolkoff for the use of his high resolution scanner.
This work was supported by grants from the National Institutes of Health and the U.S. Army (USAMRDC2466).
Abbreviations used in this paper
- b-GA2
biotin-labeled gelsolin–actin complexes
- EGF
epidermal growth factor
- FDS
rapid freezing, freeze drying, and rotary shadowing
References
- Abercrombie M, Heaysman JE, Pegrum SM. The locomotion of fibroblasts in culture. I. Movements of the leading edge. Exp Cell Res. 1970;59:393–398. doi: 10.1016/0014-4827(70)90646-4. [DOI] [PubMed] [Google Scholar]
- Aizawa H, Fukui Y, Yahara I. Live dynamics of Dictyosteliumcofilin suggests a role in remodeling actin latticework into bundles. J Cell Sci. 1997;110:2333–2344. doi: 10.1242/jcs.110.19.2333. [DOI] [PubMed] [Google Scholar]
- Arber S, Barbayannis F, Hanser H, Schneider C, Stanyon CA, Bernard O, Caroni P. Regulation of actin dynamics through phosphorylation of cofilin by LIM-kinase. Nature. 1988;393:805–809. doi: 10.1038/31729. [DOI] [PubMed] [Google Scholar]
- Bailly M, Yan L, Whitesides GM, Condeelis JS, Segall JE. Regulation of protrusion shape and adhesion to the substratum during chemotactic responses of mammalian carcinoma cells. Exp Cell Res. 1998;241:285–299. doi: 10.1006/excr.1998.4031. [DOI] [PubMed] [Google Scholar]
- Cano M, Lauffenburger D, Zigmond S. Kinetic analysis of F-actin depolymerization in polymorphonuclear leukocyte lysates indicates that chemoattractant stimulation increases actin filament number without altering the filament length distribution. J Cell Biol. 1991;115:677–687. doi: 10.1083/jcb.115.3.677. [DOI] [PMC free article] [PubMed] [Google Scholar]
- Chan AY, Raft S, Bailly M, Wyckoff JB, Segall JE, Condeelis JS. EGF stimulates an increase in actin nucleation and filament number at the leading edge of the lamellipod in mammary adenocarcinoma cells. J Cell Sci. 1998;111:199–211. doi: 10.1242/jcs.111.2.199. [DOI] [PubMed] [Google Scholar]
- Chen P, Gupta K, Wells A. Cell movement elicited by epidermal growth factor receptor requires kinase and autophosphorylation but is separable from mitogenesis. J Cell Biol. 1994;124:547–555. doi: 10.1083/jcb.124.4.547. [DOI] [PMC free article] [PubMed] [Google Scholar]
- Condeelis, J. 1998. The biochemistry of animal cell crawling. In Motion Analysis of Living Cells. D. Soll, editor. Wiley-Liss, Inc., New York. 85–100.
- Cox D, Ridsdale JA, Condeelis J, Hartwig J. Genetic deletion of ABP-120 alters the three-dimensional organization of actin filaments in Dictyosteliumpseudopods. J Cell Biol. 1995;128:819–835. doi: 10.1083/jcb.128.5.819. [DOI] [PMC free article] [PubMed] [Google Scholar]
- Cunningham CC, Gorlin JB, Kwiatkowski DJ, Hartwig JH, Janmey PA, Byers HR, Stossel TP. Actin-binding protein requirement for cortical stability and efficient locomotion. Science. 1992;255:325–327. doi: 10.1126/science.1549777. [DOI] [PubMed] [Google Scholar]
- Djafarzadeh S, Niggli V. Signaling pathways involved in dephosphorylation and localization of the actin-binding protein cofilin in stimulated human neutrophils. Exp Cell Res. 1997;236:427–435. doi: 10.1006/excr.1997.3731. [DOI] [PubMed] [Google Scholar]
- Eddy RJ, Han J, Condeelis JS. Capping protein terminates but does not initiate chemoattractant-induced actin assembly in Dictyostelium. . J Cell Biol. 1997;139:1243–1253. doi: 10.1083/jcb.139.5.1243. [DOI] [PMC free article] [PubMed] [Google Scholar]
- Hartwig JH. Mechanisms of actin rearrangements mediating platelet activation. J Cell Biol. 1992;118:1421–1442. doi: 10.1083/jcb.118.6.1421. [DOI] [PMC free article] [PubMed] [Google Scholar]
- Hartwig JH, DeSisto M. The cytoskeleton of the resting human blood platelet: structure of the membrane skeleton and its attachment to actin filaments. J Cell Biol. 1991;112:407–425. doi: 10.1083/jcb.112.3.407. [DOI] [PMC free article] [PubMed] [Google Scholar]
- Hartwig JH, Shevlin P. The architecture of actin filaments and the ultrastructural location of actin-binding protein in the periphery of lung macrophages. J Cell Biol. 1986;103:1007–1020. doi: 10.1083/jcb.103.3.1007. [DOI] [PMC free article] [PubMed] [Google Scholar]
- Hartwig JH, Yin HL. The organization and regulation of the macrophage actin skeleton. Cell Motil Cytoskelet. 1988;10:117–125. doi: 10.1002/cm.970100116. [DOI] [PubMed] [Google Scholar]
- Hartwig JH, Tyler J, Stossel TP. Actin-binding protein promotes the bipolar and perpendicular branching of actin filaments. J Cell Biol. 1980;87:841–848. doi: 10.1083/jcb.87.3.841. [DOI] [PMC free article] [PubMed] [Google Scholar]
- Heyworth PG, Robinson JM, Ding J, Ellis BA, Badwey JA. Cofilin undergoes rapid dephosphorylation in stimulated neutrophils and translocates to ruffled membranes enriched in products of the NADPH oxidase complex. Evidence for a novel cycle of phosphorylation and dephosphorylation. Histochem Cell Biol. 1997;108:221–233. doi: 10.1007/s004180050162. [DOI] [PubMed] [Google Scholar]
- Kabsch W, Vandekerckhove J. Structure and function of actin. Annu Rev Biophys Biomol Struct. 1992;21:49–76. doi: 10.1146/annurev.bb.21.060192.000405. [DOI] [PubMed] [Google Scholar]
- Karlsson R, Lassing I, Hoglund AS, Lindberg U. The organization of microfilaments in spreading platelets: a comparison with fibroblasts and glial cells. J Cell Physiol. 1984;121:96–113. doi: 10.1002/jcp.1041210113. [DOI] [PubMed] [Google Scholar]
- Lauffenburger DA, Horwitz AF. Cell migration: a physically integrated molecular process. Cell. 1996;84:359–369. doi: 10.1016/s0092-8674(00)81280-5. [DOI] [PubMed] [Google Scholar]
- Lee J, Ishihara A, Theriot JA, Jacobson K. Principles of locomotion for simple-shaped cells. Nature. 1993;362:167–171. doi: 10.1038/362167a0. [DOI] [PubMed] [Google Scholar]
- Machesky LM, Insall R. Scar1 and the related Wiskott-Aldrich syndrome protein, WASP, regulate the actin cytoskeleton through the Arp2/3 complex. Curr Biol. 1998;8:1347–1356. doi: 10.1016/s0960-9822(98)00015-3. [DOI] [PubMed] [Google Scholar]
- Machesky LM, Way M. Actin branches out. Nature. 1998;394:125–126. doi: 10.1038/28039. [DOI] [PubMed] [Google Scholar]
- Machesky LM, Atkinson SJ, Ampe C, Vandekerckhove J, Pollard TD. Purification of a cortical complex containing two unconventional actins from Acanthamoebaby affinity chromatography on profilin–agarose. J Cell Biol. 1994;127:107–115. doi: 10.1083/jcb.127.1.107. [DOI] [PMC free article] [PubMed] [Google Scholar]
- Machesky LM, Reeves E, Wientjes F, Mattheyse FJ, Grogan A, Totty NF, Burlingame AL, Hsuan JJ, Segal AW. Mammalian actin-related protein 2/3 complex localizes to regions of lamellipodial protrusion and is composed of evolutionarily conserved proteins. Biochem J. 1997;328:105–112. doi: 10.1042/bj3280105. [DOI] [PMC free article] [PubMed] [Google Scholar]
- Mitchison TJ, Cramer LP. Actin-based cell motility and cell locomotion. Cell. 1996;84:371–379. doi: 10.1016/s0092-8674(00)81281-7. [DOI] [PubMed] [Google Scholar]
- Mogilner A, Oster G. Cell motility driven by actin polymerization. Biophys J. 1996;71:3030–3045. doi: 10.1016/S0006-3495(96)79496-1. [DOI] [PMC free article] [PubMed] [Google Scholar]
- Moon A, Drubin DG. The ADF/cofilin proteins: stimulus-responsive modulators of actin dynamics. Mol Biol Cell. 1995;6:1423–1431. doi: 10.1091/mbc.6.11.1423. [DOI] [PMC free article] [PubMed] [Google Scholar]
- Mullins RD, Stafford WF, Pollard TD. Structure, subunit topology, and actin-binding activity of the Arp2/3 complex from Acanthamoeba. . J Cell Biol. 1997;136:331–343. doi: 10.1083/jcb.136.2.331. [DOI] [PMC free article] [PubMed] [Google Scholar]
- Mullins RD, Heuser JA, Pollard TD. The interaction of Arp2/3 complex with actin: nucleation, high affinity pointed end capping, and formation of branching networks of filaments. Proc Natl Acad Sci USA. 1998;95:6181–6186. doi: 10.1073/pnas.95.11.6181. [DOI] [PMC free article] [PubMed] [Google Scholar]
- Nagaoka R, Abe H, Obinata T. Site-directed mutagenesis of the phosphorylation site of cofilin: its role in cofilin-actin interaction and cytoplasmic localization. Cell Motil Cytoskelet. 1996;35:200–209. doi: 10.1002/(SICI)1097-0169(1996)35:3<200::AID-CM3>3.0.CO;2-C. [DOI] [PubMed] [Google Scholar]
- Niederman R, Amrein P, Hartwig J. Three-dimensional structure of actin filaments and of an actin gel made with actin binding protein. J Cell Biol. 1983;96:1400–1413. doi: 10.1083/jcb.96.5.1400. [DOI] [PMC free article] [PubMed] [Google Scholar]
- Okabe S, Hirokawa N. Incorporation and turnover of biotin-labeled actin microinjected into fibroblastic cells: an immunoelectron microscopic study. J Cell Biol. 1989;109:1581–1595. doi: 10.1083/jcb.109.4.1581. [DOI] [PMC free article] [PubMed] [Google Scholar]
- Oliver T, Lee J, Jacobson K. Forces exerted by locomoting cells. Semin Cell Biol. 1994;5:139–147. doi: 10.1006/scel.1994.1018. [DOI] [PubMed] [Google Scholar]
- Podolski JL, Steck TL. Length distribution of F-actin in Dictyostelium discoideum. . J Biol Chem. 1990;265:1312–1318. [PubMed] [Google Scholar]
- Pollard T. Rate constants for the reactions of ATP and ADP-actin with the ends of actin filaments. J Cell Biol. 1986;103:2747–2754. doi: 10.1083/jcb.103.6.2747. [DOI] [PMC free article] [PubMed] [Google Scholar]
- Rinnerthaler G, Herzog M, Klappacher M, Kunka H, Small JV. Leading edge movement and ultrastructure in mouse macrophages. J Struct Biol. 1991;106:1–16. doi: 10.1016/1047-8477(91)90058-5. [DOI] [PubMed] [Google Scholar]
- Ryder MI, Weinreb RN, Niederman R. The organization of actin filaments in human polymorphonuclear leukocytes. Anatom Rec. 1984;209:7–20. doi: 10.1002/ar.1092090103. [DOI] [PubMed] [Google Scholar]
- Schafer DA, Welch MD, Machesky LM, Bridgman PC, Meyer SM, Cooper JA. Visualization and molecular analysis of actin assembly in living cells. J Cell Biol. 1998;143:1919–1930. doi: 10.1083/jcb.143.7.1919. [DOI] [PMC free article] [PubMed] [Google Scholar]
- Segall JE, Tyerech S, Boselli L, Masseling S, Helft J, Chan A, Jones J, Condeelis J. EGF stimulates lamellipod extension in metastatic mammary adenocarcinoma cells by an actin-dependent mechanism. Clin Exp Metastasis. 1996;14:61–72. doi: 10.1007/BF00157687. [DOI] [PubMed] [Google Scholar]
- Small JV. Organization of actin in the leading edge of cultured cells: influence of osmium tetroxide and dehydration on the ultrastructure of actin meshworks. J Cell Biol. 1981;91:695–705. doi: 10.1083/jcb.91.3.695. [DOI] [PMC free article] [PubMed] [Google Scholar]
- Small JV. The actin cytoskeleton. Electron Microsc Rev. 1988;1:155–174. doi: 10.1016/s0892-0354(98)90010-7. [DOI] [PubMed] [Google Scholar]
- Small JV, Celis JE. Filament arrangements in negatively stained cultured cells: the organization of actin. Cytobiologie. 1978;16:308–325. [PubMed] [Google Scholar]
- Small JV, Herzog M, Anderson K. Actin filament organization in the fish keratocyte lamellipodium. J Cell Biol. 1995;129:1275–1286. doi: 10.1083/jcb.129.5.1275. [DOI] [PMC free article] [PubMed] [Google Scholar]
- Svitkina TM, Verkhovsky AB, Borisy GG. Improved procedures for electron microscopic visualization of the cytoskeleton of cultured cells. J Struct Biol. 1995;115:290–303. doi: 10.1006/jsbi.1995.1054. [DOI] [PubMed] [Google Scholar]
- Svitkina TM, Verkhovsky AB, McQuade KM, Borisy GG. Analysis of the actin–myosin II system in fish epidermal keratocytes: mechanism of cell body translocation. J Cell Biol. 1997;139:397–415. doi: 10.1083/jcb.139.2.397. [DOI] [PMC free article] [PubMed] [Google Scholar]
- Symons MH, Mitchison TJ. Control of actin polymerization in live and permeabilized fibroblasts. J Cell Biol. 1991;114:503–513. doi: 10.1083/jcb.114.3.503. [DOI] [PMC free article] [PubMed] [Google Scholar]
- Ursitti JA, Fowler VM. Immunolocalization of tropomodulin, tropomyosin, and actin in spread human erythrocyte skeletons. J Cell Sci. 1994;107:1633–1639. doi: 10.1242/jcs.107.6.1633. [DOI] [PubMed] [Google Scholar]
- Ursitti JA, Wade JB. Ultrastructure and immunocytochemistry of the isolated human erythrocyte membrane skeleton. Cell Motil Cytoskelet. 1993;25:30–42. doi: 10.1002/cm.970250105. [DOI] [PubMed] [Google Scholar]
- Verschueren H, Dewit J, De Braekeleer J, Schirrmacher V, De Baetselier P. Motility and invasive potency of murine T-lymphoma cells: effect of microtubule inhibitors. Cell Biol Int. 1994;18:11–19. doi: 10.1006/cbir.1994.1002. [DOI] [PubMed] [Google Scholar]
- Welch MD, DePace AH, Verma S, Iwamatsu A, Mitchison TJ. The human Arp2/3 complex is composed of evolutionarily conserved subunits and is localized to cellular regions of dynamic actin filament assembly. J Cell Biol. 1997a;138:375–384. doi: 10.1083/jcb.138.2.375. [DOI] [PMC free article] [PubMed] [Google Scholar]
- Welch MD, Iwamatsu A, Mitchison TJ. Actin polymerization is induced by Arp2/3 protein complex at the surface of Listeriamonocytogenes. Nature. 1997b;385:265–269. doi: 10.1038/385265a0. [DOI] [PubMed] [Google Scholar]
- Welch MD, Rosenblatt J, Skoble J, Portnoy DA, Mitchison TJ. Interaction of human Arp2/3 complex and the Listeriamonocytogenes ActA protein in actin filament nucleation. Science. 1998;281:105–108. doi: 10.1126/science.281.5373.105. [DOI] [PubMed] [Google Scholar]
- Wolosewick JJ, Condeelis J. Fine structure of gels prepared from an actin binding protein and actin: comparison to cytoplasmic extracts and cortical cytoplasm in ameboid cells of Dictyostelium discoideum. . J Cell Biochem. 1986;30:227–227. doi: 10.1002/jcb.240300305. [DOI] [PubMed] [Google Scholar]
- Xie H, Turner T, Wang MH, Singh RK, Siegal GP, Wells A. In vitro invasiveness of DU-145 human prostate carcinoma cells is modulated by EGF receptor-mediated signals. Clin Exp Metastasis. 1995;13:407–419. doi: 10.1007/BF00118180. [DOI] [PubMed] [Google Scholar]
- Yang N, Higuchi O, Ohashi K, Nagata K, Wada A, Kangawa K, Nishida E, Mizuno K. Cofilin phosphorylation by LIM-kinase 1 and its role in rac-mediated actin reorganization. Nature. 1998;393:809–812. doi: 10.1038/31735. [DOI] [PubMed] [Google Scholar]
- Yin HL, Hartwig JH. The structure of the macrophage actin skeleton. J Cell Sci. 1988;9(Suppl.):169–184. doi: 10.1242/jcs.1988.supplement_9.9. [DOI] [PubMed] [Google Scholar]
- Zigmond SH. Actin cytoskeleton: the Arp2/3 complex gets to the point. Curr Biol. 1998;8:R654–R657. doi: 10.1016/s0960-9822(07)00415-0. [DOI] [PubMed] [Google Scholar]