

Abstract
Microtubule dynamics vary during the cell cycle, and microtubules appear to be more dynamic in vivo than in vitro. Proteins that promote dynamic instability are therefore central to microtubule behavior in living cells. Here, we report that a yeast protein of the highly conserved EB1 family, Bim1p, promotes cytoplasmic microtubule dynamics specifically during G1. During G1, microtubules in cells lacking BIM1 showed reduced dynamicity due to a slower shrinkage rate, fewer rescues and catastrophes, and more time spent in an attenuated/paused state. Human EB1 was identified as an interacting partner for the adenomatous polyposis coli (APC) tumor suppressor protein. Like human EB1, Bim1p localizes to dots at the distal ends of cytoplasmic microtubules. This localization, together with data from electron microscopy and a synthetic interaction with the gene encoding the kinesin Kar3p, suggests that Bim1p acts at the microtubule plus end. Our in vivo data provide evidence of a cell cycle–specific microtubule-binding protein that promotes microtubule dynamicity.
Keywords: cell cycle, cell polarity, microtubule- associated proteins, microtubules, Saccharomyces cerevisiae
The microtubule cytoskeleton is responsible for the coordinated movements of many structures in eukaryotic cells, including chromosomes, the microtubule organizing center (MTOC),1 organelles, and the nuclei of polarized cells such as budding yeast (13). It participates not merely as a static infrastructure, but as a dynamic network. Microtubules exhibit two major dynamic behaviors. Dynamic instability is characterized by the rate of growth (polymerization), the rate of shrinkage (depolymerization), and the frequencies of transitions between growth and shrinkage, termed rescue and catastrophe. Treadmilling results from the balanced addition of tubulin dimers to the microtubule plus end and the loss of dimers from the minus end (17, 20, 29). Additionally, microtubules have been observed to spend time in an attenuated or paused state, during which they experience no observable net change in length (for a recent review see 13). Changes in polymerization dynamics are generated by microtubule-associated proteins (MAPs) as well as other factors which localize to the microtubule cytoskeleton (31), but there is currently little information describing the effects of these proteins on microtubule dynamics in vivo.
In budding yeast, astral microtubules are most dynamic during G1, when they position the spindle before mitosis (5). Spindle positioning consists of both the migration of the nucleus to the bud site and the alignment of the preanaphase spindle to the mother-bud axis (14); the properly positioned spindle elongates into the daughter cell to distribute the chromosomes equally (59). In addition to microtubules themselves, proteins localized to microtubules and the cell cortex are required for spindle positioning in yeast (25, 27, 33, 36, 46, 47), presumably through the production of force and the generation of microtubule attachment sites at the cortex. For example, deletion of the gene for cytoplasmic dynein reduces microtubule dynamics and alters mitotic spindle position (5).
Recently, several proteins have been identified that promote, rather than decrease, microtubule dynamic instability. These include Xenopus XMAP215, which has the novel effect of increasing the growth and shrinkage rates (the growth rate increase is proportionally greater than the shrinkage rate increase) and decreasing the rescue frequency, producing a net increase in instability without reducing microtubule length (18, 51). The echinoderm EMAP promotes dynamic instability by increasing the growth and shrinkage rates and inhibiting rescue (19). Two additional destabilizing factors are the oncoprotein OP18, which sequesters tubulin dimers and increases the catastrophe frequency (2, 30), and the kinesin-related protein XKCM1, which increases catastrophes (53). Although OP18 regulates microtubule dynamics in the egg extract system, the OP18 knockout mouse develops normally and is not predisposed to tumor formation (42). Here, we provide evidence in living cells that Bim1p shares this property of promoting the dynamic instability of microtubules.
Bim1p is the sole budding yeast member of a highly conserved family of proteins which localize to the microtubule cytoskeleton (1, 43). The first member of this family, human EB1, was cloned by its interaction with the carboxyl terminus of the tumor suppressor protein adenomatous polyposis coli (APC), a domain deleted in the majority of colon cancers (49). EB1 has been localized along nuclear and cytoplasmic microtubules throughout the cell cycle, as well as to the tips (plus ends) of cytoplasmic microtubules (4, 34). Another member of the family, RP1, isolated by differential display of mRNAs induced upon T-lymphocyte activation, also localizes to and binds microtubules (23, 39). The functions of the human proteins are unknown, but based on the high degree of conservation across species, they are postulated to play a similar role in regulating the behavior of microtubules.
In this report, we demonstrate that Bim1p promotes microtubule dynamic instability, predominantly during the G1 phase of the cell cycle. Deletion of BIM1 decreased the microtubule shrinkage rate and the frequency of rescues and catastrophes, and it increased the proportion of time spent pausing, resulting in shorter, less dynamic cytoplasmic microtubules. Coincident with the G1 specific reduction in microtubule dynamics, cells lacking Bim1p had a severe defect in spindle position. Bim1p functionally opposed the kinesin Kar3p: simultaneous deletion of BIM1 suppressed the temperature sensitivity of a kar3Δ mutant and produced microtubules of intermediate length between the two single mutants. Although deletion of KAR3 corrected the spindle position defect of the bim1Δ mutant, it did not restore microtubule dynamicity. Because deletion of BIM1 produces a remarkably similar phenotype to treatment of mammalian cells with chemotherapeutic drugs (22), it is possible that the activity of EB1 proteins may be altered by these agents.
Materials and Methods
Strains, Media, and Genetic Techniques
Genotypes of the yeast strains used in this study, all isogenic or congenic with W3031a, are listed in Table I. Media, genetic techniques, cell cycle synchronization with α-factor, and lithium acetate transformation were as described (40). Integrating plasmids were integrated at the marker locus.
Table I.
Strains Used in this Study
| Name | Genotype | Source | ||
|---|---|---|---|---|
| L4852 | MAT a; ura3-1; leu2-3, 112; his3-11, 15; ade2-1; trp1-1; GAL+; can1-100 | Elion | ||
| PY2592 | MAT a; ura3-1; leu2-3, 112; his3-11, 15; ade2-1; trp1-1; GAL+; can1-100; bim1::KanR | This study | ||
| PY2370 | MAT a; ura3-1; leu2-3, 112; his3-11, 15; ade2-1; trp1-1; GAL+; can1-100; TUB1-GFP::URA3 | This study | ||
| PY2376 | MAT a; ura3-1; leu2-3, 112; his3-11, 15; ade2-1; trp1-1; GAL+; can1-100; bim1::KANR; | This study | ||
| TUB1-GFP::URA3 | ||||
| PY2597 | MAT a; ura3-1; leu2-3, 112; his3-11, 15; ade2-1; trp1-1; GAL+; can1-100; NUF2-GFP::URA3 | This study | ||
| PY2598 | MAT a; ura3-1; leu2-3, 112; his3-11, 15; ade2-1; trp1-1; GAL+; can1-100; | This study | ||
| bim1::KANR; NUF2-GFP::URA3 | ||||
| PY2599 | MAT a; ura3-1; leu2-3, 112; his3-11, 15; ade2-1; trp1-1; GAL+; can1-100; bim1::KanR; {PB1225} | This study | ||
| PY2593 | MATα; ura3; leu2; his3; ade2; trp1; kar3::TRP1; bim1::KanR | This study | ||
| AFS462 | MATα; ura3; leu2; his3; ade2; trp1; kar3::TRP1 | Murray |
BIM1 Deletion and Epitope Tagging
A precise deletion of the BIM1 coding sequence (bim1Δ) was created by one-step gene replacement with the selectable marker Kanr (52). The DNA fragment used to generate the deletion was made by PCR of the kanMX2 module using the forward primer 5′-AAAAGCAAGGAT AATATTCCACCAAATCAGGGACGAAGCACAGCTGAAGCTTC- GTACGC-3′ and the reverse primer 5′-AATACATATTCGAAAA CAATACTGCTTTTTAGTTCTCAACGCATAGGCCACTAGTGGA- TCTG-3′ (homologies to the immediate upstream and downstream flanking regions of the BIM1 open reading frame are underlined). Gene replacement was verified by Southern blotting.
The BIM1 promoter and coding sequence were recovered separately by PCR from a plasmid-borne genomic BIM1 allele (a gift from Bee-Na Lee and Elaine Elion, Harvard Medical School, Boston, MA). Primers for the open reading frame were 5′-CCAGGACTTGAAT TCAATGGAGTGCGGGTATCGGAG-3′ and 5′-GCAGCTCGAGTTAAAAAGTTTCCTCGTCGATGATC-3′ (EcoRI and XhoI restriction sites are underlined), and primers for 1.2 kb of noncoding sequence upstream of the open reading frame, BIM1 promoter, were 5′-GCACGAGCTCTATGTTGGAACCACAGTGTAGATAC-3′ and 5′-GGTCGGATCCCTGATTTGGTGGAATATTATCC-3′ (SacI and BamHI restriction sites underlined). The coding sequence for the green fluorescent protein (GFP) incorporating the codon changes for optimal expression in yeast as well as the fluorescence increasing chromophore mutations S65G and S72A (yEGFP1) (9) was PCR amplified using the primers 5′-GTACGGATCCATGTCTAAAGGTGAAGAATTATTCACTGG-3′ and 5′- CATGGAATTCGCTTTGTACAATTCATCCATACC-3′ (BamHI and EcoRI restriction sites are underlined). The XhoI-KpnI fragment containing the CYC1 terminator was obtained from the pRS416 (45)-based vector FB1545 (37). These fragments were sequentially ligated into the centromeric plasmid pRS316 (45) to create a plasmid for GFP-Bim1p expression (PB1225). Functionality of this construct was confirmed by complementation of the mating defect of the bim1Δ strain.
Northern Blotting and Western Blotting
Northern blotting was performed on total yeast RNA (5 μg) from cells arrested with 5 μm α-factor and harvested at 10-min intervals after release, using a 500-bp probe generated with Prime-It II (Stratagene). Cell synchronization was verified by cell morphology.
For Western blotting, denaturing whole yeast cell extracts were prepared by the NaOH/β-mercaptoethanol method of Yaffe and Schatz (58). Primary antibodies were rabbit anti–α-tubulin (345-4) and anti–β-tubulin (206-3) (gifts of Frank Solomon, Massachusetts Institute of Technology, Cambridge, MA [54]), rabbit anti-GFP (gift of Aaron Straight, Harvard Medical School), and rabbit antiactin (gift of Rong Li, Harvard Medical School).
Fluorescence Microscopy
The fluorescence plasmids encoding GFP-Tub1p (pAFS125), a gift from Aaron Straight and Andrew Murray (University of California, San Francisco, San Francisco, CA), and Nuf2p-GFP (pKG67), a gift from Jason Kahana (Dana-Farber Cancer Institute, Boston, MA) and Pam Silver (Dana-Farber Cancer Institute), were transformed into BIM1 (L4852) and bim1Δ (PY2592) strains; 24 transformants were screened for maximum fluorescence. GFP-Tub1p is controlled by the TUB1 promoter. Similar to GFP-Tub3p under the control of the galactose promoter (5), GFP-Tub1p cannot fully complement a tub1Δ mutation, but it does not adversely affect the growth rate of the cells. The Nuf2p-GFP fusion protein, which marks the spindle poles, complements a nuf2Δ mutation (14, 24).
Nuclear morphology was assessed by fluorescence microscopy in cells stained with the nuclear dye DAPI (Boehringer Mannheim). 700 cells from each strain were counted for calculation of the percentage of binucleate budded cells. Spindle orientation was measured in live cells expressing Nuf2p-GFP, or in fixed cells stained by indirect antitubulin immunofluorescence, in which the spindle pole bodies were parfocal, using a single combined DIC/GFP image in which fluorescence and visible light were viewed simultaneously through a DIC filter. 200 cells were counted for each strain. For microtubule length and number measurements, static images of fields of live cells expressing GFP-Tub1p were acquired on two or three separate days and combined, and length measurements were made from 150–300 cells.
Time-lapse analysis of live cells was performed on log phase cells in G1, preanaphase (as assessed by the presence of a short bipolar spindle), and anaphase, grown on SC medium supplemented with adenine. 1.5 μl of a suspension of these cells was pipetted onto a thin layer of medium and 1% agarose, sandwiched between a glass slide and a coverslip, and sealed with a mixture of equal parts Vaseline, paraffin, and lanolin. The cells were viewed with a Nikon ECLIPSE E600 fluorescence microscope (Nikon Inc.), equipped with a 100-W mercury arc illuminator, a 100× Planapochromat 1.4 NA strain-free oil immersion objective, and the Endow GFP filter set (excitation 450–490 nm, dichroic 495, emission 500 nm LP) (Chroma Scientific). Images were acquired with a Hamamatsu 4742-95 Orca digital cooled charge coupled device (CCD) camera (which uses the 1280 × 1024 Sony Interline chip) (Hamamatsu Photonics). The Ludl Biopoint z-axis focus motor, filter wheel, and shutter controller (Ludl Electronics) as well as the CCD camera were controlled by Openlab Software (Improvision).
Time-lapse series were obtained using an automated protocol which acquired a series of 2 × 2 binned images every 8 s. Each time point consisted of a sequence of 8–10 fluorescence images in Z-focal planes 0.3 μm apart. To reduce photodamage, 7/8 of the light was attenuated by a neutral density filter and exposure time was limited to 250 ms (conditions that appeared to cause less photobleaching than shorter, brighter exposures). Only microtubules whose entire three-dimensional length was encompassed within the stack of Z-focal plane images were included in subsequent analyses. A single DIC image was obtained at the end of each time-lapse series for confirmation of cell outline and the presence or absence of a bud. Typical movies lasted for 2–10 min. For technical reasons, our study was limited to microtubules in the bim1Δ mutant that were long enough to measure, and hence it was biased to this longer population. Where appropriate, several cells from the same movie or multiple microtubules from the same cell were analyzed. During all experiments the ambient temperature of the room was maintained at 23°C.
Image Analysis and Measurements
All image manipulations and measurements were performed using Openlab Software. For spindle orientation measurements, the angle formed between the spindle and the mother-bud axis, as well as statistical comparisons, was calculated using Microsoft Excel software (Microsoft Corp.). For time-lapse movies, each set of Z-focal plane images was combined to form a single two-dimensional projection. At each time point, the length of the microtubule in this projection was measured in quadruplicate and averaged; its height in the z-axis was determined by counting the number of sections containing an in-focus portion of the microtubule. These values were used to calculate the true three-dimensional microtubule length using Microsoft Excel. Statview software (Abacus Concepts) was used for the construction of life tables and calculation of dynamic rates. Use of these three-dimensional lengths instead of the two-dimensional projections produced up to a 30–40% increase in rates, depending on the orientation of the microtubule relative to the z-axis.
Microtubule dynamics rates were calculated using the bivariate plots constructed with Statview software. Growth and shrinkage were defined by a line with an R2 value of ≥0.85 and a net change in length of ≥0.7 μm. (This criterion resulted in inclusion of brief growth or shrinkage events with large slopes, and longer duration events with smaller slopes.) Pauses were defined as events lasting ≥24 s (four or more data points) in which no statistically significant growth or shrinkage occurred. Catastrophes were defined as transitions to shrinkage after a growth or a pause; rescues was defined as transitions to growth after a shrinkage or a pause. The frequency of catastrophe and rescue was calculated by dividing the total number of events by the total evaluable time in all movies of the category being analyzed. In general, based on fluorescence intensity, we believe that we were observing single microtubules and that we could differentiate true rescues from apparent rescues caused by superimposition of microtubules. However, we could not rule out the possibility that in a rare case two or more bundled microtubules were behaving as a group, leading to a falsely elevated rescue frequency. Time allocation measurements were calculated by adding together all time spent in a given state and dividing by the total evaluable time. Because our definitions of growth, shrinkage, and pausing generally required a sustained behavior ≥24 s, brief periods of time during some experiments remained unclassified. The dynamicity parameter (50) was expressed as total dimers gained and lost per second for each population of microtubules. Comparisons of statistical significance were by t test.
Electron Microscopy and Analysis
BIM1 and bim1Δ strains were prepared for electron microscopy using the method described previously (57). Briefly, aliquots from log-phase cultures were collected by vacuum filtration, the cell paste was transferred to sample holders, and the samples were frozen in a Balzer's HPM010 high pressure freezer. The frozen cells were then freeze-substituted in 2% OsO4 and 0.1% uranyl acetate in acetone at −90°C for 3 d, then warmed to −20°C. The samples were kept at −20°C overnight, then warmed to room temperature and embedded in Epon-Araldite. Serial 50-nm sections were cut using a Reichert Ultracut-E microtome and collected onto formvar-coated copper slot grids. The sections were post-stained with 2% uranyl acetate in 70% methanol and aqueous lead citrate. Sections were viewed in a CM10 electron microscope (Philips Electronic Instruments Co.) operating at 80 kV. Serial micrographs through spindle pole bodies from 10 bim1Δ and 5 BIM1 cells were collected. The serial negatives were digitized using a Dage 81 MTI video camera into a Silicon Graphics INDY computer. The digitized images were then aligned, and the cytoplasmic microtubules tracked and modeled using the IMOD software package (26).
Results
Bim1p Localizes to the Spindle and the Tips of Cytoplasmic Microtubules
We examined the localization of Bim1p in living cells using a functional GFP-Bim1p fusion protein expressed from the native BIM1 promoter. Bim1p fluorescence was visible in nearly every cell at every stage of the cell cycle (Fig. 1). In cells containing a short bipolar spindle, GFP-Bim1p fluoresced in a bright band along the length of the spindle (Fig. 1, A and H). Following anaphase, fluorescence was maintained along the length of the spindle but was brightest at the poles and in the region of microtubule overlap at the spindle midzone (Fig. 1, B, C, F, and G). In the cytoplasm, fluorescence usually (80% of cells) appeared as an intense spot or spots in the expected position of cytoplasmic microtubule tips, equivalent to the plus ends (28) (arrows). This discontinuous localization contrasts the more uniform microtubule localization seen when the protein was overexpressed from the ACT1 promoter (43), but the tip fluorescence is remarkably similar to the recently reported staining of human EB1 and RP1 (23, 34). The potential enrichment of Bim1p at microtubule ends has implications for models to explain the role of Bim1p in regulating microtubule dynamics in vivo.
Figure 1.

Localization of GFP-Bim1p. Images of asynchronously grown bim1Δ cells expressing GFP-Bim1p from the BIM1 promoter are shown. These images are two-dimensional composites of Z-focal plane series 0.5 μm apart. Arrows indicate microtubule distal ends. Bar, 1 μm.
bim1Δ Cells Have Shorter Cytoplasmic Microtubules
Observation of the microtubule cytoskeleton in bim1Δ mutant cells by either indirect immunofluorescence or GFP tubulin fluorescence revealed a cell cycle–dependent change in the length of cytoplasmic microtubules (data not shown and Fig. 2 A). During G1, the cytoplasmic microtubules in exponentially growing cells were shorter in bim1Δ than in BIM1 cells (mean length 1.05 μm vs. 1.59 μm, P < 0.0001). Synchronization in G1 with the mating pheromone α-factor accentuated this effect on microtubule length (mean length 1.52 μm in bim1Δ vs. 2.60 μm in BIM1, P < 0.0001). By contrast, during anaphase the mean length was slightly greater in bim1Δ compared to BIM1 cells (1.56 μm and 1.32 μm, P = 0.03). Cell size did not differ between the strains at any cell cycle stage (data not shown).
Figure 2.

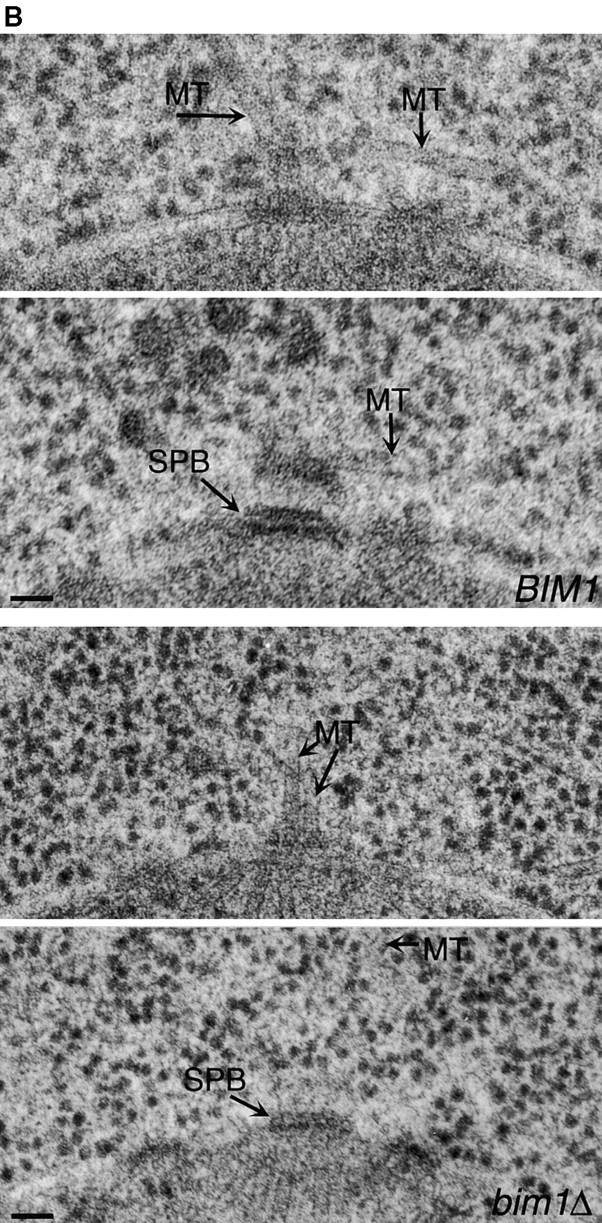

Cells lacking BIM1 have shorter cytoplasmic microtubules during G1. (A) Fluorescence images of GFP-Tub1p in BIM1 and bim1Δ cells. Bar, 1 μm. (B) Serial section electron micrographs through the spindle pole bodies of BIM1 and bim1Δ cells. (Top) BIM1 cell. Two cytoplasmic microtubules (MT) can be seen at the outer plaque of the spindle pole body (SPB). Complete serial sections through the SPB of this cell revealed three cytoplasmic microtubules. Bar, 50 nm. (Bottom) bim1Δ cell. Three cytoplasmic microtubules can be detected. Complete serial sections through the SPB of this cell revealed four cytoplasmic microtubules. Bar, 50 nm. (C) Cytoplasmic microtubule lengths in BIM1 and bim1Δ cells expressing GFP-Tub1p. 150–300 cells were measured for each condition. The box plot shows the median length (line in the center of the box); the box contains 50% of the data points surrounding the median, the outer bars contain 80% of the data points surrounding the median, and the dots are the outlying 20% of data points (see inset).
By fluorescence microscopy, microtubules can be reliably measured once their length reaches 0.5 μm. When we performed electron microscopy of bim1Δ mutant cells, we saw additional, even shorter microtubules in the 100–200-nm range that were not present in wild-type controls. Fig. 1 B shows an example of the cytoplasmic outer plaque of the yeast spindle pole body with cytoplasmic microtubules emanating from it. The mean length of these short microtubules was 79 nm. We were also able to visualize the spindle pole bodies and the proximal (minus) microtubule ends by electron tomography, and these both appeared morphologically normal (data not shown). Based on these images, we hypothesized that Bim1p would affect microtubule assembly in a cell cycle–specific manner.
Cytoplasmic Microtubule Dynamics in Wild-Type Cells
Cytoplasmic microtubule dynamics were measured in living cells expressing GFP-Tub1p under the control of the TUB1 promoter. The level of expression of the GFP-Tub1p fusion protein was approximately one-fourth that of untagged α-tubulin (see Fig. 5, lanes 5 and 6). The GFP-Tub1p fusion protein produced uniform fluorescence along nuclear and cytoplasmic microtubules similar to that seen by indirect immunofluorescence in fixed wild-type cells, and the growth rates of strains containing GFP-Tub1p were indistinguishable from the corresponding nonfluorescent strains (data not shown). Initial observations of the microtubule movements in living cells revealed dynamic changes in the length of microtubules coupled with vigorous pivoting and swiveling of the microtubules about the spindle pole body. We used a measure of microtubule length determined from the two-dimensional projection of the microtubule in a composite of Z-focal plane sections and the path through serial Z sections at every time point (see Materials and Methods). This technique eliminated underestimates of rates based on the length of the two-dimensional projection alone and expanded the analysis to include microtubules that made excursions out of the focal plane.
Figure 5.

Steady-state tubulin levels are unaffected by deletion of BIM1. BIM1 and bim1Δ cells were grown asynchronously (lanes 1, 2, 5, and 6) or arrested with α-factor (lanes 3 and 4) and Western blotting was performed on cell lysates. (Top) Anti– α-tubulin blot. Cells simultaneously expressing endogenous α-tubulin and GFP-Tub1p, used for the microtubule dynamics measurements (lanes 5 and 6), show an additional band at ∼80 kD, which represents the fusion protein. (Bottom) Anti–β-tubulin blot.
In BIM1 cells, cytoplasmic microtubules exhibited dynamic instability in vivo as has been described (5, 44), but the rates were considerably faster in our system than previously reported. There was greater microtubule dynamic instability during G1 than in preanaphase or anaphase, and this was due to increases in the shrinkage rate as well as both transition frequencies. These dynamic changes, discussed in more detail below, are illustrated in the time-lapse sequences of a BIM1 cell in the G1 phase of the cell cycle, shown in Fig. 3 A, and in the life history tables in Fig. 4 A, and summarized in Tables II and III.
Figure 3.

Cytoplasmic microtubule dynamics in living cells expressing GFP-Tub1p. The sequences shown are two-dimensional projections of Z-focal plane series 0.3 μm apart; the interval between images is 8 s. (A) Unbudded (G1) BIM1 cell. The arrow points to a cytoplasmic microtubule that grows 1.8 μm in 48 s and then begins to shrink. (B) Unbudded (G1) bim1Δ cell. The arrow points to a cytoplasmic microtubule that undergoes a continuous pause for 232 s (it appears to shrink somewhat in the last 12 frames because it rotates out of the focal plane). Bars, 1 μm.
Figure 4.


BIM1 deletion reduces cytoplasmic microtubule dynamics in G1. BIM1 and bim1Δ cells expressing GFP-Tub1p were imaged by time-lapse microscopy at 8-s intervals. Life history plots were constructed from measurements of three-dimensional microtubule length (see Materials and Methods) versus time. The scale is the same for each plot. (A) Cytoplasmic microtubule dynamics in G1 cells. (B) Cytoplasmic microtubule dynamics in mitotic (preanaphase or anaphase) cells.
Table II.
Cytoplasmic Microtubule Dynamic Rates and Frequencies
| Parameter | Genotype | G1 | Preanaphase | Anaphase | ||||
|---|---|---|---|---|---|---|---|---|
| Growth rate | BIM1 | 2.17 ± 0.26 (n = 38) | 1.73 ± 0.63 (n = 13) | 1.57 ± 0.28 (n = 17) | ||||
| bim1Δ | 1.76 ± 0.38 (n = 6) | 1.45 ± 1.28 (n = 11) | 1.30 ± 0.18 (n = 15) | |||||
| bim1Δkar3Δ | 1.56 ± 0.69 (n = 11) | 1.05 ± 0.53 (n = 7) | 1.17 ± 0.31 (n = 9) | |||||
| Shrinkage rate | BIM1 | 3.20 ± 0.24 (n = 33) | 2.68 ± 0.58 (n = 13) | 2.19 ± 0.26 (n = 23) | ||||
| bim1Δ | 1.82 ± 0.23 (n = 13) | 1.83 ± 0.42 (n = 15) | 2.03 ± 0.30 (n = 21) | |||||
| bim1Δkar3Δ | 2.07 ± 0.96 (n = 11) | 1.47 ± 0.57 (n = 7) | 1.31 ± 0.50 (n = 15) | |||||
| Catastrophe frequency | BIM1 | 0.0083 (n = 30) | 0.0036 (n = 8) | 0.0066 (n = 18) | ||||
| bim1Δ | 0.0035 (n = 8) | 0.0024 (n = 6) | 0.0048 (n = 15) | |||||
| bim1Δkar3Δ | 0.0029 (n = 8) | 0.0035 (n = 6) | 0.0055 (n = 10) | |||||
| Rescue frequency | BIM1 | 0.0067 (n = 24) | 0.0023 (n = 5) | 0.0044 (n = 12) | ||||
| bim1Δ | 0.0022 (n = 5) | 0.0012 (n = 3) | 0.0023 (n = 7) | |||||
| bim1Δkar3Δ | 0.0037 (n = 10) | 0.0029 (n = 5) | 0.0039 (n = 7) | |||||
| Dynamicity | BIM1 | 44.2 | 27.1 | 27.3 | ||||
| bim1Δ | 12.0 | 26.2 | 23.2 | |||||
| bim1Δkar3Δ | 17.1 | 19.8 | 23.2 |
For BIM1, in G1 19 time-lapse sequences lasting a total of 3,600 s were obtained; in preanaphase, 11 time-lapse sequences lasting a total of 2,222 s were obtained; in anaphase, 12 time-lapse sequences lasting a total of 2,724 s were obtained. For bim1Δ, in G1 15 time-lapse sequences lasting a total of 2,307 s were obtained; in preanaphase, 10 time-lapse sequences lasting a total of 2,521 s were obtained; in anaphase, 16 time-lapse sequences lasting a total of 3,106 s were obtained. For bim1ΔkarΔ, in G1 15 time-lapse sequences lasting a total of 2,726 s were obtained; in preanaphase 5 time-lapse sequences lasting a total of 1,701 s were obtained; in anaphase 12 time-lapse sequences lasting a total of 1,813 s were obtained. Rates of growing and shrinking are presented in μm/min ± SEM. Frequencies of rescue and catastrophe are in events/s. Dynamicity is expressed as dimers/s for the population. The n refers to the number of events.
Table III.
Time Distribution Among Growing, Shrinking, and Pausing
| G1 | Preanaphase | Anaphase | ||||||||||||||||
|---|---|---|---|---|---|---|---|---|---|---|---|---|---|---|---|---|---|---|
| Grow | Shrink | Pause | Grow | Shrink | Pause | Grow | Shrink | Pause | ||||||||||
| BIM1 | 51% | 26% | 16% | 51% | 24% | 21% | 38% | 29% | 28% | |||||||||
| bim1Δ | 8% | 21% | 66% | 32% | 47% | 22% | 33% | 28% | 27% | |||||||||
| bim1Δ kar3Δ | 17% | 23% | 52% | 33% | 30% | 34% | 22% | 48% | 20% | |||||||||
Microtubule life history plots were used to calculate the percentage of time spent growing, shrinking, and pausing during three phases of the cell cycle in BIM1, bim1Δ, and bim1Δkar3Δ cells.
In BIM1 cells, microtubules were most dynamic during the G1 phase of the cell cycle. The shrinkage rate was significantly faster than the growth rate during G1 (shrinkage 3.2 μm/min vs. growth 2.2 μm/min, P = 0.006, Table II). These rates were faster than the shrinkage and growth rates in anaphase, which were 2.2 μm/min and 1.6 μm/min, respectively (the difference in shrinkage rates between G1 and anaphase was statistically significant, P = 0.007). Rates were similar in preanaphase compared to anaphase (preanaphase shrinkage rate 2.7 μm/min and growth rate 1.7 μm/min). In addition to growth and shrinkage rates, the frequency of dynamic transitions was greater in G1 compared to mitosis. In G1, catastrophe and rescue frequencies were 0.008/s and 0.007/s, respectively, compared to the preanaphase catastrophe frequency of 0.004/s and rescue frequency of 0.002/s, and the anaphase catastrophe frequency of 0.007/s and rescue frequency of 0.004/s.
A comparison of time distribution between growing, shrinking, and pausing was also informative (Table III). During G1, when the shrinkage rate was faster, the amount of time spent shrinking was similar to the rest of the cell cycle, but the amount of time spent growing was greater. BIM1 cells spent 51% of their time growing during G1, vs. 38% of their time growing during anaphase. For comparison, we also used the dynamicity parameter (50), which takes into account the total activity during the microtubule lifetime. Dynamicity was increased 1.6-fold during G1, 44 dimers/s vs. 27 dimers/s during mitosis. Thus, although microtubule length was similar in G1 and mitotic cells, microtubules in G1 cells were significantly more dynamic, with faster shrinkage rates, more frequent catastrophes and rescues, and less time spent pausing. The microtubule lengths predicted from multiplying the mean growth rate with the mean time spent growing correlated well with the lengths measured in static images of BIM1 cells (predicted length 1.7 μm vs. measured length 1.6 μm in G1; predicted length 1.6 μm vs. measured length 1.3 μm in mitosis).
bim1Δ Cells Have Abnormal Cytoplasmic Microtubule Dynamics during G1
One explanation for the reduction in microtubule length and number in the bim1Δ mutant could be that Bim1p functions as a classical MAP and stabilizes microtubules (6). However, as alluded to above, dynamic behavior cannot be predicted from the microtubule lengths in static images. In fact, the overall effect of BIM1 deletion was to make microtubules significantly less dynamic than in BIM1 cells, demonstrating that Bim1p promotes dynamic instability.
The most dramatic differences between microtubule dynamics in BIM1 and bim1Δ cells were observed during the G1 phase of the cell cycle. During G1, the shrinkage rate of microtubules in the bim1Δ mutant was 1.8 μm/min, compared to the rate of 3.2 μm/min in BIM1 cells (P = 0.002, Table II). By contrast with BIM1 cells, where shrinkage was significantly faster than growth, the growth rate was equivalent to the shrinkage rate in bim1Δ cells during G1. In preanaphase and anaphase, the growth and shrinkage rates showed a trend, not statistically significant, to slower rates in the bim1Δ mutant compared to BIM1 cells.
Transition frequencies were also lower in the bim1Δ mutant. During G1, the catastrophe frequency in bim1Δ cells was twofold less than in BIM1 (0.004/s, vs. 0.008/s) and the rescue frequency was threefold less than in BIM1 (0.002/s vs. 0.007/s). In preanaphase, the catastrophe and rescue frequencies were more similar between bim1Δ and BIM1 (catastrophe frequencies 0.002/s in bim1Δ vs. 0.004/s in BIM1; rescue frequencies 0.001/s in bim1Δ vs. 0.002/s in BIM1). During anaphase, transition frequencies rose again slightly (catastrophe frequencies 0.005/s for bim1Δ vs. 0.007/s for BIM1; rescue frequencies 0.002/s for bim1Δ vs. 0.004/s for BIM1). During G1, the dynamicity of microtubules in bim1Δ cells, 12 dimers/s, was 3.7-fold lower than the wild-type level of 44 dimers/s. Consequently, microtubules in bim1Δ cells showed greater dynamicity during mitosis than G1. Because our analysis was limited to microtubules in the bim1Δ mutant that were long enough to measure, it might not be representative of the population as a whole; however, based on the electron micrographs which showed very short microtubules in G1 bim1Δ cells, we believe the measured dynamicity is likely to be conservative, rather than to exaggerate the effect of BIM1 deletion. The decreases in dynamic instability are illustrated in Figs. 3 and 4 and summarized in Table II.
Microtubules in bim1Δ cells exhibited a marked increase in the amount of time spent in the paused state during G1 (66% vs. 16% in BIM1 cells, Fig. 4 B and Table III). This increase in pausing was entirely accounted for by a decrease in the time spent growing (8% of G1 spent growing by microtubules in bim1Δ cells vs. 51% in BIM1 cells). During preanaphase, microtubules in bim1Δ cells spent 22% of their time pausing and spent 32% of their time growing (compared to 51% of time spent growing during preanaphase in BIM1). Microtubules in bim1Δ cells spent 21% of their time shrinking in G1, compared to 47% in preanaphase. During anaphase, the time distribution in bim1Δ was nearly identical to BIM1 (27% spent pausing, 33% spent growing, and 28% spent shrinking). Thus, microtubules in bim1Δ cells spent less time growing and more time pausing during G1. The rate of shrinkage was statistically different from BIM1, and both catastrophe frequencies and the time distribution were markedly altered. As with BIM1 cells, the microtubule lengths predicted from the dynamics parameters correlated well with the measured lengths (predicted length 1.0 μm vs. measured length 1.1 μm in G1; predicted length 1.5 μm vs. measured length 1.6 μm in mitosis). Taken together, these data support the conclusion that, rather than acting as a microtubule stabilizing factor, Bim1p promotes microtubule dynamics.
To assess whether the Bim1p-specific effect on microtubule dynamics was related to changes in the concentration of α- and β-tubulin, Western blotting for tubulin was performed in cells growing asynchronously or arrested in G1. Fig. 5 shows that α- and β-tubulin levels were equivalent in BIM1 and bim1Δ strains, both during growth and during α-factor–induced G1 arrest, as well as in the BIM1 and bim1Δ strains expressing GFP-Tub1p used for microtubule dynamics measurements.
Bim1p Regulates Nuclear Microtubule Function
The compactness of the yeast mitotic spindle prevented us from visualizing nuclear microtubule dynamics in the bim1Δ mutant. However, two lines of evidence suggest that Bim1p is important for nuclear microtubule function. First, cells with simultaneous deletion of BIM1 and the gene encoding the spindle assembly checkpoint protein Mad1p were inviable, suggesting that BIM1 deletion activates the spindle assembly checkpoint (data not shown). Second, electron micrographs of bim1Δ cells showed aberrant spindle structures not observed in wild-type controls. Fig. 6 shows an example of a budded bim1Δ cell whose spindle pole bodies have duplicated but a bipolar spindle is not present. Instead, cytoplasmic microtubules intersect at right angles between the two poles. Such a structure could represent an intermediate in spindle formation or a collapsed bipolar spindle. This spindle morphology has not been seen in the BIM1 control or in other wild-type cells examined.
Figure 6.
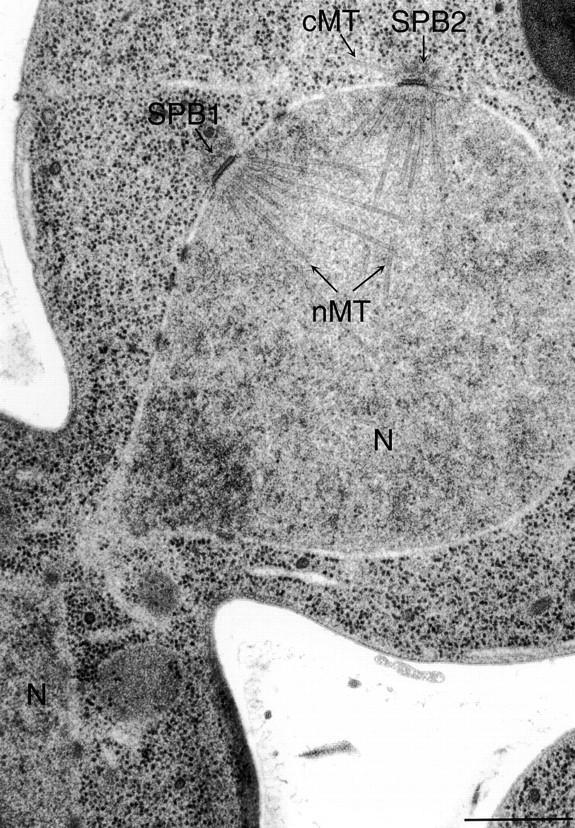
Aberrant spindle structures in the bim1Δ mutant. Two spindle pole bodies (SPB1 and SPB2) are seen in the mother cell, yet the nucleus (N) can be seen in the bud. Nuclear microtubule arrays (nMT) emanate from the SPBs but do not form a bipolar spindle. Complete serial sections through the SPBs show numerous cytoplasmic microtubules (cMT) at the SPB. Bar, 0.5 μm.
BIM1 Is Transcriptionally Regulated
We performed Northern and Western blotting to test whether BIM1 was cell cycle regulated. bim1Δ cells expressing a functional GFP-Bim1p fusion protein from the BIM1 promoter were released from an α-factor arrest and cells harvested every 10 min through 2 cell cycles. GFP-BIM1 (and untagged BIM1) mRNA was cell cycle regulated, peaking during G1-S and dropping during mitosis (Fig. 7 A and data not shown), consistent with its observed effect on microtubule dynamics which predominates during G1. This cell cycle regulation of mRNA was similar to the fluctuations in BIM1 mRNA seen by whole genome microarray analysis (8). Western blotting for the GFP epitope showed a significantly blunted fluctuation in the amount, and no change in the electrophoretic mobility, of Bim1p during the cell cycle (Fig. 7 B). The same result was obtained using Bim1p fused to an HA epitope tag (data not shown). Thus, although BIM1 was transcriptionally regulated, under these conditions the levels of epitope-tagged Bim1p were less affected. The cell cycle effect of Bim1p on microtubule dynamics may therefore be regulated by posttranslational modifications, or by a functional interaction with another protein.
Figure 7.

BIM1 is transcriptionally regulated. GFP-BIM1 cells were arrested in G1 and samples were taken at 10-min intervals after release. Cell cycle position was confirmed by cell morphology. (A) Northern blotting was performed using a probe to the BIM1 coding region (top). Northern blotting of the same samples for the ACT1 mRNA is shown for comparison (bottom). After normalization to actin levels, the difference from the G1/S peak to the trough during mitosis was fourfold. (B) Western blotting was performed using a polyclonal antibody to the GFP epitope. Western blotting for actin is shown below for comparison. After normalization to actin levels, the difference from the G1/S peak to the trough during mitosis was 1.9.
bim1Δ Cells Have a Nuclear Position Defect
The principal function of cytoplasmic microtubules in yeast is to position the nucleus properly during growth and mating (21). To investigate the consequences of shorter, less dynamic cytoplasmic microtubules caused by BIM1 deletion, we examined nuclear positioning in bim1Δ cells during vegetative growth. Nuclear position, consisting of both nuclear movement close to the bud neck and alignment of the spindle angle relative to the mother-bud axis, was measured in live cells containing the spindle pole body protein Nuf2p fused to GFP (24). In the bim1Δ mutant, the localization of Nuf2p-GFP at the poles was more diffuse than in BIM1 cells (data not shown), but the growth of the bim1Δ strain containing Nuf2p-GFP was only minimally reduced (doubling time 2 h vs. 2.2 h at 24°C). As shown in Fig. 8, cells lacking BIM1 displayed a random orientation of the preanaphase spindle relative to the mother-bud axis (the mean spindle orientation angle was 43° in bim1Δ cells vs. 32° in BIM1 cells) and an increased distance between the nucleus and the bud neck (the mean distance from the proximal spindle pole to the bud neck was 2.1 ± 1.2 μm in bim1Δ cells vs. 1.0 ± 0.4 μm in BIM1 cells). This nuclear position defect in bim1Δ cells was also observed by indirect antitubulin immunofluorescence (see Fig. 10 C).
Figure 8.

Nuclear position defect of bim1Δ cells. BIM1 and bim1Δ cells expressing the spindle pole marker Nuf2p-GFP were grown asynchronously, and preanaphase cells were photographed for spindle measurements. The spindle angle was calculated as the angle between a line drawn through the mother-bud axis and a second line drawn between the two spindle poles. 200 cells combined from two independent experiments were measured. (Left) Distribution of spindle angles; (right) spindle angle plotted against distance to the bud neck, measured from the proximal spindle pole body. (A) BIM1; mean angle 32°; mean distance to the bud neck 1.0 ± 0.4 μm. (B) bim1Δ; mean angle 43°; mean distance to the bud neck 2.1 ± 1.2 μm.
Figure 10.


Functional opposition between bim1Δ and kar3Δ. (A) bim1Δ suppresses the temperature-sensitive growth defect of kar3Δ cells. Serial fivefold dilutions of the indicated strains were grown at 24°C and 37°C for 2 d. (B) bim1Δ kar3Δ cells have cytoplasmic microtubules of intermediate length during G1. Indirect antitubulin immunofluorescence was performed on strains arrested with α-factor. (C) kar3Δ suppresses the spindle orientation defect of bim1Δ cells. Spindle orientation angle relative to the mother-bud axis was calculated in 200 cells from each strain, using indirect antitubulin immunofluorescence.
While spindle position in the bim1Δ mutant was abnormal, relatively few bim1Δ cells went on to execute an abnormal anaphase and produce binucleate mother cells. By DAPI staining, 4% of budded binucleate BIM1 cells retained both nuclei in the mother cell, whereas in the bim1Δ cells 5% of budded binucleate cells retained both nuclei in the mother (n = 700, data not shown). Why are the consequences of abnormal spindle position so mild in the bim1Δ background? In bim1Δ cells with misoriented anaphase spindles, we observed a consistent pattern of spindle correction (n = 5). Fig. 9 shows a time-lapse series of one such cell, in which a cytoplasmic microtubule enters the bud neck, contacts the lateral cortex of the bud, and appears to pull the elongated spindle through the neck. During the initial part of this correction process, sliding appears to occur without depolymerization. Cytoplasmic dynein and Kip3p are candidate motors for producing this sliding force (5, 14), and, consistent with this idea, deletions of both of these proteins produce synthetic lethality with bim1Δ (data not shown).
Figure 9.

Correction of the spindle position defect in a bim1Δ cell. bim1Δ cells expressing GFP-Tub1p were photographed by time-lapse microscopy. The images are shown from a representative cell with a misoriented anaphase spindle that was rapidly repositioned. Each image is a two-dimensional composite of a Z-focal plane series of 0.3-μm sections; the interval between images is 16 s. Bar, 1 μm.
Spindle Elongation Kinetics Are Mildly Reduced in bim1Δ
Once properly positioned, the yeast spindle elongates through the bud neck. Elongation of the spindle reflects concerted changes in kinetochore, pole to pole, and interdigitating microtubules that undergo simultaneous polymerization, depolymerization, and sliding within the nucleus, as well as pulling forces on the nucleus generated by cytoplasmic microtubules. It follows a biphasic pattern consisting of an initial rapid elongation phase followed by a period of slower continued elongation (24, 48, 59). The initial phase of spindle elongation was mildly reduced in bim1Δ cells, at 0.41 μm/min, compared to 0.59 μm/min in BIM1 cells (P = 0.07, n = 7), while the slow phases were equivalent at 0.18 μm/min in bim1Δ cells and 0.22 μm/min in BIM1 cells. This small decrease in the initial, rapid phase of spindle elongation in bim1Δ cells suggests a subtle effect of Bim1p on some microtubule populations later in the cell cycle, and it could be due to an effect on either nuclear (pushing) or cytoplasmic (pulling) microtubules.
Bim1p and Kar3p Have Opposing Effects on Microtubules
The effect of Bim1p loss on G1 microtubule dynamics— slowing of the shrinkage rate, reduction in the frequencies of catastrophe and rescue transitions, and increase in the pause time—produced shorter microtubules. We hypothesized that BIM1 deletion might produce a net opposing effect to mutations that increase microtubule length, such as deletion of KAR3. Kar3p protein levels were unchanged by BIM1 deletion (data not shown). We investigated the synthetic phenotype of a bim1Δkar3Δ double mutant and found that deletion of BIM1 suppressed the temperature-sensitive growth defect of the kar3Δ mutant (Fig. 10 A). This suppression correlated with an intermediate microtubule length during G1, the time when these mutations produce the most dramatic effects. Fig. 10 B shows the microtubule morphology in representative fields of single and double mutant cells arrested in G1 with α-factor, by indirect antitubulin immunofluorescence. kar3Δ mutant cells expressing GFP-Tub1p grew poorly relative to kar3Δ cells, so this analysis was not performed in living cells.
As discussed above, bim1Δ mutant cells are defective in positioning the mitotic spindle. Examination of spindle position in single and double mutant cells by indirect antitubulin immunofluorescence revealed correction of the bim1Δ spindle position defect by simultaneous deletion of KAR3 (Fig. 9 C). While the Bim1p and Kar3p mechanisms and sites of action (discussed below) may differ, these results demonstrate that the loss of opposing activities can produce normal appearing microtubule structures which correlate with suppression of defects in cell growth and spindle position. This cross-suppression between bim1Δ and kar3Δ did not extend to the microtubule-based process of karyogamy (data not shown). It was relatively specific to bim1Δ and kar3Δ, as other mutations which shortened microtubules, such as deletion of BIK1 (3), could not rescue KAR3 deletion, and other mutations which lengthened microtubules, such as deletion of DYN1 or KIP3, could not suppress the bim1Δ phenotypes.
To better understand the mechanism of the bim1Δkar3Δ interaction, we measured microtubule dynamics in the bim1Δkar3Δ double mutant expressing GFP-Tub1p, as done above for the bim1Δ single mutant. Strikingly, microtubule dynamics in the bim1Δkar3Δ double mutant during G1 were like those in the bim1Δ single mutant. During G1, the microtubule shrinkage rate was 2.1 μm/min, the rescue and catastrophe frequencies were 0.004/s and 0.003/s, dynamicity was 17 dimers/s, and the percentage time pausing was 17% (Tables II and III). During preanaphase and anaphase, the parameters were similar to those of the wild-type strain, also as observed with the bim1Δ single mutant. These measurements suggest that simultaneous deletion of KAR3 is able to functionally suppress the effects of bim1Δ on microtubule length and spindle orientation without suppressing the effects on microtubule dynamics directly.
Discussion
Microtubule Dynamics in Living Cells
Previous descriptions of microtubules in living wild-type yeast cells were discrepant in their conclusions regarding cell cycle changes in microtubule dynamics. Carminati and Stearns noted cell cycle-specific changes in microtubule dynamics, whereas Shaw et al. found rates to be similar in G1 and mitosis (5, 44). Our findings that microtubules were at their most dynamic during G1, and that shrinkage rates were uniformly faster than growth rates, support the attractive hypothesis of Carminati and Stearns that increases in cytoplasmic microtubule dynamics before mitosis facilitate spindle positioning (5). Microtubules underwent frequent, rapid pivoting and swiveling motions about the spindle pole bodies, although its quantitation was beyond the scope of this study. These pivoting motions are likely to contribute substantially to the mechanism of microtubule-based searching for cortical attachment sites.
Unlike the previously reported values for microtubule dynamics rates in vivo (5, 44), rates of growth and shrinkage in our study were on the order of three- to fourfold faster. There are both technical and biological explanations which may account for the differences in rates between studies. The technical advance in our system was the determination of microtubule lengths which took into account their projection as well as their path through serial Z-focal plane sections. As noted by Shaw et al., measuring the two-dimensional projection alone results in an underestimate of rates (44). Other explanations for the differences in dynamics rates include strain background, cell ploidy (haploid or diploid), GFP construct (Dyn1p-GFP, GFP-Tub3p, or GFP-Tub1p), and sugar source (glucose or galactose). Elucidation of the relative importance of these biological differences may explain important aspects of microtubule dynamics regulation. As an example, in haploid cells which undergo the axial budding pattern, the spindle is transported to the opposite side of the cell following cell division (7), and this movement may be achieved, in part, by greater microtubule dynamic instability in haploid cells than in diploid cells.
Bim1p Regulates Microtubule Dynamics in a Cell Cycle–specific Manner
The bim1Δ mutation caused cytoplasmic microtubules to be shorter and less dynamic during G1, without affecting the total concentrations of α- and β-tubulin in the cell. BIM1 deletion dramatically decreased microtubule dynamicity, through a decrease in the shrinkage rate, decreases in both the catastrophe and rescue frequencies, and a redistribution of time from growing to pausing, and these effects were primarily observed during G1. From the bim1Δ phenotype, we infer that Bim1p belongs to the emerging class of microtubule-binding proteins which promote dynamic instability.
The bim1Δ mutation dramatically increased the time microtubules spent in the paused state. The appearance of pausing could result either from treadmilling, from the interruption of dynamic instability, or from microexcursions too rapid or too small for detection. Pausing was an integral part of the lifetimes of microtubules in BIM1 cells, and it was greatly accentuated in the bim1Δ mutant, in the same cell cycle pattern as other changes, suggesting that Bim1p increases dynamic instability by interrupting these periods of pausing.
Microtubule pausing has been observed under a variety of conditions. In vitro, yeast microtubules spent 51% of the time in the paused or attenuated state (11). In quiescent Swiss 3T3 cells, microtubules at the leading edges spent significantly more time pausing than in cells stimulated with serum (10). Chemotherapeutic drugs such as Taxol, Estramustine, and Vinblastine have been shown to suppress microtubule dynamics in vitro (12, 38, 56); treatment of living cells with Vinblastine significantly increased the duration of pauses and the total pause time (15). These results suggest that the effects of some antimitotic agents might be due to the disruption of interactions between microtubules and associated regulatory proteins. Based on the severe reduction of dynamicity in the bim1Δ mutant, members of the EB1 family are possible candidates for proteins displaced by antimitotic drugs. The finding that Taxol inhibits the in vivo association of EB1 and microtubules (34) is consistent with such a mechanism.
Mechanistically, there are several ways in which Bim1p could increase the dynamic behavior of microtubules. Growing and shrinking microtubules have been found to have distinctly different structures at their ends. Because we observed an apparent concentration of Bim1p at microtubule ends, it is appealing to speculate that Bim1p may lower the energetic barrier between growing and shrinking structures at the microtubule growing end. One mechanism by which binding of Bim1p could increase the rate of growth would be through alteration of tubulin GTPase activity.
Bim1p has also been identified at the spindle poles by matrix-assisted laser desorption/ionization (MALDI) mass spectrometry (55), consistent with the GFP-Bim1p fluorescence pattern. Bim1p may also affect microtubule minus end dynamics, or it may regulate a protein such as Kar3p, which exerts its effects at the minus ends. By electron microscopy, however, the minus ends of microtubules in the bim1Δ mutant appeared capped, similar to wild-type controls, and simultaneous deletion of KAR3 did not restore wild-type dynamicity to microtubules. Thus, we favor the interpretation that Bim1p acts at the plus ends of microtubules to promote dynamic instability.
A second finding that remains to be fully explained is the cell cycle specificity of Bim1p in regulating cytoplasmic microtubule dynamics. Because the localization and the concentration of epitope-tagged Bim1p varied less than twofold during the cell cycle, Bim1p activity may be regulated by posttranslational mechanisms. Alternatively, constant Bim1p activity may be counteracted by cell cycle–dependent changes in other proteins that affect microtubule dynamics.
Functional Consequences of BIM1 Deletion
A likely consequence of the reduced dynamicity of microtubules in the bim1Δ mutant is a decrease in the opportunity of cytoplasmic microtubules to contact and search the cell cortex. These interactions may be important for nuclear positioning relative both to the bud neck in mitosis and to the projection tip and partner nucleus during mating and karyogamy (nuclear congression). Consistent with this idea, we observed a severe spindle position defect in the bim1Δ mutant, and, as has been described (43), a dramatic bilateral karyogamy defect in bim1Δ × bim1Δ crosses (Fig. 8 and data not shown). In multicellular organisms, members of the BIM1/EB1 family may perform similar roles, positioning the nucleus or MTOC in polarized cells.
A recent study proposed a novel checkpoint in yeast which delays the completion of cytokinesis until the mitotic spindle is correctly positioned (35). Bim1p was postulated to play a major role in this checkpoint, because deletion of BIM1 completely abolished the cell cycle delay which occurred in response to a defect in spindle position (generated by inactivation of the dynactin component Act5p). These findings raised the question of whether Bim1p has a role in the checkpoint mechanism independent of its function in regulating microtubule dynamics. We favor the interpretation that, by increasing microtubule dynamics, Bim1p promotes microtubule-cortex interactions that help to sense, or are sensed by, the cytokinesis checkpoint machinery.
Our findings highlight an interesting paradox in the yeast spindle positioning process. We note that cells lacking Bim1p have a spindle orientation defect, similar to the type of defect that Bim1p is proposed to detect. However, spindle mispositioning in bim1Δ cells is efficiently corrected and does not lead to the accumulation of multinucleate or binucleate unbudded cells. In other words, the spindle position defect of bim1Δ cells does not require the Bim1p-dependent delay for its correction. Although the mechanism for this error correction is unknown, a likely candidate for pulling the spindle rapidly through the bud neck is the dynein/dynactin complex. The bim1Δ spindle position defect may be rapidly corrected by dynein motor activity, while the spindle position defect in dynactin mutants may elicit an alternate, less efficient pathway of spindle repositioning.
Bim1p Functionally Opposes Kar3p
Kar3p is a kinesin motor protein that promotes minus end microtubule depolymerization in vitro and localizes to the poles in vivo during vegetative growth (16, 32, 41). We found that the bim1Δ mutation suppressed the inability of kar3Δ mutant cells to grow at 37°C, and that the double mutant cells had improved spindle position relative to the bim1Δ single mutant. This cross-suppression between bim1Δ and kar3Δ may be due to a net effect on cytoplasmic microtubule length, because bim1Δkar3Δ cells arrested in α-factor had microtubule lengths similar to BIM1KAR3 cells and of intermediate length compared to each single mutant. Overall, the interaction between bim1Δ and kar3Δ is reminiscent of the interaction of kar3Δ with tub3Δ (the minor α-tubulin), and the suppression of the kar3Δ vegetative phenotypes by the microtubule destabilizing drug Benomyl. Additionally, the parameters of microtubule dynamicity were similar to those of the bim1Δ single mutant: slower shrinkage rate, greater pause time, and fewer transitions during G1 than wild-type controls. Dynamicity during G1 was 17 dimers/s in the bim1Δkar3Δ double mutant (similar to 12 dimers/s in the bim1Δ single mutant, compared to 44 dimers/s in wild-type cells). Presumably, Bim1p and Kar3p regulate microtubule length independently of each other.
Bim1p Is a Conserved Microtubule-binding Protein
BIM1 is the sole budding yeast member of the family of EB1-related genes. Like human EB1 proteins (4, 23, 34), Bim1p localizes to spindle microtubules and cytoplasmic microtubule ends throughout the cell cycle. It will be interesting to see whether EB1 family members will promote microtubule dynamics in higher cells, and whether the G1 specific effect of Bim1p, presumably important for nuclear positioning, is retained among other EB1-related proteins. Human EB1 was identified as a binding partner of APC in cells derived from the polarized colonic epithelium (49), and human RP1 mRNA was found to be upregulated during T cell activation, a process during which the T cell becomes polarized (39). One could imagine that similar to increases in spindle microtubule dynamics which facilitate capture of the kinetochores during mitosis, changes in cell polarity may require increases in cytoplasmic microtubule dynamics to facilitate movements of the nucleus or MTOC during interphase. EB1 family members may mediate increases in microtubule dynamics during processes which require regulated cell polarization.
Acknowledgments
The authors wish to thank Janet Carminati, Aaron Straight, and Tim Stearns for advice on time-lapse imaging, Scott Schuyler for valuable discussions, and Ken Salisbury and Scott Randall of Improvision for assistance with the imaging system and software support. We also thank Mary Morphew of the Boulder 3D Lab for freezing and specimen preparation and Mark Winey and Richard McIntosh for valuable comments. Strains and reagents were kindly provided by Aaron Straight and Andrew Murray, Jason Kahana and Pam Silver, Bee-Na Lee and Elaine Elion, Rong Li, and Frank Solomon. For comments on the manuscript we thank Scott Schuyler, Aaron Straight, David Roof, and Tim Mitchison.
This work was supported by grants from the National Institutes of Health (KO8 DK02578 to J.S. Tirnauer and GM55772 to D. Pellman) and a Kimmel Scholar Award to D. Pellman. E. O'Toole is a member of the Boulder Laboratory for 3D Fine Structure, that is supported by a grant from the National Institutes of Health (RR00592, J.R. McIntosh, P.I.).
Abbreviations used in this paper
- APC
adenomatous polyposis coli
- GFP
green fluorescent protein
- MAP
microtubule-associated protein
- MTOC
microtubule organizing center
Footnotes
The current address of L. Berrueta is Instituto de Immunologia, University of the Andes, PO Box 566, Merida_Edo, Merida 5101, Venezuela. The current address of B.E. Bierer is National Heart, Lung, and Blood Institute, Bldg. 10, Room 5D49, 10 Center Drive, Bethesda, MD 20892.
References
- 1.Beinhauer JD, Hagan IM, Hegemann JH, Fleig U. Mal3, the fission yeast homolog of the human APC-interacting protein EB-1, is required for microtubule integrity and the maintenance of cell form. J Cell Biol. 1997;139:717–728. doi: 10.1083/jcb.139.3.717. [DOI] [PMC free article] [PubMed] [Google Scholar]
- 2.Belmont LD, Mitchison TJ. Identification of a protein that interacts with tubulin dimers and increases the catastrophe rate of microtubules. Cell. 1996;84:623–631. doi: 10.1016/s0092-8674(00)81037-5. [DOI] [PubMed] [Google Scholar]
- 3.Berlin V, Styles CA, Fink GR. BIK1, a protein required for microtubule function during mating and mitosis in Saccharomyces cerevisiae, colocalizes with tubulin. J Cell Biol. 1990;111:2573–2586. doi: 10.1083/jcb.111.6.2573. [DOI] [PMC free article] [PubMed] [Google Scholar]
- 4.Berrueta L, Kraeft S-K, Tirnauer JS, Schuyler S, Chen LB, Hill DE, Pellman D, Bierer B. The adenomatous polyposis coli-binding protein EB1 is associated with cytoplasmic and spindle microtubules. Proc Natl Acad Sci USA. 1998;95:10596–10601. doi: 10.1073/pnas.95.18.10596. [DOI] [PMC free article] [PubMed] [Google Scholar]
- 5.Carminati JL, Stearns T. Microtubules orient the mitotic spindle in yeast through dynein-dependent interactions with the cell cortex. J Cell Biol. 1997;138:629–641. doi: 10.1083/jcb.138.3.629. [DOI] [PMC free article] [PubMed] [Google Scholar]
- 6.Cassimeris L. Accessory protein regulation of microtubule dynamics throughout the cell cycle. Curr Opin Cell Biol. 1999;11:134–141. doi: 10.1016/s0955-0674(99)80017-9. [DOI] [PubMed] [Google Scholar]
- 7.Chant J, Pringle JR. Patterns of bud-site selection in the yeast Saccharomyces cerevisiae. . J Cell Biol. 1995;129:751–765. doi: 10.1083/jcb.129.3.751. [DOI] [PMC free article] [PubMed] [Google Scholar]
- 8.Cho RJ, Campbell MJ, Winzeler EA, Steinmetz L, Conway A, Wodicka L, Wolfsberg TG, Gabrielian AE, Landsman D, Lockhart DJ, Davis RW. A genome-wide transcriptional analysis of the mitotic cell cycle. Mol Cell. 1998;2:65–73. doi: 10.1016/s1097-2765(00)80114-8. [DOI] [PubMed] [Google Scholar]
- 9.Cormack BP, Bertram G, Egerton M, Gow NA, Falkow S, Brown AJ. Yeast-enhanced green fluorescent protein (yEGFP): a reporter of gene expression in Candida albicans. . Microbiology. 1997;143:303–311. doi: 10.1099/00221287-143-2-303. [DOI] [PubMed] [Google Scholar]
- 10.Danowski BA. Microtubule dynamics in serum-starved and serum-stimulated Swiss 3T3 mouse fibroblasts: implications for the relationship between serum-induced contractility and microtubules. Cell Motil Cytoskelet. 1998;40:1–12. doi: 10.1002/(SICI)1097-0169(1998)40:1<1::AID-CM1>3.0.CO;2-K. [DOI] [PubMed] [Google Scholar]
- 11.Davis A, Sage CR, Wilson L, Farrell K. Purification and biochemical characterization of tubulin from the budding yeast Saccharomyces cerevisiae. . Biochemistry. 1993;32:8823–8835. doi: 10.1021/bi00085a013. [DOI] [PubMed] [Google Scholar]
- 12.Derry WB, Wilson L, Jordan MA. Substoichiometric binding of taxol suppresses microtubule dynamics. Biochemistry. 1995;34:2203–2211. doi: 10.1021/bi00007a014. [DOI] [PubMed] [Google Scholar]
- 13.Desai A, Mitchison TJ. Microtubule polymerization dynamics. Annu Rev Cell Dev Biol. 1997;13:83–117. doi: 10.1146/annurev.cellbio.13.1.83. [DOI] [PubMed] [Google Scholar]
- 14.DeZwaan T, Ellingson E, Pellman D, Roof DM. Kinesin-related KIP3 of Saccharomyces cerevisiaeis required for a distinct step in nuclear migration. J Cell Biol. 1997;138:1023–1040. doi: 10.1083/jcb.138.5.1023. [DOI] [PMC free article] [PubMed] [Google Scholar]
- 15.Dhamodharan R, Jordan MA, Thrower D, Wilson L, Wadsworth P. Vinblastine suppresses dynamics of individual microtubules in living interphase cells. Mol Biol Cell. 1995;6:1215–1229. doi: 10.1091/mbc.6.9.1215. [DOI] [PMC free article] [PubMed] [Google Scholar]
- 16.Endow SA, Kang SJ, Satterwhite LL, Rose MD, Skeen VP, Salmon ED. Yeast Kar3 is a minus-end microtubule motor protein that destabilizes microtubules preferentially at the minus ends. EMBO (Eur Mol Biol Organ) J. 1994;13:2708–2713. doi: 10.1002/j.1460-2075.1994.tb06561.x. [DOI] [PMC free article] [PubMed] [Google Scholar]
- 17.Farrell KW, Jordan MA, Miller HP, Wilson L. Phase dynamics at microtubule ends: the coexistence of microtubule length changes and treadmilling. J Cell Biol. 1987;104:1035–1046. doi: 10.1083/jcb.104.4.1035. [DOI] [PMC free article] [PubMed] [Google Scholar]
- 18.Gard DL, Kirschner MW. A microtubule-associated protein from Xenopuseggs that specifically promotes assembly at the plus-end. J Cell Biol. 1987;105:2203–2215. doi: 10.1083/jcb.105.5.2203. [DOI] [PMC free article] [PubMed] [Google Scholar]
- 19.Hamill DR, Howell B, Cassimeris L, Suprenant KA. Purification of a WD repeat protein, EMAP, that promotes microtubule dynamics through an inhibition of rescue. J Biol Chem. 1998;273:9285–9291. doi: 10.1074/jbc.273.15.9285. [DOI] [PubMed] [Google Scholar]
- 20.Hotoni H, Horio T. Dynamics of microtubules visualized by darkfield microscopy: treadmilling and dynamic instability. Cell Motil Cytoskelet. 1988;10:229–236. doi: 10.1002/cm.970100127. [DOI] [PubMed] [Google Scholar]
- 21.Huffaker TC, Thomas JH, Botstein D. Diverse effects of β-tubulin mutations on microtubule formation and function. J Cell Biol. 1988;106:1997–2010. doi: 10.1083/jcb.106.6.1997. [DOI] [PMC free article] [PubMed] [Google Scholar]
- 22.Jordan MA, Wilson L. Microtubules and actin filaments: dynamic targets for cancer chemotherapy. Curr Opin Cell Biol. 1998;10:123–130. doi: 10.1016/s0955-0674(98)80095-1. [DOI] [PubMed] [Google Scholar]
- 23.Juwana JP, Henderikx P, Mischo A, Wadle A, Fadle N, Gerlach K, Arends JW, Hoogenboom H, Pfreundschuh M, Renner C. EB/RP gene family encodes tubulin binding proteins. Int J Cancer. 1999;81:275–284. doi: 10.1002/(sici)1097-0215(19990412)81:2<275::aid-ijc18>3.0.co;2-z. [DOI] [PubMed] [Google Scholar]
- 24.Kahana JA, Schnapp BJ, Silver PA. Kinetics of spindle pole body separation in budding yeast. Proc Natl Acad Sci USA. 1995;92:9707–9711. doi: 10.1073/pnas.92.21.9707. [DOI] [PMC free article] [PubMed] [Google Scholar]
- 25.Kormanec J, Schaaff-Gerstenschlager I, Zimmerman FK, Perecko D, Kuntzel H. Nuclear migration in Saccharomyces cerevisiaeis controlled by the highly repetitive 313 kDa NUM1 protein. Mol Gen Genet. 1991;230:277–287. doi: 10.1007/BF00290678. [DOI] [PubMed] [Google Scholar]
- 26.Kremer JR, Mastronarde DN, McIntosh JR. Computer visualization of three-dimensional image data using IMOD. J Struct Biol. 1996;116:71–76. doi: 10.1006/jsbi.1996.0013. [DOI] [PubMed] [Google Scholar]
- 27.Lee L, Klee SK, Evangelista M, Boone C, Pellman D. Control of mitotic spindle position by the Saccharomyces cerevisiaeformin Bni1p. J Cell Biol. 1999;144:947–961. doi: 10.1083/jcb.144.5.947. [DOI] [PMC free article] [PubMed] [Google Scholar]
- 28.Maddox P, Chin E, Mallavarapu A, Yeh E, Salmon ED, Bloom K. Microtubule dynamics from mating through the first zygotic division in the budding yeast Saccharomyces cerevisiae. . J Cell Biol. 1999;144:977–987. doi: 10.1083/jcb.144.5.977. [DOI] [PMC free article] [PubMed] [Google Scholar]
- 29.Margolis RL, Wilson L. Microtubule treadmills—possible molecular machinery. Nature. 1981;293:705–711. doi: 10.1038/293705a0. [DOI] [PubMed] [Google Scholar]
- 30.Marklund U, Larsson N, Gradin HM, Brattsand G, Gullberg M. Oncoprotein 18 is a phosphorylation-responsive regulator of microtubule dynamics. EMBO (Eur Mol Biol Organ) J. 1996;15:5290–5298. [PMC free article] [PubMed] [Google Scholar]
- 31.McNally FJ. Modulation of microtubule dynamics during the cell cycle. Curr Opin Cell Biol. 1996;8:23–29. doi: 10.1016/s0955-0674(96)80044-5. [DOI] [PubMed] [Google Scholar]
- 32.Meluh PB, Rose MD. KAR3, a kinesin-related gene required for yeast nuclear fusion. Cell. 1990;60:1029–1041. doi: 10.1016/0092-8674(90)90351-e. [DOI] [PubMed] [Google Scholar]
- 33.Miller RK, Rose MD. Kar9p is a novel cortical protein required for cytoplasmic microtubule orientation in yeast. J Cell Biol. 1998;140:377–390. doi: 10.1083/jcb.140.2.377. [DOI] [PMC free article] [PubMed] [Google Scholar]
- 34.Morrison EE, Wardleworth BN, Askham JM, Markham AF, Meredith DM. EB1, A protein which interacts with the APC tumour suppressor, is associated with the microtubule cytoskeleton throughout the cell cycle. Oncogene. 1998;17:3471–3477. doi: 10.1038/sj.onc.1202247. [DOI] [PubMed] [Google Scholar]
- 35.Muhua L, Adames NR, Murphy MD, Shields CR, Cooper JA. A cytokinesis checkpoint requiring the yeast homolog of an APC-binding protein. Nature. 1998;393:487–491. doi: 10.1038/31014. [DOI] [PMC free article] [PubMed] [Google Scholar]
- 36.Muhua L, Karpova TS, Cooper JA. A yeast actin-related protein homologous to that in vertebrate dynactin complex is important for spindle orientation and nuclear migration. Cell. 1994;78:669–679. doi: 10.1016/0092-8674(94)90531-2. [DOI] [PubMed] [Google Scholar]
- 37.Mumberg D, Muller R, Funk M. Regulatable promotors of Saccharomyces cerevisiae: comparison of transcriptional activity and their use for heterologous expression. Nucleic Acids Res. 1994;22:5767–5768. doi: 10.1093/nar/22.25.5767. [DOI] [PMC free article] [PubMed] [Google Scholar]
- 38.Panda D, Miller HP, Islam K, Wilson L. Stabilization of microtubule dynamics by estramustine by binding to a novel site in tubulin: a possible mechanistic basis for its antitumor action. Proc Natl Acad Sci USA. 1997;94:10560–10564. doi: 10.1073/pnas.94.20.10560. [DOI] [PMC free article] [PubMed] [Google Scholar]
- 39.Renner C, Pfitzenmeier JP, Gerlach K, Held G, Ohnesorge S, Sahin U, Bauer S, Pfreundschuh M. RP1, a new member of the adenomatous polyposis coli-binding EB1-like gene family, is differentially expressed in activated T cells. J Immunol. 1997;159:1276–1283. [PubMed] [Google Scholar]
- 40.Rose, M.D., F. Winston, and P. Hieter. 1990. Methods in yeast genetics. Cold Spring Harbor Laboratory Press, Cold Spring Harbor, NY. 198 pp.
- 41.Saunders W, Hornack D, Lengyel V, Deng C. The Saccharomyces cerevisiaekinesin-related motor Kar3p acts at preanaphase spindle poles to limit the number and length of cytoplasmic microtubules. J Cell Biol. 1997;137:417–431. doi: 10.1083/jcb.137.2.417. [DOI] [PMC free article] [PubMed] [Google Scholar]
- 42.Schubart UK, Yu J, Amat JA, Wang Z-Q, Hoffmann MK, Edelmann W. Normal development of mice lacking metablastin (P19), a phosphoprotein implicated in cell cycle regulation. J Biol Chem. 1996;271:14062–14066. doi: 10.1074/jbc.271.24.14062. [DOI] [PubMed] [Google Scholar]
- 43.Schwartz K, Richards K, Botstein D. Bim1 encodes a microtubule-binding protein in yeast. Mol Biol Cell. 1997;8:2677–2691. doi: 10.1091/mbc.8.12.2677. [DOI] [PMC free article] [PubMed] [Google Scholar]
- 44.Shaw SL, Yeh E, Maddox P, Salmon ED, Bloom K. Astral microtubule dynamics in yeast: a microtubule-based searching mechanism for spindle orientation and nuclear migration into the bud. J Cell Biol. 1997;139:985–994. doi: 10.1083/jcb.139.4.985. [DOI] [PMC free article] [PubMed] [Google Scholar]
- 45.Sikorski RS, Hieter P. A system of shuttle vectors and yeast host strains designed for efficient manipulation of DNA in Saccharomyces cerevisiae. . Genetics. 1989;122:19–27. doi: 10.1093/genetics/122.1.19. [DOI] [PMC free article] [PubMed] [Google Scholar]
- 46.Snyder M, Gehrung S, Page BD. Studies concerning the temporal and genetic control of cell polarity in Saccharomyces cerevisiae. . J Cell Biol. 1991;114:515–532. doi: 10.1083/jcb.114.3.515. [DOI] [PMC free article] [PubMed] [Google Scholar]
- 47.Stearns T. Motoring to the finish: kinesin and dynein work together to orient the yeast mitotic spindle. J Cell Biol. 1997;138:957–960. doi: 10.1083/jcb.138.5.957. [DOI] [PMC free article] [PubMed] [Google Scholar]
- 48.Straight AF, Marshall WF, Sedat JW, Murray AW. Mitosis in living budding yeast: anaphase A but no metaphase plate. Science. 1997;277:574–578. doi: 10.1126/science.277.5325.574. [DOI] [PubMed] [Google Scholar]
- 49.Su L-K, Burrell M, Hill DE, Gyuris J, Brent R, Wiltshire R, Trent J, Vogelstein B, Kinzler KW. APC binds to the novel protein EB1. Cancer Res. 1995;55:2972–2977. [PubMed] [Google Scholar]
- 50.Toso RJ, Jordon MA, Farrell KW, Matsumoto B, Wilson L. Kinetic stabilization of microtubule dynamic instability in vitro by Vinblastine. Biochemistry. 1993;32:1285–1293. doi: 10.1021/bi00056a013. [DOI] [PubMed] [Google Scholar]
- 51.Vasquez RJ, Gard DL, Cassimeris L. XMAP from Xenopuseggs promotes rapid plus end assembly of microtubules and rapid microtubule polymer turnover. J Cell Biol. 1994;127:985–993. doi: 10.1083/jcb.127.4.985. [DOI] [PMC free article] [PubMed] [Google Scholar]
- 52.Wach A, Brachat A, Pohlmann R, Philippsen P. New heterologous modules for classical or PCR-based gene disruptions in Saccharomyces cerevisiae. . Yeast. 1994;10:1793–1808. doi: 10.1002/yea.320101310. [DOI] [PubMed] [Google Scholar]
- 53.Walczak CE, Mitchison TJ, Desai A. XKCM1: A Xenopuskinesin-related protein that regulates microtubule dynamics during mitotic spindle assembly. Cell. 1996;84:37–47. doi: 10.1016/s0092-8674(00)80991-5. [DOI] [PubMed] [Google Scholar]
- 54.Weinstein B, Solomon F. Phenotypic consequences of tubulin overproduction in Saccharomyces cerevisiae:differences between alpha-tubulin and beta-tubulin. Mol Cell Biol. 1990;10:5295–5304. doi: 10.1128/mcb.10.10.5295. [DOI] [PMC free article] [PubMed] [Google Scholar]
- 55.Wigge PA, Jensen ON, Homes S, Soues S, Mann M, Kilmartin JV. Analysis of the Saccharomycesspindle pole by matrix-assisted laser desorption/ionization (MALDI) mass spectrometry. J Cell Biol. 1998;141:967–977. doi: 10.1083/jcb.141.4.967. [DOI] [PMC free article] [PubMed] [Google Scholar]
- 56.Wilson L, Miller HP, Farrell KW, Snyder KB, Thompson WC, Purich DL. Taxol stabilization of microtubules in vitro: dynamics of tubulin addition and loss at opposite microtubule ends. Biochemistry. 1985;24:5254–5262. doi: 10.1021/bi00340a045. [DOI] [PubMed] [Google Scholar]
- 57.Winey M, Mamay CL, O'Toole ET, Mastronarde DN, Giddings TH, McDonald KL, McIntosh JR. Three-dimensional ultrastructural analysis of the Saccharomyces cerevisiaemitotic spindle. J Cell Biol. 1995;129:1601–1615. doi: 10.1083/jcb.129.6.1601. [DOI] [PMC free article] [PubMed] [Google Scholar]
- 58.Yaffe MP, Schatz G. Two nuclear mutations that block mitochondrial protein import in yeast. Proc Natl Acad Sci USA. 1984;81:4819–4823. doi: 10.1073/pnas.81.15.4819. [DOI] [PMC free article] [PubMed] [Google Scholar]
- 59.Yeh E, Skibbens RV, Cheng JW, Salmon ED, Bloom K. Spindle dynamics and cell cycle regulation of dynein in the budding yeast, Saccharomyces cerevisiae. . J Cell Biol. 1995;130:687–700. doi: 10.1083/jcb.130.3.687. [DOI] [PMC free article] [PubMed] [Google Scholar]