

Abstract
In neuronal growth cones, cycles of filopodial protrusion and retraction are important in growth cone translocation and steering. Alteration in intracellular calcium ion concentration has been shown by several indirect methods to be critically involved in the regulation of filopodial activity. Here, we investigate whether direct elevation of [Ca2+]i, which is restricted in time and space and is isolated from earlier steps in intracellular signaling pathways, can initiate filopodial protrusion. We raised [Ca2+]i level transiently in small areas of nascent axons near growth cones in situ by localized photolysis of caged Ca2+ compounds. After photolysis, [Ca2+]i increased from ∼60 nM to ∼1 μM within the illuminated zone, and then returned to resting level in ∼10–15 s. New filopodia arose in this area within 1–5 min, and persisted for ∼15 min. Elevation of calcium concentration within a single filopodium induced new branch filopodia. In neurons coinjected with rhodamine-phalloidin, F-actin was observed in dynamic cortical patches along nascent axons; after photolysis, new filopodia often emerged from these patches. These results indicate that local transient [Ca2+]i elevation is sufficient to induce new filopodia from nascent axons or from existing filopodia.
Keywords: calcium, photolysis, filopodia, growth cone, actin
Intracellular calcium ion concentration has proven to be a key second messenger in neuronal outgrowth (Mattson and Kater, 1987; Lankford and Letourneau, 1989; Rehder and Kater, 1992; Harper et al., 1994; Ghosh and Greenberg, 1995). Process extension initiated by various outgrowth-promoting substrates is dependent on calcium influx (Williams et al., 1992; Kuhn et al., 1998), which can activate calcium-dependent enzymes (Janmey, 1994; Jian et al., 1994; Chang et al., 1995; VanBerkum and Goodman, 1995; Bashour et al., 1997) and small GTPases involved in assembly of F-actin (Brill at al., 1996; Luo et al., 1996; Joyal et al., 1997; Tapon and Hall, 1997). Steering of the growth cone also may be dependent upon gradients resulting from local, transient elevation of calcium concentration (Bedlack et al., 1992; Davenport and Kater, 1992; Davenport et al., 1996; Zheng et al., 1996a,b). In contrast, calcium elevation within the growth cone can lead to disruption of F-actin filaments and microtubules (Lankford and Letourneau, 1989; Neely and Gesemann, 1994) and growth cone collapse (Bandtlow et al., 1993; Löschinger et al., 1997). During axonogenesis, neurons can express spontaneous calcium spikes that mediate reductions in the rate of outgrowth (Gomez et al., 1995; Gu and Spitzer, 1995). Blocking such transients with photo-releasable calcium chelator (diazo-2) can increase the rate of growth cone migration, whereas release of caged calcium can reduce the rate (Gomez and Spitzer, 1999).
Protrusion of filopodia is a key feature of growth cone motility, and often has been monitored to analyze calcium signaling in neuron outgrowth. Protrusive activity was reduced by elevation of calcium throughout the growth cone with serotonin (Mattson and Kater, 1987), calcium ionophore (Mattson and Kater, 1987; Rehder and Kater, 1992), or depolarization with extracellular [K+] (Rehder and Kater, 1992; Rehder and Cheng, 1998). Protrusive activity was increased by elevation of calcium throughout the growth cone with a large-scale electric field (McCaig, 1986), or by a local electric field (Patel and Poo, 1984; Bedlack et al., 1992; Davenport and Kater, 1992; Manivannan and Terakawa, 1994) or a local [K+] depolarization (Manivannan and Terakawa, 1994). These different outcomes may be due to the exact level of calcium elevation (Mattson and Kater, 1987), to local versus global depolarization of the growth cone (Davenport and Kater, 1992), or, even though these responses are calcium dependent, to collateral activation of other signaling pathways induced by different indirect methods of calcium elevation. Here, our first goal was to test the effect of local elevation of calcium ion concentration on protrusion of filopodia by an independent method, local photolysis of caged calcium; this direct method isolates the effect of calcium ion elevation from other up-stream signaling elements that may be invoked by indirect methods of calcium elevation.
Individual filopodia act as both sensory and motor appendages of the growth cone and have surprising capabilities. They can reorient the advance of the growth cone (Hammarback and Letourneau, 1986; O'Connor et al., 1990; Myers and Bastiani, 1993), or mediate growth cone collapse (Kapfhammer and Raper, 1987). Surgical isolation experiments have shown that filopodia contain the signal transduction mechanisms that can generate a second messenger (calcium elevation) response (Davenport et al., 1993, 1996). Our second goal was to further examine the response capabilities of filopodia by determining whether local elevation of calcium within a single filopodium can initiate a local motor (protrusion) response. Finally, using photolysis-triggered filopodial protrusion, we wished to examine the relationship between the de novo generation of filopodia and the preexisting disposition of cortical F-actin.
Materials and Methods
Culture of CNS Neurons
Grasshopper (Schistocerca americana) eggs at the 50% stage (Bentley et al., 1979) were sterilized and dissected in grasshopper saline. Thoracic and abdominal ganglia from ventral nerve cords were transferred to an Eppendorf tube containing an enzyme solution (2 mg/ml collagenase dispase; 0.5% ficin). After a 1-h incubation at 31°C, the ganglia were rinsed three times in L-15 medium (GIBCO-BRL), and then triturated ∼30 times with a BSA-coated Gel saver II pipette tip (USA/Scientific Plastics). The dissociated cells were placed on a dish with a glass coverslip bottom coated with poly-l-lysine (1 mg/ml for 24 h; Sigma Chemical Co.) and goat anti–horseradish peroxidase antibody (1:50 dilution, incubated for 2 h at 31°C immediately before use; Jackson ImmunoResearch). Cells were allowed to adhere to the coverslip for 10 min, and then were transferred to an incubator (31°C) for 15–20 h before use.
Limb Fillet Preparation of Afferent Neurons In Situ
Eggs at the 32–33% stage were sterilized and dissected in grasshopper saline, and the embryos were transferred to a dish with a poly-l-lysine (5 mg/ml) coated glass coverslip bottom. Limb buds were placed ventral side down, opened with a glass needle, and spread flat on the coverslip (O'Connor et al., 1990). Mesodermal cells were removed with a suction pipette, exposing the Ti1 pioneer afferent neurons. Fillets were maintained in supplemented RPMI culture medium (O'Connor et al., 1990) at 32°C in a heated stage chamber (Medical Instruments) on a Nikon inverted microscope during the experiments.
[Ca2+]i Measurement
Calcium was elevated by photolysis of caged calcium compounds (DM-nitrophen from Cal-Biochem; nitrophenyl [NP]1-EGTA from Molecular Probes; Nitr-5 from Cal-Biochem). It was not possible to measure calcium levels with Fura-based ratio-imaging in these experiments, because the excitation wavelengths for Fura compounds overlap extensively with the caged calcium compound photolysis wavelengths. Consequently, resting calcium levels, and levels after photolysis, were measured by fluorescence of Calcium-Green-1 (CG-1; Molecular Probes). Initially, the relationship between CG-1 fluorescence and calcium ion concentration in the presence of caged calcium was examined.
In Vitro Calibration of CG-1 Fluorescence versus Calcium Ion Concentration.
In vitro calibration of the Ca2+-sensitive dye CG-1 fluorescence was carried out under conditions matching, as much as possible, the subsequent photolysis experiments on cultured neurons (see below). Five solutions with different Ca2+ concentrations (Ca2+-free, three intermediate Ca2+ levels, and saturated Ca2+) were prepared by mixing different amounts of Ca-EGTA and K2-EGTA, each with a total EGTA concentration of 20 mM. These solutions all contained 1.2 mM NP-EGTA and 0.06 mM CG-1 and all were adjusted to pH 7.2 and ionic strength 175 mM by addition of K-MOPS and K-gluconate. Free [Ca2+] in each solution was calculated using a K d for EGTA adjusted for an ionic strength of 175 mM, obtained by linear interpolation of the hydrogen- and calcium-binding constants of EGTA at 100 and 250 mM, and calculating the resultant K d at pH 7.2 using the equations of Tsien and Pozzan (1989). Free [Ca2+] was calculated from numerical solution of the equilibrium buffer equations for a mixture of 20 mM EGTA, 1.2 mM NP-EGTA, and 0.06 mM CG-1, using K ds of 179, 90, and 190 nM, respectively. These calculations were checked by measuring [Ca2+] in solutions without NP-EGTA and CG-1, using Ca2+-selective electrodes (Microelectrodes Inc.), and confirming that the measured [Ca2+] levels were close to those calculated for such solutions. The volumes of our final calibration solutions were not large enough to permit the use of Ca2+-sensitive electrodes.
For calibration measurements, solutions were placed in 20-μm path-length microcuvettes (Vitro Dynamics). CG-1 fluorescence was converted to Ca2+ concentration using the following equation:
 |
1 |
where K d is the dissociation constant for CG-1, and F max is the fluorescence level for saturating Ca2+ and F min for zero Ca2+. K d and ratio of F max/F min were obtained from the calibration curve (Fig. 1 a).
Figure 1.
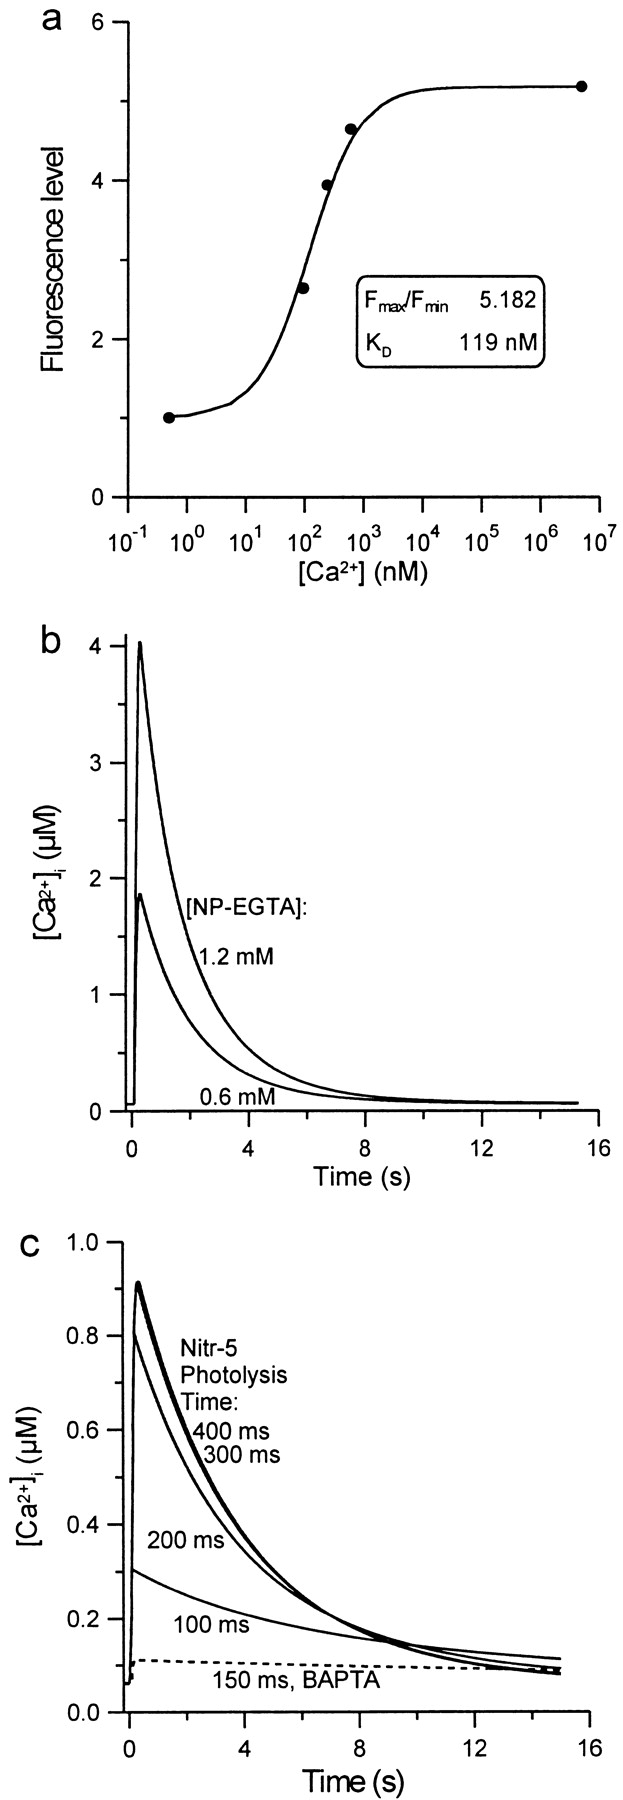
(a) Calibration of CG-1 at pH (7.2) and ionic strength (175 mM) appropriate for grasshopper Ringer and in the presence of 1.2 mM NP-EGTA. Fluorescence intensities are normalized to F min. (b) Computed effect of 200-ms photolysis on [Ca2+]i in the illuminated region of a cell filled with NP-EGTA, assuming concentrations of 1.2 and 0.6 mM. (c) Computed rise in [Ca2+]i in the illuminated region of a cell filled with 1.25 mM Nitr-5, for photolysis exposures of 100–400 ms. The dashed line represents the computed [Ca2+]i elevation in cells injected with the BAPTA control solution and photolyzed for 150 ms.
We also tried to produce a calibration curve for the CG-1/NP-EGTA mixture after photolysis of NP-EGTA by amounts similar to those in our experiments. To do this, we exposed the microcuvettes to large-field illumination using the same optical arrangements as for photolysis in cells, calculating the amount of NP-EGTA photolysis and the expected effect on the free [Ca2+] in each calibration solution, and measuring the CG-1 fluorescence in each Ca2+-buffer solution. Wide-field illumination was used to minimize the rapid reduction in [Ca2+] that would occur after photolysis due to rapid diffusion of uncaged Ca2+ out of the photolysis spot into the large volume of the cuvette.
Although [Ca2+] should have increased after photolysis, fluorescence dropped in all solutions, apparently due to bleaching of CG-1 by the photolysis illumination. This invalidated our attempt to obtain a CG-1 Ca2+-calibration curve in the presence of partially photolyzed NP-EGTA. In contrast to these observations, in cells filled with NP-EGTA and CG-1, localized photolysis always led to an increase in CG-1 fluorescence. This is probably because, in nerve axons, unbleached CG-1 would quickly replace locally bleached CG-1 by diffusion, whereas Ca2+ itself would diffuse much more slowly because it is bound to nondiffusible native buffers in cytoplasm. Therefore, the local CG-1 fluorescence would quickly recover to the level appropriate for nonbleached CG-1 and Ca2+ released from NP-EGTA photolysis. There was no easy way to replicate this situation of rapid CG-1 diffusion but restricted Ca2+ diffusion in our calibration experiments. However, the effects of NP-EGTA photolysis on the Ca2+ sensitivity of CG-1 are likely to be modest (Neher and Zucker, 1993), so we may use the calibration curve without photolysis to get a reasonable idea of the approximate levels of [Ca2+]i reached in our experiments.
[Ca2+]i Measurements in Cultured CNS Neurons.
To examine [Ca2+]i elevation induced by photolysis, we next loaded cultured embryonic CNS neurons with CG-1 and caged calcium compounds. The cells were first exposed to membrane-permeable NP-EGTA (2 μM), CG-1 (2 μM), and 0.02% Pluronic (Molecular Probes) for 40 min at room temperature. Then, after washing three times, cells were rested for ∼1 h before experiments.
For photolysis, UV light from a 100-W mercury lamp was passed through a 505 dichroic mirror (74100 BS&M; Chroma) and a 60×, NA 1.4 Nikon objective lens, or through a Nikon UV-2A filter block and a Nikon 40×, NA 1.3 objective lens (UV light passage through these combinations was similar). Flash duration, ranging from 100 to 400 ms, was controlled by an electronic shutter (Ludl Electronic Products Ltd.).
After photolysis, Ludl filter wheels were repositioned to place in the light path a ND filter (1–4) to reduce photo damage to cells, and an appropriate excitation filter set (74100 BS&M; Chroma). Fluorescent images were collected by a CCD camera (SenSys; Photometrics), and transferred to imaging software (Metamorph; Universal Imaging). CG-1 fluorescence initially was measured 2–3 s after photolysis, and at 2–3 s or longer intervals thereafter.
The CG-1 concentration loaded into axons of cultured neurons was estimated to be ∼60 μM by comparing the resting fluorescence of filled axons to that of a micropipette shank of similar diameter filled with various test concentrations of CG-1 and with [Ca2+] buffered to ∼100 nM with 20 mM of a Ca-EGTA mixture. Acetoxymethyl ester compounds load into cells at rates highly dependent on their molecular weights, which are 1,147 and 654 D for esterified CG-1 and NP-EGTA, respectively. Cytoplasmic NP-EGTA should accumulate ∼10–20 times faster than CG-1 (Zhao et al., 1997), to a level of ∼1.2 mM.
To estimate how high [Ca2+]i might rise under our experimental conditions, we measured the photolysis efficiency of our illumination spot by opening the field stop iris and exposing a 20-μm path length microcuvette (VitroCom) containing 5 mM DM-nitrophen and 2.5 mM Ca2+ plus 0.1 mM Fluo-3 (Molecular Probes) in 100 mM KCl and 10 mM MOPS, pH 7.2. Exposure duration was varied until a duration was found that just caused a large increase in Fluo-3 fluorescence, measured shortly after photolysis. This provides an estimate of the time needed to photolyze half the DM-nitrophen (Zucker, 1993), which we found to be 80 ms when a 10% neutral density filter was used to attenuate photolysis light intensity. Assuming equal quantum efficiencies for Ca-free and Ca-bound DM-nitrophen (Ellis-Davies et al., 1996), we converted the calculated photolysis rate for DM-nitrophen (87/s without the neutral density filter) to a photolysis rate for NP-EGTA (21.6/s) from their relative quantum efficiencies and ultraviolet absorbances (Kaplan and Ellis-Davies, 1988; Ellis-Davies and Kaplan, 1994).
The effect of a 200-ms exposure to this light on the [Ca2+]i in a cell was simulated computationally by solving differential equations representing competing buffer reactions, NP-EGTA, and a Ca2+ extrusion process (Fig. 1 b). We included 1.2 mM NP-EGTA and 0.06 mM CG-1 plus 3 mM endogenous Ca2+ buffer (buffer ratio 150:1, K d = 20 μM, k on = 2 × 10⁸ M−1s−1) and a first-order calcium removal process with pump rate 10−4 s−1. Total [Ca2+] in the mixture was set to produce a resting [Ca2+]i of 60 nM. Association and dissociation rates for NP-EGTA were 1.91 × 10⁷ M−1s−1 and 1.36 s−1 (from Ellis-Davies et al., 1996; modified for 175 mM ionic strength). CG-1 had a Ca2+ association rate of 6 × 10⁸ M−1s−1 and K d of 119 nM (Fig. 1 a). Fig. 1 b shows the expected elevation in [Ca2+]i in a neuronal process exposed to our Hg lamp through our microscope optics for 200 ms. [Ca2+]i should rise to ∼4 μM at the end of the light pulse, then drop within 3 s to 750 nM, and then gradually back to baseline within 15 s. Since the exact loading of NP-EGTA is uncertain, we also performed calculations assuming a cytoplasmic concentration of 0.6 mM NP-EGTA. In that case, [Ca2+]i should rise to nearly 2 μM, and drop within 3 s to 400 nM.
We also estimated the [Ca2+]i in cultured CNS neurons using the values of K d and ratio of F max/F min from the CG-1 calibration curve (Fig. 1 a) and the measurements of CG-1 fluorescence inside the cultured neurons. The peak Ca2+ level after a 200-ms photolysis was obtained using the following equation:
 |
2 |
where F p is the CG-1 fluorescent intensity of the axon at peak [Ca2+]i after photolysis, and F r is the CG-1 fluorescence at resting [Ca2+]i before photolysis. From our measurements of CG-1 fluorescent intensity inside axons in culture after photolysis, the average F p/F r was ∼1.743 ± 0.075 (± SEM, n = 3). Minimal CG-1 fluorescence was measured from cells bathed in Ca2+-free grasshopper saline with addition of 5 mM EGTA and 5 mM ionomycin (Molecular Probes). The average F min/F r was ∼0.423 ± 0.066 (± SEM, n = 3). F max/F r can then be calculated using the ratio of F max/F min from the in vitro calibration. Using Eq. 2 and all the values we obtained for each parameter, [Ca2+]p inside cultured axons was ∼360 nM.
Similarly, the resting [Ca2+]i was estimated using the following equation:
 |
3 |
Again, using the values of K d and F max/F min from our in vitro calibration and the measurements of minimal CG-1 fluorescence inside actual axons in zero calcium solution, [Ca2+]r was ∼60 nM from Eq. 3. Our procedure for estimating F min may overestimate this parameter, so our estimates for [Ca2+]r and [Ca2+]p may be somewhat lower than actual values.
[Ca2+]i Analysis in Ti1 Afferent Neurons In Situ.
Ti1 afferent neurons on limb fillets were pressure injected (Narishige USA Inc.) with caged Ca2+ injection solution (50 mM Nitr-5 with 20 mM CaCl2 or 20 mM NP-EGTA with 10 mM CaCl2, 140 mM K Hepes, pH 7.3). To estimate the amount that was injected, solutions also contained 2 mM rhodamine-dextran (Molecular Probes). Rhodamine fluorescence in injected neurons was compared with that of micropipettes of similar diameter containing various known concentrations of rhodamine-dextran. We found that injection with 3–5 pulses (1.0 PSI; 300 ms duration) gave a dilution of ∼1/40 in the cell regions selected for photolysis, with an expected Nitr-5 concentration of ∼1.25 mM.
From the relative absorbances and quantum efficiencies of DM-nitrophen and Nitr-5, we calculated a photolysis rate of 21.8 s−1 for Ca2+-loaded Nitr-5, and 7.9 s−1 for Ca2+-free Nitr-5. Assuming a Nitr-5 concentration of 1.25 mM and a Ca2+ loading that leaves the resting [Ca2+]i at 60 nM, UV exposures of 100 and 400 ms are predicted to elevate [Ca2+]i to 300 and 900 nM, respectively (Fig. 1 c).
Successfully injected neurons were labeled with 1,1′-dihexadecyl-3,3, 3′,3′-tetramethylindocarbocyanine perchlorate (DiI; Molecular Probes) by gently touching the cell body membrane with DiI crystals on an electrode tip (O'Connor et al., 1990). Within ∼10–15 min, the lipophilic dye diffused to the growth cone and labeled all filopodia. For control experiments, Ti1 neurons were either labeled with DiI alone or injected with BAPTA injection solution (50 mM Nitr-5, 20 mM CaCl2, 140 mM K Hepes, 50 mM K2BAPTA, pH 7.3) and labeled with DiI. Photolysis for 100, 150, and 200 ms was calculated to elevate [Ca2+]i to 98, 111, and 120 nM, respectively (Fig. 1 c). The distribution of flash durations for control experiments, between 100 and 200 ms, was matched to the distribution of flash durations that had induced filopodial extension.
Using a diaphragm to select a small area (20–30 μm in diameter) on the growth cone, nascent axon, or on filopodia, injected cells were illuminated either through the 505 dichroic/60× objective, or the UV-2A filter block/ 40× objective. Starting with a 100-ms flash, photolysis time was increased in 50-ms increments until a morphological response was observed or until a maximum flash length of 400 ms was reached.
Using the CCD camera with a ND1 or ND2 neutral density filter and a Chroma phycoerythrin filter block (41003; Chroma), DiI labeled processes were imaged for 50–200 ms. For growth cones and nascent axons, sets of 3–5 focal planes were taken: the axons are 1–2 μm in diameter; for 3-focal plane sets, one plane was taken through the middle of the axons, and one 1–1.5 μm above and below the axons; for 5-focal plane sets, the additional planes were at least 2 μm away from the axon. Measurement of filopodial length was done using the MetaMorph Imaging System or NIH Image.
To confirm that similar results would be observed in culture, plated neurons were loaded with NP-EGTA (as above), rinsed, and then incubated in 6 μg/ml DiI solution for 15 min. Cells were rested for 1 h before experiments.
Filopodial Protrusion Sites and F-Actin Disposition
Since the cytoskeletal scaffold of filopodia primarily comprises F-actin bundles, we examined the disposition of F-actin in these cells with respect to the sites of filopodial protrusion after photolysis of caged calcium.
Initially, F-actin disposition was examined in fixed cells. Cells were fixed in glutaraldehyde (0.25, 0.1, 0.5, and 1%), formaldehyde (3.7%), or paraformaldehyde in an actin stabilizing buffer. Similar results were obtained with all fixes, although the following paraformaldehyde fixation resulted in the most consistent, low background, preparations for light microscope: cells were fixed in 4% paraformaldehyde in PHEM (60 mM Pipes, 25 mM Hepes, 10 mM EGTA, 2 mM MgCl2, pH 6.9) for 20 min, washed in PHEM three times and then permeabilized with 0.1% Triton X-100 or 0.02% saponin in PBS (150 mM NaCl, 20 mM Na2HPO4, pH 7.4) for 5 min. After being washed three times in PBS, cells were incubated in rhodamine-phalloidin (1 μg/ml; Molecular Probes) for 20 min. Cells were then rinsed in PBS, cleared in glycerol and mounted with Vectashield mounting medium (Vector Labs), and either photographed directly in a Nikon microscope, or imaged in a Bio-Rad 1024 confocal microscope.
For live labeling, Ti1 afferent neurons in limb fillets were injected with caged Ca2+ solution containing 0.1–0.25 mM rhodamine-phalloidin, and photolyzed (as above). For in situ CCD imaging of rhodamine-phalloidin, 200–400-ms exposures with a Chroma phycoerythrin filter set were generally used with ND 0.6. Photolysis sites were imaged for at least 20 min preceding the photolysis flash. For examination of the locations of filopodia with respect to F-actin patches, multiple image planes (3–6 per set) were taken.
We also examined actin dynamics by injecting rhodamine-actin into Ti1 neurons. Rhodamine-actin solution (Cytoskeleton) was dialyzed into Hepes injection buffer (1 mM Hepes, pH 7.2, 0.2 mM MgCl2, 0.2 mM ATP) and concentrated (2 mg/ml) with microconcentrators (Amicon).
Results
Photolysis of Caged Calcium in Nascent Axons in Culture
Using the calibrations described above (Materials and Methods), we measured resting [Ca2+]i and [Ca2+]i after photolysis in 13 cultured CNS neurons loaded with NP-EGTA from 6 different cell culture experiments. Loaded neurons were viewed with differential interference contrast (DIC) optics, and imaged with the CCD camera before and after photolysis of a small (20–30 μm) region at or near the growth cone. Qualitatively, CG-1 fluorescence rose sharply after photolysis and returned gradually to the resting level within ∼10–15 s (Fig. 2 a2).
Figure 2.

Elevation of [Ca2+]i after local photolysis. (a1) DIC image of an embryonic CNS neuron in culture. The cell was loaded with NP-EGTA and CG-1. (a2) Pseudocolor images (scale on right in nanomolars) showing [Ca2+]i elevation after a 100-ms photolysis of the growth cone and adjacent nascent axon (a1, box). Time is in seconds. Resting [Ca2+]i, first image. The photolysis flash was given at time 0. (b1) DIC image of a cultured CNS neuron loaded with NP-EGTA and CG-1. (b2) Before and after a 200-ms photolysis at time 0 (triangle), CG-1 fluorescence intensity was measured within selected small regions in the central domain of one growth cone (b1, box). [Ca2+]i was calculated using the CG-1 calibration curve (Fig. 1 a). Bars, 10 μm in a1, 5 μm in b1.
To quantify the calcium concentration changes, minimal CG-1 fluorescence (F min) was measured by placing neurons in calcium-free medium with a calcium chelator (EGTA) and ionomycin (to admit calcium). Peak CG-1 fluorescence (F p) was measured after a 200-ms photolysis. K d and F max/F min values from the calibration curve (Fig. 1 a) then were used with Eq. 2, to calculate peak calcium ion concentration and, using Eq. 3, resting [Ca2+]i. Intracellular [Ca2+] before and after photolysis for a cultured cell is shown in Fig. 2 b2. Resting Ca2+ concentration was estimated to be ∼60 nM. The observed calcium ion concentration of 360 nM 3 s after a 200-ms photolysis compares well with the computed value of 410 nM (Fig. 1 b) for an [NP-EGTA] of 0.6 mM. The extrapolated [Ca2+]i immediately after photolysis is ∼1 μM.
Photolysis of Caged Calcium in Nascent Axons In Situ
Based upon the computed and observed photolysis-induced calcium elevation in neurons in culture, neurons next were examined in situ. Ti1 neurons extending axons on embryonic limb bud epithelium (O'Connor et al., 1990) were injected with NP-EGTA or Nitr-5. Comparisons with known concentrations of a fluorescent marker (rhodamine-dextran) were used to determine the intracellular injection regimen to achieve a desired concentration of caged calcium compound. The photolysis rate for this concentration and compound were used to compute Ca2+ concentrations resulting from flashes of 100–400 ms (Fig. 1 c). The neurons were double-labeled with DiI for CCD imaging.
Segments of nascent axon 20–30 μm in length and just behind the growth cone were selected for photolysis. These regions, while capable of extending filopodia, normally did so at a lower rate than the leading edge of the growth cone (we did not use the leading edge of the growth cone for our experiments because the high frequency of filopodial protrusion made it difficult to isolate the effect of Ca2+ elevation). Using injection regimens selected to load the neurons with ∼1.25 mM Nitr-5, we started with 100-ms flashes, and increased flash length in 50-ms increments. We found that flashes in the 100–200-ms range usually became effective in effecting filopodial protrusion. These flashes should result in intracellular peak Ca2+ concentrations of ∼300–800 nM (Fig. 1 c).
A single photolysis flash typically was followed by elongation of filopodia within the flash zone, and also by extension of new filopodia (Figs. 3 and 4). We measured morphological changes of filopodia after photolysis at 32 photolysis sites on 22 Ti1 neurons from 22 limb fillets (Fig. 4). New filopodia could appear within 1 min, and were several micrometers in length by 5 min. The number of filopodia in the target region was significantly increased after the flash (P = 0.001; Fig. 4). It peaked ∼11–15 min after the flash (Fig. 4 B), and was substantially reduced by 21– 30 min after the flash. The total length of all filopodia in the flash zone increased and decreased with a similar time course (Fig. 4 A). Although multiple flashes appeared to sustain filopodial protrusion (Fig. 3), we did not systematically study their effects. We also performed 13 photolysis experiments on 8 different cultured cells, and found that the filopodial responses after photolysis in all 13 experiments were similar to those occurring in Ti1 neurons in situ (data not shown). These results suggest that calcium ion elevation can promote elongation of existing filopodia, and can initiate protrusion of new filopodia.
Figure 3.
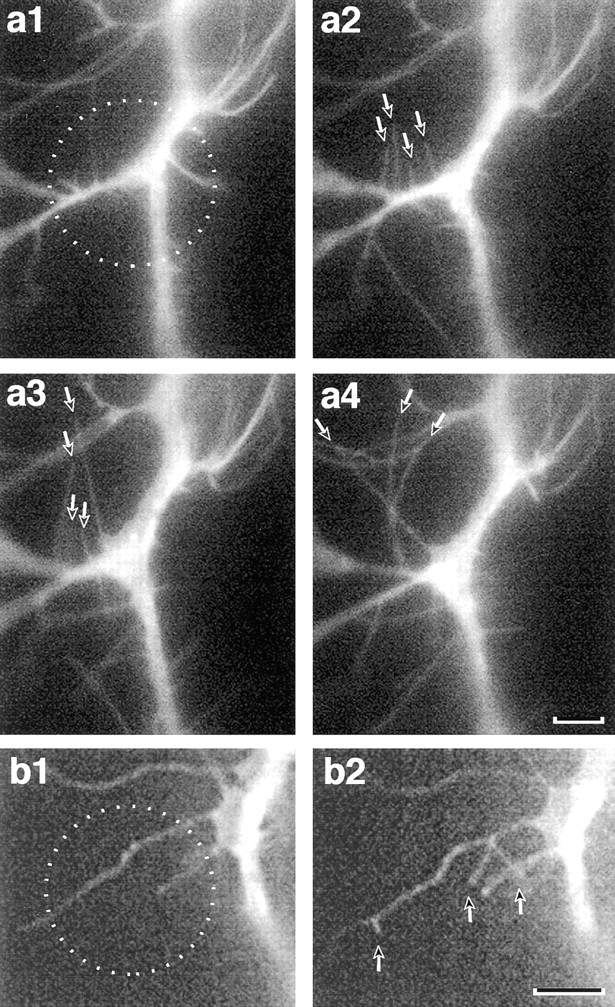
Local [Ca2+]i elevation can induce filopodial protrusion from nascent axons and from filopodia in situ. (a1; −3 min) This Ti1 neuron was injected with Nitr-5 and labeled with DiI. The target region (circle) was illuminated by a 150-ms photolysis flash at time 0. (a2; +16 min) Several filopodia (arrows) have emerged from the axon within the target zone. (a3; +25 min) After a second UV flash (+19 min), filopodia (arrows) continue to extend. (a4; +42 min) After a third UV flash (+37 min), filopodia (arrows) continue to extend, with several reaching lengths >15 μm. Bar, 5 μm. (b1; 4 min before 100-ms flash) Transient calcium elevation restricted to a filopodium (circle) can induce protrusion of new filopodia from the photolysis region. (b2; 10 min after flash) Protrusion of new filopodia (arrows) from the original filopodial shaft. Bar, 10 μm.
Figure 4.

Effect of transient [Ca2+]i elevation on the length and number of filopodia. (A) Percent change in the total length of all filopodia originating within the photolysis region. Filopodial lengths were normalized to the total length (asterisk) measured 1–5 min before photolysis (time 0). Four conditions are shown: neurons injected with Nitr-5 and labeled with DiI; neurons only labeled with DiI; neurons injected with calcium buffer (BAPTA) and with Nitr-5, and labeled with DiI; and neurons (pre-flash) injected with Nitr-5, and labeled with DiI, but not yet photolysed; for this condition, bins indicate time before the flash. Bars, average ± SEM; numbers above bars, number of experiments measured during corresponding time segments. (B) Change in the number of filopodia originating within the photolysis region.
To determine whether the observed effects on filopodia were due to Ca2+ elevation per se, we used three control conditions (Fig. 4). First, to control for normal protrusive activity, the number and length of filopodia after a flash were compared with the number and length of filopodia in the same time interval preceding the flash. Second, to control for possible photo-effects of DiI fluorescence, the number and length of filopodia were measured in neurons labeled with DiI, but not injected with caged calcium. Third, to control for possible effects of the caging molecule, or the photolysis thereof, the number and length of filopodia were measured in neurons coinjected with Nitr-5 and a calcium buffer (BAPTA). In none of these control conditions were significant effects on filopodia observed. These results indicate that [Ca2+]i elevation after photolysis specifically was required to induce filopodial protrusion.
In addition to nascent axons, individual filopodia also were targeted. Filopodia of these axons have a consistent uniform diameter (O'Connor et al., 1990). We selected target zones that contained 10–20-μm regions along the length of one or more filopodia, but did not contain nascent axon, lamellae, or a region of a filopodium that was enlarging into a branch. Photolysis of these regions typically resulted in one or more new filopodia arising along the length of the targeted filopodium (Fig. 3 b2). In a controlled set of 21 filopodia exposed to regional photolysis, no new filopodia arose in neurons labeled with DiI but not injected with caged calcium (7 filopodia tested), or in neurons injected with caged calcium and with BAPTA (7 filopodia tested); by contrast, filopodial branching events occurred after photolysis in all neurons injected with caged calcium alone (7 filopodia tested). This result suggests that all components necessary to generate a filopodium are present in filopodia and can be activated by local calcium elevation.
F-Actin Distribution and Filopodium Protrusion Sites
Since generation of new filopodia requires polymerization of new F-actin, we examined the disposition of F-actin in these cells and its response to calcium elevation. We started by examining F-actin in fixed, cultured CNS neurons, using a variety of actin stabilization and fixation procedures (Materials and Methods). We imaged F-actin disposition in 76 fixed grasshopper embryonic CNS cells from 18 cell culture experiments. We observed conventional F-actin distribution including (a) relatively little F-actin in the central domain of the growth cone and in the interior of the nascent axon; (b) concentrated F-actin at the leading edge of the growth cone; (c) concentrated F-actin at the bases of some (presumably extending) branches, and some filopodia; and (d) cortical F-actin along the nascent axon (Fig. 5 a).
Figure 5.

Distribution of F-actin in nascent axons and filopodial protrusion from sites of F-actin accumulation (patches). (a) Rhodamine-phalloidin– labeled F-actin in a cultured and fixed CNS growth cone. A bright band of rhodamine-phalloidin labeling is seen along the leading lamellum of the growth cone (between the two arrowheads) where many filopodia are protruding. F-Actin accumulations also occur at the bases of some lateral branches (arrow), some lateral filopodia, and nonuniformly along the axon cortex. (b) Actin labeling by injected rhodamine-actin in live Ti1 neurons. Various sizes and densities of actin accumulations (patches) are observed (b1, arrow). These actin patches frequently occur at the bases of filopodia (b2, arrow), although some do not (b2, arrowhead). (c) F-Actin labeling by rhodamine-phalloidin in live Ti1 neurons. F-Actin accumulations (arrow) appear similar to the patches seen with labeled actin (b2). (d) F-Actin labeling by rhodamine-phalloidin in a pair of live pioneer neurons. As in fixed cells, F-actin accumulations occur at the bases of some branches (arrowheads) and filopodia, and along the axon cortex. The cortical labeling is nonuniform, and often occurs in fairly distinct patches (arrows). (d2) These F-actin patches and accumulations can increase and/or decrease in intensity, and can move laterally (arrows). d2 was taken 5 min after d1. (e) Live pioneer axons in situ that have been coinjected with caged calcium and rhodamine-phalloidin. Several F-actin patches (e1, arrows) occurred along this region of the nascent axon. After a 300-ms photolysis flash (5 min after e1) of the entire region, filopodia were extended from the two most distal patches (e2, top left arrows, 11 min after flash), and then from the most proximal patch (e3, bottom right arrow, 16 min after flash). By the time the last filopodium had extended, the first (e3, top left arrow) already had retracted. Bars, 5 μm.
We looked at live labeling of actin in Ti1 pioneer neurons in situ by injecting rhodamine-actin into cell bodies. Injected rhodamine-actin diffuses rapidly into these growth cones and filopodia, and predominantly appears to reveal F-actin structures, presumably because of the high density of labeled monomers (O'Connor and Bentley, 1993). We injected four Ti1 neurons with rhodamine-actin; the actin labeling was similar in all cells. The observed labeling was similar to that in fixed, rhodamine-phalloidin labeled neurons (Fig. 5 b). As in fixed cells, the cortical labeling was not uniform, but usually was relatively dense in some areas, and relatively sparse in others. Some of the dense labeling occurred in fairly distinct patches (Fig. 5 b). Patches could be localized to the bases of filopodia, or to other cortical regions.
To confirm that these patches were F-actin, and to monitor their activity, we injected 22 live Ti1 neurons with low concentrations of rhodamine-phalloidin (which previously has been shown not to disrupt filopodial activity; O'Connor and Bentley, 1993). These axons and growth cones (Fig. 5 c) appeared very similar to rhodamine-actin injected growth cones. When axons were observed for several minutes (Fig. 5 d), cortical F-actin was seen to change, with patches forming or disappearing, increasing or decreasing in density, and sometimes moving distally or proximally along the axon.
We then coinjected caged calcium with rhodamine-phalloidin, targeted regions of the nascent axon with photolysis flashes, and imaged subsequent changes in filopodia (with rhodamine filters) and in F-actin. New filopodia arose from the target regions, and we examined the relationship between the sites of F-actin accumulation, and the sites of filopodial protrusion. In some cases, new filopodia arose from sites where no preexisting F-actin patch had been observed; some prominent F-actin patches within target zones were not the sites from which filopodia emerged; and, often, filopodia emerged at the sites of preexisting F-actin patches. A case where several filopodia emerged from F-actin patches in the target zone is shown in Fig. 5 e.
To quantify the relationship between filopodial protrusion and F-actin accumulation along the axons, we counted the total number of new filopodia after photolysis experiments and determined whether those filopodia were associated with F-actin patches or not. The data from 24 experiments are summarized in Table I. For each experiment, three to six images at different focal planes were collected every 5 min in the photolysis area, and each cell was followed for ∼30 min after photolysis. In this sample set, ∼84% of new filopodia were initiated from preexisting F-actin patches, ∼10% were from F-actin patches newly formed after photolysis, and ∼6% from cortical sites without detected F-actin accumulation. Thus, new filopodia were disproportionately, but not exclusively, associated with F-actin patches.
Table I.
Filopodial Protrusion from Cortical F-Actin Patches after Photolysis
| Cell | Flash | Number of new filopodia | From preexisting F-actin patches | From new F-actin patches | Not from F-actin patches | |||||
|---|---|---|---|---|---|---|---|---|---|---|
| A | 1 | 9 | 7 | 2 | ||||||
| 2 | 7 | 6 | 1 | |||||||
| 3 | 2 | 2 | ||||||||
| 4 | 2 | 1 | 1 | |||||||
| B | 1 | 13 | 11 | 2 | ||||||
| 2 | 9 | 9 | ||||||||
| C | 1 | 16 | 13 | 1 | 2 | |||||
| D | 1 | 5 | 4 | 1 | ||||||
| E | 1 | 4 | 4 | |||||||
| F | 1 | 10 | 10 | |||||||
| G | 1 | 2 | 2 | |||||||
| 2 | 6 | 6 | ||||||||
| H | 1 | 6 | 5 | 1 | ||||||
| 2 | 9 | 9 | ||||||||
| I | 1 | 13 | 6 | 4 | 3 | |||||
| J | 1 | 4 | 3 | 1 | ||||||
| K | 1 | 11 | 7 | 3 | 1 | |||||
| 2 | 4 | 4 | ||||||||
| L | 1 | 2 | 2 | |||||||
| 2 | 6 | 5 | 1 | |||||||
| 3 | 2 | 2 | ||||||||
| M | 1 | 3 | 3 | |||||||
| 2 | 2 | 2 | ||||||||
| N | 1 | 3 | 3 | |||||||
| Total number | 150 | 126 | 15 | 9 | ||||||
| % | 100% | 84% | 10% | 6% |
Discussion
Using intracellular caged calcium compounds, we investigated the effect of direct elevation of calcium ion concentration on filopodia extended from target regions of nascent axons, and on the relationship between lateral filopodia and cortical F-actin. The selected target regions were just proximal to the growth cones of Ti1 afferent neurons undergoing axonogenesis on an epithelial substrate in situ. After a brief (50–200 ms) photolysis flash, intracellular Ca2+ concentration probably rose within a second to a peak of ∼1 μM, and then declined rapidly back to the resting level within 10–15 s. The increase in [Ca2+]i induced elongation of existing filopodia, and protrusion of new filopodia. Elongation or protrusion could begin within less than a minute, and peaked ∼10–15 min after the flash. Photolysis of distal regions of individual filopodia induced new filopodia (branching) in the flash zone. In neurons coinjected with rhodamine-phalloidin, F-actin was observed to be nonuniformly distributed in the submembrane cortex of the nascent axon; F-actin accumulations formed, moved, coalesced, fragmented, and dispersed. Photolysis-induced filopodia emerged disproportionately from F-actin patches.
Calcium Release and Measurement
We used caged calcium compounds to elevate [Ca2+]i because we wanted to localize the calcium change spatially and to restrict the initial signaling event to calcium (by-passing upstream signaling elements). A disadvantage of this approach is that overlap in activation wavelengths precludes ratio imaging with Fura-based compounds, since the measurement procedure would itself photolyze caged calcium and elevate [Ca2+]i. Consequently, we estimated [Ca2+]i changes using a single-wavelength indicator, CG-1. In vitro, we measured, and plotted, CG-1 fluorescence at different calcium concentrations (Fig. 1 a). In models (Fig. 1, b and c) and in AM-loaded cultured neurons (Fig. 2), respectively, we computed, and measured, resting [Ca2+]i and [Ca2+]i after photolysis. Computed and measured values were in reasonable agreement. We then used photolysis flashes of the intensity and length evaluated in models and in cultured neurons to photolyze caged calcium in injected neurons in situ. We were not successful in estimating [Ca2+]i with CG-1 in Ti1 neurons in situ, perhaps because they have more rapid Ca2+ extrusion than cultured neurons so that the induced [Ca2+]i elevation was largely dissipated by the time [Ca2+]i measurements could begin.
Transient Local [Ca2+]i Elevation in Axons Can Induce Filopodial Protrusion
Elevation of intracellular calcium concentration throughout a growth cone by application of serotonin, by depolarization, or by calcium ionophore can cause a reduction in the number of filopodia (Mattson and Kater, 1987; Rehder and Kater, 1992; Rehder and Cheng, 1998). This result is consistent with the loss of F-actin (and microtubules) seen after calcium elevation (Lankford and Letourneau, 1989; Neely and Gesemann, 1994), with calcium-mediated growth cone collapse that can be induced by repellent guidance molecules (Bandtlow et al., 1993; Löschinger et al., 1997), and with the reduction in outgrowth mediated by spontaneous calcium spikes (Gomez et al., 1995; Gu and Spitzer, 1995), or caged calcium–induced calcium transients (Gomez and Spitzer, 1999). In contrast, an increase in the number of filopodia can be initiated by calcium elevation induced by a large-scale electric field (McCaig, 1986), depolarizing electrode (Bedlack et al., 1992; Davenport and Kater, 1992; Manivannan and Terakawa, 1994), or local [K+] elevation (Manivannan and Terakawa, 1994). These different outcomes may be due to the localization of the calcium elevation (Davenport and Kater, 1992) or to the level of [Ca2+]i reached (Mattson and Kater, 1987). In addition, intracellular events after depolarization are not restricted to elevation of calcium concentration, and other intracellular effects might influence the calcium influx– dependent outcomes seen with different methods of depolarization. Our direct elevation of calcium concentration with photolysis of caged calcium bypasses these other possible upstream events, and makes a strong case that local calcium elevation can, by itself, directly initiate protrusion of filopodia. In contrast to protrusion of new filopodia, lengthening of already existing filopodia has been a consistently observed result of elevation of intracellular calcium ion concentration by several methods (Bedlack et al., 1992; Davenport and Kater, 1992; Rehder and Kater, 1992), including extracellular K+, current passing electrodes, calcium ionophore and, now, photolysis of caged calcium ions. The calcium levels, onset, and time course of this response observed with caged calcium are comparable to those features observed with other methods.
Signal Detection and Response Capabilities of Single Filopodia
Growth cones can project many filopodia that can extend several tens of micrometers, potentially greatly increasing exploration of the embryonic environment. This potential is realized by the surprising capabilities of filopodia. Single filopodial contacts can steer the growth cone in situ (O'Connor et al., 1990; Myers and Bastiani, 1993) or initiate growth cone retraction (Kapfhammer and Raper, 1987). Recent work has examined the sensory signaling and motor capabilities of single filopodia. In response to depolarizing extracellular current, calcium ionophore, soluble neurotransmitters (Davenport et al., 1993), or contact with laminin-coated beads (Kuhn et al., 1998), isolated filopodia can generate a calcium-elevation response followed by restoration of calcium concentration to the resting level. In isolated filopodia, however, stimuli that elevated calcium resulted in shortening rather than lengthening (Davenport et al., 1993). This raises the issue of whether calcium signaling that is restricted to a filopodium can activate an effector response (Rehder and Cheng, 1998), particularly since organelles that may mediate calcium signal amplification may not be present within filopodia (Davenport et al., 1996).
We tested this issue by using photolysis of caged calcium to restrict calcium elevation to filopodia (Fig. 3 b1). We found that filopodia can generate an effector response to this calcium signal by initiating multiple new filopodia within the illuminated region (Fig. 3 b2). Thus, single filopodia apparently contain all of the receptor, signaling, and effector molecular machinery necessary to generate an outgrowth response. Furthermore, transient calcium elevation that is confined to the filopodium itself is sufficient to trigger the signal cascades to initiate filopodial protrusion. Interestingly, one of the most consistent early responses seen in situ when a filopodium contacts a powerful attractive substrate, the surface of a guidepost cell, is initiation of multiple new filopodia at the contact site (O'Connor et al., 1990).
De Novo Generation of Filopodia at Cortical F-Actin Patches
Although considerable progress has been made in understanding actin assembly and mechanics (Lin and Forscher, 1993; Lin et al., 1996; Mitchison and Cramer, 1996; Suter et al., 1998), many features of the signaling pathways controlling cell motility and generation of filopodia remain unresolved. Filopodial assembly can be driven by small GTPases (Luo et al., 1996; Tapon and Hall, 1997), particularly cdc42, and associated proteins (Brill et al., 1996; Bashour et al., 1997; Miki et al., 1998). There is substantial evidence that calcium-sensitive proteins affect outgrowth, filopodia, actin, and actin assembly controllers (Janmey, 1994; Chang et al., 1995; Gomez et al., 1995; Gu and Spitzer, 1995; VanBerkum and Goodman, 1995; Brill et al., 1996; Joyal et al., 1997; Potter et al., 1998).
Using coinjection of caged calcium and rhodamine-phalloidin, we examined the relationship between disposition of F-actin along nascent axon shafts, local elevation of calcium concentration, and the protrusion sites of filopodia (Fig. 5). We observed that F-actin is not uniformly distributed in the cortex of nascent axons, but occurs in accumulations of varying density that can be motile and transient. After photolysis, new filopodia emerge most frequently from preexisting F-actin accumulations, although new accumulations sometimes form before a filopodium emerges, and in a few cases no accumulation is observed at a filopodial protrusion site (Table I). We did not observe a consistent increase in number of F-actin patches after photolysis; transient [Ca2+]i elevation may induce filopodial protrusion not by initiating more de novo F-actin patches, but by activating the actin regulatory proteins located near or inside the preexisting F-actin patches to reorganize actin filaments and initiate filopodial formation.
In budding yeast, F-actin accumulations, termed patches (Kilmartin and Adams, 1984; Li et al., 1995), contain actin-binding proteins (Amatruda and Cooper, 1992; Mulholland et al., 1994; Lappalainen and Drubin, 1997) and also move laterally in the cortex (Doyle and Botstein, 1996; Waddle et al., 1996). In growth cones and nascent axons, there also may be dynamic, transient aggregations of actin assembly–associated proteins that can either generate a new filopodium, or disassemble. Such aggregates may be preferentially activated to generate a filopodium by local elevation of calcium concentration.
Abbreviations used in this paper
- CG-1
Calcium-Green-1
- DIC
differential interference contrast
- NP
nitrophenyl
Footnotes
Support was provided by National Institutes of Health grants NS09074 and NS15114.
References
- Amatruda JF, Cooper JA. Purification, characterization, and immunofluorescence localization of Saccharomyces cerevisiaecapping protein. J Cell Biol. 1992;117:1067–1076. doi: 10.1083/jcb.117.5.1067. [DOI] [PMC free article] [PubMed] [Google Scholar]
- Bandtlow CE, Schmidt MF, Hassinger TD, Schwab ME, Kater SB. Role of intracellular calcium in NI-35-evoked collapse of neuronal growth cones. Science. 1993;259:80–83. doi: 10.1126/science.8418499. [DOI] [PubMed] [Google Scholar]
- Bashour AM, Fullerton AT, Hart MJ, Bloom GS. IQGAP1, a Rac- and Cdc42-binding protein, directly binds and cross-links microfilaments. J Cell Biol. 1997;137:1555–1566. doi: 10.1083/jcb.137.7.1555. [DOI] [PMC free article] [PubMed] [Google Scholar]
- Bedlack RS, Jr, Wei M, Loew LM. Localized membrane depolarizations and localized calcium influx during electric field-guided neurite growth. Neuron. 1992;9:393–403. doi: 10.1016/0896-6273(92)90178-g. [DOI] [PubMed] [Google Scholar]
- Bentley D, Keshishian H, Shankland M, Toroian-Raymond A. Quantitative staging of embryonic development of the grasshopper, Schistocerca nitens. . J Embryol Exp Morphol. 1979;54:47–74. [PubMed] [Google Scholar]
- Brill S, Li S, Lyman CW, Church DM, Wasmuth JJ, Weissbach L, Bernards A, Snijders AJ. The Ras GTPase-activating-protein-related human protein IQGAP2 harbors a potential actin binding domain and interacts with calmodulin and Rho family GTPases. Mol Cell Biol. 1996;16:4869–4878. doi: 10.1128/mcb.16.9.4869. [DOI] [PMC free article] [PubMed] [Google Scholar]
- Chang HY, Takei K, Sydor AM, Born T, Rusnak F, Jay DG. Asymmetric retraction of growth cone filopodia following focal inactivation of calcineurin. Nature. 1995;376:686–690. doi: 10.1038/376686a0. [DOI] [PubMed] [Google Scholar]
- Davenport RW, Kater SB. Local increases in intracellular calcium elicit local filopodial responses in Helisomaneuronal growth cones. Neuron. 1992;9:405–416. doi: 10.1016/0896-6273(92)90179-h. [DOI] [PubMed] [Google Scholar]
- Davenport RW, Dou P, Rehder V, Kater SB. A sensory role for neuronal growth cone filopodia. Nature. 1993;361:721–724. doi: 10.1038/361721a0. [DOI] [PubMed] [Google Scholar]
- Davenport RW, Dou P, Mills LR, Kater SB. Distinct calcium signaling within neuronal growth cones and filopodia. J Neurobiol. 1996;31:1–15. doi: 10.1002/(SICI)1097-4695(199609)31:1<1::AID-NEU1>3.0.CO;2-6. [DOI] [PubMed] [Google Scholar]
- Doyle T, Botstein D. Movement of yeast cortical actin cytoskeleton visualized in vivo. Proc Natl Acad Sci USA. 1996;93:3886–3891. doi: 10.1073/pnas.93.9.3886. [DOI] [PMC free article] [PubMed] [Google Scholar]
- Ellis-Davies GC, Kaplan JH. Nitrophenyl-EGTA, a photolabile chelator that selectively binds Ca2+with high affinity and releases it rapidly upon photolysis. Proc Natl Acad Sci USA. 1994;91:187–191. doi: 10.1073/pnas.91.1.187. [DOI] [PMC free article] [PubMed] [Google Scholar]
- Ellis-Davies GC, Kaplan JH, Barsotti RJ. Laser photolysis of caged calcium: rates of calcium release by nitrophenyl-EGTA and DM-nitrophen. Biophys J. 1996;70:1006–1016. doi: 10.1016/S0006-3495(96)79644-3. [DOI] [PMC free article] [PubMed] [Google Scholar]
- Ghosh A, Greenberg ME. Calcium signaling in neurons: molecular mechanisms and cellular consequences. Science. 1995;268:239–247. doi: 10.1126/science.7716515. [DOI] [PubMed] [Google Scholar]
- Gomez TM, Spitzer NC. In vivo regulation of axon extension and pathfinding by growth-cone calcium transients. Nature. 1999;397:350–355. doi: 10.1038/16927. [DOI] [PubMed] [Google Scholar]
- Gomez TM, Snow DM, Letourneau PC. Characterization of spontaneous calcium transients in nerve growth cones and their effect on growth cone migration. Neuron. 1995;14:1233–1246. doi: 10.1016/0896-6273(95)90270-8. [DOI] [PubMed] [Google Scholar]
- Gu X, Spitzer NC. Distinct aspects of neuronal differentiation encoded by frequency of spontaneous Ca2+transients. Nature. 1995;375:784–787. doi: 10.1038/375784a0. [DOI] [PubMed] [Google Scholar]
- Hammarback JA, Letourneau PC. Neurite extension across regions of low cell-substratum adhesivity: implications for the guidepost hypothesis of axonal pathfinding. Dev Biol. 1986;117:655–662. doi: 10.1016/0012-1606(86)90334-9. [DOI] [PubMed] [Google Scholar]
- Harper SJ, Bolsover SR, Walsh FS, Doherty P. Neurite outgrowth stimulated by L1 requires calcium influx into neurons but is not associated with changes in steady state levels of calcium in growth cones. Cell Adhes Commun. 1994;2:441–453. doi: 10.3109/15419069409004454. [DOI] [PubMed] [Google Scholar]
- Janmey PA. Phosphoinositides and calcium as regulators of cellular actin assembly and disassembly. Annu Rev Physiol. 1994;56:169–191. doi: 10.1146/annurev.ph.56.030194.001125. [DOI] [PubMed] [Google Scholar]
- Jian X, Hidaka H, Schmidt JT. Kinase requirement for retinal growth cone motility. J Neurobiol. 1994;25:1310–1328. doi: 10.1002/neu.480251011. [DOI] [PubMed] [Google Scholar]
- Joyal JL, Annan RS, Ho YD, Huddleston ME, Carr SA, Hart MJ, Sacks DB. Calmodulin modulates the interaction between IQGAP1 and Cdc42. Identification of IQGAP1 by nanoelectrospray tandem mass spectrometry. J Biol Chem. 1997;272:15419–15425. doi: 10.1074/jbc.272.24.15419. [DOI] [PubMed] [Google Scholar]
- Kapfhammer JP, Raper JA. Collapse of growth cone structure on contact with specific neurites in culture. J Neurosci. 1987;7:201–212. doi: 10.1523/JNEUROSCI.07-01-00201.1987. [DOI] [PMC free article] [PubMed] [Google Scholar]
- Kaplan JH, Ellis-Davies GC. Photolabile chelators for the rapid photorelease of divalent cations. Proc Natl Acad Sci USA. 1988;85:6571–6575. doi: 10.1073/pnas.85.17.6571. [DOI] [PMC free article] [PubMed] [Google Scholar]
- Kilmartin JV, Adams AE. Structural rearrangements of tubulin and actin during the cell cycle of the yeast Saccharomyces. . J Cell Biol. 1984;98:922–933. doi: 10.1083/jcb.98.3.922. [DOI] [PMC free article] [PubMed] [Google Scholar]
- Kuhn TB, Williams CV, Dou P, Kater SB. Laminin directs growth cone navigation via two temporally and functionally distinct calcium signals. J Neurosci. 1998;18:184–194. doi: 10.1523/JNEUROSCI.18-01-00184.1998. [DOI] [PMC free article] [PubMed] [Google Scholar]
- Lankford KL, Letourneau PC. Evidence that calcium may control neurite outgrowth by regulating the stability of actin filaments. J Cell Biol. 1989;109:1229–1243. doi: 10.1083/jcb.109.3.1229. [DOI] [PMC free article] [PubMed] [Google Scholar]
- Lappalainen P, Drubin DG. Cofilin promotes rapid actin filament turnover in vivo. Nature. 1997;388:78–82. doi: 10.1038/40418. [DOI] [PubMed] [Google Scholar]
- Li R, Zheng Y, Drubin DG. Regulation of cortical actin cytoskeleton assembly during polarized cell growth in budding yeast. J Cell Biol. 1995;128:599–615. doi: 10.1083/jcb.128.4.599. [DOI] [PMC free article] [PubMed] [Google Scholar]
- Lin CH, Forscher P. Cytoskeletal remodeling during growth cone-target interactions. J Cell Biol. 1993;121:1369–1383. doi: 10.1083/jcb.121.6.1369. [DOI] [PMC free article] [PubMed] [Google Scholar]
- Lin CH, Espreafico EM, Mooseker MS, Forscher P. Myosin drives retrograde F-actin flow in neuronal growth cones. Neuron. 1996;16:769–782. doi: 10.1016/s0896-6273(00)80097-5. [DOI] [PubMed] [Google Scholar]
- Löschinger J, Bandtlow CE, Jung J, Klostermann S, Schwab ME, Bonhoeffer F, Kater SB. Retinal axon growth cone responses to different environmental cues are mediated by different second-messenger systems. J Neurobiol. 1997;33:825–834. doi: 10.1002/(sici)1097-4695(19971120)33:6<825::aid-neu9>3.0.co;2-b. [DOI] [PubMed] [Google Scholar]
- Luo L, Jan L, Jan YN. Small GTPases in axon outgrowth. Perspect Dev Neurobiol. 1996;4:199–204. [PubMed] [Google Scholar]
- Manivannan S, Terakawa S. Rapid sprouting of filopodia in nerve terminals of chromaffin cells, PC12 cells, and dorsal root neurons induced by electrical stimulation. J Neurosci. 1994;14:5917–5928. doi: 10.1523/JNEUROSCI.14-10-05917.1994. [DOI] [PMC free article] [PubMed] [Google Scholar]
- Mattson MP, Kater SB. Calcium regulation of neurite elongation and growth cone motility. J Neurosci. 1987;7:4034–4043. doi: 10.1523/JNEUROSCI.07-12-04034.1987. [DOI] [PMC free article] [PubMed] [Google Scholar]
- McCaig CD. Dynamic aspects of amphibian neurite growth and the effects of an applied electric field. J Physiol. 1986;375:55–69. doi: 10.1113/jphysiol.1986.sp016105. [DOI] [PMC free article] [PubMed] [Google Scholar]
- Miki H, Sasaki T, Takai Y, Takenawa T. Induction of filopodium formation by a WASP-related actin-depolymerizing protein N-WASP. Nature. 1998;391:93–96. doi: 10.1038/34208. [DOI] [PubMed] [Google Scholar]
- Mitchison TJ, Cramer LP. Actin-based cell motility and cell locomotion. Cell. 1996;84:371–379. doi: 10.1016/s0092-8674(00)81281-7. [DOI] [PubMed] [Google Scholar]
- Mulholland J, Preuss D, Moon A, Wong A, Drubin D, Botstein D. Ultrastructure of the yeast actin cytoskeleton and its association with the plasma membrane. J Cell Biol. 1994;125:381–391. doi: 10.1083/jcb.125.2.381. [DOI] [PMC free article] [PubMed] [Google Scholar]
- Myers PZ, Bastiani MJ. Growth cone dynamics during the migration of an identified commissural growth cone. J Neurosci. 1993;13:127–143. doi: 10.1523/JNEUROSCI.13-01-00127.1993. [DOI] [PMC free article] [PubMed] [Google Scholar]
- Neely MD, Gesemann M. Disruption of microfilaments in growth cones following depolarization and calcium influx. J Neurosci. 1994;14:7511–7520. doi: 10.1523/JNEUROSCI.14-12-07511.1994. [DOI] [PMC free article] [PubMed] [Google Scholar]
- Neher E, Zucker RS. Multiple calcium-dependent processes related to secretion in bovine chromaffin cells. Neuron. 1993;10:21–30. doi: 10.1016/0896-6273(93)90238-m. [DOI] [PubMed] [Google Scholar]
- O'Connor TP, Bentley D. Accumulation of actin in subsets of pioneer growth cone filopodia in response to neural and epithelial guidance cues in situ. J Cell Biol. 1993;123:935–948. doi: 10.1083/jcb.123.4.935. [DOI] [PMC free article] [PubMed] [Google Scholar]
- O'Connor TP, Duerr JS, Bentley D. Pioneer growth cone steering decisions mediated by single filopodial contacts in situ. J Neurosci. 1990;10:3935–3946. doi: 10.1523/JNEUROSCI.10-12-03935.1990. [DOI] [PMC free article] [PubMed] [Google Scholar]
- Patel NB, Poo MM. Perturbation of the direction of neurite growth by pulsed and focal electric fields. J Neurosci. 1984;4:2939–2947. doi: 10.1523/JNEUROSCI.04-12-02939.1984. [DOI] [PMC free article] [PubMed] [Google Scholar]
- Potter DA, Tirnauer JS, Janssen R, Croall DE, Hughes CN, Fiacco KA, Mier JW, Maki M, Herman IM. Calpain regulates actin remodeling during cell spreading. J Cell Biol. 1998;141:647–662. doi: 10.1083/jcb.141.3.647. [DOI] [PMC free article] [PubMed] [Google Scholar]
- Rehder V, Cheng S. Autonomous regulation of growth cone filopodia. J Neurobiol. 1998;34:179–192. doi: 10.1002/(sici)1097-4695(19980205)34:2<179::aid-neu7>3.0.co;2-#. [DOI] [PubMed] [Google Scholar]
- Rehder V, Kater SB. Regulation of neuronal growth cone filopodia by intracellular calcium. J Neurosci. 1992;12:3175–3186. doi: 10.1523/JNEUROSCI.12-08-03175.1992. [DOI] [PMC free article] [PubMed] [Google Scholar]
- Suter DM, Errante LD, Belotserkovsky V, Forscher P. The Ig superfamily cell adhesion molecule, apCAM, mediates growth cone steering by substrate-cytoskeletal coupling. J Cell Biol. 1998;141:227–240. doi: 10.1083/jcb.141.1.227. [DOI] [PMC free article] [PubMed] [Google Scholar]
- Tapon N, Hall A. Rho, Rac and Cdc42 GTPases regulate the organization of the actin cytoskeleton. Curr Opin Cell Biol. 1997;9:86–92. doi: 10.1016/s0955-0674(97)80156-1. [DOI] [PubMed] [Google Scholar]
- Tsien R, Pozzan T. Measurement of cytosolic free Ca2+with quin2. Methods Enzymol. 1989;172:230–262. doi: 10.1016/s0076-6879(89)72017-6. [DOI] [PubMed] [Google Scholar]
- VanBerkum MF, Goodman CS. Targeted disruption of Ca2+-calmodulin signaling in Drosophilagrowth cones leads to stalls in axon extension and errors in axon guidance. Neuron. 1995;14:43–56. doi: 10.1016/0896-6273(95)90239-2. [DOI] [PubMed] [Google Scholar]
- Waddle JA, Karpova TS, Waterston RH, Cooper JA. Movement of cortical actin patches in yeast. J Cell Biol. 1996;132:861–870. doi: 10.1083/jcb.132.5.861. [DOI] [PMC free article] [PubMed] [Google Scholar]
- Williams EJ, Doherty P, Turner G, Reid RA, Hemperly JJ, Walsh FS. Calcium influx into neurons can solely account for cell contact-dependent neurite outgrowth stimulated by transfected L1. J Cell Biol. 1992;119:883–892. doi: 10.1083/jcb.119.4.883. [DOI] [PMC free article] [PubMed] [Google Scholar]
- Zhao M, Hollingworth S, Baylor SM. AM-loading of fluorescent Ca2+indicators into intact single fibers of frog muscle. Biophys J. 1997;72:2736–2747. doi: 10.1016/S0006-3495(97)78916-1. [DOI] [PMC free article] [PubMed] [Google Scholar]
- Zheng JQ, Poo MM, Connor JA. Calcium and chemotropic turning of nerve growth cones. Perspect Dev Neurobiol. 1996a;4:205–213. [PubMed] [Google Scholar]
- Zheng JQ, Wan JJ, Poo MM. Essential role of filopodia in chemotropic turning of nerve growth cone induced by a glutamate gradient. J Neurosci. 1996b;16:1140–1149. doi: 10.1523/JNEUROSCI.16-03-01140.1996. [DOI] [PMC free article] [PubMed] [Google Scholar]
- Zucker RS. The calcium concentration clamp: spikes and reversible pulses using the photolabile chelator DM-nitrophen. Cell Calcium. 1993;14:87–100. doi: 10.1016/0143-4160(93)90079-l. [DOI] [PubMed] [Google Scholar]