

Abstract
Analysis of the relationship between transcriptional activators and chromatin organization has focused largely on lower levels of chromatin structure. Here we describe striking remodeling of large-scale chromatin structure induced by a strong transcriptional activator. A VP16-lac repressor fusion protein targeted the VP16 acidic activation domain to chromosome regions containing lac operator repeats. Targeting was accompanied by increased transcription, localized histone hyperacetylation, and recruitment of at least three different histone acetyltransferases. Observed effects on large-scale chromatin structure included unfolding of a 90-Mbp heterochromatic chromosome arm into an extended 25–40-μm chromonema fiber, remodeling of this fiber into a novel subnuclear domain, and propagation of large-scale chromatin unfolding over hundreds of kilobase pairs. These changes in large-scale chromatin structure occurred even with inhibition of ongoing transcription by α-amanitin. Our results suggest a functional link between recruitment of the transcriptional machinery and changes in large-scale chromatin structure. Based on the observed long-range propagation of changes in large-scale chromatin structure, we suggest a possible rationale for the observed clustering of housekeeping genes within Mbp-sized chromosome bands.
Keywords: chromatin, chromosome, VP16, transcription, green fluorescent protein
Chromatin plays an important role in regulating gene expression (Svaren and Horz, 1993; Kingston et al., 1996; Wolffe, 1997; Struhl, 1998). The classic view of DNA wrapping around the histone core, thereby impeding the access of transcription factors at local sites, has been transformed to the more complex concept of DNA sequences being assembled into nucleosome arrays in which specific interactions between histone tails and sequence specific DNA-binding proteins create specialized local chromatin environments regulating transcriptional initiation and elongation. Nucleosomes are disrupted at regions adjacent to promoters and other regulatory elements as revealed by the hypersensitivity of these sites to DNaseI. The recent demonstration that a number of general and specific transcription factors contain enzyme activities that directly modify histone tail structure, and that structural motifs are closely shared between certain transcription factors and core histone and linker chromatin proteins, has further emphasized the dynamic nature of nucleosome and nucleosome-like assemblies.
Little is known about how these histone modifications and alterations in nucleosome structure might lead to changes in large-scale chromatin organization. Evidence that large-scale chromatin has its own contribution to transcriptional activation comes from several important studies. First, there is a generalized increase in nuclease sensitivity not only in the coding region of many active genes but also over large regions flanking these gene loci (Igo-Kemenes et al., 1982; Eissenberg et al., 1985; Elgin, 1990; Dillon and Grosveld, 1994). This open configuration is more an indication of potential transcriptional activity rather than transcriptional activity per se. A second example of a linkage between large-scale chromatin structure and transcription is the transient puffing in Drosophila and Chironimus polytene chromosomes (Ericsson et al., 1989; Alberts et al., 1994). However, how this puffing of highly active genes relates to changes in large-scale chromatin of typical RNA pol 2 genes in diploid nuclei is currently unknown.
Third, there is the correlation of large-scale chromatin condensation associated with heterochromatin and dosage compensation. Heterochromatin was originally defined as a highly condensed, largely transcriptionally inactive form of chromatin localized mainly at the nuclear periphery. Facultative heterochromatin refers to chromosome regions that at certain developmental stages show cytological condensation associated with transcriptional repression. A striking example of facultative heterochromatin is the inactive X chromosome in mammals that becomes transcriptionally inactive, condensed, and localized close to the nuclear envelope or nucleolus (Schellens et al., 1979; Bourgeois et al., 1985). A different kind of dosage compensation occurs in Caenorhabditis elegans where both X chromosomes are only 50% active in the XX animals with respect to the X chromosome activity in the XO animals. DPY27, a protein shown to be essential in dosage compensation in C. elegans, is homologous to members of the structural maintenance of chromosomes protein family involved in the structural maintenance of chromosomes (Chuang et al., 1994), and a second structural maintenance of chromosomes family homologue, MIX-1, is required for both dosage compensation and mitotic chromosome condensation (Lieb et al., 1998). These findings strongly suggest a direct link between general regulation of gene expression and higher orders of chromatin structure.
In this paper we describe changes in large-scale chromatin that occur when the acidic activation domain (AAD)1 of VP16 is targeted to a specific chromosomal site. VP16, a transcription factor for the immediate early genes of the herpes simplex virus, contains a highly acidic COOH terminus (Triezenberg et al., 1988) that was shown to be an extremely potent transcriptional activator in mammalian cells (Sadowski et al., 1988). In yeast, GCN5, a histone acetyltransferase (Brownell et al., 1996), in conjunction with ADA2 and other proteins (Barlev et al., 1995; Candau et al., 1997; Grant et al., 1997), is required to obtain full activity of the VP16 AAD (Marcus et al., 1994). Moreover, the transcriptional activation activity of GCN5 correlates with its histone acetyltransferase activity (Kuo et al., 1998; Wang et al., 1998). Based on these findings the VP16 AAD is thought to act in part through the recruitment of a histone acetyltransferase at the activated site near the promoter region (Kuo et al., 1998). In addition, the VP16 AAD appears to interact with several other components of the transcriptional machinery, including TBP (Stringer et al., 1990), TAFII40 (Goodrich et al., 1993), TFIIH (Xiao et al., 1994), and TFIIB (Gupta et al., 1996).
To address what changes in large-scale chromatin organization are associated with VP16 binding, we took advantage of a new method for in situ localization of specific chromosome regions, based on lac operator–lac repressor recognition, which allows excellent preservation of nuclear and chromosomal ultrastructure and direct, in vivo visualization (Robinett et al., 1996; Belmont and Straight, 1998). By using a fusion protein between lac repressor and the VP16 AAD, we were able to target high concentrations of a transcriptional activation domain to specific chromosomal sites.
Materials and Methods
Tissue Culture
DG44 CHO cells with a double deletion for the dihydrofolate reductase (DHFR) locus (Urlaub et al., 1986) were transfected with pSV2-DHFR-8.32, containing 256 copies of the lac operator sequence (Robinett et al., 1996), and grown in selective media consisting of Ham's F12 media without thymidine and hypoxanthine (Specialty Media or GIBCO BRL) and dialyzed FCS (Hyclone Laboratories, Inc.). The A03_1 cell line was subcloned from cells that underwent gene amplification in increasing concentrations of methotrexate (MTX) (Li et al., 1998). The D11-1 clone was obtained in a similar way but no gene amplification was performed; the D11-1 clone was isolated after transfection with a modified pSV2-DHFR-8.32 vector containing scaffold-associated sequences flanking the DHFR gene. Transient transfection using Lipofectamine (GIBCO BRL) was done on cells plated 48 h earlier on 18-mm square glass coverslips in 35-mm petri dishes. Media were changed after 24 h and cells were stained and visualized 48–72 h after transfection.
Plasmid Construction
For initial experiments we used LAP348, a plasmid expressing the wild-type lac repressor fused with the AAD of VP16 and a nuclear localization signal (NLS) (Labow et al., 1990). Corresponding control experiments used p3′SS, an expression vector expressing the wild-type lac repressor fused with just an NLS (Fieck et al., 1992). Later experiments used fusion proteins with a five amino acid COOH-terminal deletion of the lac repressor that forms dimers rather than tetramers (Chen and Matthews, 1992). Construction of this p3′SS-dimer lac repressor plasmid and a derivative with an S65T green fluorescent protein (IGFP) fusion is described elsewhere (Robinett et al., 1996). To make an analogous dimer construct containing the AAD of VP16, PCR was performed on LAP348 to use the BstII site in the lac repressor sequence and change the carboxyl end of the repressor sequence to have the five amino acid deletion and the linker with SauI. The BstEII–SauI PCR fragment containing the VP16 AAD was ligated into the BstEII-SauI sites of the p3′SS-IGFP-dimer lac repressor plasmid, to give the p3′SS-IGFP-dimer lac repressor-VP16 plasmid. From this plasmid, the BstEII–StuI fragment containing the VP16 AAD and truncated carboxyl end of lac repressor was ligated into the BstEII-StuI sites of the p3′SS-dimer lac repressor plasmid to make the p3′SS-dimer lac repressor-VP16 plasmid without the GFP.
We modified all original vectors containing the fusion with the IGFP to have a new form, enhanced green fluorescent protein (EGFP) (CLONTECH), which contains an additional mutation (Phe64→ Leu) and changes in codon usage. To make the p3′SS-EGFP-dimer lac repressor construct, p3′SS-IGFP-dimer lac repressor was cut with XhoI and AseI (blunted) to include the IGFP-lac repressor-NLS regions. This fragment was ligated into the XhoI-SmaI sites of pCIneo (Promega) resulting in pCI neo IGFP-dimer lac repressor. Replacement of the IGFP sequence with EGFP was accomplished by using PCR to amplify the EGFP coding sequence, adding XhoI and EcoRI restriction sites at its ends. This was then inserted between the unique XhoI and EcoRI sites of pCI neo IGFP-dimer lac repressor, creating pCI neo EGFP-dimer lac repressor. To replace IGFP with EGFP in the p3′SS plasmids, the XhoI–EcoRV fragment from pCI neo EGFP-dimer lac repressor, containing EGFP linker and part of the lac repressor, was used to replace the corresponding Xho1– EcoRV fragment in the p3′SS IGFP-dimer lac repressor constructs, creating p3′SS-EGFP-dimer lac repressor and p3′SS-EGFP-dimer lac repressor-VP16 constructs.
To make the pET28b EGFP-dimer lac repressor-VP16 construct, the p3′SS-EGFP-dimer lac repressor-VP16–containing vector was digested with DraI and XhoI. The pET28b plasmid (Novagen) was digested with NotI and nucleotides were filled in with Klenow to give blunt ends followed by digestion with SalI. The DraI-XhoI 2,385-kb DNA fragment was ligated in the sites created by the modification of pET 28b described above.
Protein Purification
The EGFP-dimer lac repressor-VP16 fusion protein was cloned into the pET28b vector next to a 6xHis tag. The fusion protein was purified from BL21 Escherichia coli cells 3 h after induction with isopropyl-1-thio-β-d-galactopyranoside at 32°C by passing the supernatant from a cell lysate over a nickel metal chelation resin (CLONTECH). The purity of the protein was assayed on a silver-stained SDS-PAGE and found to be ∼80–90%. The protein was stored in injection buffer (90 mM KCl, 10 mM NaH2PO4, pH 7.4) at −80°C and thawed immediately before microinjection.
Microinjection and Live Observation
Microinjection was done following a standard procedure. Cells were plated in 35-mm ΔT3 dishes (Bioptics) 2 d before microinjection and were observed with an inverted light microscope (IMT-2; Olympus America, Inc.) equipped with a cooled, slow-scan CCD camera (Photometric). Microinjection was performed on cells kept at 37°C in a ΔT3 system (Bioptics). Micropipettes from borosilicate capillary tubes containing a filament were made using a micropipette puller (P-97; Sutter Instruments Co.). Protein was prepared for microinjection at an appropriate dilution in injection buffer by microcentrifugation at 265,000 g for 10 min just before microinjection. Injections were performed with a micromanipulator (MO-204; Narishige) and a Nikon microinjector. After microinjection, the cells were either returned to the incubator or kept on the microscope for in vivo observations. In vivo observations were performed for a maximum of 6–7 h using conditioned media. The pH was maintained constant by hermetically sealing the ΔT3 dish. The media were replaced after 3 h. For the 19-h live observation, cells were returned to the incubator between image collection.
Labeling and Detection of Br-RNA
Loading of the labeled nucleotide BrUTP was done by two methods: microinjection or lipid-mediated transfection. BrUTP sodium salt (Sigma Chemical Co.) was microinjected into normal or α-amanitin–treated A03_1 cells. Cells were grown as described above and microinjected using a solution of 35 mM BrUTP in injection buffer. Cells were returned to the incubator for 15 min before fixation.
For lipid-mediated delivery, A03_1 cells were grown on coverslips for 1 d and transfected with the EGFP-dimer lac repressor-VP16 using the FuGENE6 (Boehringer Mannheim) transfection reagent. We followed the manufacturer's instructions, but used 1 μg of DNA and 5 μl FuGENE6 transfection reagent for a 35-mm petri dish. 2 d later, cells were transfected again with BrUTP using the DOTAP (Boehringer Mannheim) transfection reagent. 30 μl DOTAP was mixed with 70 μl Hepes, 20 mM FuGENE6, pH 7.4, and mixed with a 100-μl solution of 7.4 mM BrUTP in 20 mM Hepes, pH 7.4; the lipid–nucleotide complexes were allowed to form at room temperature for 15 min. Cells on 18-mm square coverslips were removed from the growth medium, washed in PBS, overlaid with 100 μl of the lipid–BrUTP mixture, and returned to the incubator for 15 min. Cells were washed in PBS, returned to the dishes containing the cell media, and further grown for 1 h. After either microinjection or transfection of the BrUTP, cells were fixed and stained as described below.
Immunostaining, Microscopy, and Image Processing
Immunofluorescence staining and light microscopy were essentially performed as previously described (Robinett et al., 1996). Double staining with primary antibodies against lac repressor (mouse) at a 1:1,000 dilution and acetylated histones (rabbit) (Serotec Inc., and a gift from David Allis, University of Virginia, HSC [H3 and H4]) at the following dilutions: 1:1,000 for acetylated H4, acetylated H4 at Lys 5, 8, or 16, acetylated H3, and acetylated H2A; and 1:500 for acetylated H4 at Lys 12 and acetylated H2B. A different double staining was done for the lac repressor (rabbit) at 1:1,000 to 1:100,000 dilution and anti–SM-100 (human) diluted 1:1,000, U2B diluted 1:10, nucleophosmin diluted 1:30, or fibrillarin (all three mouse) diluted 1:50. This was followed by incubation with anti–rabbit or anti–human antibodies conjugated with Texas red and anti–mouse antibody conjugated with FITC or Texas red (Jackson ImmunoResearch Laboratories, Inc.). We used 4′,6-diamidino-2-phenylindole (DAPI) as a DNA specific stain.
We used the same conditions for bromouridine staining with the following modifications. Before staining, cells were fixed 20–45 min in 1.6% paraformaldehyde in PBS at room temperature. We used a 1:40 dilution of the mouse antibromouridine antibody (Boehringer Mannheim) and a 1:1,000 dilution of a Texas red–conjugated anti-mouse secondary antibody (Jackson ImmunoResearch Laboratories, Inc.).
Primary antibodies for hGCN5 and hP/CAF (Santa-Cruz Biotechnology) were diluted 1:400 in PBS plus 3% donkey serum and 0.1% Triton X-100, and used on cells fixed either 10 min in 1.6% formaldehyde or first extracted in 0.1% Triton X-100 in PBS* (5 mM MgCl2 and 0.1 mM EDTA in PBS) before fixation with 1.6% formaldehyde in PBS*. A blocking step in 10% donkey serum for 1 h at room temperature was used before application of the primary antibodies. We used 24 h incubation at 4°C for both the primary and secondary antibodies or incubation at room temperature, 6 h for the primary and 2 h for the secondary. The secondary antibody was donkey anti–goat IgG labeled with the red fluorophore (Alexa 594; Molecular Probes, Inc.). All other staining steps were identical to the staining procedure described before (Li et al., 1998).
Images were collected as optical sections using the Resolve3D data collection program (Applied Precision Inc.) with a fluorescence microscope essentially the same as the one built by Drs. Agard and Sedat at UCSF (Hiraoka et al., 1991). The optical sections were deconvolved using an iterative constrained deconvolution algorithm (Agard, 1989).
Details on the immunogold labeling and electron microscopy are found elsewhere (Robinett et al., 1996). In brief, transfected cells were fixed without permeabilization for 2–4 h in 1.6% freshly prepared paraformaldehyde in calcium and magnesium-free PBS. To increase staining, we used long incubation times (21 h) at 4°C in a wet chamber for both primary and secondary antibodies. Similar staining conditions were used as for the immunofluorescence experiments, but the secondary antibody was coupled to a new, improved water soluble form of Nanoprobe, containing a 1.4-nm gold particle (a gift from Dr. Richard Powell, Nanoprobe). Silver enhancement, dehydration, and embedding, as well as lead citrate and uranyl acetate staining on freshly cut Epon sections were done as described (Robinett et al., 1996), but a double silver enhancement was performed instead of a single procedure. Thick sections (0.4 mm) were examined using a transmission electron microscope (TEM) (Phillips CM200; Phillips Electronic Instruments, Inc.) at 200 kV. We displayed the images using the program NewVision (Pixton and Belmont, 1996) on an SGI 4D/35 TG and assembled the selected images into figures using Adobe Photoshop.
Results
Striking Decondensation of a Heterochromatic Homogeneously Staining Region (HSR) Induced by VP16 AAD
To examine the effects of targeting the VP16 AAD to specific chromosomal regions, we began by using the A03_1 CHO cell line containing an ∼90-Mbp amplified chromosome region (Li et al., 1998); because this heterochromatic amplified chromosome region is normally highly condensed, a decondensation in large-scale chromatin structure would be easier to detect. This cell line was created in two steps. CHO DG44 cells, with a double deletion of the DHFR gene, were transfected with a DHFR expression vector containing 256 direct repeats of the lac operator and stable transformants were selected. This was followed by gene amplification using stepwise increased concentrations of the DHFR inhibitor, MTX, to select cells that had formed chromosomal amplified regions, or HSRs (Robinett et al., 1996).
The cell clone A03_1, selected at 0.3 μM MTX, was found to contain a single, late replicating, heterochromatic HSR, stable in size and chromosome location (Li et al., 1998). A careful cell cycle analysis revealed that the A03_1 HSR appears by light microscopy as a peripherally located, compact mass, 0.5–1.0 μm in diameter, throughout most of interphase. During a several hour period in middle to late S phase the HSR decondenses, increasing its diameter to ∼2 μm, and moves away from the nuclear periphery to the nuclear interior. This decondensation and movement is correlated with HSR DNA replication (Li et al., 1998).
We transfected A03_1 cells with either the vector LAP348 (Labow et al., 1990), expressing the lac repressor-VP16 AAD-NLS fusion protein, or p3′SS, expressing the lac repressor-NLS fusion protein (Fieck et al., 1992). In these initial experiments, immunofluorescence staining with an anti–lac repressor primary antibody was used to visualize the HSR. Two types of novel decondensed structures were seen 24–72 h after transient transfection with the lac repressor-VP16 fusion protein but not with the lac repressor control: (1) a greatly enlarged HSR with fibrillar substructure occupying a large fraction of the nucleus (Fig. 1 D); (2) a ball-like structure, ∼1–3 μm in diameter, with peripheral repressor staining surrounding a spherical volume, devoid of internal DAPI staining (Fig. 1 C).
Figure 1.

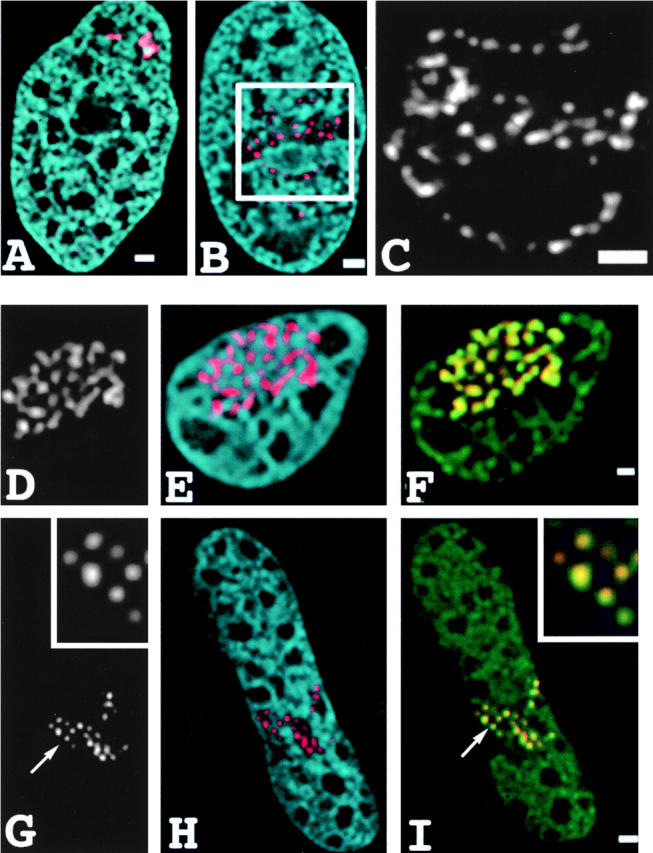
Large-scale chromatin decondensation after VP16 AAD targeting. A03_1 cells containing a heterochromatic HSR were transiently transfected with either the control p3′SS-dimer lac repressor expression vector (A) or the LAP348 lac repressor-VP16 AAD fusion protein construct (B–D) and immunostained for lac repressor (red) and counterstained for DNA with DAPI (blue). Three HSR conformations were observed (Table I): condensed HSRs (B) similar to the controls (A); large, ball-shaped structures with peripheral repressor staining and centers devoid of DAPI staining (C); and open, fibrillar HSRs (D). The same conformations (E–H) were observed directly in living cells after transfection with corresponding GFP fusion constructs, EGFP-dimer lac repressor (E) and EGFP-dimer lac repressor-VP16 (F–H). Bar, 1 μm.
The extent of HSR decondensation in the first structure is well beyond that seen even during the HSRs decondensation during late S phase. For the purpose of statistical comparisons, we classified a given HSR in this first conformation if its projected area exceeded 2% of the total nuclear area. Over 40% of nuclei fell into this category (Table I) after transfection with the lac repressor-VP16 fusion protein construct versus 0% (0/55) after the control transfection expressing lac repressor. The second ball structure is qualitatively distinct from any conformational stage seen during an extensive study of the HSR cell cycle dynamics. 72 h after transient transfection of the lac repressor-VP16 construct using Lipofectamine, 25% of nuclei contained decondensed HSRs in this category; none were observed in control experiments. Compact HSRs (Fig. 1 B) similar to those observed in control cells (Fig. 1 A) were observed in the remaining nuclei (32%). This compact morphology may be the result of a lower expression of lac repressor-VP16 in these cells and/or a cell cycle dependence for decondensation.
Table I.
Decondensation of A03_1 HSR Takes Place in a Majority of the Transfected Nuclei
| Vector DNA | Total No. of nuclei | Percent fibrillar structure | Percent ball structure | Percent compact structure | ||||
|---|---|---|---|---|---|---|---|---|
| Tetramer | ||||||||
| lacI-VP16 | 118 | 43 | 25 | 32 | ||||
| Tetramer | ||||||||
| lacI | 55 | 0 | 0 | 100 | ||||
| Dimer | ||||||||
| lacI-VP16 | 64 | 51 | 10 | 39 | ||||
| Dimer | ||||||||
| lacI | 59 | 0 | 0 | 100 |
Data are from two independent experiments using the vector DNA indicated.
The wild-type lac repressor forms a tetramer capable of binding two operators, raising the concern that bivalent lac repressor binding might influence the observed structures (Robinett et al., 1996; Straight et al., 1996). However, a similar HSR decondensation was also observed after transient transfection with the dimer form of the lac repressor-VP16 fusion protein construct (Table I). To verify that the decondensed HSR conformations were not altered by our fixation and immunostaining procedures, we performed control experiments using transient transfection with constructs coding for the EGFP-dimer repressor-VP16 AAD and EGFP-dimer repressor fusion proteins. Direct in vivo visualization revealed analogous decondensed HSR structures as seen after immunostaining (Fig. 1, G and H).
Unfolding of Heterochromatic HSR into Extended, Large-Scale Chromatin Fibers
The observed decondensation is best described in terms of an unfolding and straightening of a large-scale chromatin fiber, forming enlarged HSR areas with extended fibers occupying up to 1/3–1/2 of the nuclear cross-sectional area (Figs. 1 D, 2 A, and 7 E). This fiberlike nature is more clearly demonstrated by serial optical sections (Fig. 2 A) and stereopairs (data not shown) generated from the deconvolved three-dimensional optical data sets. A small fraction of nuclei shows such extremely extended fibers that it is possible to estimate the total contour length from just a few optical sections (Fig. 2 A), allowing calculation of the fiber compaction ratio. We measured the length for five such examples, obtaining values ranging from 25–40 μm with an ∼30-μm mean. The HSR size was previously estimated as 93 ± 10 Mbp, based on the ratio between the average HSR length relative to the total chromosome lengths within metaphase spreads (Li et al., 1998). Together these measurements yield an ∼1,000:1 packing ratio for these extended fibers, well above the ∼40:1 ratio predicted for the 30-nm chromatin fiber. This measured value is in the hundreds to thousands compaction ratio range reported previously by fluorescence in situ hybridization studies for probes in the dystrophin gene (Lawrence et al., 1990). Higher resolution imaging was provided by TEM on preembedded immunogold stained specimens. Within 0.4-μm-thick sections, fiber segments with a length of 0.4–1.0 μm and diameter of ∼80–100 nm were visualized.
Figure 2.

Unfolding of heterochromatic HSR into extended, large-scale chromatin fibers. (A) DAPI (blue) and repressor staining (red) of a highly decondensed HSR. Deconvolved optical sections of the HSR repressor staining clearly demonstrate its fibrillar composition (relative focus offsets are provided in micrometers). The length of the extended fiber in this and similar examples was 25–40 μm, yielding a compaction ratio of ∼1,000:1. (B) In immunogold staining, 0.4-μm-thick sections were visualized in a 200 kV TEM. Arrow points to short fiber segment, ∼80–100 nm diam. Bars, 1 μm.
Remodeling of Large-Scale Chromatin Fibers into a Novel Subnuclear Domain
The second ball-shaped decondensed structure, typically seen in 10–30% of cells after transient repressor-VP16 expression, is a qualitatively distinct conformation, different than anything that has been observed previously in many HSR-containing cell lines. The structure shows surprisingly little deviation from a spherical shape, and is distinguished as well by the peripheral localization of lac repressor staining. In midoptical sections, the repressor staining appears as a ring of punctate staining (Fig. 3, A, E, F, and G), whereas grazing optical sections show fibrillar staining (Fig. 3 C), suggesting a wrapping of chromonema fibers over a spherical surface. This impression was supported by higher resolution TEM images of immunogold-stained sections (Fig. 3, B and D). Serial semi-thick sections through an entire ball-shaped structure supported this interpretation as well as demonstrating the separation of this structure from the nuclear envelope (data not shown).
Figure 3.

Remodeling of large-scale fibers into a novel subnuclear domain and recruitment of splicing factors and nucleophosmin. Mid- and grazing views reveal large-scale chromatin fibers folding on nuclear inclusion surface. (A and C) Mid- and grazing deconvolved optical sections, respectively, of repressor staining after transfection of A03_1 cells with repressor-VP16 construct. (B and D) Analogous TEM immunogold repressor staining in 0.4-μm-thick sections. (B) Cross-section showing peripheral repressor staining surrounding ball-shaped inclusion with distinctive, internal staining texture. (D) Grazing section contrast enhanced and thresholded to selectively visualize fibrillar immunogold staining. (E) Recruitment of nucleophosmin (green), into a ball-shaped structure with concentration in a concentric ring underlying peripheral repressor staining. (F) Absence of fibrillarin (green) in the ball-shaped structure. (G) Combined repressor staining (red) and antisplicing factor SM-100 (light blue) for the ball-shaped structure. (H) Splicing factor staining alone. SM-100 staining colocalizes with peripheral ring of repressor staining, demonstrating extensive recruitment of splicing factors to the amplified chromosome region. Note the clustering of SM-100 speckles that appear to connect via bridges to the ring of repressor staining. Bars, 1 μm.
One possibility we considered was that this ball-shaped HSR arises from the recruitment of splicing factors, generating an unusually large interchromatin granule cluster with the decondensed HSR wrapping around its periphery. However, staining A03_1 cells transiently expressing the lac repressor-VP16 fusion protein with antibodies to the U2B and SM-100 splicing factors instead showed a greatly increased but peripheral staining, colocalizing extensively with the lac repressor staining, but leaving the center unstained (Fig. 3, G and H). This distribution is consistent with a VP16 AAD–induced, enhanced transcription of the intron-containing DHFR construct, with a concomitant recruitment of splicing factors. In a number of examples, interchromatin granule clusters adjacent to the ball-shaped structure appeared connected to the peripheral ring of repressor and splicing factor staining by a bridge of concentrated splicing factors (Fig. 3 H). This is consistent with previous experimental work suggesting a dynamic redistribution of splicing factors and spatially organized targeting mechanisms (Misteli et al., 1997). No accumulation of splicing factors near the A03_1 HSR was seen with the control lac repressor construct without the VP16 AAD fusion (data not shown).
A second possibility was that the ball-shaped structure might represent a wrapping of the decondensed HSR around a nucleolus. A transient attachment of the A03_1 HSR adjacent to nucleoli has been seen during middle to late S phase during HSR replication (Li et al., 1998). We stained A03_1 cells transiently transfected with lac repressor-VP16 with antibodies against fibrillarin or nucleophosmin, two different nucleolar-associated proteins. Fibrillarin immunostaining showed nucleolar localization, as expected, but no association with the ball structure in 29/30 nuclei (Fig. 3 F); moreover, the shape of the nucleolar staining is distinctly less round than the ball-shaped structure. TEM shows distinct textures of uranyl and lead staining in the center of the ball structure and immediately underlying the peripheral lac repressor staining (Fig. 3 B), different from the nucleolar staining appearance. Based on these results, we conclude that these special ball-shaped structures cannot be attributed to a wrapping of a decondensed HSR around a preexisting nucleolus.
Interestingly, nucleophosmin immunostaining showed a distinct ring, immediately concentric to the peripheral repressor staining, in 13/17 nuclei containing the ball-shaped structure. In some nuclei the nucleophosmin staining is concentrated inside the ball and is not present at any other sites, whereas in other nuclei both the ball-shaped HSR and nucleoli are stained (Fig. 3 E); an apparent decrease in nucleolar staining in cells showing bright staining within the ball-shaped structure suggested a recruitment of nucleophosmin away from nucleoli. Nucleophosmin is thought to be involved in ribosomal assembly and binds the 45S RNA in humans (Chan, 1992).
This peculiar ball-shaped conformation was not specific to the A03_1 cell line but was also found in the D11-1 cells (see below) at comparable frequency. The frequency of the ball-shaped structures is dependent on the transfection method used for transient expression. The FuGENE6 reagent showed greatly reduced frequency of this structure over Lipofectamine (data not shown).
We conclude that the ball-shaped conformation demonstrates a novel remodeling of a chromosome region, including polarized recruitment of splicing factors and nucleophosmin, which is induced by high concentrations of VP16, possibly as a result of increased transcriptional activity. Curiously, the closest analogous intranuclear structures previously described are the ball-shaped inclusions seen in nuclei after expression of the Huntingtin or ataxin-3 proteins with polyglutamate expansion (DiFiglia et al., 1997; Paulson et al., 1997). Whether there is any structural or functional relationship between these structures is currently being tested. The recruitment of locally high concentrations of transcription factors might lead to precipitation of wild-type proteins analogous to the aggregation seen with mutant proteins containing expanded polyglutamate repeats. Alternatively, these structures might represent exaggerated accumulations and self-assembly of nuclear proteins normally recruited at lower levels to active sites.
Large-Scale Chromatin Decondensation Begins Minutes after VP16 Targeting and Continues over Several Hours
The previous results were obtained 1–3 d after transient transfection. To establish the temporal sequence and identify the intermediates of the HSR decondensation, we directly observed the HSR conformation in living A03_1 cells after microinjection of purified EGFP-lac repressor-VP16. Roughly 10–15 min was required to visualize significant levels of microinjected protein transported into the nucleus. To allow visualization of the earliest stages of decondensation, we used A03_1 cells that stably expressed low levels of EGFP-lac repressor. Beginning within 15 min after injection, a noticeable increase in HSR size is observed (Fig. 4). Further increases in size and appearance of internal fibrillar substructure take place over the next several hours. For technical reasons, these in vivo observations were made using a low NA dry lens. After fixing the sample, higher resolution data were acquired by optical sectioning using a high NA oil lens followed by deconvolution. Fibrillar substructure is clearly seen in these deconvolved images (Fig. 4, top and middle).
Figure 4.

Unfolding begins minutes after VP16 targeting and continues over several hours. Cells expressing GFP-repressor were injected with GFP-repressor-VP16. In vivo observations were made using lower magnification; after fixation, samples were optically sectioned using a high NA lens and the data deconvolved. Formation of the fibrillar (top and middle) structures takes place through an initial increase in size in the first couple of hours after microinjection followed by progressive expansion of the chromonema fibers. A similar expansion occurs for the ball structure (bottom). 8 h after microinjection, the precursor of the ball-like structure suggests a polar distribution of the EGFP-lac repressor-VP16 toward the periphery of the structure. The ball-shaped structure formed in less than 19 h after microinjection. Bars, 1 μm.
In roughly one-third of the microinjected cells, the HSR assumes a ball-shaped structure. This appears to occur through a similar increase in HSR size, as described above, followed by the accumulation of an optically dense material in the middle of the decondensed HSR. The final form of the ball-like structure, showing fibers wrapped around a spherical structure, occurs within 10–19 h after microinjection of the EGFP-lac repressor-VP16 fusion protein (Fig. 4, bottom).
Large-Scale Chromatin Decondensation Occurs in the Absence of Transcription
The mechanism of large-scale chromatin unfolding may involve one or more determinant factors. The simplest explanation would be that the observed A03_1 HSR decondensation is a consequence of transcription per se. Decondensation of 30-nm chromatin fibers and loss of nucleosome structure over the Balbiani ring genes in Chironimus polytene chromosome puffs requires maintenance of high levels of transcriptional activity (Daneholt, 1992). We first wanted to determine whether VP16 targeting increased transcriptional activity. If that was the case, we would next inhibit RNA polymerase II to determine whether changes in large-scale structure occurred in the absence of ongoing transcription.
An indirect indication that the VP16 targeted chromosome site is transcriptionally active came from our observation of recruitment of splicing factors to the ball-shaped HSRs (Fig. 3, G and H) and to the fibrillar extended HSRs (data not shown). To directly verify whether VP16 increased transcription to the targeted chromosome site we used BrUTP incorporation followed by antibromodeoxyuridine immunostaining to detect newly synthesized RNA (Wansink et al., 1993).
Transient transfection of A03_1 cells with the EGFP-repressor-VP16 construct was followed 2 d later with introduction of BrUTP into cells by DOTAP for 15 min followed by a 1-h chase. Control experiments using α-amanitin to inhibit transcription verified that this nuclear staining was dependent on RNA pol 2 activity (see below). Only a low percentage of cells was exposed to BrUTP by this liposome introduction method, as determined by nuclear antibromouridine staining, and a much smaller number of cells both expressed the GFP-repressor-VP16 fusion protein and showed incorporation of BrUTP. 60% of cells (6/10) showing both EGFP-dimer lac repressor-VP16 expression and bromouridine incorporation also showed a bright bromouridine signal colocalizing with the A03_1 HSR (Fig. 5). In these cells, the staining partially overlaps the actual lac repressor staining, with the remainder accumulated adjacent to the repressor staining. BrUTP labeling of control A03_1 cells expressing the GFP-lac repressor fusion protein did not show this bright BrUTP staining adjacent to the HSR in any of the cells (data not shown).
Figure 5.

VP16 targeting is accompanied by transcriptional activation. A03_1 cells were transiently transfected with DNA constructs containing EGFP-dimer lac repressor-VP16 (C), followed by lipid-mediated BrUTP delivery in intact cells and immunostaining for bromouridine (A). The two patterns superimposed showed a high signal of the RNA staining partially overlapping and adjacent to the EGFP-dimer lac repressor-VP16 signal over the A03_1 HSR (B).
To determine whether the large-scale decondensation observed for the A03_1 HSR was simply a consequence of increased transcriptional activity, we used α-amanitin to inhibit RNA Pol II. Previous results have shown that amanitin induces the degradation of RNA polymerase II large subunit (Nguyen et al., 1996).
First, we tested whether the fibrillar structures formed after the VP16 targeting require active RNA Pol II to maintain their highly extended conformation. Cells were treated with α-amanitin 3 d after transient transfection with the EGFP-dimer lac repressor-VP16. Control experiments using BrUTP incorporation showed that this treatment eliminated nuclear BrUTP incorporation everywhere except the nucleoli (at the concentrations of α-amanitin we used, PolII but not PolI transcription is inhibited). These experiments showed stable, decondensed fibrillar structures after up to 24 h continuous exposure to α-amanitin (Fig. 6, top). There did appear to be some degree of local refolding, with a reduction in the number of the most highly extended HSR conformations. Whether this was due to a partial role of ongoing transcription in maintaining a maximally decondensed HSR, or rather reflected a global effect on large-scale chromatin condensation because of long term α-amanitin treatment, was not clear.
Figure 6.

Large-scale chromatin unfolding is independent of transcription. (Top) α-Amanitin exposure up to 24 h of A03_1 cells transfected with the EGFP-dimer lac repressor-VP16 shows fibrillar structures in the absence of ongoing transcription. Some local refolding with the formation of an apparently thicker chromatin fiber occurred in regions. (Middle) Decondensation of the A03_1 HSR was seen after microinjection of the EGFP-dimer lac repressor-VP16 in A03_1 cells previously exposed to α-amanitin for 4 h to inhibit RNA polymerase II. (Bottom) Cells treated with α-amanitin and normal cells were subjected to BrUTP microinjection and antibromouridine immunostaining to verify Pol II inhibition by α-amanitin. Note the strong nuclear staining in untreated cells (left) versus nucleolar and cytoplasmic staining in cells treated with α-amanitin (right). The BrUTP signal in treated cells is severalfold less bright than the nuclear staining in normal cells but it has been enhanced for photographic purposes. Bars, 1 μm.
Second, we asked whether the initial opening of the HSR required active RNA Pol II. Therefore, we inhibited transcription of A03_1 cells for 4 h in 100 μg/ml α-amanitin before the microinjection of the lac repressor-EGFP-VP16. A similar degree of HSR decondensation (Fig. 6, middle) was observed in the presence or absence of amanitin (five microinjected cells under same conditions that α-amanitin control was performed (see below), and >50 microinjected cells for several similar experimental conditions). To check the effectiveness of the α-amanitin inhibition, cells were microinjected with BrUTP and immunostained to assay BrUTP incorporation. A faint antibromouridine immunostaining signal appeared only over the cytoplasm and nucleoli, showing that Pol II but not Pol I was inhibited (Fig. 6, bottom). These experiments clearly demonstrate that the decondensation of large-scale chromatin structure is not merely a consequence of ongoing transcription.
Propagation of Large-Scale Chromatin Unfolding over Large Genomic Distances
Previous work has indicated that the A03_1 HSR contains ∼400 kb vector concatemers (with several minor populations from 500–1,000 kb) flanked by large regions of coamplified genomic DNA, averaging 1,000 kb in size (Li et al., 1998). Our observation of extended structures, therefore, implies a straightening of a fiber that includes the 1,000-kb flanking regions. Light microscopy images of highly extended fibers within the HSR after VP16 targeting are suggestive of variations in repressor staining intensity on a size scale of a few tenths of a micrometer along the fiber length, but do not contain clearly visible gaps in repressor staining. This is expected given that the estimated 1,000:1 compaction ratio predicts a fiber length of 0.3 μm for these 1,000-kb flanking regions, which is small relative to the ∼0.25 μm halfwidth of the microscope point spread function.
To demonstrate this propagation phenomenon more clearly, we used a different cell line cloned from an independent stable transformation of the DHFR expression vector containing the operator repeats. The D11-1 clone was isolated after transformation and before any MTX selection; it contains one large and one small chromosomal region containing lac operator repeats; pulse field gel analysis, however, indicates that these regions contain vector concatemers less than several hundred kilobases in size (Strukov, Y., and A. Belmont, unpublished data). Both regions appear normally as condensed, compact masses (Fig. 7 A). Transient expression of the repressor-VP16 fusion protein leads to extensive large-scale chromatin decondensation of these chromosome regions, but in these D11-1 chromosome regions the vector concatemer insertion sites appear as spatially distinct staining segments, separated by clear gaps corresponding to flanking genomic DNA (Fig. 7, B and C).
Figure 7.
Propagation of changes in large-scale chromatin structure over large genomic distance and colocalization with histone acetylation. (A–C) Decondensation of the D11-1 amplified chromosome region after repressor-VP16 targeting. (A) Control conformation after transfection with dimer lac repressor construct. Lac repressor staining (red) reveals two compact chromosome regions, the larger roughly comparable in size to the A03_1 HSR. DAPI staining is blue. (B) Both regions show extensive decondensation with large gaps in lac staining pattern after transfection with lac repressor-VP16 construct (LAP348). (C) Enlarged view from B reveals linear arrays of repressor-stained spots spaced by large unstained gaps corresponding to flanking genomic DNA. Colocalization of histone hyperacetylation and repressor-VP16 for the A03_1 HSR (D–F) and the D11-1 amplified chromosome region (G–I). Cells were transfected with LAP 348 (A03) or EGFP-dimer lac repressor-VP16 (D11-1) and double-stained using antirepressor antibodies (red) and antiacetylated histone H4 (green). (D and G) repressor signal alone; (E and H) DAPI signal (blue) merged with repressor signal (red); and (F and I) repressor signal (red) merged with acetylated histone H4 signal (green). Extensive colocalization of repressor-VP16 and histone hyperacetylation is seen; however, histone hyperlocalization does not spread across gaps in repressor staining. Bars, 1 μm.
The linear arrangement of these stained segments and gaps demonstrates that the extension and straightening of the large-scale chromatin fiber is not a local event, confined to regions of lac repressor-VP16 targeting, but instead involves the entire chromosome region including the flanking, coamplified DNA. If these flanking regions were packaged as extended 30 nm fibers, the ∼0.5-μm gaps would correspond to at least 60 kb of DNA. The fiber extension relative to the original size of the amplified chromosome region appears roughly comparable to that seen with the A03_1 HSR. In this case, if the flanking regions are packaged into similar large-scale chromatin fibers as observed for the A03_1 HSR, and for bulk chromatin (Belmont et al., 1994), then this implies propagation over hundreds to thousands of kilobases.
VP16 Targeting Is Accompanied by Histone Hyperacetylation and Recruitment of HATs
To further investigate the mechanism of HSR unfolding we examined the state of histone acetylation, which has long been linked with transcriptional activation. As mentioned in the introduction, genetic experiments in yeast combined with biochemical studies showed that the VP16 AAD can recruit the GCN5 histone acetyltransferase in a complex containing ADA proteins known as the SAGA HAT system (Utley et al., 1998). The recruitment of this protein complex at the VP16 targeted HSR would produce a specific pattern of histone hyperacetylation.
To test if VP16 AAD targeting induces an increase in histone acetylation, A03_1 cells expressing the EGFP-dimer lac repressor-VP16 were stained with polyclonal antibodies reacting against all isoforms of acetylated histone H3, H4, and H2B, and against H2A acetylated at Lys5. To examine the acetylation pattern in even more detail, we used immunostaining with mAbs recognizing specifically each of the four different monoacetylated histone H4 isoforms (Lys 5, Lys 8, Lys 12, and Lys 16). The results of our immunostaining experiments were striking. An increase in histone acetylation signal, severalfold above the overall bulk chromatin staining (Fig. 7, F and I, and Fig. 8) was seen with all polyclonal antibodies used, suggesting that all core histones are hyperacetylated by the VP16 AAD targeting. This intense acetylation was observed in all HSR conformations including the condensed structures. The specific lysine residues of histone H4 that show an increase in acetylation at the HSR are lysines 5 and 12 and very weakly lysine 16. A qualitative summary of the data is found in Fig. 8 A. In control cells expressing the GFP-lac repressor, none of the antibodies showed an increased signal over the HSR with the exception of 10/45 (22%) cells stained with the antihistone H4 acetylated at Lys5 (3/45 well above background, 7/45 above background).
Figure 8.

VP16 targeting is accompanied by histone hyperacetylation and recruitment of histone acetyltransferases. A03_1 cells were transfected with a DNA construct containing the fusion EGFP-lac repressor-VP16 and than immunostained. (A) Percent of cells (y axis) that show a clear, bright histone acetylation signal, well above background, at the HSR (black), weaker hyperacetylation (gray) in which the acetylated histone fluorescent signal over the HSR was less pronounced but still above background, and no hyperacetylation (white) in which the staining pattern is completely uniform throughout the nucleus or the signal is even lower over the HSR. These percentages are shown for different acetylated histones (x axis). K5, K12, K16, and K8 represent site-specific staining for these lysine residues of H4. The general nuclear staining quality of each antibody is represented by ++,+, 0, −, and −− signs below the x axis label: ++ is excellent and −− is very weak staining. The numbers at the top of bar graphs represent the number of cells examined for each antibody. Data are the sum of two independent experiments. (B) Immunostaining using antibodies raised against 16 and 18 amino acid peptides from the carboxyl and amino termini of hGCN5, the COOH terminus of P/CAF, and a 300–amino acid peptide of p300/CBP of A03_1 cells transfected with the EGFP-lac repressor-VP16 (bottom). The top represents the EGFP-lac repressor-VP16 signal. Arrows (bottom) show accumulation of acetyltransferases at the A03_1 HSR. Bar, 1 μm.
We emphasize that these results should be regarded as qualitative rather than quantitative. Small variations in staining might reflect subtle differences between antibodies rather than the actual acetylation state. In support of these experimental concerns came our findings that different antibodies raised to tetraacetylated H3 and H4 peptides in David Allis's laboratory gave a slightly different result. Identical results were obtained with the two different polyclonal H3 antibodies, but a stronger signal in a larger percentage of cells (23 out of 25) was obtained for the second acetylated H4 antibody used. However, gross differences in immunostaining of bulk chromatin among various antibodies did not correlate with the degree of hyperacetylation at the A03_1 HSR (Fig. 8 A). For example, the overall staining with the acetylated histone H3 antibody is poor in comparison with the acetylated H2A antibody, yet more cells showed a H3 hyperacetylated A03_1 HSR.
Two major results emerge from this data. First, the VP16 AAD targeting induces a strong increase in histone acetylation signal at the targeted chromosome site. Second, a strong hyperacetylation at H2A (Lys 5) and H4 is observed. This is inconsistent with the acetylation patterns observed for the ADA and SAGA GCN5 containing HAT complexes, which primarily show histone H3 and H2B acetylation (Grant et al., 1997). Taken together, our results suggest significant activity of at least one additional HAT besides the ADA and SAGA complexes, which would be responsible for the strong H4 and H2A acetylation. Free GCN5 can acetylate H4 at lysines 8 and 16 but prefers H3 (Kuo and Allis, 1998). Therefore, more specifically, at least one additional HAT complex is likely to rely on a catalytic domain other than GCN5, given the strong H2A acetylation and the strength and site specificity of the observed H4 acetylation.
To directly test for the recruitment of different HATs by the VP16 AAD at the A03_1 HSR, we stained with commercially available antibodies raised against the following: 18– and 16–amino acid peptides from the amino and carboxyl termini of human GCN5; a 16–amino acid peptide from the carboxyl terminus of P/CAF, a HAT highly homologous to GCN5; and a large domain of CBP/P300 that has HAT activity for all core histones and interacts with P/CAF (Kuo and Allis, 1998). An increased immunostaining coinciding with the HSR was seen in A03_1 cells expressing the EGFP-dimer lac repressor-VP16 for GCN5 (20/20 cells for the anti–COOH terminus antibody and 21/30 for anti–NH2 terminus antibody), P/CAF (12/30 cells), and p300/CBP (27/49 cells) (Fig. 8 B). A similar increase in signal was not observed in control cells expressing EGFP-dimer lac repressor (data not shown). The pattern of histone hyperacetylation observed in our system appears to be the result of the combined catalytic activity of several histone acetyltransferases, including GCN5, P/CAF, and p300/CBP, rather than the specific effect of a singular HAT. Recently, the VP16 activation domain has been shown to recruit the yeast NuA4 HAT complex that does not contain GCN5 (Utley et al., 1998) but does acetylate both H4 and H2A.
Interestingly, for both sets of antibodies against P/CAF and GCN5 we saw strong cytoplasmic staining in discrete spots in both CHO and HeLa cells. This pattern was seen with paraformaldehyde or methanol fixation, before or after detergent permeabilization, and is not observed with secondary antibody alone. We observed similar staining with two independent anti-GCN5 antibodies raised against different parts of the protein. The 16–amino acid peptide from the carboxyl region of GCN5 showed a dose-dependent blocking of the respective antibody staining, giving a pattern identical with the secondary alone. Considering these control experiments we believe that the observed cytoplasmic staining pattern is real and we are currently investigating its origins.
Histone acetylation over large chromatin domains has been seen for the globin locus (Hebbes et al., 1994). One possible explanation for the observed large-scale chromatin unfolding is a direct modulation of chromatin packing by the acetylation of core histone tails within the extended fibers. Antiacetylated histone H4 staining (using the antibody from David Allis) of the D11-1 cell line after expression of GFP-lac repressor-VP16 showed an intense acetylation signal colocalizing with bound repressor-VP16, but this increased histone acetylation did not propagate across large gaps in the lac repressor staining (Fig. 7 I). These results suggest that the observed propagation of large-scale chromatin decondensation is not simply a direct consequence of histone hyperacetylation.
Discussion
As summarized in the introduction, transcriptional activators can induce alterations of nucleosome structure but their effect on large-scale chromatin structure is poorly understood. We engineered a large heterochromatic chromosome amplified region containing repetitive DNA sequences that represented the target of an unusually strong viral transcriptional activator. The underlying rationale of this approach was to use this exaggerated, artificial system to amplify effects on large-scale chromatin structure induced by transcriptional activators to the extent that they could be easily analyzed in vivo at the single cell level by direct microscopy approaches. Observations of significant remodeling of large-scale chromatin structure induced by targeting of VP16 now provide an entry point into investigations of the relationship between transcriptional activation and large-scale chromatin architecture.
Large-Scale 100-nm Chromatin Fiber Is Consistent with the Chromonema Model for Interphase Chromatin Structure
Mitotic chromosomes are believed to form a radial loop– helical coil structure, a model based on a highly disruptive experimental approach involving histone extraction (Paulson and Laemmli, 1977; Rattner and Lin, 1985; Boy de la Tour and Laemmli, 1988). An extension of this model for interphase chromosomes postulates that heterochromatic regions maintain their metaphase conformation whereas euchromatic regions unfold from the 700-nm structures to 200–240-nm fibers that themselves are organized as radial loops of 30-nm fibers. These loops can be more compact or more extended as a function of their transcriptional activity (Manuelidis, 1990; Manuelidis and Chen, 1990).
More recently, light and electron microscopy visualization of chromatin at different stages during the mitotic and interphase cell cycle led us to propose a folded chromonema model based on ∼100-nm chromonema fibers formed by the compaction of 10-and 30-nm chromatin fibers (Belmont et al., 1989; Belmont and Bruce, 1994; Belmont, 1997). Because of the apparent tight folding, kinking, and supercoiling of these large-scale fibers, a clear, unambiguous demonstration of the distinct, fiberlike nature of these large-scale chromatin domains is provided only by a fraction of the total chromatin that exists as extended, spatially isolated fibers over ∼0.5–1.0-μm lengths. Our use of the lac operator-repressor system now supports the existence of these chromonema fibers in vivo (Robinett et al., 1996).
However, the difficulty of tracing chromonema fibers in the more compact folding patterns observed for the majority of chromosome regions raised questions about the generality of this folding motif. Because these fibers usually are tightly coiled, it is difficult to trace distinct fiber segments even for 0.5–2.0-μm lengths, particularly by light microscopy. The progressive unfolding of the A03_1 HSR and the very long, extended fibers observed in vivo after microinjection of the lac repressor-VP16 fusion protein provide additional strong support for the existence of chromonema fibers within the starting, condensed HSR conformation, and as a basic large-scale chromatin structural motif. Fibers arising from a 90-Mbp HSR could be visualized clearly for total lengths of 25–40 μm as distinct structures. These fibers had a compaction ratio of ∼1,000:1 consistent with the ∼80–100-nm diam visualized by immunogold EM staining. Our results provided a striking demonstration of the existence of distinct, large-scale chromonema fibers within supercoiled chromosomal regions in interphase nuclei.
On the Mechanism of Large-Scale Chromatin Unfolding
Dramatic modifications of large-scale chromatin structure by targeting large amounts of the VP16 transcriptional activator domain have been clearly demonstrated in our system. The molecular mechanism of these changes as well as the biological significance (see next subsection) are very complex questions that we are just beginning to address. Our demonstration that this large-scale chromatin decondensation does not require ongoing transcription rules out the possibility that the changes in structure are simply a result of chromatin modifications or DNA topological changes caused by RNA polymerase elongation. Instead, our results suggest that factors recruited by the VP16 AAD other than the polymerase itself lead to a significant reorganization of large-scale chromatin structure.
Targeting of the VP16 AAD results in hyperacetylation of all core histones. Further results from immunostaining for histone acetyltransferases demonstrated the recruitment of several different HATs that probably act in concert to induce a complex pattern of histone acetylation. We have directly observed recruitment of GCN5, P/CAF, and CBP/P300 to the A03_1 HSR; other HATs such as mammalian homologues of NuA4 that bind VP16 and acetylate H4 and H2A are also candidates (Utley et al., 1998). Inhibition of histone deacetylases results in redistribution of certain heterochromatic proteins (Ekwall et al., 1997). The observed extension of large-scale chromatin fibers in our system might be explained at least in part by the release of heterochromatic proteins from the HSR as a consequence of histone hyperacetylation.
A second possible mechanism for large-scale chromatin decondensation may involve chromatin remodeling complexes. Future work will aim at exploring the relationship between recruitment of components of chromatin remodeling complexes and the temporal sequence of large-scale chromatin decondensation. As discussed in the introduction, in vitro evidence suggests that the VP16 AAD recruits a number of different components of the transcriptional machinery. Therefore, dissecting the molecular mechanisms leading to large-scale chromatin decondensation will be a complex task, but one that can exploit the microscopy-based system we have developed, in conjunction with use of VP16 mutants, other lac repressor fusion proteins, and inhibition studies.
Propagation of Large-Scale Chromatin Unfolding Provides a Rationale for Clustering of Active Genes
An increased sensitivity to nuclease digestion extending for tens to hundreds of kilobases flanking transcriptionally active loci has been described in several well characterized examples (Igo-Kemenes et al., 1982; Eissenberg et al., 1985; Elgin, 1990; Dillon and Grosveld, 1994). In the case of the β-globin locus, this generalized increased sensitivity has been linked to a cis-regulatory control element, the locus control region (LCR), containing multiple transcription factor binding sites (Forrester et al., 1990). This chromatin opening activity has been proposed to facilitate long range activation of β-globin genes (Martin et al., 1996).
A long standing question relating to genome organization has been the functional significance of the observed clustering of active, housekeeping genes within large, Mbp-sized chromosome R bands. Ultrastructural localization of bromouridine incorporation into newly synthesized RNA (Wansink et al., 1996) as well as older, tritiated uridine incorporation experiments (Fakan and Bernhard, 1971) have shown that most transcriptional activity localizes to the edge of condensed chromatin. This implies that differential compaction of large chromosome regions into condensed, heterochromatic, or extended euchromatic regions is functionally significant. Extending this further, there may be folding differences even within euchromatic chromosome regions that have significance in terms of overall permissiveness for transcriptional activity, leading to chromosome position effects. Experimentally, a differential, large-scale packing of chromatin over a scale of 0.1–1.5 Mbp has been reported recently for R versus G band chromosome regions; R bands are enriched in active housekeeping genes, and in the specific examples examined showed a more extended structure (Yokota et al., 1997).
The A03_1 HSR forms a compact, tightly folded interphase structure and condenses normally during mitosis. Targeting lac repressor-VP16 to this large, heterochromatic HSR induces a dramatic extension of large-scale chromatin fibers. Therefore, we speculate that highly active genomic regions form more extended large-scale chromonema fibers. This explains why we see the decondensed HSR occupying a much larger territory than observed typically for native chromosome regions of comparable size (Cremer et al., 1993), since we have now created a 90-Mbp, highly active chromosome region. Normal chromosomes by comparison have smaller active regions dispersed among much larger transcriptionally inactive regions. The VP16-induced extended HSR structures thus may represent much larger, more exaggerated examples of similar changes in large-scale chromatin structure occurring in native chromosomes but confined to small regions. The assumption is that similar opening or extension in large-scale chromatin structure would occur normally over smaller regions, perhaps tens to hundreds of kilobases in size, flanking highly active individual gene loci.
Our results demonstrate a specific long-range propagation of chromatin changes in the extension of large-scale chromatin fibers. Rather than a localized decondensation of the lac operator containing DNA segments (Fig. 9 A, top), we instead saw a generalized straightening or uncoiling of large-scale chromonema fibers, spreading over coamplified genomic DNA flanking the vector repeats (Fig. 9 A, bottom). Based on these observations we propose a model in which condensation is the default state for large-scale chromatin packing, with special opening sequences, capable of acting over large distances and perhaps related to the transcriptional machinery, required for euchromatic regions to maintain their extended structure.
Figure 9.

(A) Model for large-scale chromatin decondensation induced by VP16 AAD. (1) Prediction from a chromatin domain model in which loop domain organization restricts propagation of large-scale chromatin decondensation. Starting, left configuration shows packing of loops, with gray fiber segments corresponding to vector repeats to which VP16 AAD is targeted, and dark fiber segments to flanking genomic DNA. Decondensation of gray loops (right) would lead to expansion of HSR size but not a change in HSR shape, assuming loop attachment sites were maintained. (2) Actual observed decondensation through unfolding and extension of chromonema fibers, with the change in fiber folding propagating through large, flanking, coamplified genomic regions. (B) Rationale for the clustering of active, housekeeping genes. Gene alliance model shows chromosome region (light gray) containing many constitutively active, housekeeping genes. Activity of cis- and trans-factors flanking each housekeeping gene leads to a large-scale chromatin unfolding activity propagating between neighboring, active genes. The synergistic combined activity of this active gene cluster maintains an extended large-scale chromatin organization and may stabilize expression patterns over this chromosome region.
In our work with gene amplification, we have found that most HSRs assume a compact, chromosome territory-like structure in which highly folded fibrillar components are suggested at light microscopy but not easily delineated. Some HSRs, like the A03_1 HSR, are substantially more compact and do not show obvious fibrillar substructure at light microscopy resolution except when they decondense transiently during DNA replication. At the other extreme, we have isolated several cell lines in which highly extended fibrillar structures are seen for most cells. Our working hypothesis is that these extended HSRs are derived from gene amplification events in which euchromatic, highly active genomic regions containing these opening sequences are coamplified in the flanking DNA. We would predict that naturally occurring gene amplification events, as seen for oncogenes in tumor cells, or the endogenous, early replicating DHFR gene would tend to give rise to more open, extended HSRs than normal chromosomes, since they are derived from amplification of active genomic regions.
The frequency of these opening sequences need not be very high if we consider the ability of the large-scale chromatin unfolding to propagate over large distances away from these sites. An example of such a unique sequence might be the β-globin LCR, which importantly is required for both the observed increased nuclease sensitivity surrounding the globin locus and the maintenance of normal, copy number–dependent expression in heterochromatic centromere regions (Milot et al., 1996). Transgene repeats and repetitive sequences in this model lead to condensed, large-scale chromatin structures at least in part because of the absence of opening sequences, which may be related to the transcriptional machinery. This model predicts the existence of special sequences, perhaps resembling the globin LCR, that would maintain a more open conformation and would be distributed throughout euchromatic regions. Interestingly, in vivo cross-linking experiments have indicated a wide distribution of binding sites for two homeodomain proteins (Walter and Biggin, 1996). It is possible that distributed binding sites for different transcription factors may provide this opening function with LCRs corresponding to extreme examples of particularly active opening sequences.
In the context of this model, the clustering of constitutively active, housekeeping genes would lead to a synergistic propagation of large-scale chromatin unfolding extending over the entire region (Fig. 9 B). Gene regulatory sequences with opening activity would reinforce their neighbors in maintaining a larger, chromosome region in an open and transcriptionally permissive environment. This increased active gene frequency in certain chromosome regions would create an alliance against repressive effects of chromatin compaction. The extended structure produced would be important in increasing the general transcriptional potential of this chromosome region, while maintaining this potential during cell differentiation, particularly in cells that show significant global chromatin condensation.
Acknowledgments
We thank Drs. David Allis, Tom Misteli (National Institutes of Health, Bethesda, MD), and David Spector (Cold Spring Harbor Laboratory, Cold Spring Harbor, NY), and Pui K. Chan (Baylor College of Medicine, Houston, TX) for providing us with antibodies against hyperacetylated histones H3 and H4 (from D. Allis), splicing factors and fibrillarin (from T. Misteli and D. Spector), and nucleophosmin (P.K. Chan). We thank Dr. Arnold Levine (Princeton University, Princeton, NJ) for providing the LAP348 vector. We thank Gang Li for initial testing of the LAP348 construct and Yuri Strukov for providing us with the D11-1 cell line.
This work was supported by a grant to A. Belmont from the National Institutes of Health (R01-GM42516).
Abbreviations used in this paper
- AAD
acidic activation domain
- DAPI
4′6-diamidino-2-phenylindole
- DHFR
dihydrofolate reductase
- EGFP
enhanced green fluorescent protein
- HSR
homogeneously staining region
- IGFP
S65T green fluorescent protein
- LCR
locus control region
- MTX
methotrexate
- NLS
nuclear localization signal
- TEM
transmission electron microscope
References
- Agard DA, Hiraoka Y, Shaw P, Sedat JW. Fluorescence microscopy in three dimensions. Methods Cell Biol. 1989;30:353–377. doi: 10.1016/s0091-679x(08)60986-3. [DOI] [PubMed] [Google Scholar]
- Alberts, B., D. Bray, J. Lewis, M. Raff, K. Roberts, and J.D. Watson. 1994. Molecular Biology of the Cell. Garland Publishing, Inc., New York. 360–361.
- Barlev N, Candau R, Wang L, Darpino P, Silverman N, Berger SL. Characterization of physical interactions of the putative transcriptional adaptor, ADA2, with acidic activation domain and TATA-binding protein. J Biol Chem. 1995;270:19337–19344. doi: 10.1074/jbc.270.33.19337. [DOI] [PubMed] [Google Scholar]
- Belmont, A.S. 1997. Large-scale chromatin organization. In Genome Structure and Function. C. Nicolini, editor. Kluwer Academic Publishers, Dordrecht, The Netherlands. 261–276.
- Belmont AS, Bruce K. Visualization of G1 chromosomes: a folded, twisted, and supercoiled chromonema model of interphase chromatid structure. J Cell Biol. 1994;127:287–302. doi: 10.1083/jcb.127.2.287. [DOI] [PMC free article] [PubMed] [Google Scholar]
- Belmont AS, Straight AF. In vivo visualization of chromosomes using lacoperator-repressor binding. Trends Cell Biol. 1998;8:121–124. doi: 10.1016/s0962-8924(97)01211-7. [DOI] [PubMed] [Google Scholar]
- Belmont AS, Braunfeld MB, Sedat JW, Agard DA. Large-scale chromatin structural domains within mitotic and interphase chromosomes in vivo and in vitro. Chromosoma. 1989;98:129–143. doi: 10.1007/BF00291049. [DOI] [PubMed] [Google Scholar]
- Bourgeois CA, Laquerriere F, Hermon D, Hubert J, Bouteille M. New data on the in situ position of the inactive X chromosome in the interphase nucleus of human fibroblasts. Hum Genet. 1985;69:122–129. doi: 10.1007/BF00293281. [DOI] [PubMed] [Google Scholar]
- Boy de la Tour E, Laemmli UK. The metaphase scaffold is helically folded: sister chromatids have predominantly opposite helical handedness. Cell. 1988;55:937–944. doi: 10.1016/0092-8674(88)90239-5. [DOI] [PubMed] [Google Scholar]
- Brownell JE, Zhou J, Ranalli T, Kobayashi R, Edmondson DG, Roth SY, Allis CD. Tetrahymenahistone acetyltransferase A: a homolog to yeast GCN5 linking histone acetylation to gene activation. Cell. 1996;84:843–851. doi: 10.1016/s0092-8674(00)81063-6. [DOI] [PubMed] [Google Scholar]
- Candau R, Zhou X, Allis CD, Berger SL. Histone acetyltransferase activity and interaction with ADA2 are critical for GCN5 function in vivo. EMBO (Eur Mol Biol Organ) J. 1997;16:555–565. doi: 10.1093/emboj/16.3.555. [DOI] [PMC free article] [PubMed] [Google Scholar]
- Chan PK. Characterization and cellular localization of nucleophosmin/ B23 in Hela cells treated with selected cytotoxic agents (studies of B23-translocation mechanism) Exp Cell Res. 1992;203:174–181. doi: 10.1016/0014-4827(92)90053-b. [DOI] [PubMed] [Google Scholar]
- Chen J, Matthews KS. Deletion of lactose repressor carboxyl-terminal domain affects tetramer formation. J Biol Chem. 1992;267:13843–13850. [PubMed] [Google Scholar]
- Chuang PT, Albertson DG, Meyer BJ. DPY-27: a chromosome condensation protein homolog that regulates C. elegansdosage compensation complex through association with the X chromosome. Cell. 1994;79:459–474. doi: 10.1016/0092-8674(94)90255-0. [DOI] [PubMed] [Google Scholar]
- Cremer T, Kurz A, Zirbel R, Dietzel S, Rinke B, Schrock E, Speicher MR, Mathieu U, Jauch A, Emmerich P, et al. Role of chromosome territories in the functional compartmentalization of the cell nucleus. Cold Spring Harbor Symp Quant Biol. 1993;58:777–792. doi: 10.1101/sqb.1993.058.01.085. [DOI] [PubMed] [Google Scholar]
- Daneholt B. The transcribed template and the transcription loop in Balbiani rings. Cell Biol Int Rep. 1992;16:709–715. doi: 10.1016/s0309-1651(05)80015-3. [DOI] [PubMed] [Google Scholar]
- DiFiglia M, Sapp E, Chase KO, Davies SW, Bates GP, Vonsattel JP, Aronia N. Aggregation of huntingtin in neuronal intranuclear inclusions and dystrophic neurites in brain. Science. 1997;277:1990–1993. doi: 10.1126/science.277.5334.1990. [DOI] [PubMed] [Google Scholar]
- Dillon N, Grosveld F. Chromatin domains as potential units of eukaryotic gene function. Curr Opin Gen Dev. 1994;4:260–264. doi: 10.1016/s0959-437x(05)80053-x. [DOI] [PubMed] [Google Scholar]
- Eissenberg JC, Cartwright IL, Thomas GH, Elgin SCR. Selected topics in chromatin structure. Annu Rev Genet. 1985;19:485–536. doi: 10.1146/annurev.ge.19.120185.002413. [DOI] [PubMed] [Google Scholar]
- Ekwall K, Olsson T, Turner BM, Cranston G, Allshire RC. Transient inhibition of histone deacetylation alters the structural and functional imprint at fission yeast centromeres. Cell. 1997;91:1021–1032. doi: 10.1016/s0092-8674(00)80492-4. [DOI] [PubMed] [Google Scholar]
- Elgin SCR. Chromatin structure and gene activity. Curr Opin Cell Biol. 1990;2:437–445. doi: 10.1016/0955-0674(90)90125-x. [DOI] [PubMed] [Google Scholar]
- Ericsson C, Mehlin H, Bjorkroth B, Lamb MM, Daneholt B. The ultrastructure of upstream and downstream regions of an active Balbiani Ring gene. Cell. 1989;56:631–639. doi: 10.1016/0092-8674(89)90585-0. [DOI] [PubMed] [Google Scholar]
- Fakan S, Bernhard W. Localization of rapidly and slowly labeled nuclear RNA as visualized by high resolution autoradiography. Exp Cell Res. 1971;67:129–141. doi: 10.1016/0014-4827(71)90628-8. [DOI] [PubMed] [Google Scholar]
- Fieck A, Wyborski DL, Short JM. Modifications of the E. coliLac repressor for expression in eukaryotic cells: effects of nuclear signal sequences on protein activity and nuclear accumulation. Nucleic Acids Res. 1992;20:1785–1791. doi: 10.1093/nar/20.7.1785. [DOI] [PMC free article] [PubMed] [Google Scholar]
- Forrester WC, Epner E, Driscoll MC, Enver T, Brice M, Papayannopoulou T, Groudine M. A deletion of the human beta-globin locus activation region causes a major alteration in chromatin structure and replication across the entire beta-globin locus. Genes Dev. 1990;4:1637–1649. doi: 10.1101/gad.4.10.1637. [DOI] [PubMed] [Google Scholar]
- Goodrich JA, Hoey T, Thut CJ, Admon A, Tjian R. Drosophila.TAFII40 interacts with both a VP16 activation domain and the basal transcription factor TFIIB. Cell. 1993;75:519–530. doi: 10.1016/0092-8674(93)90386-5. [DOI] [PubMed] [Google Scholar]
- Grant PA, Duggan L, Cote J, Roberts SM, Brownell R, Candau R, Ohba R, Owen-Hughes T, Allis CD, Winston F, Berger SL, Workman JL. Yeast GCN5 functions in two multisubunit complexes to acetylate nucleosomal histones: characterization of an Ada complex and the SAGA (Spt/Ada) complexes. Genes Dev. 1997;11:1640–1650. doi: 10.1101/gad.11.13.1640. [DOI] [PubMed] [Google Scholar]
- Gupta R, Emili A, Pan G, Xiao H, Shales M, Greenblatt J, Ingles CJ. Characterization of the interaction between the acidic activation domain of VP16 and the RNA polymerase II initiation factor TFIIB. Nucleic Acids Res. 1996;24:2324–2330. doi: 10.1093/nar/24.12.2324. [DOI] [PMC free article] [PubMed] [Google Scholar]
- Hebbes TR, Thorne AW, Clayton AL, Crane-Robinson C. Core histone hyperacetylation co-maps with generalized DNase1 sensitivity in the chicken beta-globin chromosomal domain. EMBO (Eur Mol Biol Organ) J. 1994;13:1823–1830. doi: 10.1002/j.1460-2075.1994.tb06451.x. [DOI] [PMC free article] [PubMed] [Google Scholar]
- Hiraoka Y, Swedlow JR, Paddy MR, Agard DA, Sedat JW. Three-dimensional multiple-wavelength fluorescence microscopy for the structural analysis of biological phenomena. Semin Cell Biol. 1991;2:153–165. [PubMed] [Google Scholar]
- Igo-Kemenes T, Horz W, Zachau HG. Chromatin. Annu Rev Biochem. 1982;51:89–121. doi: 10.1146/annurev.bi.51.070182.000513. [DOI] [PubMed] [Google Scholar]
- Kingston RE, Bunker CA, Imbalzano AN. Repression and activation by multiprotein complexes that alter chromatin structure. Genes Dev. 1996;10:905–920. doi: 10.1101/gad.10.8.905. [DOI] [PubMed] [Google Scholar]
- Kuo M, Allis DC. Roles of histone acetyltransferases and deacetylases in gene regulation. Bioessays. 1998;20:615–626. doi: 10.1002/(SICI)1521-1878(199808)20:8<615::AID-BIES4>3.0.CO;2-H. [DOI] [PubMed] [Google Scholar]
- Kuo M-H, Zhou J, Jambeck P, Churchill MEA, Allis CD. Histone acetyltransferase activity of yeast Gcn5p is required for the activation of target genes in vivo. Genes Dev. 1998;12:627–639. doi: 10.1101/gad.12.5.627. [DOI] [PMC free article] [PubMed] [Google Scholar]
- Labow MA, Baim SB, Shenk T, Levine AJ. Conversion of the lac repressor into an allosterically regulated transcriptional activator for mammalian cells. Mol Cell Biol. 1990;10:3343–3356. doi: 10.1128/mcb.10.7.3343. [DOI] [PMC free article] [PubMed] [Google Scholar]
- Lawrence JB, Singer RH, McNeil JA. Interphase and metaphase resolution of different distances within the human dystrophin gene. Science. 1990;249:928–932. doi: 10.1126/science.2203143. [DOI] [PubMed] [Google Scholar]
- Li G, Sudlow G, Belmont AS. Interphase cell cycle dynamics of a late replicating, heterochromatic homogeneously staining region: precise choreography of condensation/decondensation and intranuclear positioning. J Cell Biol. 1998;140:975–989. doi: 10.1083/jcb.140.5.975. [DOI] [PMC free article] [PubMed] [Google Scholar]
- Lieb JD, Albrecht MR, Chuang P-T, Meyer BJ. MIX-1: an essential component of the C. elegansmitotic machinery executes X chromosome dosage compensation. Cell. 1998;92:265–277. doi: 10.1016/s0092-8674(00)80920-4. [DOI] [PubMed] [Google Scholar]
- Manuelidis L. A view of interphase chromosomes. Science. 1990;250:1533–1540. doi: 10.1126/science.2274784. [DOI] [PubMed] [Google Scholar]
- Manuelidis L, Chen TL. A unified model of eukaryotic chromosomes. Cytometry. 1990;11:8–25. doi: 10.1002/cyto.990110104. [DOI] [PubMed] [Google Scholar]
- Marcus GA, Silverman N, Berger SL, Horiuchi J, Guarente L. Functional similarity and physical association between GCN5 and Ada2: putative transcriptional adaptors. EMBO (Eur Mol Biol Organ) J. 1994;13:4807–4815. doi: 10.1002/j.1460-2075.1994.tb06806.x. [DOI] [PMC free article] [PubMed] [Google Scholar]
- Martin DIK, Fiering S, Groudine M. Regulation of beta-globin gene expression: straightening out the locus. Curr Opin Genet Dev. 1996;6:488–495. doi: 10.1016/s0959-437x(96)80072-4. [DOI] [PubMed] [Google Scholar]
- Milot E, Strouboulis J, Trimborn T, Wijgerde M, de Boer E, Langeveld A, Tan-Un K, Vergeer W, Yannoutsos N, Grosveld F, Fraser P. Heterochromatin effects on the frequency and duration of LCR-mediated gene transcription. Cell. 1996;87:105–114. doi: 10.1016/s0092-8674(00)81327-6. [DOI] [PubMed] [Google Scholar]
- Misteli T, Caceres JF, Spector D. The dynamics of a pre-mRNA splicing factor in living cells. Nature. 1997;387:523–527. doi: 10.1038/387523a0. [DOI] [PubMed] [Google Scholar]
- Nguyen VT, Giannoni F, Dubois MF, Seo SJ, Vigneron M, Kedinger C, Bensaude O. In vivo degradation of RNA polymerase II largest subunit triggered by alpha-amanitin. Nucleic Acids Res. 1996;24:2924–2929. doi: 10.1093/nar/24.15.2924. [DOI] [PMC free article] [PubMed] [Google Scholar]
- Paulson JR, Laemmli UK. The structure of histone depleted chromosomes. Cell. 1977;12:817–828. doi: 10.1016/0092-8674(77)90280-x. [DOI] [PubMed] [Google Scholar]
- Paulson HL, Perez MK, Trottier Y, Trojanowski HQ, Subramony SH, Das SS, Vig P, Mandel JL, Fishbeck KH, Pittman RN. Intranuclear inclusions of expanded polyglutamine protein in spinocerebellar ataxia type 3. Neuron. 1997;19:333–344. doi: 10.1016/s0896-6273(00)80943-5. [DOI] [PubMed] [Google Scholar]
- Rattner JB, Lin CC. Radial loops and helical coils coexist in metaphase chromosomes. Cell. 1985;42:291–296. doi: 10.1016/s0092-8674(85)80124-0. [DOI] [PubMed] [Google Scholar]
- Robinett CC, Straight A, Li G, Willhelm C, Sudlow G, Murray A, Belmont AS. In vivo localization of DNA sequences and visualization of large-scale chromatin organization using lac operator/repressor recognition. J Cell Biol. 1996;135:1685–1700. doi: 10.1083/jcb.135.6.1685. [DOI] [PMC free article] [PubMed] [Google Scholar]
- Sadowski I, Ma J, Triezenberg S, Ptashne M. GAL4-VP16 is an unusually potent transcriptional activator. Nature. 1988;335:563–564. doi: 10.1038/335563a0. [DOI] [PubMed] [Google Scholar]
- Schellens JPM, James J, Hoeber KA. Some aspects of the fine structure of the sex chromatin body. Biol Cell. 1979;35:11–14. [Google Scholar]
- Straight AF, Belmont AS, Robinett CC, Murray AW. GFP tagging of budding yeast chromosomes reveals that protein–protein interactions can mediate sister chromatid cohesion. Curr Biol. 1996;6:1599–1608. doi: 10.1016/s0960-9822(02)70783-5. [DOI] [PubMed] [Google Scholar]
- Stringer KF, Ingles CJ, Greenblatt J. Direct and selective binding of an acidic transcriptional activation domain to the TATA-box factor TFIID. Nature. 1990;345:783–786. doi: 10.1038/345783a0. [DOI] [PubMed] [Google Scholar]
- Struhl K. Histone acetylation and transcriptional regulatory mechanisms. Genes Dev. 1998;12:599–606. doi: 10.1101/gad.12.5.599. [DOI] [PubMed] [Google Scholar]
- Svaren J, Horz W. Histones, nucleosomes, and transcription. Curr Opin Genet Dev. 1993;3:219–225. doi: 10.1016/0959-437x(93)90026-l. [DOI] [PubMed] [Google Scholar]
- Triezenberg SJ, Kingsbury RC, McKnight SL. Functional dissection of VP16, the transactivator of herpes simplex virus immediate early gene expression. Genes Dev. 1988;2:718–729. doi: 10.1101/gad.2.6.718. [DOI] [PubMed] [Google Scholar]
- Urlaub G, Mitchell PG, Kas E, Chasin LA, Funanage VL, Myoda TT, Hamlin J. Effect of gamma rays at the dihydrofolate reductase locus: deletions and inversions. Somat Cell Mol Genet. 1986;12:555–566. doi: 10.1007/BF01671941. [DOI] [PubMed] [Google Scholar]
- Utley RT, Ikeda K, Grant PA, Cote J, Steger DJ, Eberharter A, John S, Workman JL. Transcriptional activators direct histone acetyltransferase complexes to nucleosomes. Nature. 1998;394:498–502. doi: 10.1038/28886. [DOI] [PubMed] [Google Scholar]
- Walter J, Biggin MD. DNA binding specificity of two homeodomain proteins in vitro and in Drosophilaembryos. Proc Natl Acad Sci USA. 1996;93:2680–2685. doi: 10.1073/pnas.93.7.2680. [DOI] [PMC free article] [PubMed] [Google Scholar]
- Wang L, Liu L, Berger SL. Critical residues for histone acetylation by Gcn5, functioning in Ada and SAGA complexes, are also required for transcriptional function in vivo. Genes Dev. 1998;12:640–653. doi: 10.1101/gad.12.5.640. [DOI] [PMC free article] [PubMed] [Google Scholar]
- Wansink DG, Schul W, van der Kraan I, van Steensel B, van Driel R, de Jong L. Fluorescent labeling of nascent RNA reveals transcription by RNA polymerase II in domains scattered throughout the nucleus. J Cell Biol. 1993;122:283–293. doi: 10.1083/jcb.122.2.283. [DOI] [PMC free article] [PubMed] [Google Scholar]
- Wansink DG, Sibon OC, Cremers FF, van Driel R, de Jong L. Ultrastructural localization of active genes in nuclei of A431 cells. J Cell Biochem. 1996;62:10–18. doi: 10.1002/(sici)1097-4644(199607)62:1<10::aid-jcb2>3.0.co;2-4. [DOI] [PubMed] [Google Scholar]
- Wolffe, A.P. 1997. Transcriptional regulation in a chromatin environment. In Genome Structure and Function. C. Nicolini, editor. Kluwer Academic Publishers, Dordrecht, The Netherlands. 83–110.
- Xiao H, Pearson A, Coulombe B, Truant R, Zhang S, Regier JL, Triezenberg SJ, Reinberg D, Flores O, Ingles CJ, Greenblatt J. Binding of basal transcription factor TFIIH to the acidic activation domains of VP16 and p53. Mol Cell Biol. 1994;14:7013–7024. doi: 10.1128/mcb.14.10.7013. [DOI] [PMC free article] [PubMed] [Google Scholar]
- Yokota H, Singer MJ, van den Engh GJ, Trask BJ. Regional differences in the compaction of chromatin in human G0/G1 interphase nuclei. Chromosome Res. 1997;5:157–166. doi: 10.1023/a:1018438729203. [DOI] [PubMed] [Google Scholar]