

Abstract
To investigate the role of protein kinase C (PKC) isoforms in regulation of neurite outgrowth, PKCα, βII, δ, and ε fused to enhanced green fluorescent protein (EGFP) were transiently overexpressed in neuroblastoma cells. Overexpression of PKCε–EGFP induced cell processes whereas the other isoforms did not. The effect of PKCε–EGFP was not suppressed by the PKC inhibitor GF109203X. Instead, process formation was more pronounced when the regulatory domain was introduced. Overexpression of various fragments from PKCε regulatory domain revealed that a region encompassing the pseudosubstrate, the two C1 domains, and parts of the V3 region were necessary and sufficient for induction of processes. By deleting the second C1 domain from this construct, a dominant-negative protein was generated which suppressed processes induced by full-length PKCε and neurites induced during retinoic acid- and growth factor–induced differentiation. As with neurites in differentiated neuroblastoma cells, processes induced by the PKCε– PSC1V3 protein contained α-tubulin, neurofilament-160, and F-actin, but the PKCε–PSC1V3-induced processes lacked the synaptic markers synaptophysin and neuropeptide Y. These data suggest that PKCε, through its regulatory domain, can induce immature neurite-like processes via a mechanism that appears to be of importance for neurite outgrowth during neuronal differentiation.
Keywords: C1 domains, neuroblastoma cells, neuronal differentiation, neurite outgrowth, protein kinase C
The regulation of neurite outgrowth during neuronal differentiation is complex and likely to involve multiple signal transduction components. One group of enzymes that has been suggested to be involved in this process is the protein kinase C (PKC)1 isoform family. Several PKC isoforms have been shown to be present in growing axons both in vivo and in vitro (Ide, 1996). There is also experimental evidence for a function of PKC in the regulation of neurite outgrowth in neuronal differentiation model systems, such as PC12 cells (Hundle et al., 1995, 1997) and neuroblastoma cells (Parrow et al., 1992, 1995; Fagerström et al., 1996).
PKC comprises a family of serine/threonine protein kinases, consisting of at least 11 different isoforms, divided into subgroups depending on structural similarities and requirement for activators. The classical PKCs (α, βI, βII, and γ) are Ca2+-dependent and activated by diacylglycerol and phorbol esters. Novel PKCs (δ, ε, η, and θ) are activated by diacylglycerol and phorbol esters, but are Ca2+-independent. The atypical PKC isoforms ζ and ι/λ are insensitive to diacylglycerol and phorbol ester and are also Ca2+-independent. Finally, PKCμ is structurally unique, but is activated by phorbol esters (Nishizuka, 1992; Newton, 1995; Liu, 1996).
The PKC molecule consists of one NH2-terminal regulatory domain (RD) and one COOH-terminal catalytic domain. In the resting state the enzyme is kept inactive by a pseudosubstrate motif in the RD bound to the catalytic site. To become active this locked conformation has to be changed and this is assumed to be caused by the binding of activators to the RD (Newton, 1997). The RD from classical and novel PKC isoforms contains two classes of domains, C1 and C2, which are targets for PKC activators. Diacylglycerol and phorbol ester bind C1 domains and in classical isoforms the C2 domain binds Ca2+. On the other hand, the C2 domain in novel isoforms does not bind Ca2+, putatively explaining the Ca2+ independence of these isoforms (Stabel and Parker, 1991; Nishizuka, 1992; Ponting and Parker, 1996).
Besides being the target for PKC activators, the RD also has been shown to be responsible for protein–protein interaction, which may direct each isoform to unique intracellular sites. RACKs (receptors for activated C-kinase) constitute one class of PKC-binding proteins that interact with activated PKC and this binding is to a large extent mediated via the C2 domain (Mochly-Rosen and Gordon, 1998). RACKs have been identified for PKCβ (Ron et al., 1994) and ε (Csukai et al., 1997), and overexpression of either the entire C2 domain or peptides derived thereof has been shown to block isoform-specific translocation and/or activation of individual isoforms (Ron et al., 1995; Johnson et al., 1996; Hundle et al., 1997). There are also several reports demonstrating protein interaction sites in the region comprising the two C1 domains (Prekeris et al., 1996; Matto-Yelin et al., 1997; Yao et al., 1997), suggesting that depending on the interaction partner, different PKC domains may be of importance. Since there is little evidence for a substrate of PKC that is preferentially phosphorylated by one or several isoforms, but not by others, at least some of the isoform-specific effects observed have been attributed to the fact that different isoforms will localize to different intracellular sites. Due to these assumptions, and since RDs in several cases determine interaction partners and subcellular localization sites, RDs have been considered to be acting isoform specifically in a dominant-negative manner (Jaken, 1996). Studies have shown specific effects of overexpression of RDs from individual isoforms (Liao et al., 1994; Cai et al., 1997). However, there are also reports demonstrating that the effect of the full-length PKC can be mimicked by parts of, or the entire, RD indicating that some PKC effects may actually be mediated via this domain (Lehel et al., 1995a; Singer et al., 1996). Furthermore, studies with chimeras consisting of PKC molecules with the regulatory and catalytic domain derived from different isoforms have shown that isoform specificity may be mediated via either domain (Acs et al., 1997; Wang et al., 1998). Thus, to understand the molecular mechanisms for a PKC effect there is a need to identify which isoforms exert the effect and which domain(s) is/are involved in mediating it.
Neuroblastoma cell lines have been used extensively as in vitro model systems to study mechanisms regulating neuronal differentiation. In this study, two neuroblastoma cell lines, SH-SY5Y and SK-N-BE(2), were used. Both of these cell lines can be induced to differentiate with a plethora of factors (Påhlman et al., 1981; Melino et al., 1993; Lavenius et al., 1994, 1995; Rossino et al., 1995). In several of these differentiation protocols there is evidence for the involvement of PKC. In particular, neurite outgrowth appears to involve PKC, and a number of PKC isoforms are present in growth cones of the differentiating cells (Parrow et al., 1995; Fagerström et al., 1996). Experiments with high phorbol ester concentrations, which cause selective down regulation of PKC isoforms, have suggested that novel isoforms may be of importance in neurite outgrowth (Fagerström et al., 1996).
The aim of this study was to investigate whether increased levels of a particular PKC isoform would be sufficient to induce growth of neurites in neuroblastoma cells. To accomplish this, cDNA coding for the classical and novel PKC isoforms that are consistently expressed in neuroblastoma cell lines and tumor specimens, PKCα, βII, δ, and ε (Zeidman et al., 1999), was introduced into an expression vector and human neuroblastoma cells were transfected with these plasmids. To identify cells overexpressing the proteins, the COOH-terminal ends of the isoforms were fused to enhanced green fluorescent protein (EGFP). The results demonstrate that PKCε is the only isoform that can induce processes in neuroblastoma cells and that this effect is independent of the catalytic activity of the enzyme. By making a series of constructs expressing isolated domains of PKCε, this study demonstrates that the effect is mediated by a region from PKCε encompassing the pseudosubstrate, the two C1 domains, and parts of the V3 region. The data also indicate that this effect is of importance for neurite outgrowth during neuronal differentiation.
Materials and Methods
Plasmids
cDNA coding for full-length human PKC isoforms α, βII, δ, and ε; the RD from PKCα, βII, δ, ε, η, and θ; or smaller fragments of PKCε were generated by PCR with introduction of appropriate restriction enzyme sites in the primers. The DNA fragments were introduced into the pEGFP-N1 vector (Clontech Laboratories, Inc.), thereby fusing the PKC cDNA with EGFP cDNA. The schematic structures of the protein products coded for by the different expression vectors are shown in Fig. 1 A. Templates for the PCR reactions were for PKCα, ε, and θ cDNA from SH-SY5Y cells; for PKCβII ATCC plasmid 80047 (Hocevar et al., 1993); for PKCδ ATCC plasmid 80049 (Aris et al., 1993); and for PKCη cDNA generated from human placenta mRNA (Clontech Laboratories, Inc.). The PKCε plasmids εPSC1aV3E and εPSC1bV3E (εPSC1V3E with DNA coding for either the second or the first C1 domain deleted) were generated with primers designed to amplify the entire εPSC1V3E plasmid, excluding the DNA coding for the domain that should be deleted. An MluI site was introduced in each primer, the PCR product was cleaved with MluI, and ligated. Table I lists the primers used to generate the PKC fragments. All PCR reactions were performed with Pfu polymerase (Stratagene) to minimize introduction of mutations and all PCR-generated fragments used in this study were sequenced. The generation of the protein products of anticipated sizes were confirmed by transfecting the expression vectors into COS cells with the calcium phosphate method (Sambrook et al., 1989) and subjecting the cell lysate to Western blot analysis (Fig. 1, B–D). In addition, the NheI/SalI fragments from αFL and εFL (full-length PKC) were inserted into the CMS–EGFP vector (Clontech Laboratories, Inc.) to obtain expression of PKC and EGFP as two separate proteins.
Figure 1.
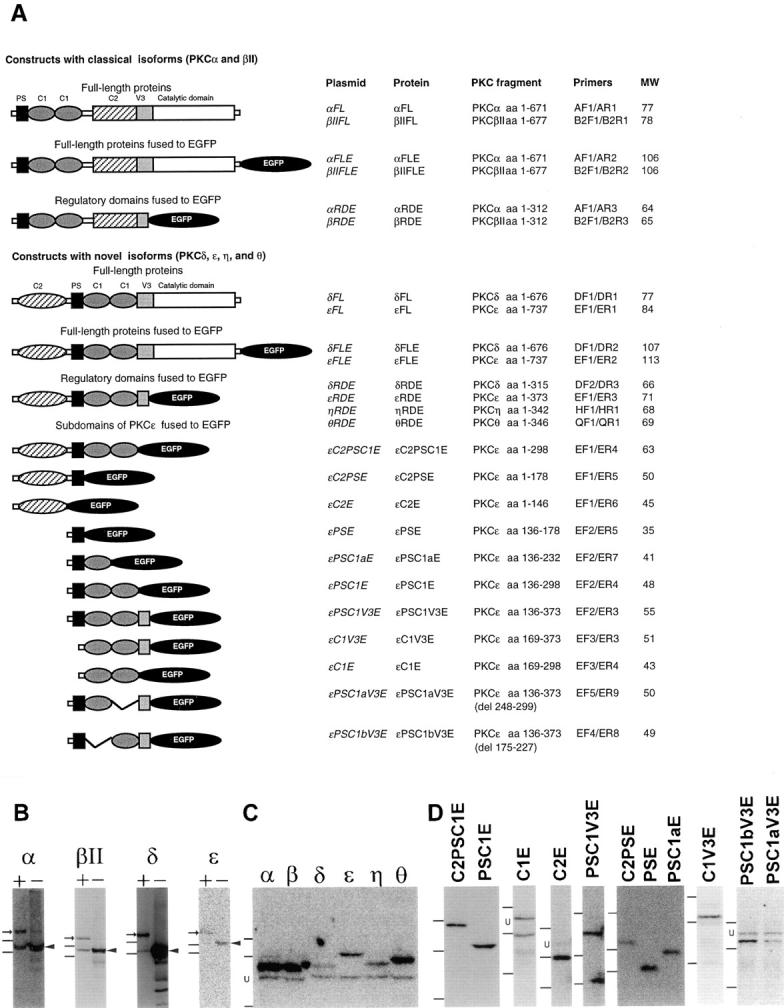
PKC–EGFP fusion constructs used in this study. (A) List of PKC constructs produced for this study. The left column shows schematic composition of PKCε fragments coded for by the expression vectors used in this study: PS (pseudosubstrate), C1, C2, and V3 domains. The primers used for amplification of the cDNA fragments are listed in Table I. The predicted molecular weights of the fusion proteins are included. (B–D) COS cells were transfected with the plasmids listed in A and the formation of the protein products were analyzed with Western blot technique. (B) Analysis of full-length PKC isoforms α, βII, δ, and ε fused to EGFP (+) or expressed without any tags (−). Immunoblots were performed with isoform-specific antibodies. Arrows indicate reactivity corresponding to PKC– EGFP fusion proteins and arrowheads point to the untagged PKC isoforms. The presence of full-length PKCα, βII, and δ immunoreactivity in cell lysates from cells overexpressing EGFP fusions indicates endogenous levels of respective isoform in COS cells. The positions of two weight markers, 97 and 66 kD, are included to the left of the blots. (C) Analysis of RDs from PKCα, βI/II, δ, ε, η, and θ fused to EGFP. Cell lysates from COS cells transfected with respective expression vectors were analyzed with immunoblot using an anti-GFP antibody as primary antibody. The positions of three weight markers, 97, 66, and 46 kD, are included to the left of the blot. (D) Analysis of PKCε subdomains fused to EGFP. Cell lysates from COS cells transfected with respective expression vectors were analyzed with immunoblot using an anti-GFP antibody as primary antibody. The positions of three weight markers, 66, 46, and 30 kD, are included to the left of the blots. U denotes an unspecific band at ∼55 kD, which appeared in some immunoblots in C and D, when using the GFP antibody on COS cell lysates.
Table I.
Primers Used to Amplify PKC cDNA
| Primer | Sequence | |
|---|---|---|
| AF1 | GGAAGATCTGGACCATGGCTGACGTTTTC | |
| AR1 | CGCGTCGACTCATACTGCACTCTGTAAGAT | |
| AR2 | CGCGTCGACCATACTGCACTCTGTAAGATG | |
| AR3 | AACGTCGACGCAGGGCCAAGTTTGGCTTT | |
| B2F1 | GGAAGATCTGCAAGATGGCTGACCCGGCT | |
| B2R1 | CGCGTCGACTTAGCTCTTGACTTCGGGTTT | |
| B2R2 | CGCGTCGACAAGCTCTTGACTTCGGGTTTTA | |
| B2R3 | AACGTCGACTGACTGATCTTGGCCCTCTC | |
| DF1 | CGCCTCGAGCCCACCATGGCGCCGTTCCTGCGCATC | |
| DF2 | GGAAGATCTGCAACGGGAGCCCCACTGCA | |
| DR1 | CGCGAATTCAATCTTCCAGGAGGTGCTCG | |
| DR2 | CGCGAATTCGATCTTCCAGGAGGTGCTCGAATT | |
| DR3 | CGGAATTCTACCCTGATATATCCCAACA | |
| EF1 | GGAAGATCTCGACCATGGTAGTGTTCAAT | |
| EF2 | CGCAGATCTCGACCATGGGTGAAGCCCCTAAAGACAAT | |
| EF3 | CGCAGATCTCGACCATGGGCCACAAGTTCATGGCCACC | |
| EF4 | GCGACGCGTACCCCCGACCAGGTGGGCTCC | |
| EF5 | GCGACGCGTGCCAAAGTACTGGCCGACCTG | |
| ER1 | CGCGTCGACTCAGGGCATCAGGTCTTCACC | |
| ER2 | CGCGTCGACCAGGGCATCAGGTCTTCACCA | |
| ER3 | AACGTCGACTCTCCTCGGTTGTCAAATGA | |
| ER4 | CGCGTCGACATTCCTCTGGCATCCACTCC | |
| ER5 | CGCGTCGACCGAAGATAGGTGGCCATGAA | |
| ER6 | CGCGTCGACACACGCTCTTCATTGTCTT | |
| ER7 | CGCGTCGACACCTGGTCGGGGGTCTCCTG | |
| ER8 | GCGACGCGTGGCCATGAACTTGTGGCCGTT | |
| ER9 | GCGACGCGTGATACCGAACTTGTGGGGCAT | |
| HF1 | GCAAGATCTGCATGTCGTCTGGCACCATG | |
| HR1 | GCAGTCGACCCAATCCCATTTCCTTC | |
| QF1 | GCAGGATCCCCATGTCGCCATTTCTTCG | |
| QR1 | GCTGTCGACCAGGAAATGCCCTGAGGCTC |
Western Blot Analysis
COS cells were transfected with different expression vectors, washed with PBS, and lysed in buffer (10 mM Tris, pH 7.2, 160 mM NaCl, 1% Triton X-100, 1% sodium deoxycholate, 0.1% sodium dodecyl sulphate, 1 mM EGTA, 1 mM EDTA, 10 μg/ml leupeptin, 10 μg/ml aprotinin, and 1 mM phenylmethylsulfonyl fluoride). Lysates were centrifuged for 10 min at 15,000 g and 25 μg of protein was electrophoretically separated on an SDS polyacrylamide gel and thereafter transferred to Hybond-C extra nitrocellulose filter (Nycomed-Amersham, Inc.). EGFP- or PKC-immunoreactivity was analyzed with antibodies directed against green fluorescent protein (GFP; Clontech Laboratories, Inc.) or PKCα, βII, δ, or ε (Santa Cruz), and detected with an HRP-labeled secondary antibody using the SuperSignal system (Pierce Chemical Co.) as substrate. The chemiluminescence was detected with a CCD camera (Fuji Photo Film Co.).
Cell Culture
Human neuroblastoma SH-SY5Y, SH-SY5Y/TrkA, and SK-N-BE(2) cells were maintained in MEM supplemented with 10% FBS, 100 IU/ml penicillin, and 100 μg/ml streptomycin (GIBCO BRL). For transfection experiments, SH-SY5Y and SH-SY5Y/TrkA cells were trypsinized and seeded at a density of 350,000 cells/35-mm cell culture dish on glass coverslips in serum free medium. After 20 min the medium was changed to medium containing serum and antibiotics, and incubated for 24 h before start of the transfections. SK-N-BE(2) cells were seeded on glass coverslips in regular growth medium (300,000 cells per dish) and transfections were initiated 24 h after seeding. In experiments where cells were treated with 12- O-tetradecanoylphorbol-13-acetate (TPA; Sigma Chemical Co.) for 4 d, or with growth factors for 40 h, the density at cell seeding was 250,000 cells/35-mm dish.
SH-SY5Y cells were transfected using 3.5 μl Lipofectin (GIBCO BRL) and 1.8 μg of DNA/ml serum free medium and SK-N-BE(2) cells were transfected with 4 μl Lipofectamine (GIBCO BRL) and 2 μg DNA, essentially according the supplier's protocol.
For differentiation studies, SH-SY5Y/TrkA cells were treated for 40 h with 100 ng/ml NGF (Promega Corp.), and SK-N-BE(2) cells with 10 μM retinoic acid (RA; Sigma Chemical Co.) or 25 ng/ml ciliary neurotrophic factor (CNTF; Promega Corp.).
Morphology Studies
16 h after the end of transfections (unless otherwise stated) cells were fixed in 4% paraformaldehyde in PBS for 4 min, mounted on microscopy slides using a PVA-DABCO solution (9.6% polyvinyl alcohol, 24% glycerol, and 2.5% 1,4-diazabicyclo[2.2.2]octane in 67 mM Tris-HCl, pH 8.0), and used for morphological studies. Digital images were captured with a Sony DKC 5000 camera system. The transfected cells were considered to have long processes if the length of the process exceeded that of two cell bodies. At least 200 transfected cells per experiment were counted.
Confocal Microscopy
Cells were transfected, fixed, and mounted as for morphology studies. Cells expressing various PKCε–EGFP constructs and Texas red–phalloidin-stained F-actin were examined using a Bio-Rad MRC 1024 confocal system fitted with a Nikon Diaphot 300 microscope using a Nikon plan-apo 60 × 1.2 NA water immersion lens.
Immunofluorescence and Staining of F-Actin
Cells grown on glass coverslips were fixed with 4% paraformaldehyde as above. For detection of α-tubulin, synaptophysin, and neuropeptide Y (NPY), cells were permeabilized and blocked with 1% BSA/0.02% saponin in PBS. The primary antibody (monoclonal mouse anti–α-tubulin [Sigma Chemical Co.] diluted to 1:2,000; monoclonal mouse antisynaptophysin [clone SY38, DAKOPATTS] diluted to 1:10; or polyclonal rabbit anti–NPY [Biogenesis] diluted to 1:40, respectively) was incubated for 1 h in blocking/permeabilization solution. The secondary antibody (donkey anti–mouse IgG-TRITC [Jackson ImmunoResearch Laboratories, Inc.] diluted to 1:100 for α-tubulin and 1:20 for synaptophysin detection; or donkey anti–rabbit IgG-TRITC [Jackson ImmunoResearch Laboratories, Inc.] diluted to 1:300 for NPY staining) was incubated for 1 h in blocking solution. Extensive washing with PBS and blocking/permeabilization solution was done between all steps. For detection of neurofilament-160 (NF-160), cells were blocked for 30 min with 3% BSA in PBS and incubation with monoclonal mouse anti–NF-160 (Sigma Chemical Co.) diluted to 1:50 was performed for 3 h. Secondary antibody donkey anti–mouse IgG-TRITC (Jackson ImmunoResearch Laboratories, Inc.) was diluted to 1:300 and incubated for 1 h after extensive washing with PBS. For staining of F-actin, cells were fixed with 4% paraformaldehyde. Cells were treated for 5 min with 0.1% Triton X-100 in PBS and incubated for 10 min with 2 μg/ml TRITC–conjugated phalloidin (Sigma Chemical Co.) in PBS. For confocal studies, fixed cells were blocked and permeabilized with 5% donkey serum and 0.3% Triton X-100 in TBS, and stained for 20 min with Texas red–conjugated phalloidin (Molecular Probes, Inc.; 25 μl/ml blocking/permeabilization solution). Coverslips were mounted on object slides with 20 μl PVA-DABCO.
Results
PKCε Induces Processes in Neuroblastoma Cells
To investigate whether increased levels of a specific PKC isoform are sufficient to induce neurites, expression vectors coding for four different PKC isoforms were transfected into neuroblastoma cells. The classical and novel isoforms consistently expressed in neuroblastoma cells, PKCα, PKCβII, PKCδ, and PKCε (Zeidman et al., 1999), were selected for this approach. The cDNAs coding for these isoforms were fused to cDNA coding for EGFP, generating a PKC–EGFP fusion protein when expressed. To confirm the generation of fusion proteins, COS cells were transiently transfected with these plasmids, and cell lysates were subjected to Western blot analysis using isoform-specific antibodies (Fig. 1 B), which demonstrated the formation of proteins of the anticipated sizes.
SH-SY5Y and SK-N-BE(2) neuroblastoma cells were transfected with the vectors and the morphology of transfected cells was visualized with fluorescence microscopy (Fig. 2 A). When EGFP alone was expressed in SH-SY5Y and SK-N-BE(2) cells, the fluorescence was distributed throughout the cell. αFLE and βIIFLE (full-length PKC bound to EGFP) were mainly localized in the cytoplasm and were absent from the nucleus. δFLE localized throughout the entire cell, whereas εFLE localized mainly to the cell periphery and, in some cells, to perinuclear structures (Fig. 2 A). All fusion proteins gave rise to fluorescence of similar intensity in the transfected cells, indicating that there were no major differences in the expression levels of fusion proteins in individual cells.
Figure 2.

Induction of processes by PKCε–EGFP overexpression. SH-SY5Y and SK-N-BE(2) cells were transfected with CMV-driven expression vectors containing cDNA for PKCα (α), PKCβII (β), PKCδ (δ), or PKCε (ε) fused to EGFP or vector coding for EGFP only (−). Cells were fixed 16 h after transfection and mounted on object slides. (A) Fluorescence images of cells expressing PKC–EGFP fusion proteins. Comparison with bright-field microscopy images showed that the fluorescence from the PKC–EGFP fusion protein made the entire cell visible. The cells shown are typical for each treatment. For PKCε cells with processes are shown. (B and C) Quantification of the morphological effects shown in A. The number of transfected SK-N-BE(2) (B) and SH-SY5Y (C) cells with processes longer than the length of two cell bodies were counted. Data (mean ± SEM, n = 3) are presented as percent transfected cells with long processes. (D) Following transfection of SH-SY5Y and SK-N-BE(2) cells with EGFP or εFLE. 2 μM GF109203X was added to the medium. Cells were fixed 16 h after transfection and the number of cells with long processes were counted. Data (mean ± SEM, n = 2) are presented as transfected cells with long processes.
The morphological effects of the overexpression of PKC isoforms were quantified by counting the number of transfected cells with cell processes longer than the length of two cell bodies. In SK-N-BE(2) cells, overexpression of εFLE induced long processes in 41% of the transfected cells, a substantially higher number than cells expressing EGFP only, where 6% of transfected cells had long processes. This effect was specific for PKCε, as overexpression of neither αFLE, βIIFLE, nor δFLE resulted in an increased number of cells with long processes (Fig. 2 B). A similar, but less pronounced pattern was observed in SH-SY5Y cells where overexpression of εFLE lead to 23% transfectants with long processes compared with 12% for cells expressing EGFP only. As in the case of the SK-N-BE(2) cells, overexpression of other PKC isoforms did not induce processes (Fig. 2 C). To exclude a potential role of EGFP in the PKCε effect, cDNA for PKCα and ε were transferred from αFL and εFL, respectively, to the CMS– EGFP vector as a control. In these constructs PKC and EGFP are expressed as separate proteins. SK-N-BE(2) cells were transfected with these vectors, and 5% of PKCα and 31% of PKCε overexpressing cells had processes. This demonstrates that the process induction of PKCε–EGFP is not dependent on EGFP.
To investigate whether the changes in cell morphology provoked by overexpression of PKCε–EGFP can be blocked by inhibition of PKC, the transfectants were treated with GF109203X (Fig. 2 D). This inhibitor did not cause a decrease in the percentage of transfected cells with long processes. The concentration used (2 μM) is in the range that inhibits the catalytic activity of classical and novel PKC isoforms in vitro (Martiny-Baron et al., 1993) and blocks TPA-induced expression of fos and jun genes in neuroblastoma cells (Ding et al., 1998). Thus, the induction of processes by PKCε appears to be independent of the catalytic activity of the enzyme.
The Regulatory Domain of PKCε Is Sufficient to Induce Processes
The fact that overexpression of full-length PKCε induced processes in the presence of GF109203X suggested an independence of the kinase activity. To analyze whether the PKC RD is sufficient for the effect, vectors coding for the RDs of PKCα, β, δ, and ε fused to EGFP, were created. The RDs of the remaining novel isoforms PKCη and PKCθ, which are not expressed in neuroblastoma cells, were also included as a comparison (Fig. 1 A). All constructs were sequenced and found free of mutations. The constructs were expressed in COS cells (Fig. 1 C) where Western blot analysis confirmed formation of proteins of the anticipated sizes.
SH-SY5Y and SK-N-BE(2) cells were transfected with the vectors and all fusion proteins gave rise to fluorescence of similar intensity in transfected cells (Fig. 3), with the exception of θRDE. θRDE caused a weaker fluorescence suggesting lower levels of this protein. As in the case for full-length PKCα and PKCβII, their corresponding RD–EGFP fusion proteins localized mainly outside the nucleus with a tendency to perinuclear enrichment (Fig. 3 A). Neither of these RDs induced a major increase in the number of cells with processes (Fig. 3, B and C). In contrast, transfection with the δRDE, εRDE, and ηRDE constructs led to a drastic change in cell morphology, most prominent in εRDE transfectants. Overexpression of these proteins gave rise to 19% (δRDE), 32% (εRDE), and 25% (ηRDE) SH-SY5Y cells with long processes. The corresponding numbers for SK-N-BE(2) cells were 55% (δRDE), 56% (εRDE), and 46% (ηRDE). The fusion proteins seemed to be localized mainly to perinuclear structures and the cell periphery. θRDE seemed to localize to all parts of the cells and long processes were induced in 12% of the transfected SH-SY5Y cells and 20% of the SK-N-BE(2) cells.
Figure 3.

Induction of processes by overexpression of the RD of novel PKC isoforms. SH-SY5Y and SK-N-BE(2) cells were transfected with expression vectors coding for the RD of PKCα (α), PKCβ (β), PKCδ (δ), PKCε (ε), PKCη (η), or PKCθ (θ) fused to EGFP or vector coding for EGFP only. Cells were fixed 16 h after transfection with 4% paraformaldehyde and mounted on object slides. (A) Fluorescent images of neuroblastoma cells expressing PKC–RD–EGFP fusion proteins. The fluorescence from EGFP made the entire cell visible. The cells shown are typical for each treatment. For δRDE, εRDE, and ηRDE, cells with processes are shown. The effect of expression of EGFP only is depicted in Fig. 2 A. (B and C) Transfected SH-SY5Y (B) and SK-N-BE(2) (C) cells with processes were counted. Data (mean ± SEM, n = 3–5) are presented as percent transfected cells with processes.
The Pseudosubstrate, C1 Domains, and Parts of the V3 Domain from PKCε Are Required for Process Induction
To clarify which parts of the RD that are essential for the induction of processes, a series of constructs coding for different parts of εRDE was created (Fig. 1 A). The constructs were sequenced and transfected into COS cells, where proteins of expected sizes were detected in cell lysates with Western blot analysis using a GFP antibody (Fig. 1 D). The PKCε subdomains were expressed in SH-SY5Y (Fig. 4, A and B) and SK-N-BE(2) cells (Fig. 4 C), and proteins gave rise to bright fluorescence of similar intensity suggesting no major difference in intracellular concentration.
Figure 4.

Process-inducing effects of overexpression of different parts of the RD of PKCε. SH-SY5Y cells were transfected with expression vectors coding for εRDE, εC2PSC1E, εC2PSE, εC2E, εPSE, εPSC1aE, εPSC1E, εPSC1V3E, εC1V3E, and εC1E (see Fig. 1 for description of constructs). The cells were fixed and mounted 16 h after transfection. (A) Fluorescence images of SH-SY5Y cells expressing the fusion proteins were taken using a standard FITC filter. The cells shown are typical for each treatment. For εRDE and εPSC1V3E, cells with processes are shown. (B and C) Quantification of the number of SH-SY5Y (B) and SK-N-BE(2) (C) transfectants with processes longer than two cell bodies, expressed as percentage (mean ± SEM, n = 3–5) of transfected cells for each construct.
All fusion proteins containing the two C1 domains (εRDE, εC2PSC1E, εPSC1E, εPSC1V3E, εC1V3E, and εC1E; see Fig. 1 A for structural description) were not detected in the nucleus, and displayed a tendency to enrich in perinuclear structures (Fig. 4 A). Some fusion proteins, particularly εRDE and εPSC1V3E, also seemed to localize to the plasma membrane. C2-containing proteins without the C1 domains (εC2E and εC2PSE; see Fig. 1 A) localized throughout the cell, and the smaller proteins (εPSE and εPSC1aE) were primarily present in the nucleus.
When cell morphology was examined, it was evident that the fragment from PKCε containing the pseudosubstrate, the C1 domains, and the V3 region (εPSC1V3E) was necessary and sufficient to induce processes (Fig. 4, A–C). 48% of the SH-SY5Y cells expressing this protein exhibited long processes. In SK-N-BE(2), the corresponding number was 59%. When the pseudosubstrate (εC1V3E) or the V3 (εPSC1E) was removed from the PSC1V3 fragment, no substantial induction of processes could be observed in either cell line. It is notable that in SH-SY5Y cells more εPSC1V3- than εRDE-expressing cells had processes (48% versus 36%), suggesting that removal of the C2 domain enhances the process-inducing capacity (Fig. 4 B). It was also evident that the other constructs did not have a major effect on process induction.
Intracellular Distribution of PKCε Subdomain Fragments
Fluorescence microscopy suggested that the PKCε fragments localized to different intracellular sites. To investigate a possible correlation between the localization and process-inducing ability of the fragments, transfected SH-SY5Y cells were analyzed with confocal microscopy (Fig. 5). Full-length PKCε fused to EGFP localized uniformly outside the nucleus. The smallest fragment that induced processes, εPSC1V3E, displayed a distinct plasma membrane localization. Removal of the pseudosubstrate led to the complete loss of plasma membrane localization, as εC1V3E could only be seen in the perinuclear area of the cell. This suggests that the pseudosubstrate might be necessary for targeting of PKCε to the plasma membrane (Fig. 5). Removal of the hinge region from the PSC1V3 fragment generating εPSC1E, which is incapable of inducing processes, did not cause a loss of plasma membrane localization (Fig. 5). In conclusion, these data suggest that localization to the plasma membrane, for which the pseudosubstrate and the C1 domains are required, is necessary, but not sufficient for the process induction. The V3 region needs to be present for optimal function of the fragment.
Figure 5.

Localization of PKCε constructs determined by confocal microscopy. SH-SY5Y cells were transfected with εFLE, εPSC1V3E, εPSC1E, and εC1V3E. 16 h after transfection the cells were fixed and mounted, and the localization of the fusion proteins was examined with confocal microscopy.
Inhibition of Process Outgrowth by the Use of Inhibitory PKCε Constructs
The previous results demonstrate that PKCε through the PSC1V3 fragment has the capacity to induce processes in neuroblastoma cells. To address the question of whether this capacity is a part of the molecular events driving neurite outgrowth in neuroblastoma cells differentiating in response to growth factors and RA, an attempt was made to find an εPSC1V3E-derived construct that could inhibit the process formation, putatively by acting in a dominant-negative manner. The two constructs that were most similar to εPSC1V3E, i.e., εPSC1E and εC1V3E, and did not display a process-inducing capacity, were initially evaluated for this purpose. Neither construct had a major effect on neurite outgrowth in RA-differentiated SK-N-BE(2) cells (data not shown). Thereafter, cDNA coding for either the first (C1a) or the second (C1b) C1 domain was deleted in the εPSC1V3E construct, forming εPSC1bV3E and εPSC1aV3E, respectively (Fig. 1, A and D). SK-N-BE(2) cells were transfected with these vectors, and vector coding for EGFP only (Fig. 6 A). Neither protein induced processes in untreated cells, demonstrating that both C1 domains are required for this effect. In fact, there was a slight suppression of the number of cells with processes in εPSC1aV3E-expressing cells (Fig. 6 A). After treatment with RA, 57% of EGFP-expressing cells and 52% of εPSC1bV3E-transfected cells had neurites. In contrast, only 18% of εPSC1aV3E-expressing cells had processes, demonstrating a neurite suppressing effect of this protein. Treatment with CNTF gave results that followed the same pattern as in RA, albeit with generally fewer neurite extending cells (Fig. 6 A).
Figure 6.

Inhibition of RA-, growth factor-, and PKCε-induced processes by C1-deleted PKCε constructs. SK-N-BE(2) (A) and SH-SY5Y/TrkA (B) cells were transfected with expression vectors coding for εPSC1aV3E and εPSC1bV3E, or vector coding for EGFP only (see Fig. 1 for description of constructs). After transfection the cells were treated for 40 h with factors known to promote differentiation of these cell lines: 10 μM RA or 25 ng/ml CNTF for SK-N-BE(2) cells; and 100 ng/ml NGF for SH-SY5Y/ TrkA cells. The cells were fixed and mounted 40 h after transfection and the number of SK-N-BE(2) and SH-SY5Y/TrkA transfectants with processes longer than two cell bodies were quantified. Data are expressed as percentage of transfected cells with neurites (mean ± SEM, n = 3–4). (C and D) SK-N-BE(2) cells were either transfected with indicated plasmids or subjected to a cotransfection with εFLE (C) or εPSC1V3E (D), and εPSC1V3aE or εPSC1V3bE, in a 1:3 ratio, and fixed and mounted 16 h after transfection. A total amount of 2 μg DNA was used for each transfection. Fluorescent cells with processes were quantified and expressed as percentage (mean ± SEM, n = 4–10) of transfected cells.
The constructs were also evaluated for NGF-driven neurite outgrowth of SH-SY5Y cells stably expressing the high affinity NGF receptor, TrkA (Fig. 6 B). Also in this differentiation protocol, expression of εPSC1aV3E, but not εPSC1bV3E, caused a substantial decrease in the number of neurite-bearing cells, both in control and NGF-exposed cells. These results demonstrate that the protein lacking the second C1 domain (εPSC1aV3) inhibits neurite outgrowth in several neuronal differentiation protocols, whereas the protein with the first C1 domain deleted (εPSC1bV3E) has no such effect.
To test whether the C1-deleted constructs have similar effects on processes induced by overexpression of PKCε or εPSC1V3E, εFLE and εPSC1V3E were cotransfected with εPSC1aV3E or εPSC1bV3E at a 1:3 ratio into SK-N-BE(2) cells (Fig. 6, C and D). Cotransfection with εPSC1bV3E gave rise to fewer cells with processes than when either εFLE or εPSC1V3E alone was transfected, but substantially more process-bearing cells than when εPSC1bV3E alone was transfected into the cells. It is likely that the lower number of cells with processes in this cotransfection protocol could be due to a significant proportion of cells expressing only εPSC1bV3E, cells that will fluoresce, but will not have processes. On the other hand, cotransfection with εPSC1aV3E gave a lower number of cells with processes than did cotransfection with εPSC1bV3E. Thus, the εPSC1V3 fragment with the second C1 domain deleted (εPSC1aV3E) acts in a dominant-negative manner both suppressing processes induced by overexpression of PKCε and inhibiting neurite outgrowth in several neuronal differentiation protocols. This suggests that the effect of the PSC1V3 region from PKCε may be a common mechanism for these processes.
Characteristics of εPSC1V3E-induced Processes
All PKCε-derived, process-inducing constructs caused similar morphological changes of transfected cells. The outgrowth of processes was accompanied by a shrinkage of the cytoplasm and a rounding up of the cell body, which was most apparent in SK-N-BE(2) cells. Untreated SH-SY5Y cells generally have smaller cell bodies than SK-N-BE(2) cells, but a tendency towards rounding up of the cell body was observed in the SH-SY5Y cells, also. The overall morphology of the processes differed slightly between the two cell lines. In SH-SY5Y cells, generally one process per cell was observed, but this process frequently carried several branches of various lengths (Figs. 2 A, ε; 3 A, δ; and 4 A, PSC1V3), but in some cells two or more processes extending from the same cell were seen (Fig. 3 A, ε and η). The SK-N-BE(2) cells generally had more than one process per cell, and these processes were frequently branched.
To address whether the εPSC1V3E-induced processes have characteristics associated with neurites, expression of cytoskeletal components and synaptic markers were analyzed. The εPSC1V3E-induced processes in SH-SY5Y cells were compared with neurites obtained after 4 d of treatment with 16 nM TPA, a protocol that causes SH-SY5Y cells to differentiate neuronally (Fig. 7). The experiments show that both εPSC1V3E-induced processes and the neurites of differentiated SH-SY5Y cells were composed of α-tubulin (Fig. 7, A–D) and NF-160 (Fig. 7, E–H). The cells were also stained for F-actin (Fig. 7, I–L), which besides staining of the main branches of the processes, also revealed an intense staining either at the tip of the processes (Fig. 7 L) or at sites where the processes have sharp bends (not shown). These actin-rich structures resemble the growth cones in TPA-differentiated cells (Fig. 7 J), suggesting that εPSC1V3E-induced processes express growth cones. Staining for the presence of synaptic proteins NPY (Fig. 7, M–P) and synaptophysin (Fig. 7, Q–T) in TPA differentiated SH-SY5Y cells (Fig. 7, M, N, Q, and R) was positive, while the processes of cells transfected with εPSC1V3E were negative (Fig. 7, O, P, S, and T). This shows that εPSC1V3E-induced processes are neurite-like, but lack important properties of functional neurites. Furthermore, no overall increase in the expression of NPY or synaptophysin could be detected in the εPSC1V3E- transfected cells, suggesting that this PKCε fragment does not induce complete differentiation of neuroblastoma cells. The characteristics of processes induced by εFLE were similar to εPSC1V3E-induced processes (not shown).
Figure 7.
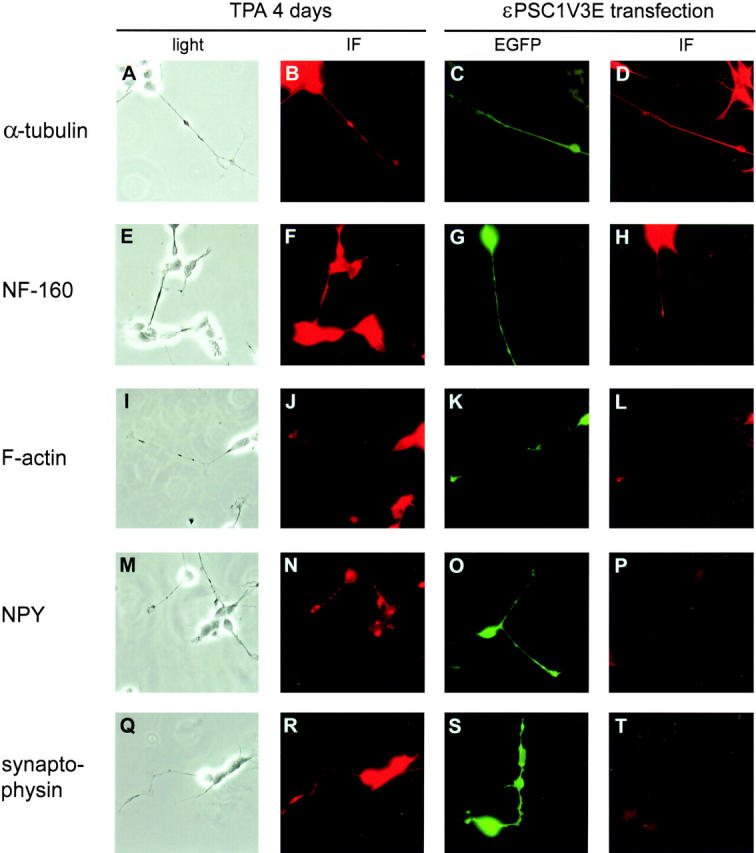
Phenotypic characterization of processes induced by εPSC1V3. SH-SY5Y cells overexpressing εPSC1V3E were compared with TPA-differentiated SH-SY5Y cells for cytoskeletal composition and expression of synaptic proteins. 16 h after transfection with εPSC1V3E, or after 4 d of treatment with 16 nM TPA of SH-SY5Y cells, the cells were fixed, and immunofluorescence with TRITC-conjugated secondary antibodies or TRITC-phalloidin staining of F-actin was performed. TPA-differentiated (A, B, E, F, I, J, M, N, Q, and R) and εPSC1V3E-expressing cells (C, D, G, H, K, L, O, P, S, and T) were analyzed for expression of α-tubulin (B and D), NF-160 (F and H), F-actin (J and L), NPY (N and P), and synaptophysin (R and T). εPSC1V3-transfected cells were visualized using the fluorescence of EGFP (C, G, K, O, and S). The weak staining seen in P and T was similar to the background staining seen when only secondary antibody was used.
Colocalization of PKCε–EGFP and F-Actin
An interesting issue is why overexpression of the RDs of both PKCε and PKCδ (εRDE and δRDE) induced processes, whereas for full-length isoforms the same effect only was obtained with PKCε (εFLE) and not with PKCδ (δFLE). A unique feature of PKCε, compared with other isoforms, is the presence of an actin-binding site between the C1 domains (Prekeris et al., 1996). Binding to F-actin via this site in vitro has been shown to maintain PKCε in an open conformation (Prekeris et al., 1998), which may result in exposure of structures in the RD essential for the process-inducing capacity of this isoform. If this interaction is important for the process induction of εFLE, it would be expected to detect colocalization of F-actin and εFLE. F-actin in εFLE-transfected SH-SY5Y cells was stained with Texas red–conjugated phalloidin and the colocalization of F-actin and εFLE was analyzed with confocal microscopy. Several processes were analyzed and it was evident that the proteins were colocalized in some parts of the processes (Fig. 8). This result thus indicates that an interaction between εFLE and F-actin may take place in the processes.
Figure 8.

Colocalization of PKCε–EGFP and F-actin. F-actin in SH-SY5Y cells overexpressing εFLE was stained with Texas red–conjugated phalloidin and colocalization of the proteins was analyzed with confocal microscopy. Confocal images of a process demonstrate localization of εFLE (A), Texas red– phalloidin-labeled F-actin (B), and a merger of the two images (C). The graph (D) shows the EGFP and Texas red intensity of each pixel in C. Pixels which display fluorescence from both EGFP and Texas red, indicating colocalization of εFLE and F-actin, are included in the rectangle in D and shown in white in E. Similar experiments analyzing each fluorophore by itself demonstrated that there was no leakage of fluorescent signal into the other channel. The result, colocalization in some parts of the processes, is representative of six processes from two separate experiments.
Discussion
This study was designed to examine the role of PKC isoforms in neurite outgrowth regulation and identify structures in the PKC molecule of importance for its function in this process. For this purpose, we used neuroblastoma cell lines which have been extensively used to study neuronal differentiation. Of the classical and novel PKC isoforms that are consistently expressed in neuroblastoma cells (PKCα, βII, δ and ε; Zeidman et al., 1999), only overexpression of PKCε induced processes in these cells. PKCε has been suggested to be of importance for neurite outgrowth in PC12 cells where overexpression of PKCε, but not PKCδ, potentiated NGF-induced neurite outgrowth (Hundle et al., 1995). The effect of PKCε in PC12 cells was suppressed by PKC inhibitors, which contrasts the results in the present study which demonstrates that the effect of PKCε was independent of its kinase activity. Furthermore, in PC12 cells, overexpression of PKCε did not by itself induce processes. It is thus likely that PKCε may regulate neurite outgrowth by a number of mechanisms. In neuroblastoma cells, several PKC isoforms are enriched in growth cones, but studies with phorbol ester treatment, which downregulates the classical isoforms, have suggested a role for PKCε or another novel isoform in supporting the growth cone (Fagerström et al., 1996). These facts, together with the results from the present study, highlight PKCε as one PKC isoform of importance in neurite outgrowth regulation.
In this study, the PKC isoforms were fused to EGFP to visualize transfected cells and to facilitate an examination of the intracellular distribution of the expressed proteins. EGFP, in its native fluorescent form, is a highly condensed molecule (Ormö et al., 1996). Approaches to fuse PKC isoforms with GFP variants have been successfully used to follow the translocation of PKCβII (Feng et al., 1998), PKCγ (Sakai et al., 1997), PKCδ (Ohmori et al., 1998; Shirai et al., 1998), and PKCε (Shirai et al., 1998). When examined, this fusion has been shown not to influence the catalytic activity of the enzyme. GFP variants have also been fused to smaller proteins or isolated domains, such as histone 2B (Kanda et al., 1998), pleckstrin homology domains (Stauffer et al., 1998), and PKC C1 domains (Oancea et al., 1998) without any obvious loss of function. Furthermore, as shown in this study, regardless if the position of EGFP was at the COOH terminus of intact PKCε or if it was placed COOH-terminally of the RD in constructs where the catalytic domain was deleted, processes were induced in neuroblastoma cells. This suggests that the effect on the process induction is independent of the position of EGFP. Processes were also induced when PKCε, without being fused to EGFP, was overexpressed. Several subdomains of PKCε that were fused to EGFP did not induce processes at all, further indicating that the effects observed in this study are not mediated by EGFP.
As previously mentioned, the effect of PKCε was independent of enzymatic activity and of the presence of the catalytic domain, since expression of the RD was sufficient to induce processes. In fact, the RD could induce processes more potently than the full-length PKCε, suggesting that the catalytic domain may inhibit this function of the RD. The RD from PKCδ and η also induced processes in the transfected cells, despite the inability of full-length PKCδ to do so. Cells transfected with θRDE displayed less fluorescence than the other RD transfectants, probably indicating a lower level of expression of fusion protein in these transfectants. It is possible that the RD from PKCθ would have had the same effect if the protein levels in each individual cell had been higher. These results may suggest that the novel isoforms PKCδ and PKCη, and perhaps PKCθ, could have the capacity to induce processes under proper conditions. An interesting feature possibly explaining the selective effect of full-length PKCε, is the actin binding site which is present only in this isoform (Prekeris et al., 1996). When PKCε binds actin it is maintained in an open active confirmation exposing the catalytic domains and the RDs (Prekeris et al., 1998), which thereby can exert its activity. There was a colocalization of εFLE and F-actin in processes, a finding which may indicate that this interaction might be important for the selective effect of PKCε, although further experimentation is necessary to establish this interaction as crucial for process induction.
The finding that the PKCε effect is insensitive to PKC inhibitors and could be mimicked by the RD is somewhat surprising. Since RDs of PKC isoforms have been suggested to act in a dominant-negative manner, the effects obtained in this study may be due to a dominant-negative effect of PKCε and its RD on another endogenous PKC isoform. If this were the case, it would be expected to see an induction of processes upon inhibition of this isoform with PKC inhibitors. However, treatment of the neuroblastoma cells with GF109203X did not cause an elevated number of processes. It could be argued that this lack of process induction is due to the fact that GF109203X also inhibits other kinases that are critical for the induction of processes. If so, it would be expected that GF109203X should suppress the processes also in PKCε-overexpressing cells, since the kinase of importance for processes also would be inhibited under these conditions. Furthermore, if the effects of the PKCε constructs are dominant-negative, the suppression by εPSC1aV3E of PKCε-induced processes, RA-, and NGF-induced neurites implies that this construct would act in a dominant-negative manner towards a dominant-negative effect in the first case, whereas in the latter protocols it would simply act in a dominant-negative way. Therefore, we think that the most plausible explanation for the effects observed in this paper is that PKCε RD induces processes through a mechanism that does not involve dominant-negative effects.
There are other reports where parts of, or the entire PKC RD exert the same effects as the complete enzyme. PKCα was shown to activate phospholipase D in a PKC activator-dependent, but PKC activity-independent fashion, and phospholipase D was activated by PKCα regulatory, but not catalytic domain in vitro (Singer et al., 1996). Another example is the inhibition of Golgi-specific sulfation of glycosaminoglycan chains in cells overexpressing PKCε, which can be mimicked by overexpressing the PKCε C1 domains only (Lehel et al., 1995a).
When examining the role of the different domains of PKCε RD in process induction, it was evident that a fragment centering on the two C1 domains was sufficient and necessary for this effect. Interestingly, the C2 domain, which is of importance for RACK binding (Csukai et al., 1997), was not of importance for the process-inducing capacity. In fact, expression in SH-SY5Y cells suggested that removal of the C2 domain from the RD, generating PSC1V3, slightly increased the ability to induce processes. There are several examples demonstrating that protein interaction with the RD is mediated via the C1 domains. Beside the previously mentioned actin binding site in PKCε located between the C1 domains (Prekeris et al., 1996), a homologue of 14-3-3 has been shown to bind the Dictyostelium myosin II heavy chain-specific PKC through the PKC C1 domain (Matto-Yelin et al., 1997). In addition, binding of the pleckstrin homology domain from the tyrosine kinase Btk was shown to be dependent on the pseudosubstrate and the C1 domain from PKCε (Yao et al., 1997). Using an overlay assay, it was shown that the second C1 domain from PKCγ bound several proteins from Xenopus laevis oocyte cytosol extracts (Pawelczyk et al., 1998). Taken together, these results indicate an important role for the C1 domains in PKC protein interactions. Thus, it is conceivable that the effects observed in this study are due to the C1 domains interacting with other proteins, thereby eliciting the observed morphological changes. However, there was also a dependence on the pseudosubstrate and parts of the V3 domain for the induction of processes. These structures have been shown to be of importance for localization of PKCε C1 domains to the plasma membrane in NIH3T3 fibroblasts (Lehel et al., 1995b). In line with that report, the process-inducing fragment, PSC1V3, localized almost exclusively to the plasma membrane, but this localization was lost when the pseudosubstrate was removed. This was accompanied with a loss of process-inducing capacity, which suggests that a plasma membrane localization is necessary for this effect. However, a plasma membrane localization per se of the C1 domains is not sufficient, since the PSC1 fragment to a large extent appeared to be present at the plasma membrane without inducing processes.
Removal of the second, but not of the first, C1 domain generated a fragment that suppressed neurite outgrowth during RA-, CNTF-, and NGF-driven neuronal differentiation. Since this same fragment also acted in a dominant-negative manner towards processes induced by PKCε overexpression, these results suggest that the observed effects of PKCε is not only observed upon overexpression of the protein, but may indeed be of importance for neurite outgrowth that accompanies neuronal differentiation. However, given the abundance of proteins with C1 domains (Hurley et al., 1997), it cannot be excluded that during neuronal differentiation effects reported in this study are mediated via other C1 containing proteins. The results obtained with the C1-deleted constructs also illustrate the different properties of the two C1 domains that have been described (Szallasi et al., 1996; Hunn and Quest, 1997; Bögi et al., 1998).
From the present results, it is not possible to draw definite conclusions regarding the mechanisms whereby PKCε constructs elicit processes. To exclude the possibility that the increase in process-bearing cells is not due to a selection of cells with process-inducing capacity, the number of SH-SY5Y cells expressing EGFP or εRDE following transfection were counted. There was a lower percentage of εRDE-expressing cells (4.1 ± 0.5% of EGFP- versus 2.8 ± 0.6% εRDE-expressing cells), but this difference is too low to account for the increase in process-bearing cells (≤5% in EGFP- to 32% in εRDE-expressing cells). Furthermore, the few processes that could be observed in EGFP-expressing cells were much shorter than processes in cells transfected with PKCε constructs. This was also true for EGFP-expressing cells that were kept in culture for up to 4 d. This suggests that transfection with PKCε constructs does not result in an enhancement of a basal rate of process generation, but rather induces some events that eventually lead to the generation of neurite-like processes. This process generation may be mediated via cytoskeletal mechanisms, effects on the interaction of the cell with the substratum, or some other mechanism. It does not seem to involve altered expression of differentiation-coupled genes, since no increase in expression of NPY or synaptophysin, in the cell bodies or the processes, could be observed in εPSC1V3E-overexpressing cells. These proteins are elevated upon neuronal differentiation of neuroblastoma cells. Thus, it is likely that PKCε overexpression induces processes in undifferentiated cells and does not elicit a complete neuronal differentiation program. Both α-tubulin and NF-160 were present at apparently similar levels in the processes in εPSC1V3E-overexpressing cells and in neurites in neuronally differentiated neuroblastoma cells, indicating that the processes induced by the PKCε fragment to some extent display neuronal features. Such a dissociation between the physical induction of neurites and the accompanying increase in neuronal differentiation markers generally present in neurites has also been observed after overexpression of a constitutively active phosphatidylinositol 3 kinase in PC12 cells (Kobayashi et al., 1997).
In conclusion, this study demonstrates that PKCε, but not PKCα, βII, or δ, induces neurite-like processes in neuroblastoma cells and this effect can be ascribed to a region encompassing the pseudosubstrate, the two C1 domains, and parts of the V3 domain. Identification of a dominant-negative construct derived from this region indicates that this effect of PKCε is of relevance for neurite outgrowth during neuronal differentiation.
Acknowledgments
We thank Linda Pettersson and Stefan Seth for technical assistance.
Abbreviations used in this paper
- CNTF
ciliary neurotrophic factor
- EGFP
enhanced green fluorescent protein
- FL
full-length PKC
- FLE
full-length PKC bound to EGFP
- GFP
green fluorescent protein
- NF-160
neurofilament-160
- NPY
neuropeptide Y
- PKC
protein kinase C
- RA
retinoic acid
- RACK
receptor for activated C-kinase
- RD
regulatory domain
- TPA
12-O-tetradecanoylphorbol-13-acetate
Footnotes
Financial support was obtained from The Swedish Society for Medical Research, The Swedish Cancer Society, The Children's Cancer Foundation of Sweden, HKH Kronprinsessan Lovisas förening för barnasjukvård, Malmö University Hospital Research Funds, and Magnus Bergvall, Crafoord, Ollie and Elof Ericsson, Hans von Kantzow, Gunnar, Arvid, and Elisabeth Nilsson, and John and Augusta Persson Foundations.
References
- Acs P, Wang QJ, Bögi K, Marquez AM, Lorenzo PS, Bíró T, Szállási Z, Mushinski JF, Blumberg PM. Both the catalytic and regulatory domains of protein kinase C chimeras modulate the proliferative properties of NIH 3T3 cells. J Biol Chem. 1997;272:28793–28799. doi: 10.1074/jbc.272.45.28793. [DOI] [PubMed] [Google Scholar]
- Aris JP, Basta PV, Holmes WD, Ballas LM, Moomaw C, Rankl NB, Blobel G, Loomis CR, Burns DJ. Molecular and biochemical characterization of a recombinant human PKC-δ family member. Biochim Biophys Acta. 1993;1174:171–181. doi: 10.1016/0167-4781(93)90111-p. [DOI] [PubMed] [Google Scholar]
- Bögi K, Lorenzo PS, Szállási Z, Ács P, Wagner GS, Blumberg PM. Differential selectivity of ligands for the C1a and C1b phorbol ester binding domains of protein kinase Cδ: possible correlation with tumor-promoting activity. Cancer Res. 1998;58:1423–1428. [PubMed] [Google Scholar]
- Cai H, Smola U, Wixler V, Eisenmann-Tappe I, Diaz-Meco MT, Moscat J, Rapp U, Cooper GM. Role of diacylglycerol-regulated protein kinase C isotypes in growth factor activation of the Raf-1 protein kinase. Mol Cell Biol. 1997;17:732–741. doi: 10.1128/mcb.17.2.732. [DOI] [PMC free article] [PubMed] [Google Scholar]
- Csukai M, Chen C-H, De Matteis MA, Mochly-Rosen D. The coatomer protein β′-COP, a selective binding protein (RACK) for protein kinase Cε. J Biol Chem. 1997;272:29200–29206. doi: 10.1074/jbc.272.46.29200. [DOI] [PubMed] [Google Scholar]
- Ding W-Q, Larsson C, Alling C. Stimulation of muscarinic receptors induces expression of individual fos and jungenes through different transduction pathways. J Neurochem. 1998;70:1722–1729. doi: 10.1046/j.1471-4159.1998.70041722.x. [DOI] [PubMed] [Google Scholar]
- Fagerström S, Påhlman S, Gestblom C, Nånberg E. Protein kinase C-ε is implicated in neurite outgrowth in differentiating human neuroblastoma cells. Cell Growth Differ. 1996;7:775–785. [PubMed] [Google Scholar]
- Feng X, Zhang J, Barak LS, Meyer T, Caron MG, Hannun YA. Visualization of dynamic trafficking of a protein kinase C βII/green fluorescent protein conjugate reveals differences in G protein-coupled receptor activation and desensitization. J Biol Chem. 1998;273:10755–10762. doi: 10.1074/jbc.273.17.10755. [DOI] [PubMed] [Google Scholar]
- Hocevar BA, Burns DJ, Fields AP. Identification of protein kinase C (PKC) phosphorylation sites on human lamin B. Potential role of PKC in nuclear lamina structural dynamics. J Biol Chem. 1993;268:7545–7552. [PubMed] [Google Scholar]
- Hundle B, McMahon T, Dadgar J, Messing RO. Overexpression of ε-protein kinase C enhances nerve growth factor-induced phosphorylation of mitogen-activated protein kinases and neurite outgrowth. J Biol Chem. 1995;270:30134–30140. doi: 10.1074/jbc.270.50.30134. [DOI] [PubMed] [Google Scholar]
- Hundle B, McMahon T, Dadgar J, Chen CH, Mochly-Rosen D, Messing RO. An inhibitory fragment derived from protein kinase Cε prevents enhancement of nerve growth factor responses by ethanol and phorbol esters. J Biol Chem. 1997;272:15028–15035. doi: 10.1074/jbc.272.23.15028. [DOI] [PubMed] [Google Scholar]
- Hunn M, Quest AF. Cysteine-rich regions of protein kinase Cδ are functionally non-equivalent. Differences between cysteine-rich regions of non-calcium-dependent protein kinase Cδ and calcium-dependent protein kinase Cγ. FEBS Lett. 1997;400:226–232. doi: 10.1016/s0014-5793(96)01395-6. [DOI] [PubMed] [Google Scholar]
- Hurley JH, Newton AC, Parker PJ, Blumberg PM, Nishizuka Y. Taxonomy and function of C1 protein kinase C homology domains. Protein Sci. 1997;6:477–480. doi: 10.1002/pro.5560060228. [DOI] [PMC free article] [PubMed] [Google Scholar]
- Ide C. Peripheral nerve regeneration. Neurosci Res. 1996;25:101–121. doi: 10.1016/0168-0102(96)01042-5. [DOI] [PubMed] [Google Scholar]
- Jaken S. Protein kinase C isozymes and substrates. Curr Opin Cell Biol. 1996;8:168–173. doi: 10.1016/s0955-0674(96)80062-7. [DOI] [PubMed] [Google Scholar]
- Johnson JA, Gray MO, Chen CH, Mochly-Rosen D. A protein kinase C translocation inhibitor as an isozyme-selective antagonist of cardiac function. J Biol Chem. 1996;271:24962–24966. doi: 10.1074/jbc.271.40.24962. [DOI] [PubMed] [Google Scholar]
- Kanda T, Sullivan KF, Wahl GM. Histone–GFP fusion protein enables sensitive analysis of chromosome dynamics in living mammalian cells. Curr Biol. 1998;8:377–385. doi: 10.1016/s0960-9822(98)70156-3. [DOI] [PubMed] [Google Scholar]
- Kobayashi M, Nagata S, Kita Y, Nakatsu N, Ihara S, Kaibuchi K, Kuroda S, Ui M, Iba H, Konishi H, et al. Expression of a constitutively active phosphatidylinositol 3-kinase induces process formation in rat PC12 cells. Use of Cre/loxP recombination system. J Biol Chem. 1997;272:16089–16092. doi: 10.1074/jbc.272.26.16089. [DOI] [PubMed] [Google Scholar]
- Lavenius E, Parrow V, Nånberg E, Påhlman S. Basic FGF and IGF-1 promote differentiation of human SH-SY5Y neuroblastoma cells in culture. Growth Factors. 1994;10:29–39. doi: 10.3109/08977199409019601. [DOI] [PubMed] [Google Scholar]
- Lavenius E, Gestblom C, Johansson I, Nånberg E, Påhlman S. Transfection of TRK-Ainto human neuroblastoma cells restores their ability to differentiate in response to nerve growth factor. Cell Growth Differ. 1995;6:727–736. [PubMed] [Google Scholar]
- Lehel C, Olah Z, Jakab G, Anderson WB. Protein kinase Cε is localized to the Golgi via its zinc-finger domain and modulates Golgi function. Proc Natl Acad Sci USA. 1995a;92:1406–1410. doi: 10.1073/pnas.92.5.1406. [DOI] [PMC free article] [PubMed] [Google Scholar]
- Lehel C, Oláh Z, Jakab G, Szállási Z, Petrovics G, Harta G, Blumberg PM, Anderson WB. Protein kinase C ε subcellular localization domains and proteolytic degradation sites. A model for protein kinase C conformational changes. J Biol Chem. 1995b;270:19651–19658. doi: 10.1074/jbc.270.33.19651. [DOI] [PubMed] [Google Scholar]
- Liao L, Ramsay K, Jaken S. Protein kinase C isozymes in progressively transformed rat embryo fibroblasts. Cell Growth Differ. 1994;5:1185–1194. [PubMed] [Google Scholar]
- Liu J-P. Protein kinase C and its substrates. Mol Cell Endocrinol. 1996;116:1–29. doi: 10.1016/0303-7207(95)03706-3. [DOI] [PubMed] [Google Scholar]
- Martiny-Baron G, Kazanietz MG, Mischak H, Blumberg PM, Kochs G, Hug H, Marme D, Schächtele C. Selective inhibition of protein kinase C isozymes by the indolocarbazole Gö6976. J Biol Chem. 1993;268:9194–9197. [PubMed] [Google Scholar]
- Matto-Yelin M, Aitken A, Ravid S. 14-3-3 inhibits the dictyostelium myosin II heavy-chain-specific protein kinase C activity by a direct interaction: identification of the 14-3-3 binding domain. Mol Biol Cell. 1997;8:1889–1899. doi: 10.1091/mbc.8.10.1889. [DOI] [PMC free article] [PubMed] [Google Scholar]
- Melino G, Stephanou A, Annicchiarico-Petruzzelli M, Knight RA, Finazzi-Agro A, Lightman SL. Modulation of IGF-2 expression during growth and differentiation of human neuroblastoma cells: retinoic acid may induce IGF-2. Neurosci Lett. 1993;151:187–191. doi: 10.1016/0304-3940(93)90017-f. [DOI] [PubMed] [Google Scholar]
- Mochly-Rosen D, Gordon AS. Anchoring proteins for protein kinase C: a means for isozyme selectivity. FASEB J. 1998;12:35–42. [PubMed] [Google Scholar]
- Newton AC. Protein kinase C: structure, function and regulation. J Biol Chem. 1995;270:28495–28498. doi: 10.1074/jbc.270.48.28495. [DOI] [PubMed] [Google Scholar]
- Newton AC. Regulation of protein kinase C. Curr Opin Cell Biol. 1997;9:161–167. doi: 10.1016/s0955-0674(97)80058-0. [DOI] [PubMed] [Google Scholar]
- Nishizuka Y. Intracellular signaling by hydrolysis of phospholipids and activation of protein kinase C. Science. 1992;258:607–614. doi: 10.1126/science.1411571. [DOI] [PubMed] [Google Scholar]
- Oancea E, Teruel MN, Quest AF, Meyer T. Green fluorescent protein (GFP)-tagged cysteine-rich domains from protein kinase C as fluorescent indicators for diacylglycerol signaling in living cells. J Cell Biol. 1998;140:485–498. doi: 10.1083/jcb.140.3.485. [DOI] [PMC free article] [PubMed] [Google Scholar]
- Ohmori S, Shirai Y, Sakai N, Fujii M, Konishi H, Kikkawa U, Saito N. Three distinct mechanisms for translocation and activation of the δ subspecies of protein kinase C. Mol Cell Biol. 1998;18:5263–5271. doi: 10.1128/mcb.18.9.5263. [DOI] [PMC free article] [PubMed] [Google Scholar]
- Ormö M, Cubitt AB, Kallio K, Gross LA, Tsien RY, Remington SR. Crystal structure of the Aequorea victoriagreen fluorescent protein. Science. 1996;273:1392–1395. doi: 10.1126/science.273.5280.1392. [DOI] [PubMed] [Google Scholar]
- Påhlman S, Odelstad L, Larsson E, Grotte G, Nilsson K. Phenotypic changes of human neuroblastoma cells in culture induced by 12-O-tetradecanoyl-phorbol-13-acetate. Int J Cancer. 1981;28:583–589. doi: 10.1002/ijc.2910280509. [DOI] [PubMed] [Google Scholar]
- Parrow V, Nånberg E, Heikkilä J, Hammerling U, Påhlman S. Protein kinase C remains functionally active during TPA induced neuronal differentiation of SH-SY5Y human neuroblastoma cells. J Cell Physiol. 1992;152:536–544. doi: 10.1002/jcp.1041520313. [DOI] [PubMed] [Google Scholar]
- Parrow V, Fagerström S, Meyerson G, Nånberg E, Påhlman S. Protein kinase C-α and -ε are enriched in growth cones of differentiating SH-SY5Y human neuroblastoma cells. J Neurosci Res. 1995;41:782–791. doi: 10.1002/jnr.490410609. [DOI] [PubMed] [Google Scholar]
- Pawelczyk T, Matecki A, Dettlaff A. Recombinant protein kinase C-γ phorbol binding domain upon microinjection blocked insulin-induced maturation of Xenopus laevisoocytes. FEBS Lett. 1998;423:31–34. doi: 10.1016/s0014-5793(98)00054-4. [DOI] [PubMed] [Google Scholar]
- Ponting CP, Parker PJ. Extending the C2 domain family: C2s in PKCs δ, ε, η, θ, phospholipases, GAPs, and perforin. Protein Sci. 1996;5:162–166. doi: 10.1002/pro.5560050120. [DOI] [PMC free article] [PubMed] [Google Scholar]
- Prekeris R, Mayhew MW, Cooper JB, Terrian DM. Identification and localization of an actin-binding motif that is unique to the epsilon isoform of protein kinase C and participates in the regulation of synaptic function. J Cell Biol. 1996;132:77–90. doi: 10.1083/jcb.132.1.77. [DOI] [PMC free article] [PubMed] [Google Scholar]
- Prekeris R, Hernandez RM, Mayhew M, White MK, Terrian DM. Molecular analysis of the interactions between protein kinase C-ε and filamentous actin. J Biol Chem. 1998;273:26790–26798. doi: 10.1074/jbc.273.41.26790. [DOI] [PubMed] [Google Scholar]
- Ron D, Chen CH, Caldwell J, Jamieson L, Orr E, Mochly-Rosen D. Cloning of an intracellular receptor for protein kinase C: a homolog of the beta subunit of G proteins. Proc Natl Acad Sci USA. 1994;91:839–843. doi: 10.1073/pnas.91.3.839. [DOI] [PMC free article] [PubMed] [Google Scholar]
- Ron D, Luo J, Mochly-Rosen D. C2 region-derived peptides inhibit translocation and function of β protein kinase C in vivo. J Biol Chem. 1995;270:24180–24187. doi: 10.1074/jbc.270.41.24180. [DOI] [PubMed] [Google Scholar]
- Rossino P, Volpe G, Negro A, Callegaro L, Altruda F, Tarone G, Silengo L. Ciliary neurotrophic factor-induced gene expression in human neuroblastoma cell lines. Neurochem Res. 1995;20:675–680. doi: 10.1007/BF01705535. [DOI] [PubMed] [Google Scholar]
- Sakai N, Sasaki K, Ikegaki N, Shirai Y, Ono Y, Saito N. Direct visualization of the translocation of the γ-subspecies of protein kinase C in living cells using fusion proteins with green fluorescent protein. J Cell Biol. 1997;139:1465–1476. doi: 10.1083/jcb.139.6.1465. [DOI] [PMC free article] [PubMed] [Google Scholar]
- Sambrook, J., E.F. Fritsch, and T. Maniatis. 1989. Molecular Cloning: A Laboratory Manual. Cold Spring Harbor Laboratory Press, Cold Spring Harbor, New York. 16.30–16.37.
- Shirai Y, Kashiwagi K, Yagi K, Sakai N, Saito N. Distinct effects of fatty acids on translocation of γ- and ε-subspecies of protein kinase C. J Cell Biol. 1998;143:511–521. doi: 10.1083/jcb.143.2.511. [DOI] [PMC free article] [PubMed] [Google Scholar]
- Singer WD, Brown HA, Jiang X, Sternweis PC. Regulation of phospholipase D by protein kinase C is synergistic with ADP-ribosylation factor and independent of protein kinase activity. J Biol Chem. 1996;271:4504–4510. doi: 10.1074/jbc.271.8.4504. [DOI] [PubMed] [Google Scholar]
- Stabel S, Parker PJ. Protein kinase C. Pharmacol Ther. 1991;51:71–95. doi: 10.1016/0163-7258(91)90042-k. [DOI] [PubMed] [Google Scholar]
- Stauffer TP, Ahn S, Meyer T. Receptor-induced transient reduction in plasma membrane PtdIns(4,5)P2concentration monitored in living cells. Curr Biol. 1998;8:343–346. doi: 10.1016/s0960-9822(98)70135-6. [DOI] [PubMed] [Google Scholar]
- Szallasi Z, Bogi K, Gohari S, Biro T, Acs P, Blumberg PM. Non-equivalent roles for the first and second zinc fingers of protein kinase Cδ. Effect of their mutation on phorbol ester-induced translocation in NIH 3T3 cells. J Biol Chem. 1996;271:18299–18301. doi: 10.1074/jbc.271.31.18299. [DOI] [PubMed] [Google Scholar]
- Wang QJ, Acs P, Goodnight J, Blumberg PM, Mischak H, Mushinski JF. The catalytic domain of PKC-ε, in reciprocal PKC-δ and -ε chimeras, is responsible for conferring tumorigenicity to NIH3T3 cells, whereas both regulatory and catalytic domains of PKC-ε contribute to in vitro transformation. Oncogene. 1998;16:53–60. doi: 10.1038/sj.onc.1201507. [DOI] [PubMed] [Google Scholar]
- Yao L, Suzuki H, Ozawa K, Deng J, Lehel C, Fukamachi H, Anderson WB, Kawakami Y, Kawakami T. Interactions between protein kinase C and pleckstrin homology domains. Inhibition by phosphatidylinositol 4,5-bisphosphate and phorbol 12-myristate 13-acetate. J Biol Chem. 1997;272:13033–13039. doi: 10.1074/jbc.272.20.13033. [DOI] [PubMed] [Google Scholar]
- Zeidman R, Pettersson L, Sailaja PR, Truedsson E, Fagerström S, Påhlman S, Larsson C. Novel and classical protein kinase C isoforms have different functions in proliferation, survival and differentiation of neuroblastoma cells. Int J Cancer. 1999;81:494–501. doi: 10.1002/(sici)1097-0215(19990505)81:3<494::aid-ijc26>3.0.co;2-l. [DOI] [PubMed] [Google Scholar]