

Abstract
We have used digital fluorescence imaging techniques to explore the interplay between mitochondrial Ca2+ uptake and physiological Ca2+ signaling in rat cortical astrocytes. A rise in cytosolic Ca2+ ([Ca2+]cyt), resulting from mobilization of ER Ca2+ stores was followed by a rise in mitochondrial Ca2+ ([Ca2+]m, monitored using rhod-2). Whereas [Ca2+]cyt recovered within ∼1 min, the time to recovery for [Ca2+]m was ∼30 min. Dissipating the mitochondrial membrane potential (Δψm, using the mitochondrial uncoupler carbonyl cyanide p-trifluoromethoxy-phenyl-hydrazone [FCCP] with oligomycin) prevented mitochondrial Ca2+ uptake and slowed the rate of decay of [Ca2+]cyt transients, suggesting that mitochondrial Ca2+ uptake plays a significant role in the clearance of physiological [Ca2+]cyt loads in astrocytes. Ca2+ signals in these cells initiated either by receptor-mediated ER Ca2+ release or mechanical stimulation often consisted of propagating waves (measured using fluo-3). In response to either stimulus, the wave traveled at a mean speed of 22.9 ± 11.2 μm/s (n = 262). This was followed by a wave of mitochondrial depolarization (measured using tetramethylrhodamine ethyl ester [TMRE]), consistent with Ca2+ uptake into mitochondria as the Ca2+ wave traveled across the cell. Collapse of Δψm to prevent mitochondrial Ca2+ uptake significantly increased the rate of propagation of the Ca2+ waves by 50%. Taken together, these data suggest that cytosolic Ca2+ buffering by mitochondria provides a potent mechanism to regulate the localized spread of astrocytic Ca2+ signals.
Keywords: intracellular Ca2+ waves, astrocytes, mitochondria, negative feedback, Ca2+ buffering
Astrocytes were long considered to be passive, structural, and supportive elements, at most maintaining ionic balance and microhomeostasis of the central nervous system (CNS;1 for review see Tower, 1992). It is now clear that they play a more dynamic and active role in long-range signal transmission. A wide array of stimuli, including many neurotransmitters and neuromodulators raise cytosolic Ca2+ ([Ca2+]cyt) and initiate signals that can propagate as Ca2+ waves from cell to cell, probably via gap junctions (Cornell-Bell et al., 1990; Verkhratsky et al., 1998). Active interactions between astrocytes and neurons have been described: astrocytic Ca2+ waves trigger significant elevations of [Ca2+]cyt in neurons (Nedergaard, 1994; Newman and Zahs, 1998) and neuronal activity may trigger Ca2+ waves in hippocampal astrocyte networks (Dani et al., 1992). Altogether, these observations favor an integrated bidirectional neuroglial model of information processing in the CNS (Finkbeiner, 1993).
Recently, it has become clear that the regulation of local [Ca2+]cyt through the activity both of the ER Ca2+-ATPase (Camacho and Lechleiter, 1993; Simpson and Russell, 1997; John et al., 1998) and of the mitochondrial Ca2+ ([Ca2+]m) uptake pathway (Jouaville et al., 1995) may modulate the propagation of Ca2+ waves in some model systems. Specialized ER sites (involved in discrete local Ca2+ release) that support regenerative wave propagation have been shown to correspond to type 2 inositol 1,4,5-trisphosphate (IP3) receptors in rat cortical astrocytes (Sheppard et al., 1997). Mitochondria have been implicated in the determination of wave characteristics in cultured oligodendrocytes and astrocytes (Simpson and Russell, 1996; Simpson et al., 1998), and the velocity of [Ca2+]cyt wave propagation is increased after upregulation of mitochondrial function in Xenopus oocytes (Jouaville et al., 1995).
The impact of mitochondrial calcium uptake on the spatio-temporal characteristics of intracellular Ca2+ signals has been controversial (Gunter, 1994). The high capacity, low affinity (K d for Ca2+ = 5–10 μM) [Ca2+]m uptake pathway has often been considered relevant in the regulation of [Ca2+]cyt only in response to pathological Ca2+ elevations (Carafoli, 1987). The uptake pathway is an electrophoretic mechanism (Ca2+ uniporter) driven by the electrochemical potential gradient across the inner mitochondrial membrane, whereas [Ca2+]m efflux relies on 2 Na+/Ca2+ and 2 H+/Ca2+ exchangers (Denton and McCormack, 1990; Hansford, 1994). A third nonspecific pathway, the mitochondrial permeability transition pore, can be induced under pathological (Crompton and Andreeva, 1993; Bernardi et al., 1994) and perhaps some physiological (Ichas et al., 1997) conditions. Recently, however, Ca2+ uptake into mitochondria in response to physiological Ca2+ signals has been observed directly in a number of different cell types in culture such as endothelial cells (Lawrie et al., 1996), HeLa cells (Rizzuto et al., 1993, 1994), myocytes (Trollinger et al., 1997; Zhou et al., 1998), oligodendrocytes (Simpson and Russell, 1996), astrocytes (Jou et al., 1996; Simpson et al., 1998), hepatocytes (Hajnoczky et al., 1995), rat gonadotropes (Hehl et al., 1996), T lymphocytes (Hoth et al., 1997), adrenal chromaffin cells (Herrington et al., 1996; Babcock et al., 1997), and inferred by more indirect measures in sensory neurons (Thayer and Miller, 1990; Duchen, 1992).
The present study was undertaken with two aims: (1) to characterize the mitochondrial response to physiological Ca2+ signaling in cultured adult rat cortical astrocytes and (2) to define the impact of mitochondrial Ca2+ uptake on the propagation of intracellular Ca2+ waves. Some of this work has been described in abstract form (Duchen, M.R., A. Leyssens, M.H. Mojet, and S. Peuchen. 1996. J. Physiol. Lond. 494:6–7; Boitier, E., R. Rea, and M.R. Duchen. 1999. Biophys J. 76:A223).
Materials and Methods
Materials
All chemicals were obtained from Sigma Chemical Co. unless stated otherwise. All tissue plastics and tissue culture media were obtained from GIBCO BRL. All fluorescence indicators were from Molecular Probes Inc.
Culture of Adult Rat Cortical Astrocytes
The procedure is essentially as described by Peuchen et al. (1996b) with slight modifications. A sucrose-based separation step was added to the procedure to aid in the removal of cell debris and dense myelin, thereby promoting cell attachment and growth. Earle's balanced salt solution (EBSS) was used throughout the isolation protocol for incubations and washes.
Cerebra were taken from 5- to 8-wk-old Sprague-Dawley rats. The cortex was separated from the other brain structures, the meninges and blood vessels were removed. The tissue, kept at 4°C, was chopped into small pieces, resuspended in EBSS, and forced through a 280-μm metal mesh (tissue pan; Sigma Chemicals Co). The filtered suspension was washed by centrifugation at 400 g for 4 min at room temperature. The pellet was resuspended in a Ca2+, Mg2+–free EBSS solution containing 50,000 U/ml trypsin (EC 3.4.21.4, isolated from porcine pancreas), 1.033 U/ml collagenase (EC 3.4.24.3, type XI, isolated from Clostridium histolyticum), 336 U/ml deoxyribonucleate 5′-oligonucleotidohydrolase (EC 3.1.21.1, type IV, isolated from bovine pancreas). The enzymatic digestion was stopped after 15 min at 36°C by the addition of 10% heat-inactivated FBS. The suspension was gravity-filtered through a 140-μm metal mesh and centrifuged at 400 g for 6 min. The pellet, resuspended in EBSS, was layered over a 0.4-M sucrose solution (molecular biology grade; BDH Chemicals Ltd.) and centrifuged at 400 g for 10 min. The resulting pellet was washed twice in EBSS, followed by one wash in d-valine–based minimum essential medium (MEM) with Earle's salts. The pellet was resuspended in d-valine MEM, which inhibits the growth of fibroblasts and endothelial cells, supplemented with 5% FBS, 2 mM glutamine, and 1 mM malate, and transferred to tissue culture flasks precoated with 0.01% poly- d-lysine. The flasks were placed in an incubator (95% air, 5% CO2, at 36°C) for 20–40 h, after which the medium was refreshed. After 6 d in culture, the supplemented d-valine MEM was replaced with MEM supplemented with l-valine. The cells reached confluency at 12–14 d in vitro and were harvested and reseeded onto 24-mm-diam glass coverslips (BDH) precoated with 0.01% poly-d-lysine for fluorescence measurements.
Fluorescence Digital Imaging
Three or more days before experiment, astrocytes were plated onto glass coverslips with an initial plating density of ∼7,000 cells/cm2. Cells were washed with a physiological saline containing 156 mM NaCl, 3 mM KCl, 2 mM MgSO4, 1.25 mM KH2PO4, 2 mM CaCl2, 10 mM glucose, and 7.5 mM Hepes at pH 7.35.
Rhod-2 Fluorescence.
For the qualitative measurement of [Ca2+]m and [Ca2+]n the cells were loaded with 4.5 μM rhod-2/AM in the presence of 0.005% Pluronics 127 for 30 min at room temperature and washed thoroughly. Rhod-2 fluorescence was excited at 560 nm and emitted fluorescence was collected through a 590-nm-long pass barrier filter. High resolution imaging enabled identification of individual mitochondria for analysis.
Simultaneous Recording of Rhod-2 and Fura-2 Fluorescence.
To demonstrate that rhod-2 could be used to monitor changes in nuclear Ca2+, the cells were loaded with 4.5 μM rhod-2/AM and 4.5 μM fura-2/AM in the presence of 0.005% Pluronics 127 for 30 min at room temperature. The dyes were excited sequentially at 490 (for rhod-2), 340, and 380 nm (for fura-2) using specific filters housed in a computer-controlled filter wheel (Cairn Research Ltd.) and fluorescence at wavelengths longer than 520 nm was measured.
Fluo-3 Fluorescence.
For analysis of [Ca2+]cyt waves in single astrocytes, the cells were loaded with 4.5 μM fluo-3/AM in the presence of 0.005% Pluronics 127 for 30 min at room temperature. Fluo-3 was excited at 490 nm and emitted fluorescence ≥ 530 nm was collected.
TMRE Fluorescence.
For analysis of changes in mitochondrial membrane potential (Δψm), cells were loaded with 3 μM of tetramethylrhodamine ethyl ester (TMRE) for 15 min at room temperature. TMRE fluorescence was excited at 546 nm and emitted fluorescence was collected through a 590-nm-long pass barrier filter.
Digital Imaging.
Fluorescence measurements were obtained via an epifluorescence inverted microscope (Nikon Diaphot) equipped with an oil immersion 63× fluorite objective (NA 1.3). Fluorescence was excited using a 75 W xenon arc lamp and emitted light projected onto the face of a slow scan, frame transfer 800 × 600 pixel, 12 bit cooled CCD camera (Digital Pixel Ltd.), acquisition rate ∼2 frames per second full frame, binning pixels 3 × 3. To resolve the rising phases of both nuclear and [Ca2+]m signals and to monitor wave propagation better, fast imaging was carried out using a fast readout, cooled interline transfer CCD camera (model 4880; Hamamatsu Phototonics) allowing image acquisition rates up to 50 images per second with pixels binning at 4 × 4. All imaging data were acquired and analyzed using software from Kinetic Imaging. Because rhod-2, fluo-3, and TMRE are single wavelength fluorescent indicators, it was not possible to apply the ratiometric method for quantitative determination of [Ca2+]m, [Ca2+]cyt, and Δψm, respectively. Therefore, the information derived from the measurements of rhod-2, fluo-3, and TMRE fluorescence was normalized as a function of the first image. Nuclear Ca2+ ([Ca2+]n) monitored by fura-2 was expressed as the ratio of fura-2 fluorescence after excitation at 340 and 380 nm. All imaging experiments were carried out at room temperature. Greater care was taken for the wave propagation experiments with an average temperature of 21 ± 1°C to avoid any artifact due to the temperature-dependence of Ca2+ wave kinetics (Lechleiter and Clapham, 1992). Excitatory light was kept to a minimum with neutral density filters and a computer-controlled shutter to minimize photobleaching and photodynamic injury to cells.
Confocal microscopy was used for colocalization studies and for high spatial resolution of mitochondrial depolarization waves. In brief, astrocytes were dual-loaded with rhod-2/AM as described above and with 20 nM MitoFluor Green/AM for 30 min at room temperature. Cells were imaged using a confocal laser scanning microscope (model 510; Carl Zeiss, Inc.). Cells were illuminated using the 488-nm emission line of an argon laser and fluorescence was collected simultaneously between 505 and 530 nm for MitoFluor Green and at λ ≥ 585 nm for rhod-2. To spatially resolve waves of mitochondrial depolarization, astrocytes were loaded with TMRE as described above and were illuminated with the 488-nm emission line. Emitted fluorescence was collected at λ ≥ 585 nm.
Statistical Analysis
Statistical data are presented as the mean ± SD.
After testing for normality and variance homogeneity, the data were subjected to the unpaired t test. When the variance was heterogeneous, the Mann-Whitney U test was used. The 0.05 level was selected as the point of minimal statistical significance. All the curves shown in figures are representative of at least three measurements performed on four separate cell preparations.
Results
Rhod-2 Predominantly Localizes within the Mitochondria
Adult rat cortical astrocytes were loaded with rhod-2/AM, a Ca2+-sensitive fluorescent indicator (Minta et al., 1989) that accumulates in mitochondria (Hajnoczky et al., 1995; Jou et al., 1996; Babcock et al., 1997) in response to Δψm. Fig. 1 a illustrates a typical image of a rhod-2–loaded adult rat cortical astrocyte showing the localization of rhod-2 within rod-shaped, brightly fluorescent structures of variable organization, reminiscent of mitochondria. However, a diffuse small cytosolic signal and an accumulation of the dye in the nucleus (with rhod-2 also labeling nucleoli) were usually noticed (Trollinger et al., 1997). To confirm that the main rhod-2 fluorescence signal did originate from mitochondria, astrocytes were dual-loaded with rhod-2/AM and MitoFluor Green/AM, an indicator that labels mitochondria independently of mitochondrial function (Poot et al., 1996). The small overlap of the excitation spectra of rhod-2 and MitoFluor Green allows the simultaneous use of both the dyes (Fig. 1, a and b). Colocalization of MitoFluor Green (Fig. 1 b) and rhod-2 within the cell (Fig. 1 a) was confirmed by merging the two images (Fig. 1 c) and by the analysis of colocalization shown in Fig. 1 d. It should be stated that the relative compartmental loading varied substantially between batches of rhod-2 and between preparations, but the difference was quantitative, not qualitative (i.e., some batches of dye gave much clearer localization into mitochondria, others gave a brighter relative cytosolic [and nuclear] signal, but the partitioning was still between cytosol/nucleus and mitochondria).
Figure 1.

Rhod-2 predominantly localizes within the mitochondria. Confocal fluorescence imaging of an adult rat cortical astrocyte coloaded with rhod-2/ AM (a) and MitoFluor Green/ AM (b), a mitochondrion-specific marker. The two images share striking similarities, suggesting a mainly mitochondrial compartmentalization of rhod-2. In the merged image (c) regions containing both rhod-2 and MitoFluor Green fluorescence appear yellow. (d) Scatter diagram representation of the colocalization. Identical images of rhod-2 and MitoFluor Green fluorescence should produce a clear diagonal line at 45°. Slight differences between the images caused irregular spots in the scatter diagram. The X axis represents the rhod-2 fluorescence signal and the Y axis the MitoFluor Green signal.
Mitochondria Take Up Ca2+ in Response to Physiological Stimulation by ATP
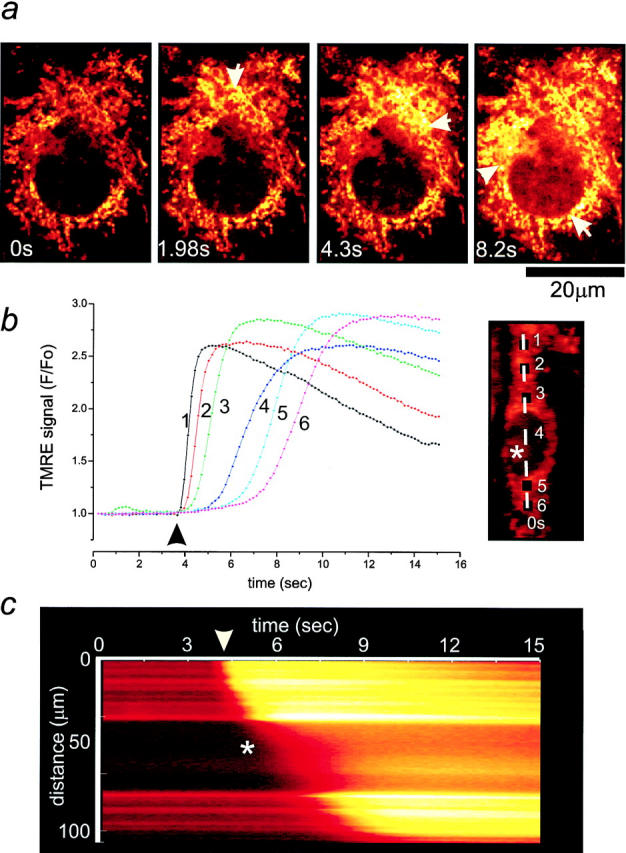
Physiological activation of the P2U purinoceptor by ATP in adult rat cortical astrocytes has been shown previously to raise [Ca2+]cyt via an IP3-mediated pathway (Peuchen et al., 1996a). We took advantage of the concomitant localization of rhod-2 within the nucleus (a mitochondrion-free volume of the cell) to confirm and monitor changes in [Ca2+]cyt in response to ATP challenge, as [Ca2+]n follows the changes in [Ca2+]cyt by diffusion of Ca2+ from one compartment into the other (al Mohanna et al., 1994; Brini et al., 1994). The temporal relationship between [Ca2+]n and [Ca2+]m after a brief pulse of 100 μM ATP is shown in the time sequence of Fig. 2 a. The sequential quantitative changes in [Ca2+]n and [Ca2+]m, measured along the longitudinal axis of the cell as indicated by the line in the first image of Fig. 2 a, are shown in Fig. 2, b and c. Before agonist application, the rhod-2 fluorescence was relatively dim and the mitochondrial signal was not obviously brighter than much of the cytosol (Fig. 2 a). Immediately after the mobilization of intracellular Ca2+ stores by ATP, an overall increase over both the nucleus (Fig. 2, asterisk) and the cytosol was observed, followed by a delayed increase in signal over mitochondria (selected close to nucleus) that remained elevated long after [Ca2+]n recovery. The rise in [Ca2+]m presented a wavelike pattern in that mitochondria at one end of the cell tended to respond before those at the other (Fig. 2 a, indicated by black arrows in a and c).
Figure 2.

Mitochondria take up Ca2+ in response to physiological ATP challenge in astrocytes. (a) Time series of images of a rhod-2–loaded adult rat cortical astrocyte following stimulation with 100 μM ATP. The images have been normalized with respect to the initial control image and the changes in [Ca2+]n (taken as a good index of [Ca2+]cyt, but free of any [Ca2+]m; Al Mohanna et al., 1994) and in [Ca2+]m are seen with time. Note that [Ca2+]n rises immediately after the stimulus and before any change in [Ca2+]m. The asterisk and the ellipse indicate the position of the nucleus. The surface plot shown in b and the corresponding line image shown in c were obtained from the pixel values extracted from the image series along the line selected on the axis of the cell as shown in the first frame of a. b and c illustrate the quantitative evolution of the nuclear and mitochondrial Ca2+ responses to ATP with time. The rapid onset of [Ca2+]n changes was followed by a rise in [Ca2+]m that presented a wavelike pattern (black arrows).
[Ca2+]n rose rapidly (time to reach half the peak amplitude, t 1/2 = 1.95 ± 1.1 s, n = 26), reaching a normalized fluorescence peak of 1.75 ± 0.36 (n = 57), and returned to its resting level within a minute (Fig. 2 a and Fig. 3, a and b, solid circle). A quantitative analysis showed that [Ca2+]n returned to resting values with a decay time constant of 4.84 ± 1.75 s (n = 41). In contrast, [Ca2+]m rose slowly (t 1/2 = 3.17 ± 1.3 s, n = 26) and reached a fluorescence [Ca2+]m peak corresponding to a 2 ± 0.57-fold increase (n = 63). It remained at a high plateau within the experimental time scale (55 s, Fig. 2). Long-term recording of the ATP-induced changes in [Ca2+]m indicated that full recovery to the resting [Ca2+]m took 28.6 ± 10.5 min (n = 24, Fig. 3 b).
Figure 3.

Kinetic characteristics of [Ca2+]n and of [Ca2+]m in response to physiological ATP challenge in astrocytes. Adult rat cortical astrocytes were loaded with the AM ester of rhod-2. (a) High temporal resolution of [Ca2+]n (solid circle) and [Ca2+]m (open circle) transients upon ATP application. Note the slower rise in [Ca2+]m compared with the rapid [Ca2+]n transient. (b) Superimposed time courses of [Ca2+]n (solid circle) and of [Ca2+]m (open circle) after ATP addition. [Ca2+]m slowly decreased back to baseline. (c) Relationship of [Ca2+]m to [Ca2+]n during the response to ATP and subsequent recovery. The nonlinear time course is given for each breakpoint of the curve. When indicated (white bar), the cells were stimulated with a brief puff of 100 μM ATP. The fluorescence intensity before ATP application was normalized to one. Each trace shows the response of a representative cell.
Plotting changes in [Ca2+]m as a function of the changes in [Ca2+]n revealed four phases of intracellular Ca2+ handling triggered by the IP3-induced mobilization of intracellular Ca2+ stores (Fig. 3 c). Immediately after ATP application (phase 1), [Ca2+]n rose very rapidly without any important change in [Ca2+]m. [Ca2+]m started increasing together with [Ca2+]n (phase 2). In the following 70 s (phase 3), [Ca2+]m fell slowly despite the rapid return of [Ca2+]n to its resting value. Finally, [Ca2+]m progressively and slowly decreased (phase 4) to its resting levels.
We cannot exclude that the measured rise in the extranuclear fluorescence probably reflects a combination of cytosolic and mitochondrial Ca2+ signals. However, neither the peak nor the recovery of the [Ca2+]m signal appeared to be contaminated by the [Ca2+]cyt signal that peaked and returned to basal level far more quickly than [Ca2+]m (see below for time courses of [Ca2+]cyt and [Ca2+]n). In addition, the flat morphology of astrocytes in culture (Sheppard et al., 1997; Simpson et al., 1998) allowed the resolution and selection of individual mitochondria for image analysis.
Mitochondrial Depolarization Prevents Mitochondrial Ca2+Uptake and Slows Cytosolic Ca2+Clearance
Mitochondrial calcium uptake depends on Δψm and dissipation of the potential provides the easiest way to examine the consequences of [Ca2+]m accumulation for cell Ca2+ signaling. To this end, we chose to use the mitochondrial protonophore p-trifluoromethoxy-phenylhydrazone (FCCP), a mitochondrial uncoupler that dissipates the proton gradient across the inner mitochondrial membrane, hence abolishing the Δψm. Under such conditions, activation of the mitochondrial ATPase in reverse mode may lead to the rapid consumption of ATP (Leyssens et al., 1996). Therefore, FCCP (1 μM) was always applied in combination with 2.5 μg/ml oligomycin, to inhibit mitochondrial consumption of cellular ATP.
The time series shown in Fig. 4 a, and more particularly the corresponding surface plot (Fig. 4 c) and line image (Fig. 4 d), illustrate the changes in [Ca2+]cyt and [Ca2+]n upon FCCP application, followed by 100 μM ATP. FCCP initially induced a transient rise in [Ca2+]cyt localized to the perinuclear (Fig. 4, a and b, p; Fig. 4 c and d, arrows) and the cytosolic (Fig. 4, a and b, c; Fig. 4 c and d, arrows) regions, most likely reflecting Ca2+ release from mitochondria that was only followed later by a rise in [Ca2+]n (Fig. 4, a and b, n; Fig. 4, c and d, asterisk). In the experiment illustrated in Fig. 4 b, the FCCP-induced change in rhod-2 fluorescence was ∼1.2-fold. The mean increase in rhod-2 signal in response to FCCP application was 1.76 ± 0.43 (n = 29) fold (see also below).
Figure 4.

Mitochondrial depolarization prevents mitochondrial Ca2+ uptake. (a) Time series of ratioed images showing the changes in [Ca2+]n and in [Ca2+]cyt occurring in a rhod-2–loaded cortical astrocyte after application of 1 μM FCCP (with 2.5 μg/ml oligomycin) followed by ATP challenge (100 μM). p, c, and n signal a perinuclear, a cytosolic, and the nuclear regions, respectively. Note the absence of any mitochondrial, particulate rhod-2 signal during ATP application. (b) Corresponding time courses of [Ca2+]n (n, closed circle) and [Ca2+]cyt (c and p, open circle) upon application of FCCP/oligomycin and ATP. The rhod-2 fluorescence intensity before addition of ATP was normalized to one against the first image. The surface plot shown in c and the equivalent line image shown in d illustrate the evolution of the nuclear and cytosolic Ca2+responses to FCCP/oligomycin and to ATP with time. The asterisk and the ellipse indicate the position of the nucleus. Note the initial increase in the perinuclear and the cytosolic regions (arrows) upon FCCP application, followed later by a rise in [Ca2+]n. However, ATP elicited a global rise in [Ca2+]cyt and [Ca2+]n. The traces shown in b illustrate the response of a representative cell.
Subsequent application of ATP elicited a diffuse, transient rise in nuclear and cytosolic rhod-2 fluorescence (Fig. 4 a), without any apparent mitochondrial rhod-2 signal, demonstrating the effective inhibition of Ca2+ uptake in deenergized mitochondria. The relative change in the nuclear Ca2+ signal appeared far bigger than that in the cytosol (Fig. 4). This apparent nuclear amplification is likely to occur because of an underestimation of [Ca2+]cyt changes resulting from the creation of a pool of indicator sequestered in mitochondria that was insensitive to changes in [Ca2+]cyt after the dissipation of Δψm by FCCP (al Mohanna et al., 1994).
Collapse of Δψm by FCCP did not significantly alter the peak amplitude of the ATP-induced [Ca2+]n transient (Fig. 4 b, control cells, peak = 1.75 ± 0.36, n = 57; FCCP-treated cells, peak = 1.63 ± 0.33, n = 38; P = 0.11, t test) or the time required to reach half the peak amplitude of [Ca2+]n (control cells, t 1/2 = 1.95 ± 1.1 s, n = 26; FCCP-treated cells, t 1/2 = 1.93 ± 0.95 s, n = 38; P = 0.93, t test). However, the decay phase of the [Ca2+]n was significantly longer in the presence of FCCP (control cells, t = 4.84 ± 1.75 s, n = 41; FCCP-treated cells, t = 8.92 ± 2.89 s, n = 44; P < 0.0001, Mann-Whitney U test). This result strongly suggests that mitochondrial Ca2+ buffering plays a substantial role in hastening the restoration of [Ca2+]n and, hence, [Ca2+]cyt to basal levels. The [Ca2+]cyt transient had a very similar time course to that of the [Ca2+]n (Fig. 4 b), strengthening the assumption that changes in [Ca2+]n are a true index of changes in [Ca2+]cyt.
In Resting Conditions, Mitochondria may Contain Substantial Ca2+ Loads
Dissipation of Δψm by FCCP reverses the activity of the Ca2+ uniporter, which becomes a Ca2+ efflux pathway (Kröner, 1992). We applied 1 μM FCCP to resting astrocytes dual-loaded with rhod-2 and fura-2, in the presence of 2.5 μg/ml oligomycin. Data are illustrated in Fig. 5. Short application of FCCP induced a steep rise in [Ca2+]n monitored by rhod-2 (solid circle) that returned to basal level within a minute (mean peak amplitude = 1.76 ± 0.43, n = 29).
Figure 5.

In resting conditions, mitochondria in astrocytes contain substantial releasable Ca2+. Typical time course of Ca2+ release from mitochondria upon application of 1 μM FCCP (in the presence of 2.5 μg/ml oligomycin) in astrocytes dual-loaded with rhod-2/AM and fura-2/AM. The Ca2+ transient monitored using rhod-2 (solid circle) can be superimposed upon that measured using fura-2 (open circle). The rhod-2 fluorescence intensity before addition of FCCP/oligomycin was normalized to one. The nuclear Ca2+ signal monitored by fura-2 was expressed as a ratio of fura-2 fluorescence after excitation at 340 and 380 nm.
We were concerned that the change in the rhod-2 signal might reflect some form of redistribution of dye and dequench (i.e., as seen with TMRE, although this is not expected on theoretical grounds; see below) rather than a true reflection of changing [Ca2+]n. We have recorded rhod-2 fluorescence simultaneously with a second widely used Ca2+-sensitive fluorescent indicator, fura-2. FCCP caused a rise in fura-2 ratio (open circle, mean peak amplitude = 2 ± 0.6, n = 21) sharing kinetic characteristics that could be superimposed on rhod-2. In principle, only the nonfluorescent AM ester form of rhod-2 exhibits a net positive charge, enabling its sequestration into mitochondria in response to Δψm. Once the AM ester is cleaved within mitochondria, the resulting rhod-2 is hydrophilic and negatively charged and is unlikely to cross (mitochondrial) membranes or redistribute upon mitochondrial depolarization. As FCCP interferes with nonmitochondrial stores (Jensen and Rehder, 1991) in some preparations, we repeated these experiments using antimycin A1 (an inhibitor of mitochondrial respiratory complex III) in the presence of oligomycin. Qualitatively, similar results were observed under these conditions (data not shown). Therefore, these data suggest that the rise in rhod-2 signal upon mitochondrial depolarization is an accurate reflection of changes in [Ca2+]cyt and that Ca2+ is released from mitochondria in these resting astrocytes.
Characteristics of [Ca2+]cyt Waves Induced by Chemical or Mechanical Stimulation in Rat Cortical Astrocytes
To investigate the spatio-temporal organization of the [Ca2+]cyt changes in astrocytes, we examined Ca2+ waves in fluo-3–loaded astrocytes at higher time resolution (∼7–14 Hz). Single-cell stimulation was performed either chemically by pressure application from a micropipette filled with ATP (20 μM) or mechanically with a micromanipulator-driven glass micropipette filled with the recording saline. We chose an ATP concentration of 20 μM to temporally resolve the Ca2+ wave as stimulation with 100 μM induced a rapid wave that could not be resolved (data not shown).
After either chemical or mechanical stimulation, a wave of [Ca2+]cyt was routinely observed throughout the stimulated cell, usually spreading in directions away from the point of stimulation. Fig. 6 a shows some sample images from a sequence to illustrate the propagation of an intracellular [Ca2+]cyt wave after ATP application. The time course of propagation was defined by selecting a line along the wave path on the image series. The intensity profile for the line for each frame was plotted as a two-dimensional line image (the post hoc equivalent of a line scan on a confocal system) as shown in Fig. 6 c. The wave propagation is seen as a gradual increase of the fluorescent signal across the cell from one side to the opposite side as a function of time. The wave velocity was readily measured simply as the slope of distance with time across the cytosol (Fig. 6 c). The mean value for the velocity of the [Ca2+]cyt wave was 21.6 ± 11.5 μm/s (Table I, n = 133) and 24.4 ± 10.7 μm/s (Table I, n = 129) under chemical and mechanical stimulation, respectively. These velocities were not significantly different, suggesting that once initiated, the waves were propagated by the same mechanism. The mean rate given by all these data was 22.9 ± 11.2 μm/s (Table I, n = 262). The time course of the amplitude changes in [Ca2+]cyt signal for six regions of the cell during the propagation of the wave as a function of time is shown in Fig. 6 b. The peak amplitude of the wave was sustained throughout the regions of propagation although the rate of rise tended to decrease with propagation of the wave. Similar results were found for mechanically induced Ca2+ waves (data not shown). The [Ca2+]cyt at this sustained level (∼1.8-fold increase from resting values) remained within the measurable range. Indeed, saturation of the fluo-3 signal by application of 20 μM ionomycin showed a fluorescence enhancement of 5.7 ± 3.3-fold (n = 77) in comparison to resting [Ca2+]cyt. Determination of the diffusion rate of Ca2+ across the nucleus of ATP-stimulated cells showed a significantly higher rate than the Ca2+ wave velocity calculated over the cytosol (Table I, 34.6 ± 26.7 μm/s, n = 27, Mann-Whitney U test, P < 0.05) corresponding to a 60% increase.
Figure 6.
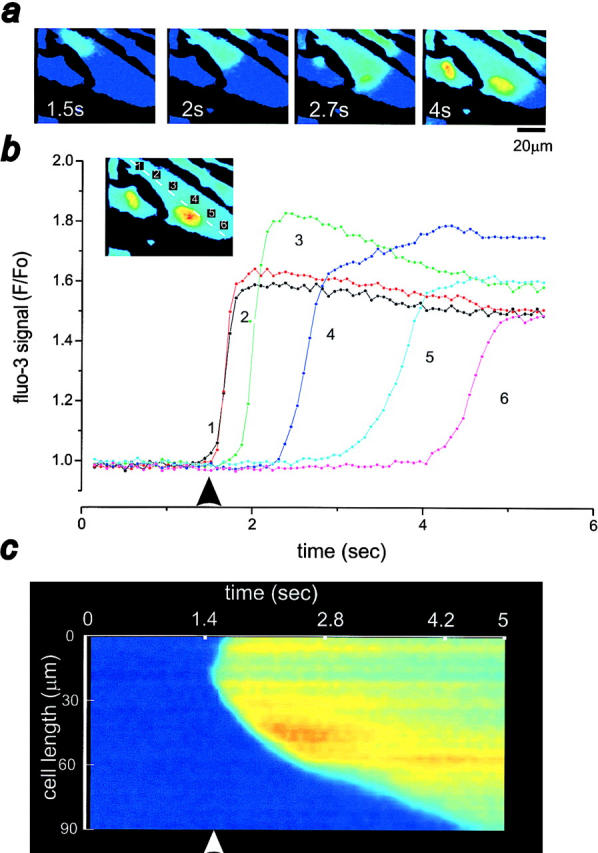
Characteristics of the propagating [Ca2+]cyt wave in ATP-stimulated astrocytes. (a) Time series of images showing the propagation of an intracellular Ca2+ wave across a fluo- 3–loaded cortical astrocyte upon ATP challenge (20 μM). (b) Plots of six consecutive areas across the cytoplasm of an astrocyte (at positions 1–6 shown in image inset) following the wave path. Note the sequential and sustained increase in fluorescence in the different regions. (c) Line image to illustrate the propagating wave using data obtained by selecting a line along the axis of the cell (see image inset in b). The asterisk indicates the position of the nucleus. The arrow in b and c signals ATP application.
Table I.
Inhibition of Mitochondrial Function Increases the Mean Ca2+ Wave Velocities in Chemically and Mechanically Stimulated Astrocytes
| Ca2+ wave velocity | ||||||||
|---|---|---|---|---|---|---|---|---|
| Cytosol | Nucleus | |||||||
| Mean ± SD | n | Mean ± SD | n | |||||
| μm/sec | μm/sec | |||||||
| Controls | ||||||||
| ATP | 21.6 ± 11.5 | 133 | 34.6 ± 26.7* | 27 | ||||
| Touch | 24.4 ± 10.7‡ | 129 | ||||||
| Pooled data | 22.9 ± 11.2 | 262 | ||||||
| Antimycin A1 | ||||||||
| ATP | 35.6 ± 23§, ∥ | 121 | ||||||
| Touch | 31.1 ± 10.5 ¶ , † | 66 | ||||||
| Pooled data | 34 ± 19.6 | 187 | ||||||
| Rotenone | ||||||||
| ATP | 40.4 ± 28.6§, ** , ‖ | 50 | ||||||
| Touch | 30.6 ± 12.4 ¶ , ‡‡, §§ | 35 | ||||||
| Pooled data | 36.4 ± 23.7 | 85 | ||||||
Significantly different from control cytosol, ATP stimulation (Mann-Whitney U test, P < 0.05).
Not significantly different from ATP stimulation (t test).
Significantly different from control cells, ATP stimulation (Mann-Whitney U test, P < 0.0001).
Not significantly different from control nucleus, ATP stimulation (Mann-Whitney U test).
Not significantly different from ATP stimulation (Mann-Whitney U test).
Significantly different from control cells, touch stimulation (Mann-Whitney U test, P < 0.0001).
Not significantly different from antimycin-treated cells, ATP stimulation (Mann-Whitney U test).
Significantly different from control cells, touch stimulation (Mann-Whitney U test, P < 0.01).
Not significantly different from antimycin-treated cells, touch stimulation (Mann-Whitney U test). Mitochondria were depolarized either by bath application of 2.5 μg/ml antimycin A1 and 2.5 mg/ml oligomycin, or 10 μM rotenone and 2.5 μg/ml oligomycin, before the induction of a Ca2+ wave either by 20 μM ATP or gentle touch to plasma membrane. The mean [Ca2+]cyt wave velocity in both antimycin- and rotenone-treated astrocytes was significantly higher compared to control cells (respectively; Mann-Whitney U test). The velocities are expressed in μm/s.
Cytosolic Calcium Waves Are Followed by Waves of Mitochondrial Depolarization
We asked about the consequences of mitochondrial calcium uptake, for mitochondrial function and, as described below, for calcium signaling. Upon chemical and mechanical stimulation, waves of [Ca2+]m propagating across single astrocytes could be observed (Fig. 2, ATP challenge). However, the features of a [Ca2+]m wave front were hard to characterize given the spatially irregular punctate rhod-2 signal. In addition, the rhod-2 signal arising from the cytosol obscured the initial rising phase of the [Ca2+]m wave characteristics. To overcome this problem, we followed changes in Δψm, as influx of Ca2+ into mitochondria induces a small transient mitochondrial depolarization (Duchen, 1992; Loew et al., 1994; Duchen et al., 1998; Peuchen et al., 1996b). Indeed, monitoring changes in Δψm tends to amplify the response to mitochondrial calcium uptake and provides a sensitive index of a small calcium flux during mitochondrial Ca2+ uptake (Duchen et al., 1998).
To follow changes in Δψm, astrocytes were loaded with the potentiometric dye TMRE that selectively accumulates in mitochondria. The concentration of TMRE into polarized mitochondria causes autoquenching of TMRE fluorescence that is relieved by mitochondrial depolarization. Therefore, TMRE dequench is associated with a rise in fluorescence. Induction of a Ca2+ wave with a brief deformation of the plasma membrane initiated a wave of mitochondrial depolarization spreading from the stimulation point across the cell seen clearly in the confocal image series shown in Fig. 7 a. A line image (Fig. 7 c) constructed from a similar image series but obtained using the fast readout CCD camera (Fig. 7 b) clearly showed the initiation sites of the propagating wave as mitochondria (the bright lines on the line image), whereas TMRE diffused slowly into the nucleus (asterisk). Determination of the wave velocity gave a mean value of 9.7 ± 4.2 μm/s (n = 89). Fig. 7 b illustrates the changes in Δψm recorded in six regions of the cell as a function of time. The peak amplitude of the transient mitochondrial depolarization was sustained over long distances throughout the regions of wave propagation (Fig. 7 b). Indeed, roughly the same peak amplitude of Δψm signals was seen at the cytosolic stimulation point 1 and the more distal point 6, suggesting again the regenerative nature of the propagating wave. In addition, the rate of rise tended to decrease with propagation of the wave, strikingly mirroring the gradual decrease of the rate of rise of the [Ca2+]cyt wavefont. Thus, the propagation of the Ca2+ wave causes a wave of mitochondrial depolarization in its wake.
Figure 7.
Propagation of a wave of mitochondrial depolarization induced by mechanical stimulation in astrocytes. (a) Images selected from a time series of confocal images showing the propagation of a wave of mitochondrial depolarization across a TMRE-loaded cortical astrocyte elicited by mechanical stimulation. (b) Plot of six consecutive box areas across another cell (see image inset), following the wave path. Note the sequential and sustained increase in fluorescence in the different regions. (c) Line image of a line trace obtained by drawing a line across the length of the cell (b, image inset). The asterisk marks the position of the nucleus. The arrows in a indicate the progression of the wave. In b and c, the arrow signals mechanical stimulation of the cell.
Mitochondria Modulate the Kinetics of Cytosolic Ca2+ Wave Propagation
To determine the impact of mitochondrial Ca2+ uptake on the spatio-temporal characteristics of calcium signaling, fluo-3–loaded astrocytes were treated either with 2.5 μg/ml antimycin A1 or with 10 μM rotenone (an inhibitor of mitochondrial respiratory complex I), both in association with 2.5 μg/ml oligomycin. This protocol induced a complete collapse of Δψm (assessed with TMRE, data not shown), preventing any subsequent Ca2+ uptake into mitochondria. Whatever the mitochondrial inhibitor used, mechanical or chemical stimulation elicited a typical [Ca2+]cyt wave spreading away from the stimulation point, very similar to control cells in terms of pattern and regenerative nature of the propagation. Fig. 8 shows a typical example of Ca2+ waves spreading across an astrocyte upon ATP challenge either in control conditions (a) or after treatment with antimycin A1/oligomycin (b). The differentiated line image (corresponding to a time series of iteratively subtracted images, only showing changes occurring between consecutive frames) given in the lower part of each frame showed the wavefront propagating through the cell. It is clear that the Ca2+ wave traveled faster in the antimycin-treated cells (Fig. 8 b).
Figure 8.
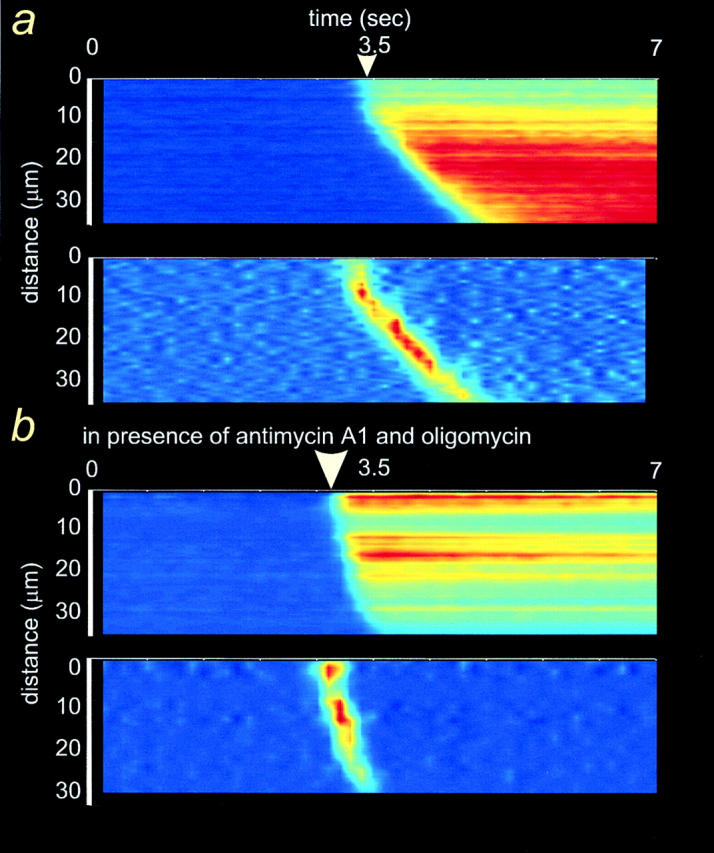
Inhibition of [Ca2+]m uptake increases the velocity of [Ca2+]cyt waves in astrocytes. Line images of a [Ca2+]cyt wave in ATP-stimulated, fluo-3–loaded astrocytes, in control conditions (a) or after treatment with 2.5 μg/ml antimycin A1 and 2.5 μg/ml oligomycin (b). The differentiated line image given in the lower part of each frame shows the wavefront propagating through the cell. The [Ca2+]cyt wave traveled faster across the antimycin-treated cells. The horizontal axis shows time and the vertical axis represents the distance across the cell. The arrow marks chemical stimulation.
Determination of the wave velocity in antimycin-treated cells showed a mean value of 35.6 ± 23 μm/s (n = 121) in response to ATP application and 31.1 ± 10.5 μm/s (n = 66) to mechanical stimulation (Table I). These values were not significantly different and the pooled data gave an average Ca2+ wave rate in antimycin-treated cells of 34 ± 19.6 μm/s (n = 187). Rotenone-treated cells exhibited a Ca2+ wave rate of 40.4 ± 28.6 μm/s (n = 50) to ATP challenge and of 30.6 ± 12.4 μm/s (n = 35) to mechanical stimulation (Table I). The averaged Ca2+ wave rate was 36.4 ± 23.7 μm/s (n = 85), remarkably similar to the diffusion rate of Ca2+ through the mitochondrion-free nucleus (see above). This corresponds to a significant 48% and 58% increase (P < 0.0001, Mann-Whitney U test) of the [Ca2+]cyt wave velocity in antimycin- and rotenone-treated astrocytes, respectively. Statistical analysis of the Ca2+ wave velocities from antimycin- and rotenone-treated cells revealed no significant difference. These results clearly demonstrate that mitochondrial calcium uptake exerts a negative feedback action upon the kinetics of Ca2+ wave propagation in astrocytes.
Discussion
In the present study, we have addressed several related questions: (a) Do mitochondria take up Ca2+ during physiological Ca2+ signaling in adult rat cortical astrocytes? (b) If so, what are the temporal characteristics of the mitochondrial response? (c) What are the consequences for mitochondrial potential and (d) what are the consequences for the spatio-temporal characteristics of the Ca2+ signal? Our data show that mitochondria in these cells take up Ca2+ during physiological Ca2+ signaling, that they tend to retain that Ca2+ for prolonged periods of time, and that the uptake not only shapes [Ca2+]cyt signals but also exerts a negative feedback on the rate of propagation of Ca2+ waves, by acting as high capacity fixed Ca2+ buffers.
Evidence for [Ca2+]m Uptake in Adult Rat Cortical Astrocytes
Little information is available about the functional consequences of [Ca2+]m accumulation with respect to [Ca2+]cyt handling in glial cells. Stimulation of IP3-mediated ER Ca2+ release by ATP in astrocytes routinely induced a simultaneous rise in [Ca2+]n and in [Ca2+]m. However, these signals exhibited quite distinct temporal features: the [Ca2+]n transient recovered within 1 min. In contrast, the mitochondrial response rose 1.6-fold more slowly than the nuclear signal, and full recovery took several minutes. A longer time of recovery to basal level for [Ca2+]m than for [Ca2+]cyt also has been described in the glial cell line RBA-1 (Jou et al., 1996), in oligodendrocytes (Simpson and Russell, 1998), in hepatocytes (Hajnoczky et al., 1995), in myocytes (Trollinger et al., 1997; Zhou et al., 1998), and in adrenal chromaffin cells (Herrington et al., 1996), although the specific rates varied widely between these different cell types.
These observations differ strikingly from results obtained with aequorin targeted to mitochondria in HeLa cells (Rizzuto et al., 1992). This discrepancy could result from the use of different cell types, different methodologies, different temperatures, the relative inaccuracy of aequorin at [Ca2+] values below 300–400 nM (K d for Ca2+ = 1 μM), or alteration of the apparent kinetics of the [Ca2+]m signal by rhod-2 given its relatively high affinity to Ca2+ compared with the low affinity aequorin. The mitochondrial model elaborated by Magnus and Keizer (1998) also predicts a delay between increases in [Ca2+]cyt and [Ca2+]m. This delay may result from the positive cooperativity of uniporter activation by extramitochondrial Ca2+ (Hill coefficient ∼2) (Gunter and Pfeiffer, 1990). Mitochondria start accumulating cytosolic Ca2+ from [Ca2+]cyt ∼500 nM but do not saturate readily (Gunter, 1994). Rates of [Ca2+]m increase after intracellular Ca2+ mobilization have been demonstrated to be more than one order of magnitude faster than that predicted on the basis of the amplitude of the mean rise in [Ca2+]cyt (Rizzuto et al., 1993). This has been explained by proposing that mitochondria closely apposed to Ca2+ release sites would be exposed to local concentrations of Ca2+ much higher than those measured in the bulk of the cytoplasm (Rizzuto et al., 1993, 1998). Such a close localization of mitochondria to IP3 receptors recently has been observed in rat astrocytes in culture (Simpson et al., 1998), and is also suggested by the appearance of transient mitochondrial depolarizations due to focal calcium release from the sarcoplasmic reticulum in cardiac myocytes (Duchen et al., 1998).
Depolarization of the mitochondrial potential with FCCP completely prevented [Ca2+]m loading after a challenge with ATP. In addition, the rate of decay of the [Ca2+]n signal was significantly slowed, suggesting that mitochondrial Ca2+ uptake plays a significant role in the clearance of [Ca2+]cyt loads in these cells. The effects of the mitochondrial uncoupler on Ca2+ clearance were almost certainly not attributable to ATP depletion, as the mitochondrial ATPase was inhibited throughout by oligomycin to minimize mitochondrial consumption of cellular ATP. In contrast to our results, FCCP exposure did not influence the kinetic parameters of the depolarization-triggered [Ca2+]cyt transient in oligodendrocytes (Kirischuk et al., 1995b), suggesting that [Ca2+]m accumulation does not play an important role in shaping Ca2+ signals in oligodendroglia. It seems likely that differences in such contributions of mitochondria to calcium signaling may vary simply as a function of the relative mitochondrial density or intracellular location in different cell types.
The [Ca2+]n signal in the astrocytes after ATP stimulation recovered with a monoexponential time course. In a number of cell types, [Ca2+]cyt decay characteristically follows a biphasic sequence in which a fast initial decay is followed by a much slower secondary decay that appears to be maintained by the reequilibration of [Ca2+]m by the mitochondrial Na+/Ca2+ exchange (rat gonadotropes, Hehl et al., 1996; sensory neurons, Thayer and Miller, 1990). The absence of such a plateau phase in the astrocyte model seems consistent with the very prolonged retention of Ca2+ in the mitochondria of these cells. This may reflect a low [Na+] content of astrocytes and the absence of Na+ influx during this form of stimulation (in contrast to depolarization-induced transients in the excitable sensory neurons, gonadotropes, and chromaffin cells). Indeed, while the accumulated [Ca2+]m is clearly released back into the cytosol, this occurs at such a low rate that it does not cause a significant change in [Ca2+]cyt. Therefore, the [Ca2+]m efflux pathway does not significantly shape the [Ca2+]cyt signal in these cells.
We noted that depolarization of the mitochondrial potential routinely released Ca2+ into the cytosol within quiescent cells, suggesting that mitochondria in this preparation were often Ca2+-loaded at rest. Given the very prolonged time course of [Ca2+]m reequilibration, perhaps this is not very surprising as only occasional spontaneous activity would keep the mitochondria primed with a significant Ca2+ content. A substantial Ca2+ pool has been found in mitochondria of oligodendrocytes under resting conditions (Kirischuk et al., 1995a,b), in contrast to the very modest [Ca2+]m content in neurons (Werth and Thayer, 1994), T lymphocytes (Hoth et al., 1997), rat gonadotropes (Hehl et al., 1996), and rat chromaffin cells (Herrington et al., 1996).
In astrocytes, mitochondria seem to contribute to cytosolic Ca2+ clearance during the [Ca2+]n decay only but not in the fast rising phase of the [Ca2+]n transient. In addition, dissipation of Δψm by FCCP did not appreciably affect the peak amplitude of the ATP-induced [Ca2+]n response. These results are similar to those described in adrenal chromaffin cells (Babcock et al., 1997), T lymphocytes (Hoth et al., 1997), rat gonadotropes (Hehl et al., 1996), and HeLa cells (Rizzuto et al., 1992). Simpson et al. (1998) found that FCCP pretreatment caused variable effects on the norepinephrine-evoked [Ca2+]cyt responses in astrocytes, ranging from complete block of the response to minor effects. In contrast, we consistently found no significant alteration in the amplitude of the Ca2+ peak induced by ATP in FCCP (+ oligomycin)-treated astrocytes. This disparity could be partly explained by the absence of oligomycin in most of their experiments, leading to ATP run-down in the course of the norepinephrine stimulation.
Mitochondria Exert a Negative Feedback on the Propagation of Intracellular Ca2+ Waves in Astrocytes
Stimulation of astrocytes triggers an increase in [Ca2+]cyt that can propagate as a wave through the cytoplasm of individual cells and through astrocytic networks (Cornell-Bell et al., 1990; Verkhratsky et al., 1998). Thus, we were interested in determining the role of mitochondria upon the spatio-temporal characteristics of these Ca2+ waves. Both mechanical and chemical stimuli were used to trigger Ca2+ waves. In addition to triggering Ca2+ influx, mechanical stimulation recently has been shown to activate phospholipase C in astrocytes (Venance et al., 1997). The propagation velocities of these Ca2+ waves were nearly identical regardless of the initiating stimulus (pooled control rate = 22.9 ± 11.2 μm/s, n = 262), suggesting that once initiated, the waves were propagated by the same mechanism. This range of Ca2+ wave velocities correlates well with those found in hippocampal astrocytes (Cornell-Bell et al., 1990) and retinal astrocytes (Newman and Zahs, 1997).
The amplitude of the Ca2+ signal from the wave initiation site could be maintained or could even increase during spread across the cell, strongly suggesting that the wave propagates as an actively regenerative process and not simple long-range passive diffusion following release from a point source. The propagating [Ca2+]cyt wave was associated with a propagating wave of mitochondrial depolarization that traveled at around 10 μm/s following mechanical stimulation. Thus, during the propagation of an intracellular [Ca2+]cyt wave, mitochondria take up Ca2+ as the wave travels across the cell. The discrepancy between the velocity of the [Ca2+]cyt wave and of the wave of mitochondrial depolarization probably reflects fundamental differences in the behavior of the fluorescent dyes fluo-3 and TMRE. Whereas fluo-3 fluorescence rises immediately upon Ca2+ binding, the increase in TMRE fluorescence after mitochondrial depolarization results from dye egress from mitochondria, dequench of fluorescence and then diffusion of dye through the cytosol, inevitably underestimating the rate of progression of the wave of mitochondrial depolarization. Furthermore, the change in Δψm reflects the rate of Ca2+ flux, which tends to be slower at the distal end of the cell (Fig. 8) compared with the origin of the wave front. Nevertheless, the appearance of a wave of mitochondrial depolarization clearly demonstrates that mitochondria take up Ca2+ as a [Ca2+]cyt wave travels across the cell.
To determine whether mitochondria play a functional role in the propagation of the Ca2+ wave in astrocytes, mitochondrial Ca2+ uptake was prevented by dissipation of the mitochondrial potential using antimycin A1 or rotenone (each in association with oligomycin). The Ca2+ waves presented the same regenerative pattern of propagation as in the control cells, but the wave velocity increased substantially. Thus, mitochondrial Ca2+ uptake appears to slow the rate of propagation of the cytosolic signal. Taken together, these results suggest that functional mitochondria exert a negative feedback on the propagation of intracellular Ca2+ waves in adult rat cortical astrocytes.
What could be the underlying mechanism of the negative feedback control exerted by mitochondria upon the propagating Ca2+ wave? Current models to account for the propagation of Ca2+ signals suggest that IP3 induces a wave by diffusing through the cell, priming IP3 receptors, and releasing Ca2+ as puffs from ER release sites (Finkbeiner, 1993; Venance et al., 1997; Wang et al., 1997). The rise in [Ca2+]cyt generates additional IP3 through the Ca2+-dependent activation of phospholipase C (Berridge, 1993) providing a positive feedback step, whereas the diffusion of Ca2+ to neighboring IP3 receptors activates increasing numbers of IP3-primed IP3 receptors (Yao et al., 1995), as type 1 IP3 receptors display a bell-shaped sensitivity to Ca2+ that functions as a coagonist with IP3 to release stored Ca2+ (Bezprozvanny et al., 1991; Finch et al., 1991). The peak sensitivity to Ca2+ lies at ∼300 nM, whereas at higher concentrations Ca2+ becomes inhibitory. However, type 2 IP3 receptors, lack the Ca2+-dependent inactivation at high [Ca2+]cyt (Ramos-Franco et al., 1998). Thus, depending on the type of receptors expressed by a cell, mitochondrial control of local [Ca2+]cyt through Ca2+ uptake could result in either a positive or a negative control on the Ca2+ wave propagation. The importance of mitochondria in the regulation of propagating [Ca2+]cyt waves was first demonstrated in oocytes of the amphibian Xenopus laevis (Jouaville et al., 1995) that express type 1 IP3 receptors (Kume et al., 1993). These authors found that IP3-mediated Ca2+ waves were synchronized and increased in both amplitude and velocity by addition of substrates for mitochondrial respiration. The additional substrate hyperpolarizes the Δψm, promoting [Ca2+]m uptake and slowing IP3 receptor inactivation by reducing the Ca2+ concentration in the immediate vicinity of active IP3 receptors (Jouaville et al., 1995).
In the present study, we found that mitochondria exert a negative control on Ca2+ wave propagation. Rat astrocytes in culture express predominantly type 2 IP3 receptors (Sheppard et al., 1997; Boitier, E., S. Brind, and M.R. Duchen, unpublished observations). In addition, mitochondria in astrocytes are located near IP3 receptors, which correspond to the amplification sites for Ca2+ waves (Sheppard et al., 1997). One possible explanation would be that mitochondria in close proximity to IP3 receptors participate in a local Ca2+ buffering that alters gating kinetics of type 2 IP3 receptor channels. The fall in local [Ca2+]cyt would decrease the affinity of the IP3 receptors to IP3, decreasing further IP3-mediated Ca2+ release. Less Ca2+ will be available to feedback onto the Ca2+ releasing IP3 receptors and to diffuse away to stimulate nearby IP3 receptors. This mechanism would completely account for the slowing of the intracellular Ca2+ wave (Wang et al., 1997). In this model, type 2 IP3 receptors will not be inherently self-limiting, because Ca2+ passing through an active type 2 channel cannot negatively feedback and turn the channel off (Ramos-Franco et al., 1998). This hypothesis is further supported by the observation that the diffusion rate of Ca2+ across the (mitochondrion-free) nucleus was of the same order of magnitude as the Ca2+ wave velocities in cells in which mitochondrial uptake had been abolished (∼34 μm/s). Such differences in the wave rates between nucleus and cytosol have been observed in other cell types (Donnadieu and Bourguignon, 1996; Koopman et al., 1997). This probably reflects the paucity of Ca2+ buffers in the nucleus, and strengthens the concept that mitochondria are predominant cytosolic Ca2+ buffers in astrocytes.
Studying the impact of cytoplasmic Ca2+ buffering on the spatial and temporal characteristics of intercellular Ca2+ signals in astrocytes, Wang et al. (1997) found that pretreatment with an exogenous Ca2+ chelator such as BAPTA dramatically decreased the Ca2+ wave velocity within individual astrocytes. According to these authors, the positive feedback role of Ca2+ in wave propagation is primarily local, acting at the Ca2+ release sites, while Ca2+ diffusion constitutes an important factor as a rate-limiting step during the initiation and propagation of Ca2+ waves (Lechleiter et al., 1991; Wang and Thompson, 1995; Wang et al., 1997). One major consequence of the presence of an exogenous Ca2+ buffer might be to reduce the peak-free Ca2+ concentration at a puff site, thereby attenuating the regenerative potential of the wave. These authors suggested that the presence of endogenous cytosolic Ca2+ buffers with a relatively low affinity for Ca2+ would permit wave propagation but still restrict this mode of intracellular Ca2+ signaling to a very localized range (Wang et al., 1997). Ca2+ uptake into mitochondria is a low affinity, high capacity process (Gunter, 1994). In addition, a rapid mode of Ca2+ uptake recently has been discovered in liver mitochondria allowing [Ca2+]m accumulation for low [Ca2+]cyt (Sparagna et al., 1995). Taken together, the data indicate that Ca2+ wave kinetic parameters are controlled tightly by active Ca2+ buffering by mitochondria.
Working on the same cell model, Simpson et al. drew completely opposite conclusions (Simpson and Russell, 1996; Simpson et al, 1998), suggesting that mitochondria located close to IP3 receptors promote Ca2+ wave progression by preventing Ca2+-dependent inactivation of the IP3 receptor at high [Ca2+]cyt. This hypothesis relies on the bell-shaped response of the IP3 receptor to Ca2+, characteristic of type 1 IP3 receptor (Bezprozvanny et al., 1991; Finch et al., 1991). However, they showed that astrocytes essentially possess type 2 IP3 receptors (Sheppard et al., 1997). The fact that mitochondria are located near IP3 receptors does not necessarily mean that they play a positive role in Ca2+ wave propagation. On the contrary, such a close location could represent a highly plastic mechanism whereby the cell could finely tune intracellular Ca2+ wave characteristics, thus modulating this newly discovered form of nonsynaptic long-range signaling in the brain (Cornell-Bell et al., 1990).
Physiological and Pathological Relevance of Mitochondrial Modulation of Ca2+ Wave Kinetics
Under physiological conditions, mitochondrial status could contribute to the modulation of the intercellular propagation of Ca2+ waves within the astrocyte network. Indeed, modulation could simply rely upon supply of mitochondrial respiratory substrates to mitochondria or transient inhibition of mitochondrial respiration, regulating Δψm, and modulating mitochondrial Ca2+ uptake. In the astrocyte, functional active mitochondria would permit wave propagation but could restrict the extent of spread of this mode of intercellular Ca2+ signaling. Modulation of such a mitochondrial contribution would allow a differential activation of specific neurons in the brain and may directly participate in information processing in the CNS.
Brain mitochondria have been found to be impaired in some pathologies such as ischemia/reperfusion injury (Sims, 1995) and Parkinson's disease (Bowling and Beal, 1995). In such conditions, [Ca2+]m uptake is impaired and mitochondria will no longer be able to regulate Ca2+ wave spread. One possible consequence might be an increased spread of intercellular Ca2+ waves in the astrocytic networks that might eventually lead to Ca2+ deregulation in the surrounding nervous system. The astrocytic Ca2+ wave may be important for the phenomenon known as Leao's spreading depression (SD) (Do Carmo and Somjen, 1994): a slow wave of depression of neuronal activity (Leao, 1944). It is accompanied generally by an increase in intracellular Ca2+ concentration (Martins-Ferreira and Ribeiro, 1995). More recently, a similar, if not identical, phenomenon has been shown to be induced by hypoxia (Somjen et al., 1993). A glial role was suggested in SD since this depression propagates through diverse heterogeneous brain regions with similar velocity (33–100 μm/s). The Ca2+ waves in the astrocytes studied therein, more particularly in those where mitochondrial Ca2+ uptake was prevented, bear similarities to SD such as their high rates of propagation. The fact that hypoxia seems to mimic such a depression may support our hypothesis of negative mitochondrial feedback on Ca2+ wave propagation. In such a condition, mitochondrial function would be disrupted, Δψm dissipated and finally mitochondrial Ca2+ uptake prevented. This would inexorably lead to further spreading of the glial Ca2+ wave, stimulating in passing neuronal networks that normally are not activated by these astrocytes, and may contribute to brain activity disorganization.
In conclusion, we have characterized an important role of mitochondria in glial Ca2+ signaling, i.e., a strong negative feedback control on intracellular Ca2+ wave propagation via their high Ca2+ buffering capacities. Physiological alteration of mitochondrial function would allow the fine tuning of the Ca2+ wave spreading through the astrocyte network, hence modulating their information processing functions (Wang et al., 1997). Besides, in pathological conditions, a mitochondrial dysfunction could contribute to the pathogenesis of numerous CNS disorders such as ischemia and epilepsy.
Acknowledgments
We thank Miss D.L. Patterson for cell culture, and Mr. Jake Jacobson, Dr. Julie Keelan, and Dr. Mart H. Mojet for critical appraisal of the manuscript and helpful discussion.
We thank the Wellcome Trust for financial support. R. Rea was supported by the Wellcome 4 Year Ph.D. Programme in Neuroscience.
Abbreviations used in this paper
- [Ca2+]cyt
cytosolic Ca2+
- [Ca2+]m
mitochondrial Ca2+
- [Ca2+]n
nuclear Ca2+
- CNS
central nervous system
- FCCP
carbonyl cyanide p-trifluoromethoxy-phenyl-hydrazone
- IP3
inositol 1,4,5-trisphosphate
- Δψm
mitochondrial membrane potential
- SD
Leao's spreading depression
- TMRE
tetramethylrhodamine ethyl ester
Footnotes
Some animated sequences of images that have been used to provide data for this paper can be viewed on the web at http://www.geribolsover. physiol.ucl.ac.uk/Boitier/wave.html
References
- al Mohanna, F.A., K.W. Caddy, and S.R. Bolsover. The nucleus is insulated from large cytosolic calcium ion changes. Nature. 1994;367:745–750. doi: 10.1038/367745a0. [DOI] [PubMed] [Google Scholar]
- Babcock DF, Herrington J, Goodwin PC, Park YB, Hille B. Mitochondrial participation in the intracellular Ca2+network. J Cell Biol. 1997;136:833–844. doi: 10.1083/jcb.136.4.833. [DOI] [PMC free article] [PubMed] [Google Scholar]
- Bernardi P, Broekemeier KM, Pfeiffer DR. Recent progress on regulation of the mitochondrial permeability transition pore, a cyclosporin-sensitive pore in the inner mitochondrial membrane. J Bioenerg Biomembr. 1994;26:509–517. doi: 10.1007/BF00762735. [DOI] [PubMed] [Google Scholar]
- Berridge MJ. Inositol trisphosphate and calcium signalling. Nature. 1993;361:315–325. doi: 10.1038/361315a0. [DOI] [PubMed] [Google Scholar]
- Bezprozvanny I, Watras J, Ehrlich BE. Bell-shaped calcium-response curves of Ins(1,4,5)P3- and calcium-gated channels from endoplasmic reticulum of cerebellum. Nature. 1991;351:751–754. doi: 10.1038/351751a0. [DOI] [PubMed] [Google Scholar]
- Bowling AC, Beal MF. Bioenergetic and oxidative stress in neurodegenerative diseases. Life Sci. 1995;56:1151–1171. doi: 10.1016/0024-3205(95)00055-b. [DOI] [PubMed] [Google Scholar]
- Brini M, Marsault R, Bastianutto C, Pozzan T, Rizzuto R. Nuclear targeting of aequorin. A new approach for measuring nuclear Ca2+concentration in intact cells. Cell Calcium. 1994;16:259–268. doi: 10.1016/0143-4160(94)90089-2. [DOI] [PubMed] [Google Scholar]
- Camacho P, Lechleiter JD. Increased frequency of calcium waves in Xenopus-laevis oocytes that express a calcium-ATPase. Science. 1993;260:226–229. doi: 10.1126/science.8385800. [DOI] [PubMed] [Google Scholar]
- Carafoli E. Intracellular calcium homeostasis. Annu Rev Biochem. 1987;56:395–433. doi: 10.1146/annurev.bi.56.070187.002143. [DOI] [PubMed] [Google Scholar]
- Cornell-Bell AH, Finkbeiner SM, Cooper MS, Smith SJ. Glutamate induces calcium waves in cultured astrocytes; long-range glial signaling. Science. 1990;247:470–473. doi: 10.1126/science.1967852. [DOI] [PubMed] [Google Scholar]
- Crompton M, Andreeva L. On the involvement of a mitochondrial pore in reperfusion injury. Basic Res Cardiol. 1993;88:513–523. doi: 10.1007/BF00795416. [DOI] [PubMed] [Google Scholar]
- Dani JW, Chernjavsky A, Smith SJ. Neuronal activity triggers calcium waves in hippocampal astrocyte networks. Neuron. 1992;8:429–440. doi: 10.1016/0896-6273(92)90271-e. [DOI] [PubMed] [Google Scholar]
- Denton RM, McCormack JG. Ca2+as a second messenger within mitochondria of the heart and other tissues. Annu Rev Physiol. 1990;52:451–466. doi: 10.1146/annurev.ph.52.030190.002315. [DOI] [PubMed] [Google Scholar]
- Do Carmo, R.J., and G.G. Somjen. Spreading depression of Leao: 50 years since a seminal discovery. J Neurophysiol. 1994;72:1–2. doi: 10.1152/jn.1994.72.1.1. [DOI] [PubMed] [Google Scholar]
- Donnadieu E, Bourguignon LY. Ca2+ signaling in endothelial cells stimulated by bradykinin: Ca2+measurement in the mitochondria and the cytosol by confocal microscopy. Cell Calcium. 1996;20:53–61. doi: 10.1016/s0143-4160(96)90050-0. [DOI] [PubMed] [Google Scholar]
- Duchen MR. Ca2+-dependent changes in the mitochondrial energetics in single dissociated mouse sensory neurons. Biochem J. 1992;283:41–50. doi: 10.1042/bj2830041. [DOI] [PMC free article] [PubMed] [Google Scholar]
- Duchen MR, Leyssens A, Crompton M. Transient mitochondrial depolarizations reflect focal sarcoplasmic reticular calcium release in single rat cardiomyocytes. J Cell Biol. 1998;142:975–988. doi: 10.1083/jcb.142.4.975. [DOI] [PMC free article] [PubMed] [Google Scholar]
- Finch EA, Turner TJ, Goldin SM. Calcium as a coagonist of inositol 1,4,5-trisphosphate–induced calcium release. Science. 1991;252:443–446. doi: 10.1126/science.2017683. [DOI] [PubMed] [Google Scholar]
- Finkbeiner SM. Glial calcium. Glia. 1993;9:83–104. doi: 10.1002/glia.440090202. [DOI] [PubMed] [Google Scholar]
- Gunter TE. Cation transport by mitochondria. J Bioenerg Biomembr. 1994;26:465–469. doi: 10.1007/BF00762731. [DOI] [PubMed] [Google Scholar]
- Gunter TE, Pfeiffer DR. Mechanisms by which mitochondria transport calcium. Am J Physiol. 1990;258:C755–C786. doi: 10.1152/ajpcell.1990.258.5.C755. [DOI] [PubMed] [Google Scholar]
- Hajnoczky G, Robb-Gaspers LD, Seitz MB, Thomas AP. Decoding of cytosolic calcium oscillations in the mitochondria. Cell. 1995;82:415–424. doi: 10.1016/0092-8674(95)90430-1. [DOI] [PubMed] [Google Scholar]
- Hansford RG. Physiological role of mitochondrial Ca2+transport. J Bioenerg Biomembr. 1994;26:495–508. doi: 10.1007/BF00762734. [DOI] [PubMed] [Google Scholar]
- Hehl S, Golard A, Hille B. Involvement of mitochondria in intracellular calcium sequestration by rat gonadotropes. Cell Calcium. 1996;20:515–524. doi: 10.1016/s0143-4160(96)90094-9. [DOI] [PubMed] [Google Scholar]
- Herrington J, Park YB, Babcock DF, Hille B. Dominant role of mitochondria in clearance of large Ca2+loads from rat adrenal chromaffin cells. Neuron. 1996;16:219–228. doi: 10.1016/s0896-6273(00)80038-0. [DOI] [PubMed] [Google Scholar]
- Hoth M, Fanger CM, Lewis RS. Mitochondrial regulation of store-operated calcium signaling in T lymphocytes. J Cell Biol. 1997;137:633–648. doi: 10.1083/jcb.137.3.633. [DOI] [PMC free article] [PubMed] [Google Scholar]
- Ichas F, Jouaville LS, Mazat JP. Mitochondria are excitable organelles capable of generating and conveying electrical and calcium signals. Cell. 1997;89:1145–1153. doi: 10.1016/s0092-8674(00)80301-3. [DOI] [PubMed] [Google Scholar]
- Jensen JR, Rehder V. FCCP releases Ca2+ from a non-mitochondrial store in an identified Helisomaneuron. Brain Res. 1991;551:311–314. doi: 10.1016/0006-8993(91)90947-t. [DOI] [PubMed] [Google Scholar]
- John LM, Lechleiter JD, Camacho P. Differential modulation of SERCA2 isoforms by calreticulin. J Cell Biol. 1998;142:963–973. doi: 10.1083/jcb.142.4.963. [DOI] [PMC free article] [PubMed] [Google Scholar]
- Jou MJ, Peng TI, Sheu SS. Histamine induces oscillations of mitochondrial free Ca2+concentration in single cultured rat brain astrocytes. J Physiol (Lond) 1996;497:299–308. doi: 10.1113/jphysiol.1996.sp021769. [DOI] [PMC free article] [PubMed] [Google Scholar]
- Jouaville LS, Ichas F, Holmuhamedov EL, Camacho P, Lechleiter JD. Synchronization of calcium waves by mitochondrial substrates in Xenopus laevisoocytes. Nature. 1995;377:438–441. doi: 10.1038/377438a0. [DOI] [PubMed] [Google Scholar]
- Kirischuk S, Neuhaus J, Verkhratsky A, Kettenmann H. Preferential localization of active mitochondria in process tips of immature retinal oligodendrocytes. Neuroreport. 1995a;6:737–741. doi: 10.1097/00001756-199503270-00008. [DOI] [PubMed] [Google Scholar]
- Kirischuk S, Scherer J, Moller T, Verkhratsky A, Kettenmann H. Subcellular heterogeneity of voltage-gated Ca2+channels in cells of the oligodendrocyte lineage. Glia. 1995b;13:1–12. doi: 10.1002/glia.440130102. [DOI] [PubMed] [Google Scholar]
- Koopman WJ, Scheenen WJ, Roubos EW, Jenks BG. Kinetics of calcium steps underlying calcium oscillations in melanotrope cells of Xenopus laevis. . Cell Calcium. 1997;22:167–178. doi: 10.1016/s0143-4160(97)90010-5. [DOI] [PubMed] [Google Scholar]
- Kröner H. The different routes of calcium efflux from liver mitochondria. Biol Chem Hoppe-Seyler. 1992;373:229–235. doi: 10.1515/bchm3.1992.373.1.229. [DOI] [PubMed] [Google Scholar]
- Kume S, Muto A, Aruga J, Nakagawa T, Michikawa T, Furuichi T, Nakade S, Okano H, Mikoshiba K. The XenopusIP3 receptor: structure, function, and localization in oocytes and eggs. Cell. 1993;73:555–770. doi: 10.1016/0092-8674(93)90142-d. [DOI] [PubMed] [Google Scholar]
- Lawrie AM, Rizzuto R, Pozzan T, Simpson AWM. A role of calcium influx in the regulation of mitochondrial calcium in endothelial cells. J Biol Chem. 1996;271:10753–10759. doi: 10.1074/jbc.271.18.10753. [DOI] [PubMed] [Google Scholar]
- Leao AAP. Spreading depression of activity in the cerebral cortex. J Neurophysiol. 1944;7:359–390. doi: 10.1152/jn.1947.10.6.409. [DOI] [PubMed] [Google Scholar]
- Lechleiter JD, Clapham DE. Molecular mechanisms of intracellular calcium excitability in X. laevisoocytes. Cell. 1992;69:283–294. doi: 10.1016/0092-8674(92)90409-6. [DOI] [PubMed] [Google Scholar]
- Lechleiter J, Girard S, Peralta E, Clapham D. Spiral calcium wave propagation and annihilation in Xenopus laevisoocytes. Science. 1991;252:123–126. doi: 10.1126/science.2011747. [DOI] [PubMed] [Google Scholar]
- Leyssens A, Nowicky AV, Patterson L, Crompton M, Duchen MR. The relationship between mitochondrial state, ATP hydrolysis, [Mg2+]i and [Ca2+]istudied in isolated rat cardiomyocytes. J Physiol (Lond) 1996;496:111–128. doi: 10.1113/jphysiol.1996.sp021669. [DOI] [PMC free article] [PubMed] [Google Scholar]
- Loew LM, Carrington W, Tuft RA, Fay FS. Physiological cytosolic Ca2+transients evoke concurrent mitochondrial depolarizations. Proc Natl Acad Sci USA. 1994;91:12579–12583. doi: 10.1073/pnas.91.26.12579. [DOI] [PMC free article] [PubMed] [Google Scholar]
- Magnus G, Keizer J. Model of beta-cell mitochondrial calcium handling and electrical activity. II. Mitochondrial variables. Am J Physiol-Cell Physiol. 1998;43:C1174–C1184. doi: 10.1152/ajpcell.1998.274.4.C1174. [DOI] [PubMed] [Google Scholar]
- Martins-Ferreira H, Ribeiro LJ. Biphasic effects of gap junctional uncoupling agents on the propagation of retinal spreading depression. Braz J Med Biol Res. 1995;28:991–994. [PubMed] [Google Scholar]
- Minta A, Kao JP, Tsien RY. Fluorescent indicators for cytosolic calcium based on rhodamine and fluorescein chromophores. J Biol Chem. 1989;264:8171–8178. [PubMed] [Google Scholar]
- Nedergaard M. Direct signaling from astrocytes to neurons in cultures of mammalian brain cells. Science. 1994;263:1768–1771. doi: 10.1126/science.8134839. [DOI] [PubMed] [Google Scholar]
- Newman EA, Zahs KR. Calcium waves in retinal glial cells. Science. 1997;275:844–847. doi: 10.1126/science.275.5301.844. [DOI] [PMC free article] [PubMed] [Google Scholar]
- Newman EA, Zahs KR. Modulation of neuronal activity by glial cells in the retina. J Neurosci. 1998;18:4022–4028. doi: 10.1523/JNEUROSCI.18-11-04022.1998. [DOI] [PMC free article] [PubMed] [Google Scholar]
- Peuchen S, Clark JB, Duchen MR. Mechanisms of intracellular calcium regulation in adult astrocytes. Neuroscience. 1996a;71:871–883. doi: 10.1016/0306-4522(95)00515-3. [DOI] [PubMed] [Google Scholar]
- Peuchen S, Duchen MR, Clark JB. Energy metabolism of adult astrocytes in vitro. Neuroscience. 1996b;71:855–870. doi: 10.1016/0306-4522(95)00480-7. [DOI] [PubMed] [Google Scholar]
- Poot M, Zhang YZ, Kramer JA, Wells KS, Jones L, Hanzel DK, Lugade AG, Singer VL, Haughland RP. Analysis of mitochondrial morphology and function with novel fixable fluorescent stains. J Histochem Cytochem. 1996;44:1363–1372. doi: 10.1177/44.12.8985128. [DOI] [PubMed] [Google Scholar]
- Ramos-Franco J, Fill M, Mignery GA. Isoform-specific function of single inositol 1,4,5-trisphosphate receptor channels. Biophys J. 1998;75:834–839. doi: 10.1016/S0006-3495(98)77572-1. [DOI] [PMC free article] [PubMed] [Google Scholar]
- Rizzuto R, Simpson AW, Brini M, Pozzan T. Rapid changes of mitochondrial Ca2+revealed by specifically targeted recombinant aequorin. Nature. 1992;358:325–327. doi: 10.1038/358325a0. [DOI] [PubMed] [Google Scholar]
- Rizzuto R, Brini M, Murgia M, Pozzan T. Microdomains with high Ca2+close to IP3-sensitive channels that are sensed by neighboring mitochondria. Science. 1993;262:744–747. doi: 10.1126/science.8235595. [DOI] [PubMed] [Google Scholar]
- Rizzuto R, Bastianutto C, Brini M, Murgia M, Pozzan T. Mitochondrial Ca2+homeostasis in intact cells. J Cell Biol. 1994;126:1183–1194. doi: 10.1083/jcb.126.5.1183. [DOI] [PMC free article] [PubMed] [Google Scholar]
- Rizzuto R, Pinton P, Carrington W, Fay FS, Fogarty KE, Lifshitz LM, Tuft RA, Pozzan T. Close contacts with the endoplasmic reticulum as determinants of mitochondrial Ca2+responses. Science. 1998;280:1763–1766. doi: 10.1126/science.280.5370.1763. [DOI] [PubMed] [Google Scholar]
- Sheppard CA, Simpson PB, Sharp AH, Nucifora FC, Ross CA, Lange GD, Russell JT. Comparison of type 2 inositol 1,4,5-trisphosphate receptor distribution and subcellular Ca2+ release sites that support Ca2+waves in cultured astrocytes. J Neurochem. 1997;68:2317–2327. doi: 10.1046/j.1471-4159.1997.68062317.x. [DOI] [PubMed] [Google Scholar]
- Simpson PB, Russell JT. Mitochondria support inositol 1,4,5-trisphosphate-mediated Ca2+waves in cultured oligodendrocytes. J Biol Chem. 1996;271:33493–33501. doi: 10.1074/jbc.271.52.33493. [DOI] [PubMed] [Google Scholar]
- Simpson PB, Russell JT. Role of sarcoplasmic/endoplasmic–reticulum Ca2+–ATPases in mediating Ca2+ waves and local Ca2+-release microdomains in cultured glia. Biochem J. 1997;325:239–247. doi: 10.1042/bj3250239. [DOI] [PMC free article] [PubMed] [Google Scholar]
- Simpson PB, Russell JT. Mitochondrial Ca2+ uptake and release influence metabotropic and ionotropic cytosolic Ca2+responses in rat oligodendrocyte progenitors. J Physiol (Lond) 1998;508:413–426. doi: 10.1111/j.1469-7793.1998.413bq.x. [DOI] [PMC free article] [PubMed] [Google Scholar]
- Simpson PB, Mehotra S, Langley D, Sheppard CA, Russell JT. Specialized distributions of mitochondria and endoplasmic reticulum proteins define Ca2+wave amplification sites in cultured astrocytes. J Neurosci Res. 1998;52:672–683. doi: 10.1002/(SICI)1097-4547(19980615)52:6<672::AID-JNR6>3.0.CO;2-5. [DOI] [PubMed] [Google Scholar]
- Sims NR. Calcium, energy metabolism and the development of selective neuronal loss following short-term cerebral ischemia. Metab Brain Dis. 1995;10:191–217. doi: 10.1007/BF02081026. [DOI] [PubMed] [Google Scholar]
- Somjen GG, Aitken PG, Czeh G, Jing J, Young JN. Cellular physiology of hypoxia of the mammalian central nervous system. Res Publ Assoc Res Nerv Ment Dis. 1993;71:51–65. [PubMed] [Google Scholar]
- Sparagna GC, Gunter KK, Sheu SS, Gunter TE. Mitochondrial calcium uptake from physiological-type pulses of calcium. A description of the rapid uptake mode. J Biol Chem. 1995;270:27510–27515. doi: 10.1074/jbc.270.46.27510. [DOI] [PubMed] [Google Scholar]
- Thayer SA, Miller RJ. Regulation of the intracellular free calcium concentration in single rat dorsal root ganglion neurons in vitro. J Physiol (Lond) 1990;425:85–115. doi: 10.1113/jphysiol.1990.sp018094. [DOI] [PMC free article] [PubMed] [Google Scholar]
- Tower DB. A century of neuronal and neuroglial interactions, and their pathological implications: an overview. Prog Brain Res. 1992;94:3–17. doi: 10.1016/s0079-6123(08)61735-5. [DOI] [PubMed] [Google Scholar]
- Trollinger DR, Cascio WE, Lemasters JJ. Selective loading of Rhod 2 into mitochondria shows mitochondrial Ca2+transients during the contractile cycle in adult rabbit cardiac myocytes. Biochem Biophys Res Commun. 1997;236:738–742. doi: 10.1006/bbrc.1997.7042. [DOI] [PubMed] [Google Scholar]
- Venance L, Stella N, Glowinski J, Giaume C. Mechanism involved in initiation and propagation of receptor-induced intercellular calcium signaling in cultures rat astrocytes. J Neurosci. 1997;17:1981–1992. doi: 10.1523/JNEUROSCI.17-06-01981.1997. [DOI] [PMC free article] [PubMed] [Google Scholar]
- Verkhratsky A, Orkand RK, Kettenmann H. Glial calcium: homeostasis and signaling function. Physiol Rev. 1998;78:99–141. doi: 10.1152/physrev.1998.78.1.99. [DOI] [PubMed] [Google Scholar]
- Wang SSH, Thompson SH. Local positive feedback by calcium in the propagation of intracellular calcium waves. Biophys J. 1995;69:1683–1697. doi: 10.1016/S0006-3495(95)80086-X. [DOI] [PMC free article] [PubMed] [Google Scholar]
- Wang Z, Tymianski M, Jones OT, Nedergaard M. Impact of cytoplasmic calcium buffering on the spatial and temporal characteristics of intercellular calcium signals in astrocytes. J Neurosci. 1997;17:7359–7371. doi: 10.1523/JNEUROSCI.17-19-07359.1997. [DOI] [PMC free article] [PubMed] [Google Scholar]
- Werth JL, Thayer SA. Mitochondria buffer physiological calcium loads in cultured rat dorsal root ganglion neurons. J Neurosci. 1994;14:348–356. doi: 10.1523/JNEUROSCI.14-01-00348.1994. [DOI] [PMC free article] [PubMed] [Google Scholar]
- Yao Y, Choi J, Parker I. Quantal puffs of intracellular Ca2+ evoked by inositol trisphosphate in Xenopusoocytes. J Physiol (Lond) 1995;482:533–553. doi: 10.1113/jphysiol.1995.sp020538. [DOI] [PMC free article] [PubMed] [Google Scholar]
- Zhou Z, Matlib MA, Bers DM. Cytosolic and mitochondrial Ca2+signals in patch clamped mammalian ventricular myocytes. J Physiol (Lond) 1998;507:379–403. doi: 10.1111/j.1469-7793.1998.379bt.x. [DOI] [PMC free article] [PubMed] [Google Scholar]