Abstract
In Paramecium tetraurelia, polyamine-triggered exocytosis is accompanied by the activation of Ca2+-activated currents across the cell membrane (Erxleben, C., and H. Plattner. 1994. J. Cell Biol. 127:935– 945). We now show by voltage clamp and extracellular recordings that the product of current × time (As) closely parallels the number of exocytotic events. We suggest that Ca2+ mobilization from subplasmalemmal storage compartments, covering almost the entire cell surface, is a key event. In fact, after local stimulation, Ca2+ imaging with high time resolution reveals rapid, transient, local signals even when extracellular Ca2+ is quenched to or below resting intracellular Ca2+ concentration ([Ca2+]e ⩽ [Ca2+]i). Under these conditions, quenched-flow/freeze-fracture analysis shows that membrane fusion is only partially inhibited. Increasing [Ca2+]e alone, i.e., without secretagogue, causes rapid, strong cortical increase of [Ca2+]i but no exocytosis. In various cells, the ratio of maximal vs. minimal currents registered during maximal stimulation or single exocytotic events, respectively, correlate nicely with the number of Ca stores available. Since no quantal current steps could be observed, this is again compatible with the combined occurrence of Ca2+ mobilization from stores (providing close to threshold Ca2+ levels) and Ca2+ influx from the medium (which per se does not cause exocytosis). This implies that only the combination of Ca2+ flushes, primarily from internal and secondarily from external sources, can produce a signal triggering rapid, local exocytotic responses, as requested for Paramecium defense.
In most systems analyzed so far, exocytosis is triggered by the increase of intracellular free Ca2+ concentration ([Ca2+]i)1. In fast responding systems such as motor endplates, this increase occurs through an influx of extracellular Ca2+ (Ca2+ e), via voltage-dependent Ca2+ channels at active zones where neurotransmitter vesicles are docked. In other systems, Ca2+ is mobilized exclusively or additionally from internal stores (Burgoyne and Morgan, 1993; Cheek and Barry, 1993; Pozzan et al., 1994).
Recent views have emphasized the possible primary importance of subplasmalemmal Ca stores due to their structural and functional coupling with the cell membrane (Berridge, 1995). In most systems, however, such stores are difficult to identify, as is their structural relationship with secretory organelles. The latter relationship is important, considering the rapid decay of local [Ca2+]i increases taking place with space and time (Llinás et al., 1992; Neher and Augustine, 1992; Zucker, 1993). Clearly, therefore, a secretory system operating under defined spatio–temporal conditions offers advantages for analyzing the role of subplasmalemmal Ca stores in regulation of exocytosis. Paramecium tetraurelia cells can be such a system. In fact, each Paramecium cell contains numerous secretory organelles, or trichocysts, attached at the cell membrane, ready for immediate release (Plattner et al., 1991). Single or a few trichocysts are discharged spontaneously, or upon slight irritation of the cell (Haacke-Bell et al., 1990). The other extreme is the synchronous (within <1 s) release of most of the >103 docked trichocysts in response to aminoethyldextran (AED) (Plattner et al., 1984, 1985; Knoll et al., 1991a ). Such a massive trichocyst exocytosis can be restricted to discrete sites of the cell surface following either local application of AED (Plattner et al., 1984), or contact with predatory ciliates, whereby it serves a defensive function (Knoll et al., 1991b ). With AED, signal transduction is restricted to the somatic (nonciliary) cell membrane (Plattner et al., 1984, 1991; Erxleben and Plattner, 1994).
A Paramecium cell displays an egg case type surface relief with unit fields, kinetids, which are associated with as many alveolar sacs. Alveolar sacs, which are known to be Ca stores (Stelly et al., 1991; Länge et al., 1995), are tightly attached to the cell membrane, with each trichocyst positioned at the edge of four adjacent sacs (Allen, 1988). During AED-triggered exocytosis (Knoll et al., 1993; Stelly et al., 1995) the sacs are rapidly mobilized, with ensuing rapid increase in subplasmalemmal [Ca2+]i (Knoll et al., 1993) and activation of Ca2+-dependent currents whose size roughly correlates with the extent of AED stimulation (Erxleben and Plattner, 1994). Moreover, under these conditions mobilization of Ca2+ from subplasmalemmal stores is accompanied by an influx of Ca2+ e (Kerboeuf and Cohen, 1990; Knoll et al., 1992; Erxleben and Plattner, 1994).
In the present study, a more precise correlation between electrophysiological and morphometric data has been carried out by using [Ca2+]-fluorochrome analysis and rapid confocal laser scanning microscopy (CLSM), with quenched- flow/freeze-fracture to reveal membrane fusion events. Our goal was to analyze the origins of subplasmalemmal Ca2+ signals and their importance for exocytotic events.
Materials and Methods
Cell Cultures
Paramecium tetraurelia wild-type (7S) cells were cultivated monoxenically to stationary phase, with Enterobacter aerogenes added, as previously described (Plattner et al., 1984, 1985), using a medium supplemented with stigmasterol (Sigma Chemical Co., St. Louis, MO), 5 mg/liter, and [Ca2+] of 0.1 mM.
Electrophysiology
The method applied for voltage clamp and for extracellular current recordings as well as the solutions used were as described previously (Erxleben and Plattner, 1994). Briefly, the anterior pole of a cell was sucked into a holding pipette (covering ∼1/2 of the cell surface). Spontaneous currents were registered after cells were impaled by the microelectrode or, for extracellular recordings, after immobilization in the holding pipette. Spontaneous current fluctuations were registered in parallel to the occurrence of single or several secretory events. Since the number of truly spontaneous current events was very variable and usually quite low (in the order of 1/1–5 min), cells were also triggered to different extents by local pressure application of 0.01% AED (Plattner et al., 1984, 1985) from a pipette positioned about two cell lengths away. Pressure and duration of the pulse were adjusted such that only a small number of trichocysts were released. Pressure application of solution without AED evoked neither currents nor exocytosis.
Secretagogue-induced currents were recorded under voltage clamp conditions or as extracellular currents, as described previously (Erxleben and Plattner, 1994). Discharge of trichocysts was observed under a microscope with 40× phase contrast water-immersion optics and recorded with a CCD camera. To establish the temporal relationship between the currents elicited by AED and the discharge of trichocysts as observed under the microscope, AED-induced currents were displayed on an oscilloscope, from which they were recorded by a second CCD camera. The video signals of both cameras, one attached to the microscope and the other recording the oscilloscope traces, were combined by a digital video mixer (WJ-AVE5; Panasonic, Osaka, Japan). The time resolution for the observation camera was 20 ms. For analysis, half frames of the combined video signal were analyzed on a monitor. For processing of figures, the video signal was digitized with a frame grabber (miroVideo D1; MicroComputer products AG, Braunschweig, Germany).
Estimation of Cell Surface Area and of the Number of Subplasmalemmal Ca Stores
Cell size was estimated from pictures taken with a phase contrast microscope, 40× objective, including a grating scale in samples. On prints of 1,125× magnification, median views of cells were subdivided into 5 mm discs. Cell surface area and cell volume were computed assuming rotational symmetry. Cilia and crenulation of the somatic surface area could be neglected for the following reasons: (a) Cilia do not contribute to Ca2+ fluxes during AED-triggered exocytosis (Plattner et al., 1984; Erxleben and Plattner, 1994). (b) Crenulation may cause only <20% surface increase. (c) Our main goal was to estimate the number of alveolar sacs per cell reflected by the number of surface fields, or kinetids, per cell.
The average area of a kinetid was determined at the light and electron microscope level. On LM micrographs (100× oil immersion lens and grating scale included in samples), kinetid sizes were evaluated at 2,130× magnification. The same was done on EM micrographs obtained as follows. Cells sandwiched between thin copper sheets were injected into melting propane, freeze-fractured, and Pt/C replicated in a BAF300 freeze-fracture device from Balzers S.P.A. (Balzers, Liechtenstein). Replicas were evaluated at EM magnifications controlled by latex particles of defined size (Serva, Heidelberg, Germany) and reproduced at 11.400× magnification. Longitudinal and perpendicular dimensions of kinetids were computed from LM and EM micrographs by evaluating as many periods in strictly vertical view from as many cells as possible.
Quenched-Flow/Freeze-Fracture Analysis with Normal or Reduced Extracellular Ca2+
Cells were processed in a quenched-flow device according to Knoll et al. (1991a) and Plattner et al. (1994). The medium contained 0.1 mM Ca2+. Cells were mixed with either equal parts of culture medium (negative control) or with 0.02% AED (positive control). Aliquots were mixed with equal parts of 9 mM EGTA for 200 ms and then with two parts of 0.02% AED for an additional 80 ms. After mixing in the apparatus, samples were frozen in melting propane for subsequent freeze-fracture. Evaluation of trichocyst docking sites, with or without exocytotic membrane fusion, was as described previously (Knoll et al., 1991a ; Plattner et al., 1994).
Ca2+ Imaging by Conventional Microscopy or CLSM
Experiments were conducted with single cells bathed in a defined microdroplet of medium containing 0.1 mM Ca2+. Cells were microinjected with the following fluorochromes: 100 μM calcium green-2 (CaGr-2), 100 μM Fluo-3, or 50 μM Fura red (final concentrations in cells after injection of 10% of the cell volume size; Table I). Fluorochromes, all obtained from Molecular Probes (Eugene, OR), were allowed to spread for 2 min to reach the outermost cell periphery.
Table I.
Morphometric Parameters of P. tetraurelia Cells Used in This Study
| Parameter | Measurement | |
|---|---|---|
| Cell volume (× 10−11 L) | 7.33 ± 1.33 (N = 21) | |
| Cell surface (μm2) | 10,703 ± 1,289 (N = 21) | |
| Dimensions of kinetids | ||
| Length (μm) | ||
| LM analysis | 2.03 ± 0.19 (n = 274, N = 11) | |
| EM analysis | 2.09 ± 0.17 (n = 567, N = 10) | |
| Width (μm) | ||
| LM analysis | 1.63 ± 0.19 (n = 183, N = 11) | |
| EM analysis | 1.72 ± 0.22 (n = 231, N = 10) | |
| Size of kinetids (μm2) | ||
| LM analysis | 3.31 ± 0.68 (N = 11) | |
| EM analysis | 3.59 ± 0.74 (N = 10) | |
| Number of kinetids per cell | ||
| LM analysis | 3,234 (N = 11) | |
| EM analysis | 2,981 (N = 10) | |
| LM + EM analysis, pooled | 3,107 (N = 21) |
N = Number of cells; n = Number of structures analyzed ± standard deviations.
In some experiments, cells preloaded with Fura red were flushed with high [Ca2+]e and quantitatively analyzed for cortical [Ca2+] transients and exocytotic response. In more expansive experiments, [Ca2+]e was reduced by superfusion (for up to 1 s, from a distance of ∼10 μm, in a direction tangential to the cell surface) with a local flush, using a pipette (2 μm inner diameter) filled with 10 mM EGTA and 50 μM fluorescein (Sigma Chemical Co.) using a home made device operated at 2.5 kPa. By the calibration of the fluorescein signal, the EGTA concentration at the discrete site of the cell surface was estimated to be ∼5 mM, corresponding to [Ca2+] resting levels inside the cell (50–100 nM). Overall [Ca2+]e was determined separately by addition of a calibrated Fura red solution to the microdroplet. At the end of an EGTA flush, AED was applied to the same site using a second pipette close to the EGTA pipette but vertical to the cell surface. To control the propagation of AED and the concentration sensed by the cell surface with this set up, fluorescein was sometimes also added to the secretagogue.
Fluorescence evaluation was either in a conventional mode, with 1–2 s filter changes, using an inverted microscope (ICM 405; Zeiss Inc., Oberkochen, Germany), or a microscope (Axiovert; Zeiss Inc.) equipped with a confocal imaging system (Noran Instruments, Bruchsal, Germany). A minimum of 33 ms frame sequences allowed documentation of [Ca2+]i fluorescence transients with CLSM, in some cases alternating with phase contrast imaging. Excitation wavelength was 488 nm (Ar-laser emission) for CaGr-2, Fluo-3, or fluorescein, or 490 nm (±5 nm, band pass filter) for Fura red. Emitted wavelength registered was ⩾515 nm for CaGr-2, Fluo-3, or fluorescein, or ⩾560 nm for Fura red (detected by a moonlight camera; Panasonic, combined with a 560 nm dichroic mirror and a 560-nm-long pass filter).
To minimize false or irrelevant fluorescence signals, evaluation included (a) calibration of fluorochrome signals with standard Ca2+ solutions in microdroplets, (b) intermittent registration of signals with exocytosis recording in phase contrast, (c) overlapping use of fluorochromes with different properties, (d) mimicking shape changes via mechanical deformation without exocytosis triggering, (e) background reduction by digital image subtraction in rapid CLSM series, (f) transformation of signals into false colors, and (g) evaluation of important cell regions by line scans. We could thus either follow semi-quantitatively rapid [Ca2+] changes in the CLSM mode, or we could follow quantitatively longer lasting [Ca2+] changes in the conventional microscope.
Results
Electrophysiological Recordings Show Correlation of Subplasmalemmal Ca2+ Transients with Exocytosis
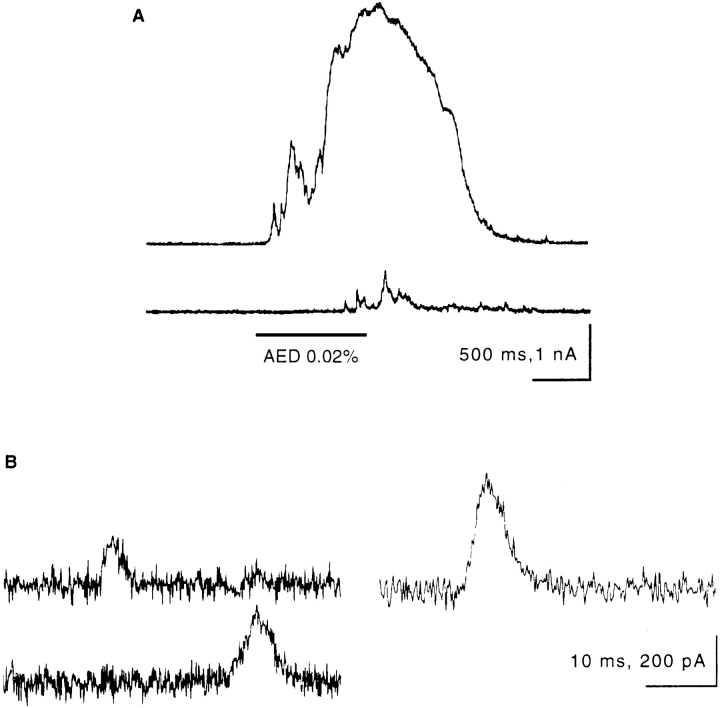
Flushing a Paramecium cell with AED causes massive exocytosis which, under voltage clamp conditions, is paralleled by an outward current of 3 × 10⁻⁹ As lasting ∼2 s (Fig. 1 A, top). Some smaller peaks may precede the main current peak. As shown in more detail below, the magnitude of the current is proportional to the number of trichocysts released. The currents display a fast rising phase and a slower, approximately exponential decay (Fig. 1 B). A second pulse of AED after 20 s provokes little if any additional trichocyst release and causes a series of only small currents (Fig. 1 A, bottom).
Figure 1.
Voltage clamp recordings of AED-induced and spontaneous outward currents. (A) Response to AED application (upper trace) and to a second application 20 s later (lower trace). Time and duration of the AED application are marked by the horizontal bar. Note apparent superposition of numerous small current peaks at the onset of the current response (upper trace). (B) Several examples of spontaneous currents of different size, all displaying a steep rising phase and a slow decay.
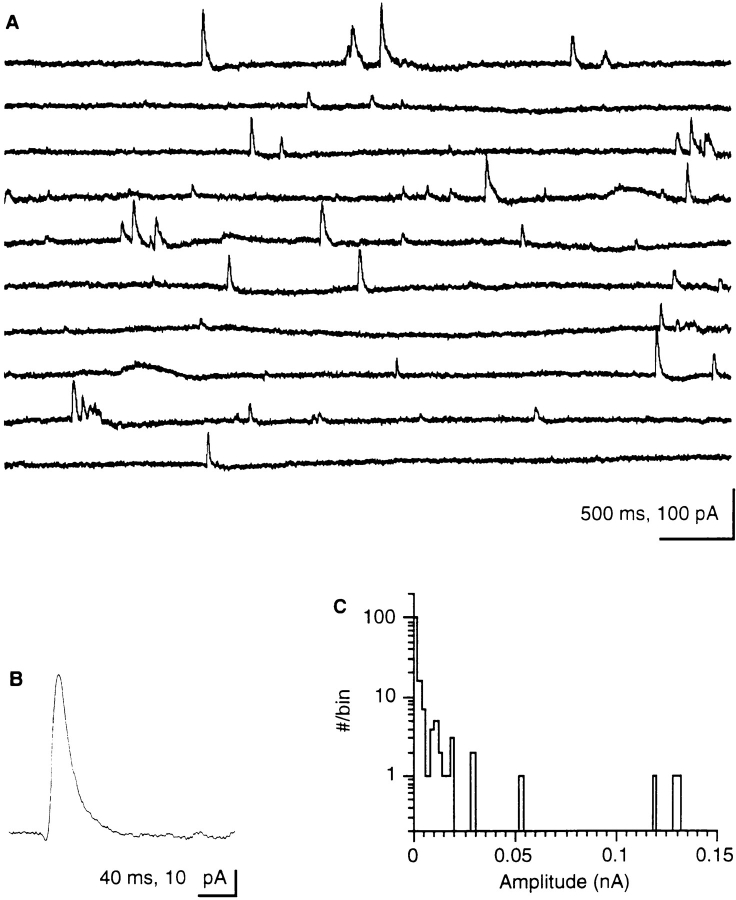
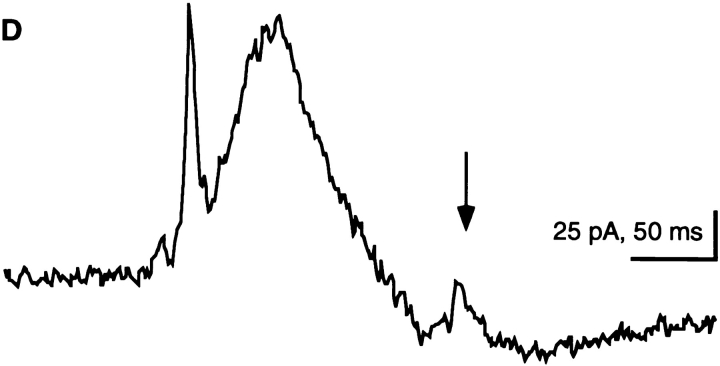
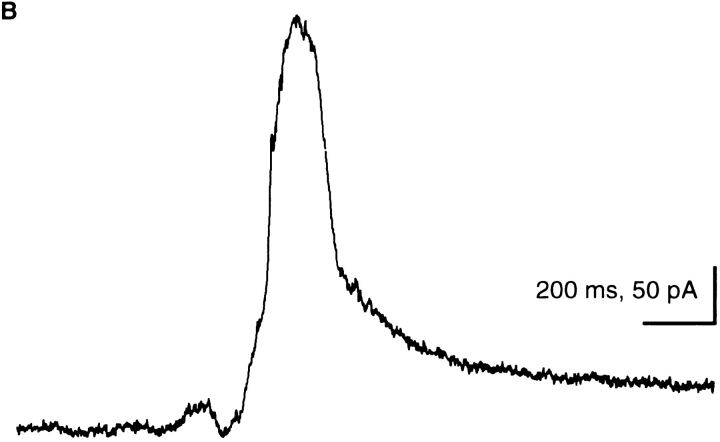
Small numbers of trichocysts can be quantified in the LM (Plattner et al., 1984, 1985). Exocytosis of one or a few trichocysts occurs upon slight irritation of a cell (HaackeBell et al., 1990), i.e., during immobilization and impalement by a microelectrode. This, however, does not appear to be the immediate trigger for spontaneous exocytosis or spontaneous currents we observed, since we allowed cells to stabilize before recordings were started. Stochastic current peaks are observed during both intracellular and extracellular recordings (Fig. 2). Extracellularly recorded currents are of a different size but of similar shape, as are currents recorded under voltage clamp conditions (Fig. 1 A, top). Spontaneous signals representing 36 events were averaged in Fig. 2 B. Currents with a mean amplitude of 34 pA show a fast rising phase (rise time, tr = 7 ms) and a half width of t1/2 = 21 ms. These properties characterize single events, corresponding to the peak in Fig. 3 D (arrow) which is associated with the release of a single trichocyst. The histogram of Fig. 2 C clearly shows the absence of discrete steps in the current size, i.e., absence of quantal current events. Fig. 3 reveals that a minimal current peak accompanies release of an individual trichocyst. A further example of simultaneous current and exocytosis registration involving a larger number of trichocysts is documented in Fig. 4.
Figure 2.
(A) Continuous extracellular recording of spontaneous outward currents (5 s per lane, 300 Hz filter, digitized at 1 kHz). Note the occurrence of peaks of similar size and shape, as in Fig. 1 B, including some minimal peaks (see Figs. 3 and 5). (B) Evaluation by superposition of 36 extracellular recordings of small (posterior outward) peak currents. Note steep increase (tr = 7 ms) and half-width (t1/2 = 21 ms); amplitude, 34 pA. (C) Amplitude– frequency distribution (log scale) of spontaneous current peaks from extracellular recordings. The histogram shows high frequency of minimal peaks, low frequency of larger amplitude peaks, and absence of discrete multiple current steps.
Figure 3.
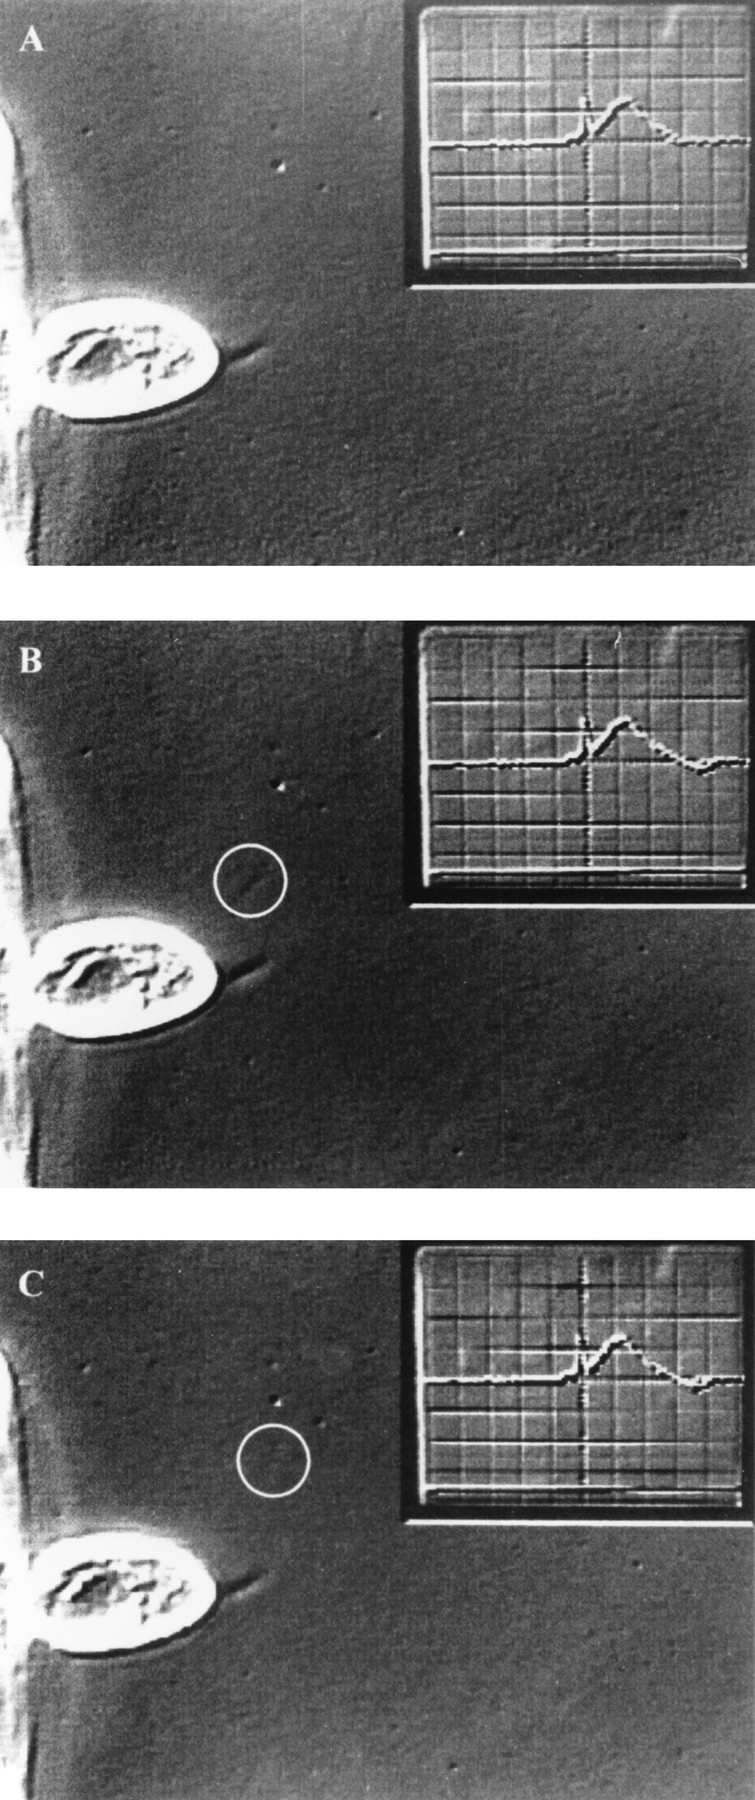
Exocytosis of one trichocyst gives rise to a single current event. Consecutive half frames (20 ms apart) before (A) and after (B and C) exocytosis of a single trichocyst (circle) from a cell (c) attached to a holding pipette (hp). (D) Simultaneously recorded outward current signal, which is shown as inset in (A–C) (see Materials and Methods). The current event corresponding to the single trichocyst is marked by the arrow. It has a charge of 0.6 pC and is amplified in (D). Preceding large currents correspond to release of trichocysts that are already outside the viewing area. At the end of recording, trichocysts can be identified and counted much more clearly after they have settled (not shown). Data was obtained by extracellularly recorded outward currents after application of a submaximal dose of AED.
Figure 4.
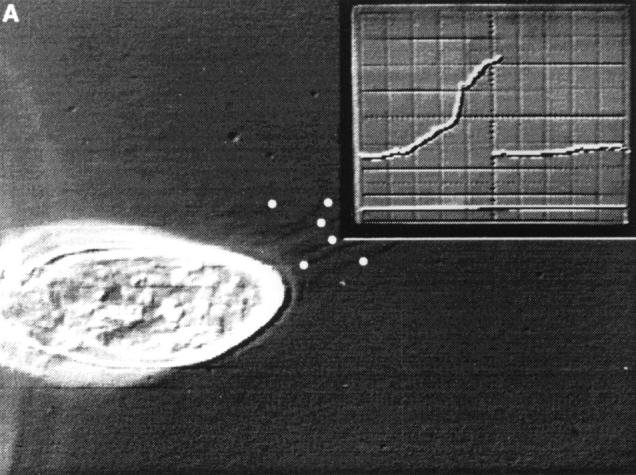
Exocytosis of many trichocysts is accompanied by large currents. (A) During the frame shown, only 6 of 25 released trichocysts were visible (white dots). When settled, they could be documented much more clearly (not shown) than during rapid expulsion. The current recording (inset) shows the foot of the rising phase of the current signal, which is shown in its full duration in (B; extracellularly recorded outward current after application of a submaximal dose of AED). The current corresponds to a charge of 40 pC.
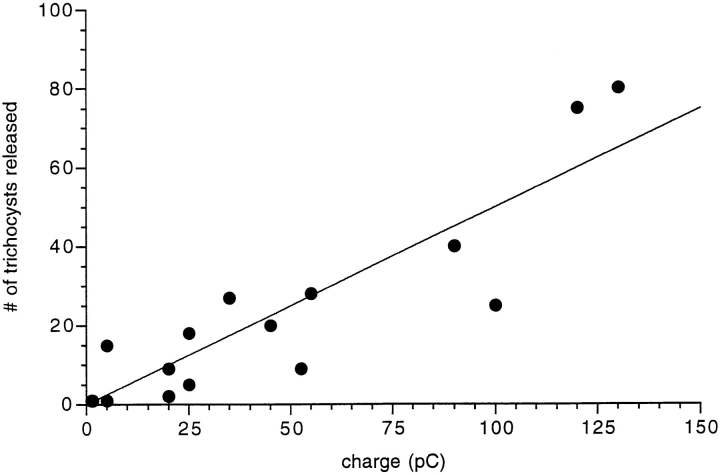
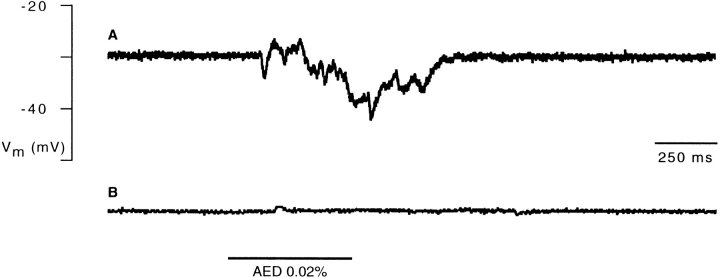
Fig. 5 correlates the charge of the electrical events with the number of trichocysts released. Data scatter is large but not unexpected for several reasons. (a) Trichocyst countings are not absolutely certain. (b) The Ca2+-activated currents recorded are not caused simply by mobilization from discrete stores but may be amplified to a variable extent by Ca2+ influx from the medium. (c) While exocytosis is always accompanied by a current, spontaneous currents can be observed that are not accompanied by spontaneous exocytosis. This may be due to the fact that not all potential exocytosis sites are occupied by a trichocyst (Plattner et al., 1991; Knoll et al., 1991a , 1993). Within these limitations, we calculated the unit current event as 1.21 ± 0.97 pC per exocytotic event (Fig. 5). By EGTA injection we have ascertained that the currents described depend on a subplasmalemmal [Ca2+]i increase (Fig. 6).
Figure 5.
The number of released trichocysts correlates with the total current that is recorded during exocytosis. The number of released trichocysts is plotted as a function of charge (the current integral) during 16 exocytotic events, all from different cells. The straight line is a linear, least squares fit to the data points, with a slope of 1.21 ± 0.97 pC/trichocyst.
Figure 6.
Block of the AED-induced hyperpolarization by injection of EGTA into the cell. (A) Intracellular recording of a voltage response elicited by application of AED (horizontal bar). (B) Block of the AED response after iontophoretic injection of EGTA (60 s, −2 nA) into the cell.
In conclusion, our recordings show that the number of trichocysts released by exocytosis in response to AED is paralleled by a nonstepwise increase in subplasmalemmal Ca2+-dependent currents.
Quenched-Flow/Freeze-Fracture Analysis Shows only Partial Reduction of Exocytotic Membrane Fusion with Low [Ca2+]e, while under Normal Conditions Internal and External Ca2+ Sources Contribute to Exocytosis
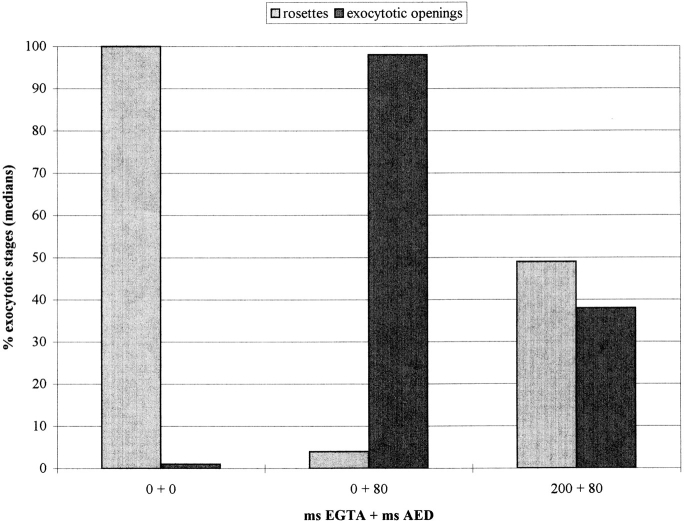
Exocytosis of trichocyst contents is monitored in the LM by decondensation (stretching) to the typical needles seen outside a cell (see Fig. 9, D and F and Fig. 10, M and O). Since this requires Ca2+ e (Bilinski et al., 1981), the effects of low [Ca2+]e on membrane fusion had to be analyzed separately in quenched-flow/freeze-fracture experiments (Fig. 7). This also allows rigorous mixing of cells with EGTA and, thus, restriction of the time of EGTA application since this could potentially affect cell function (see below). Trichocyst docking sites were rated as resting stages with rosettes (aggregates of integral membrane proteins; Plattner et al., 1991), or as activated stages with exocytotic openings of variable diameters. Fig. 7 includes data from controls (left) which were mockstimulated with culture medium (0.1 mM [Ca2+]e) and processed by the same method. In this case, no activated docking sites were observed, and resting stages in these controls are used as reference (100%). In the presence of Ca2+ e, AED activates all exocytotic sites (Fig. 7, middle). EGTA application for 200 ms, followed by 80 ms AED triggering, allows activation of only ∼40% of the potential trichocyst docking sites (Fig. 7, right). 80 ms was selected because synchronous exocytosis is normally completed within this time (Knoll et al., 1991a ). Columns in these data pairs do not add up to identical values because they represent medians derived from different individual cells, with variable numbers of observations.
Figure 9.
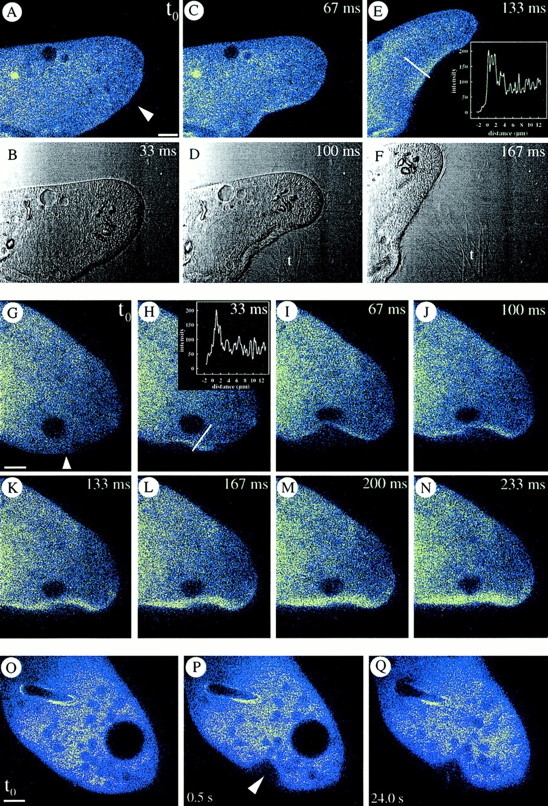
CaGr-2–loaded cells. (A–F) Local AED application (arrowhead), in presence of 0.1 mM [Ca2+]e, causes exocytosis of expanding trichocyst contents (t, phase contrast) from the site with faintly visible cortical [Ca2+]i increase, whose intensity is shown as a line scan in E. (G–N) Continuous [Ca2+]i recording after local AED application (arrowhead) shows continuous signal increase as with Fluo-3 in Fig. 10, Q–T. Note line scan in H. (O–Q) Mechanical deformation at arrowhead does not cause any signal comparable to that after local AED application (A–E and G–N). Bars, 10 μm.
Figure 10.
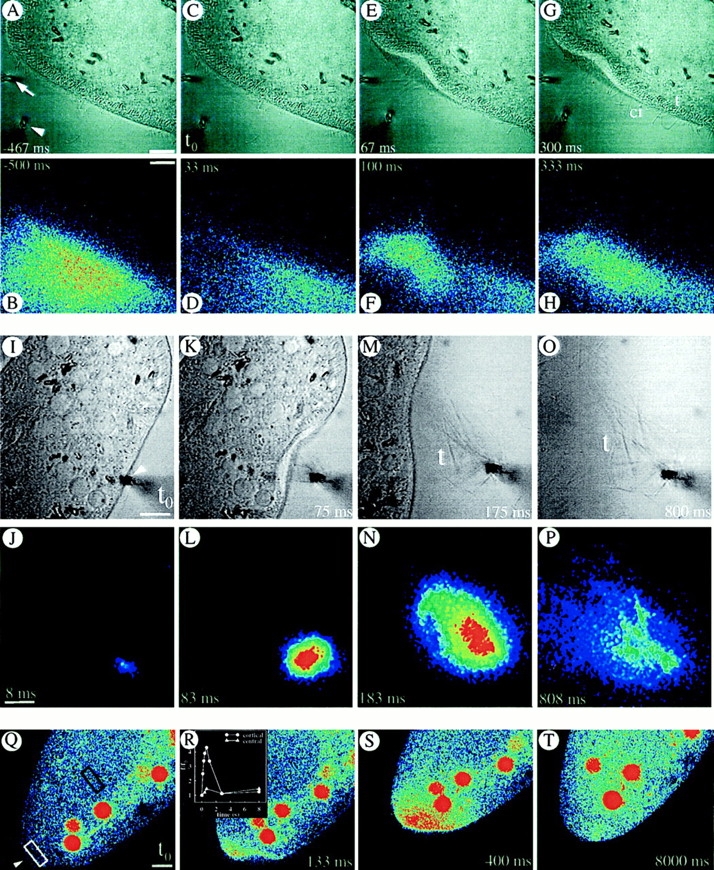
(A–H) Consecutive local application of fluorescein-tagged EGTA (by a horizontal pipette at arrow) and of AED (by vertical pipette at arrowhead in the phase contrast image, (A) allows determination of actual EGTA concentration at the cell surface (see Methods). Although pressure application of AED slightly deforms the cell at 67 ms, no side effects occur. At the cell membrane, tightly packed ∼5 μm long, rod-like trichocysts (t) are visible inside, whereas some cilia (ci) of similar length can be recognized outside (e.g., at 67 and 300 ms). The effectiveness of EGTA is implied by the absence of any expelled, decondensed trichocyst contents; these would expand to ∼30 μm (M and O) by a process requiring Ca2+ e (see Introduction). (I–P) Cell triggered with fluorescein-tagged AED in presence of 0.1 mM [Ca2+]e. Note expansion of trichocyst contents (t), after exocytosis, in the phase contrast image. (Q–T) Absence of Ca2+ e allows for a local Ca2+ i-excited Fluo-3 signal without further spreading. Local AED application (arrowhead) with 10 mM EGTA in the medium. (Red balls are phagosomes which have sequestered some of the fluorochrome injected.) Note that [Ca2+]i increase remains restricted to the region reached by AED, without subsequent far reaching signal spreading, e.g., from white to black frame (R). Bars, 10 μm.
Figure 7.
Quenched-flow/ freeze-fracture evaluation of trichocyst docking sites. (Left) When processed without EGTA and AED, docking sites (normalized to 100%) are all present as resting stages (with rosettes), and practically no exocytotic openings occur. Number of cells analyzed, N = 34; number of docking sites analyzed, n = 628. (Middle) Without EGTA, application of AED transforms most docking sites into exocytotic openings within 80 ms. N = 23, n = 304. (Right) After 200 ms EGTA pretreatment, AED transforms only ∼40% of docking sites to exocytotic openings within 80 ms. N = 19, n = 303. Parameter-free U-test analysis shows statistically significant differences (P < 0.001) between column pairs, except for the last pair.
These data show that exocytotic membrane fusion of about half of the docking sites, can be induced by mobilization of Ca2+ from internal pools. We conclude that Ca2+ mobilization from subplasmalemmal pools operates at its limits and is normally intensified by a Ca2+ influx.
Ca2+ Imaging Shows a Rapid Subplasmalemmal [Ca2+] Transient by AED Stimulation Even with Low [Ca2+]e, while Such a Transient Achieved by Rapid [Ca2+]e Increase Alone Does Not Induce Exocytosis
Different fluorochromes were used to overcome problems specific of different experiments. Fura red allows quantitation, although with low time resolution. CaGr-2 and Fluo-3 combined with CLSM allow only semi-quantitative analyses, though in the sub-second range, whereby Fluo-3 has the disadvantage of being partially sequestered into phagosomes, while providing significantly higher quantum yield than CaGr-2. The occurrence of similar signals over the same time periods made us confident, however, about the relevance of our findings.
To establish whether a Ca2+ influx would also suffice to trigger exocytosis or, alternatively, whether alveolar sacs may be the primary Ca2+ source during AED stimulation, as suggested above, we first worked with media in which Ca2+ e was chelated by EGTA. Long term experiments, however, were impossible, because at low [Ca2+]e (⩽50 μM) the membrane of many cells becomes leaky to a broad spectrum of small molecules (Hille, 1992). As Fig. 8 shows, increasing [Ca2+]e to 10 mM suffices to produce an immediate strong cortical [Ca2+] transient, yet without inducing any exocytotic responses. This largely excludes any CICR mechanism.
Figure 8.
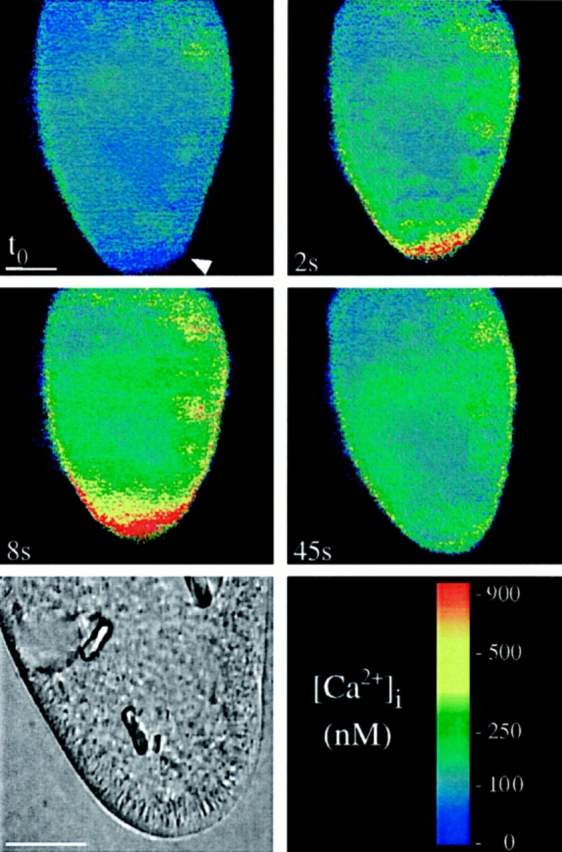
Increasing [Ca2+]e from 0.1 to 10 mM causes a rapid cortical Ca2+ transient, but no exocytosis. A Fura red–loaded cell was analyzed by the double wavelength method, after application of 10 mM [Ca2+]e (no AED) at the arrowhead at to. [Ca2+]i at this site shows a rapid transient increase at 2 s, reaching ∼1 μM at 8 s and returning to almost resting levels after 45 s. Phase contrast analysis at the end of the experiment (lower left) shows a full set of trichocysts in the cell, ∼5 μm long, at the cell membrane, none having been expelled. Bar, 20 μm.
CLSM using CaGr-2 f/fo imaging shows that a cortical [Ca2+] transient occurs within ∼100 ms of AED application (Fig. 9, A–F), i.e., within the time required for exocytosis (Knoll et al., 1991a ), as documented by the intermittent phase contrast pictures in Fig. 9, A–F. Controls carried out to exclude a role of cell deformation included analyses with more strict time scales, revealing a continuous build up of the cortical fluorescence signal irrespective of cell deformation (Fig. 9, G–N), and local mechanical deformation of cells which failed to produce any comparable signal (Fig. 9, O–Q). Therefore, we are confident that the cortical Ca2+ signal parallels exocytosis, as documented above independently by electrophysiology and by quenched-flow/freeze-fracture analysis.
Next we analyzed whether Ca2+ mobilization from stores might suffice to trigger exocytosis. Results obtained by fluorescein-tagged EGTA solution with subsequent AED application are shown in Fig. 10, A–H. Under these conditions no trichocyst release occurs. Reliability of the superfusion approach was checked independently with fluorescein-tagged AED in the presence of 0.1 mM [Ca2+]e (Fig. 10, I–P). Since trichocyst decondensation (expansion during expulsion of contents) requires Ca2+ e (Bilinski et al., 1981), comparison of Figs. 10, A–H (+ EGTA) and 10, I–P (+ Ca2+ e) shows successful chelation of Ca2+ e. Next we have loaded cells with Fluo-3. After 2 min, each of these cells was superfused with EGTA and exposed to a local AED flush (without fluorescein). This final set of experiments, documented in Fig. 10, Q–T, clearly shows a cortical [Ca2+]i increase already recognizable within ∼100 ms with little diffusion throughout the cell. Under such conditions quenched-flow/freeze-fracture has revealed occurrence of membrane fusions.
Alveolar Sacs Are the Most Likely Structural Equivalents of Subplasmalemmal Ca2+ Pools
As shown above, the extent of trichocyst exocytosis is paralleled by the size of currents observed. Assuming alveolar sacs to be the primary source of Ca2+ for Ca2+-activated currents a hypothesis remained to be tested: the ratio of maximal versus minimal currents should reflect the ratio of total cell surface versus unit area of cell surface. These units, the kinetids, also correspond with the number of alveolar sacs which occur all over a cell. Current ratios would roughly have to reflect area ratios, even when currents were superimposed by Ca2+ influx.
To answer the problem, we established morphometric parameters for the cells used in electrophysiological recordings. Viable or cryofixed cells were analyzed by both LM and EM methods (Table I) revealing ∼3,100 surface units. For comparison, current ratios are compiled in Table II. The minimal current, i.e., the current per trichocyst discharge, as derived from extracellular recordings (Fig. 5), is 1.2 × 10⁻¹² As. Correction by a factor of 2 is required, since the current is recorded from ∼1/2 of the cell surface, i.e., the part in the holding pipette (see Materials and Methods). The corrected value of 2.4 × 10⁻¹² As is in agreement with the value obtained by intracellular voltageclamp recording, i.e., 2.5 × 10⁻¹² As. Maximal currents recorded extracellularly during maximal AED stimulation, after correction for recording area, amount to 6 × 10⁻⁹ As (Table II). The ratio of maximal to minimal currents is ∼2.5 × 10³, a value closely approaching the area ratio of 3.1 × 10³, i.e., the estimated number of cortical Ca stores per cell (Table I). This is another aspect supporting our suggestion that alveolar sacs may be the internal source of Ca2+ relevant for exocytotic membrane fusion.
Table II.
Correlation of Electrophysiological with Structural Data
| Parameters | Measurement | |
|---|---|---|
| Charge (As) | ||
| minimal values derived from | ||
| intracellular recordings* | 2.5 × 10⁻¹² | |
| extracellular recordings‡ | 2.4 × 10⁻¹² | |
| maximal value‡ § | 6 × 10⁻⁹ | |
| Factor maximal/minimal currents | 2.5 × 10³ | |
| Number of alveolar sacs/cell | 3.1 × 10³ |
Observed during spontaneous exocytosis of single trichocysts.
Corrected for area in holding pipette (see text).
Observed during maximal AED-induced trichocyst exocytosis.
Discussion
Current Flow Reflects Extent of Cell Surface Area Activated, Rather than Fusion Pore Conductance–Superposition of Ca2+ Activation from Stores by a Ca2+ Influx
Could spontaneous currents reveal fusions of single trichocysts with the cell membrane during exocytosis? From work in other secretory cells, it is known that during fusions an electric discharge occurs as soon as the fusion pore opens (Almers, 1990; Lindau, 1991). The magnitude of the current, or its charge, which depends on the potential difference between the two fusing compartments, can be recorded as a current transient preceding the stepwise increase in membrane capacitance, reflecting the increase of surface membrane, as measured by the patch clamp technique. From the current transient and the capacitance change, one can calculate the potential of the fusing vesicle.
If one applies the same considerations to Paramecium, one can compare the measured spontaneous electrical signal with that expected for a fusion event. Considering a trichocyst surface of ∼10 μm2 (estimated from electron micrographs) and assuming the usual 1 μF × cm−2 for biomembranes (Cole, 1972; Kado, 1993), a capacitance of 10−13 farad would result. From the recorded transients (e.g., in Fig. 1 B) the charge can be calculated to be ∼2.5 × 10⁻¹² As. The potential difference between the cell membrane and the trichocyst membrane thus calculated would amount to 2.5 × 10⁻¹² As/10−13 farad (25 V). However, this value is orders of magnitude above physiological values, and this excludes that the spontaneous current events we have recorded is due to the transient capacitative discharges of the fusing trichocyst membrane. This interpretation is supported by the occurrence of the same currents in the trichocyst-free mutant, tl, where spontaneous and AED-elicited currents were quite similar to those in wildtype cells (Erxleben and Plattner, 1994). Therefore, we favor the interpretation which relates current events, no matter whether spontaneous or triggered, to the activation of a variable number of alveolar sacs with a superimposed Ca2+ influx (see below).
The concomitant abolition of both Ca2+ currents and exocytosis by EGTA injection supports a causal relationship between [Ca2+]i increase and exocytotic membrane fusion (Fig. 6). Discharge of subplasmalemmal Ca stores is probably a primary response to AED triggering, mainly for two reasons. First, some Ca2+ signal and some membrane fusion occur also with [Ca2+]e ⩽ [Ca2+]i at rest. Second, rapid Ca2+ influx caused by 10 mM [Ca2+]e causes a cortical [Ca2+] transient of ⩾900 nM, but no exocytosis (see Results and below). Both largely exclude a CICR mechanism, as also suggested by 45Ca2+ release studies with isolated alveolar sacs (Länge et al., 1995) and by patch clamp analysis of reconstituted Ca2+ release channels from Paramecium (Zhou et al., 1995).
From all our observations we come to the following conclusion. With “normal” [Ca2+]e (0.1 mM), Ca2+ release from alveolar sacs is clearly accompanied by a Ca2+ influx through the cell membrane, resulting in a diffusion to the entire cell (data not shown) and increased exocytotic activity, while the signal remains locally restricted with low [Ca2+]e (Fig. 10, Q–T). Both phenomena, normally acting in concert and possibly involving site-directed Ca2+ release and/or influx, support rapid trichocyst exocytosis responses.
Relationship to Models of Ca2+ Dynamics during Triggered Exocytosis
In Paramecium, alveolar sacs have been identified as Ca pools by their Ca2+ sequestration (Stelly et al., 1991) and Ca2+ release (Länge et al., 1995) properties, both after isolation and by in situ Ca imaging methods (ESI, SIMS) (Knoll et al., 1993; Stelly et al., 1995). These organelles are connected to the cell membrane by electron-dense connections ∼15 nm long (Plattner et al., 1991). Thus, they clearly fulfill the criteria of subplasmalemmal pools.
The capacitative model of Ca2+ entry (Putney, 1986, 1990, 1993) assumes functional coupling between emptying intracellular Ca stores and Ca2+ influx. Structural coupling of Ca stores with the cell membrane has been discussed for a large number of secretory systems (Berridge, 1995), although the structural identification of such pools is still questioned. In these secretory systems however, Ca2+ release is sustained by inositol 1,4,5-trisphosphate, a second messenger for which we have no evidence in Paramecium (Länge et al., 1995; Zhou et al., 1995). Thus a capacitative model sensu strictu cannot be envisaged in our cells.
In some secretory cells, Ca2+ release has been defined as quantal (Muallem et al., 1989; Meyer and Stryer, 1990; Tregear et al., 1991; Cheek et al., 1993; Parys et al., 1993) in the sense that [Ca2+]i and, in parallel, Ca2+-dependent exocytosis is increased by increasing concentrations of secretagogues. So far, however, no strictly quantal pool mobilization could be demonstrated (Taylor and Potter, 1990; Bootman 1994a ,b). Our analyses with Paramecium have revealed in contrast a correlation between the size of Ca2+-activated currents, the extent of exocytosis achieved, and the amount of subplasmalemmal Ca stores available, with no sign of discrete current steps. This discrepancy may be caused by either the different processes of Ca2+ release from the stores, the different Ca2+ sensitivity of Ca2+-activated channels along the cell surface (Erxleben and Plattner, 1994), or by the superposition to the release of a slightly variable Ca2+ influx.
One argument for Ca2+ release as the primary event induced by AED is the relatively small current elicited by a second application (20 s later). By comparison, the ability of the electric system (i.e., the Ca2+-activated channels) to generate a second current pulse in response to increased [Ca2+]i, can be regarded as instantaneous. Since we have no evidence of an AED receptor, desensitization is a less likely explanation. Potential Ca2+ release channels recently analyzed by electrophysiology after reconstitution show pharmacological characteristics (Zhou et al., 1995) which are practically identical to those for Ca2+ release from isolated sacs (Länge et al., 1995). Although the molecular identity of the channels actually involved in Ca2+ influx during AED stimulation still has to be established, it certainly differs from those in the Paramecium ciliary membrane (Erxleben and Plattner, 1994; Plattner et al., 1994; Zhou et al., 1995). Another subject of further analysis is the significance in Paramecium of Ca2+ influx, whether it serves directly to amplify the subplasmalemmal signal (Putney, 1990, 1993; Berridge, 1995) or to refill subplasmalemmal stores during or immediately after their release.
Final Conclusions
In the Paramecium system, local Ca2+ transients are sustained by a local interplay between endogenous and exogenous sources. This combination is needed for the rapid local trichocyst exocytosis, with ensuing efficient defensive function activation within tens of milliseconds. Prerequisite to this activity is the proper assembly of surface cell components, i.e., trichocysts and subplasmalemmal Ca2+ stores, with the concomitant activation of both Ca2+ release and influx. The special design of a Paramecium cell, investigated by appropriate methods, has allowed us to reveal some features in our system which might turn out to be applicable also to higher eukaryotic cells.
Acknowledgments
We thank Jochen Deitmer for communicating some early observations to the problem, Jochen Hentschel for his help with the CLSM set-up, and Mary Anne Cahill for reading an early version of the manuscript.
Abbreviations used in this paper
- AED
aminoethyldextran
- Ca2+e
extracellular calcium
- [Ca2+]i
intracellular free Ca2+ concentration
- CaGr-2
calcium green-2
- CLSM
confocal laser scanning microscopy
Footnotes
This paper is supported by SFB156 as well as DFG grants Pl78/11 and Pl78/12, all from the Deutsche Forschungsgemeinschaft (DFG).
Please address all correspondence to H. Plattner, Faculty of Biology, University of Konstanz, P.O. Box 5560, D-78434 Konstanz, Germany. Tel.: (49) 7531-88-2228. Fax: (49) 7531-88-2245.
References
- Allen, R.D. 1988. Cytology. In Paramecium. H.D. Görtz, editor. Springer-Verlag, Berlin. 4–40.
- Almers W. Exocytosis. Annu Rev Physiol. 1990;52:607–624. doi: 10.1146/annurev.ph.52.030190.003135. [DOI] [PubMed] [Google Scholar]
- Berridge MJ. Capacitative calcium entry. Biochem J. 1995;312:1–11. doi: 10.1042/bj3120001. [DOI] [PMC free article] [PubMed] [Google Scholar]
- Bilinski M, Plattner H, Matt H. Secretory protein decondensation as a distinct, Ca2+-mediated event during the final steps of exocytosis in Parameciumcells. J Cell Biol. 1981;88:179–188. doi: 10.1083/jcb.88.1.179. [DOI] [PMC free article] [PubMed] [Google Scholar]
- Bootman MD. Questions about quantal Ca2+release. Curr Biol. 1994a;4:169–172. doi: 10.1016/s0960-9822(94)00041-2. [DOI] [PubMed] [Google Scholar]
- Bootman MD. Quantal Ca2+ release from InsP3-sensitive intracellular Ca2+stores. Mol Cell Endocrinol. 1994b;98:157–166. doi: 10.1016/0303-7207(94)90134-1. [DOI] [PubMed] [Google Scholar]
- Burgoyne RD, Morgan A. Regulated exocytosis. Biochem J. 1993;293:305–316. doi: 10.1042/bj2930305. [DOI] [PMC free article] [PubMed] [Google Scholar]
- Cheek TR, Barry VA. Stimulus–secretion coupling in excitable cells: a central role for calcium. J Exp Biol. 1993;184:179–196. doi: 10.1242/jeb.184.1.183. [DOI] [PubMed] [Google Scholar]
- Cheek TR, Moreton RB, Berridge MJ, Stauderman KA, Murawsky MM, Bootman MD. Quantal Ca2+release from caffeine-sensitive stores in adrenal chromaffin cells. J Biol Chem. 1993;268:27076–27083. [PubMed] [Google Scholar]
- Cole, K.C. 1972. Membranes, Ions and Impulses: A Chapter of Classical Biophysics. University of California Press, Berkley, CA. 569 pp.
- Erxleben C, Plattner H. Ca2+ release from subplasmalemmal stores as a primary event during exocytosis in Parameciumcells. J Cell Biol. 1994;127:935–945. doi: 10.1083/jcb.127.4.935. [DOI] [PMC free article] [PubMed] [Google Scholar]
- Haacke-Bell B, Hohenberger-Bregger R, Plattner H. Trichocysts of Paramecium: secretory organelles in search of their function. Eur J Protistol. 1990;25:289–305. doi: 10.1016/S0932-4739(11)80120-3. [DOI] [PubMed] [Google Scholar]
- Hille, B. 1992. Ionic Channels of Excitable Membranes. Sinauer Associates Inc., Sunderland, MA. 607 pp.
- Kado R. Membrane area and electrical capacitance. Methods Enzymol. 1993;221:273–299. doi: 10.1016/0076-6879(93)21024-3. [DOI] [PubMed] [Google Scholar]
- Kerboeuf D, Cohen J. A Ca2+ influx associated with exocytosis is specifically abolished in a Parameciumexocytotic mutant. J Cell Biol. 1990;111:2527–2535. doi: 10.1083/jcb.111.6.2527. [DOI] [PMC free article] [PubMed] [Google Scholar]
- Knoll G, Braun C, Plattner H. Quenched flow analysis of exocytosis in Parameciumcells: time course, changes in membrane structure, and calcium requirements revealed after rapid mixing and rapid freezing of intact cells. J Cell Biol. 1991a;113:1295–1304. doi: 10.1083/jcb.113.6.1295. [DOI] [PMC free article] [PubMed] [Google Scholar]
- Knoll G, Haacke-Bell B, Plattner H. Local trichocyst exocytosis provides an efficient escape mechanism for Parameciumcells. Eur J Protistol. 1991b;27:381–385. doi: 10.1016/S0932-4739(11)80256-7. [DOI] [PubMed] [Google Scholar]
- Knoll G, Kerboeuf D, Plattner H. A rapid calcium influx during exocytosis in Parameciumcells is followed by a rise in cyclic GMP within 1 s. FEBS (Fed Eur Biochem Soc) Lett. 1992;304:265–268. doi: 10.1016/0014-5793(92)80634-s. [DOI] [PubMed] [Google Scholar]
- Knoll G, Grässle A, Braun C, Probst W, Höhne-Zell B, Plattner H. A calcium influx is neither strictly associated with nor necessary for exocytotic membrane fusion in Parameciumcells. Cell Calcium. 1993;14:173–183. doi: 10.1016/0143-4160(93)90065-e. [DOI] [PubMed] [Google Scholar]
- Länge S, Klauke N, Plattner H. Subplasmalemmal Ca2+ stores of probable relevance for exocytosis in Paramecium.Alveolar sacs share some but not all characteristics with sarcoplasmic reticulum. Cell Calcium. 1995;17:335–344. doi: 10.1016/0143-4160(95)90107-8. [DOI] [PubMed] [Google Scholar]
- Lindau M. Time-resolved capacitance measurements: monitoring exocytosis in single cells. Q Rev Biophys. 1991;24:75–101. doi: 10.1017/s0033583500003279. [DOI] [PubMed] [Google Scholar]
- Llinás R, Sugimori M, Silver RB. Microdomains of high calcium concentration in a presynaptic terminal. Science (Wash DC) 1992;256:677–679. doi: 10.1126/science.1350109. [DOI] [PubMed] [Google Scholar]
- Meyer T, Stryer L. Transient calcium release by successive increments of inositol 1,4,5-trisphosphate. Proc Natl Acad Sci USA. 1990;87:3841–3845. doi: 10.1073/pnas.87.10.3841. [DOI] [PMC free article] [PubMed] [Google Scholar]
- Muallem S, Pandol SJ, Beeker TG. Hormone-evoked calcium release from intracellular stores is a quantal process. J Biol Chem. 1989;264:205–212. [PubMed] [Google Scholar]
- Neher E, Augustine GJ. Calcium gradients and buffers in bovine chromaffin cells. J Physiol (Lond) 1992;450:273–301. doi: 10.1113/jphysiol.1992.sp019127. [DOI] [PMC free article] [PubMed] [Google Scholar]
- Parys JB, Missiaen L, DeSmedt H, Casteels R. Loading dependence of inositol 1,4,5-trisphosphate-induced Ca2+ release in the clonal cell line A7r5. Implications for the mechanism of quantal Ca2+release. J Biol Chem. 1993;268:25206–25211. [PubMed] [Google Scholar]
- Plattner H, Matt H, Kersken H, Haacke B, Stürzl R. Synchronous exocytosis in Parameciumcells. I. A novel approach. Exp Cell Res. 1984;151:6–13. doi: 10.1016/0014-4827(84)90350-1. [DOI] [PubMed] [Google Scholar]
- Plattner H, Stürzl R, Matt H. Synchronous exocytosis in Parameciumcells. IV. Polyamino compounds as potent trigger agents for repeatable trigger-redocking cycles. Eur J Cell Biol. 1985;36:32–37. [PubMed] [Google Scholar]
- Plattner H, Lumpert CJ, Knoll G, Kissmehl R, Höhne B, Momayezi M, Glas-Albrecht R. Stimulus–secretion coupling in Parameciumcells. Eur J Cell Biol. 1991;55:3–16. [PubMed] [Google Scholar]
- Plattner H, Braun C, Klauke N, Länge S. Veratridine triggers exocytosis in Parameciumcells by activating somatic Ca channels. J Membr Biol. 1994;142:229–240. doi: 10.1007/BF00234945. [DOI] [PubMed] [Google Scholar]
- Pozzan T, Rizzuto R, Volpe P, Meldolesi J. Molecular and cellular physiology of intracellular calcium stores. Physiol Rev. 1994;74:595–636. doi: 10.1152/physrev.1994.74.3.595. [DOI] [PubMed] [Google Scholar]
- Putney JW. A model for receptor-regulated calcium entry. Cell Calcium. 1986;7:1–12. doi: 10.1016/0143-4160(86)90026-6. [DOI] [PubMed] [Google Scholar]
- Putney JW. Capacitative calcium entry revisited. Cell Calcium. 1990;11:611–624. doi: 10.1016/0143-4160(90)90016-n. [DOI] [PubMed] [Google Scholar]
- Putney JW. Excitement about calcium signaling in inexcitable cells. Science (Wash DC) 1993;262:676–678. doi: 10.1126/science.8235587. [DOI] [PubMed] [Google Scholar]
- Stelly N, Mauger JP, Kéryer G, Claret M, Adoutte A. Cortical alveoli of Paramecium: a vast submembranous calcium compartment. J Cell Biol. 1991;113:103–112. doi: 10.1083/jcb.113.1.103. [DOI] [PMC free article] [PubMed] [Google Scholar]
- Stelly N, Halpern S, Nicolas G, Fragu P, Adoutte A. Direct visualization of a vast cortical calcium compartment in Parameciumby secondary ion mass spectrometry (SIMS) microscopy: possible involvement in exocytosis. J Cell Sci. 1995;108:1895–1909. doi: 10.1242/jcs.108.5.1895. [DOI] [PubMed] [Google Scholar]
- Taylor CW, Potter BVL. The size of inositol 1,4,5-trisphosphatesensitive Ca2+stores depends on inositol 1,4,5-trisphosphate concentration. Biochem J. 1990;266:189–194. doi: 10.1042/bj2660189. [DOI] [PMC free article] [PubMed] [Google Scholar]
- Tregear RT, Dawson AP, Irvine RF. Quantal release of Ca2+ from intracellular stores by InsP3: tests of the concept of control of Ca2+release by intraluminal Ca2+ . Proc R Soc Lond B Biol Sci. 1991;243:263–268. doi: 10.1098/rspb.1991.0040. [DOI] [PubMed] [Google Scholar]
- Zhou XL, Chan CW M, Saimi Y, Kung C. Functional reconstitution of ion channels from Parameciumcortex into artificial liposomes. J Membr Biol. 1995;144:199–208. doi: 10.1007/BF00236833. [DOI] [PubMed] [Google Scholar]
- Zucker RS. Calcium and transmitter release at nerve terminals. Biochem Soc Trans. 1993;21:395–401. doi: 10.1042/bst0210395. [DOI] [PubMed] [Google Scholar]


