

Abstract
By integrating genome-wide maps of RNA polymerase II (Polr2a) binding with gene expression data and H3ac and H3K4me3 profiles, we characterized promoters with enriched activity in mouse embryonic stem cells (mES) as well as adult brain, heart, kidney, and liver. We identified ∼24,000 promoters across these samples, including 16,976 annotated mRNA 5′ ends and 5153 additional sites validating cap-analysis of gene expression (CAGE) 5′ end data. We showed that promoters with CpG islands are typically non-tissue specific, with the majority associated with Polr2a and the active chromatin modifications in nearly all the tissues examined. By contrast, the promoters without CpG islands are generally associated with Polr2a and the active chromatin marks in a tissue-dependent way. We defined 4396 tissue-specific promoters by adapting a quantitative index of tissue-specificity based on Polr2a occupancy. While there is a general correspondence between Polr2a occupancy and active chromatin modifications at the tissue-specific promoters, a subset of them appear to be persistently marked by active chromatin modifications in the absence of detectable Polr2a binding, highlighting the complexity of the functional relationship between chromatin modification and gene expression. Our results provide a resource for exploring promoter Polr2a binding and epigenetic states across pluripotent and differentiated cell types in mammals.
Over 200 different cell types underscore the functional complexity of mammals (Alberts et al. 2002). In turn, the complement of genes expressed in each cell type specifies its unique functions (Okazaki et al. 2002; Su et al. 2002, 2004; Sharov et al. 2003; Zhang et al. 2005). Throughout the genome, regulatory sequences such as promoters, enhancers, and insulators control gene expression by interacting with specific transcription factors, many of which exert their effect by modulating the local chromatin modification states (Lee et al. 2004; Guillemette et al. 2005; Mito et al. 2005; Pokholok et al. 2005; Raisner et al. 2005; Yuan et al. 2005; Zhang et al. 2005; Heintzman et al. 2007). Thus, unbiased genome-wide profiles of transcription factor binding and chromatin modifications at these regulatory sequences, across a panel of mammalian cell types, are expected to provide insights into the regulatory mechanisms of tissue-specific gene expression (Levine and Tjian 2003).
Previously, large-scale efforts to understand mammalian tissue-specific expression have been devoted to the investigation of transcript expression patterns across cell and tissue types. Microarray-based technologies and high-throughput sequencing methods have been used to determine steady-state mRNA levels of genes in a compendium of cell and tissue types under normal or pathological conditions (Okazaki et al. 2002; Su et al. 2002, 2004; Sharov et al. 2003; Zhang et al. 2004). These data sets have been valuable for understanding the tissue-specific gene expression programs and provide a rich source of information for defining common transcription factor motifs that may underlie tissue-specific patterns of expression (Wasserman and Fickett 1998; Wasserman et al. 2000; Smith et al. 2005, 2006, 2007; Xie et al. 2005; Xuan et al. 2005). Recently, advances in the sequencing of transcript 5′ ends have also expanded the annotation of mammalian promoters in different mammalian tissues and provided references of potential transcriptional start sites for most mammalian genes (Carninci et al. 2005, 2006; Kimura et al. 2006). These recent studies have revealed a large spectrum of transcripts for each gene generated by extensive usage of alternative promoters, alternative splicing, and alternative polyadenylation sites. The extent of alternative promoter usage and the identification of transcription factor motifs suggest the key role of promoters in contributing to the control of gene expression leading to mammalian cell-type diversity.
While measuring the abundance and defining the 5′ ends of RNA transcripts are crucial for the understanding of mechanisms that drive tissue-specific gene expression programs, such information is not sufficient to resolve the complex mechanisms of gene regulation. For example, we and others have recently shown that a significant number of promoters are in a poised state of transcription—they are bound by the general transcription machinery but do not have detectable transcription activities in steady-state cells (Kim et al. 2005b; Guenther et al. 2007). To this end, it is necessary to directly analyze transcription factor loading and chromatin structures at promoters. As a first step toward understanding the gene regulatory mechanisms in mammalian cells, we now directly identify active promoters by unbiased mapping of the RNA polymerase II pre-initiation complex (PIC) in the mouse genome across a panel of mouse organs—brain, heart, kidney, liver—and mouse embryonic stem cells (hereafter collectively referred to as “tissues”). In addition, we profiled two active chromatin modifications (H3ac and H3K4me3) at each identified promoter and tracked the corresponding gene transcript levels. By examining these complementary data sets across the tissues surveyed, we identified a complex relationship among chromatin modifications, Polr2a occupancy, and tissue-specific gene expression. The majority of CpG island containing promoters are associated with Polr2a and the active chromatin marks, regardless of tissue type. By contrast, non-CpG island promoters are typically associated with the active chromatin marks and occupied by Polr2a in a tissue-restricted manner. We developed a quantitative measure of promoter tissue-specificity based on Polr2a binding that defined 4296 tissue-specific promoters. Detailed motif analysis of the tissue-specific promoters and functional annotation of corresponding genes showed an enrichment of known tissue-specific transcription factors and functional groups in these tissue-specific promoters. Interestingly, comparisons of H3K4me3 and H3ac profiles across tissues for these tissue-specific promoters showed unexpected patterns of enrichment of these marks in adult tissues for promoters with enriched activity in ES cells. These results suggest the importance of characterizing epigenetic profiles in addition to motif analysis in cataloguing the regulatory sequences, which contribute to mammalian cell-type diversity.
Results
Genome-wide mapping of PIC-binding sites in mouse mES cells and adult organs
We adapted the strategy we previously used to map active promoters in human fibroblast cells (Fig. 1; Kim et al. 2005b). Specifically, we used a monoclonal antibody (8WG16) specific for the hypo-phosphorylated RNA polymerase II CTD to map PIC binding at active promoters in mouse brain, heart, kidney, and liver, as well as R1 ES cells using chromatin immunoprecipitation with microarrays (ChIP-chip) (Cheng and Sharp 2003; Kim and Ren 2006; Saunders et al. 2006). For each tissue, we performed Polr2a ChIP-chip using a set of 37 microarrays, containing a total of 14.3 million 50-mer oligonucleotides, tiling the non-repetitive sequence of the mouse genome at 100 base-pair (bp) resolution. The results from the genome-wide survey of Polr2a binding led to the identification of a total of 32,482 Polr2a binding sites. We then designed a set of four microarrays containing 1.4 million oligonucleotides to cover each site extended by 2 kbp upstream and downstream, and repeated independent Polr2a ChIP-chip for each tissue to confirm Polr2a binding (condensed scan). To define confirmed sites of Polr2a binding, we applied our previously described peak finding strategy on the condensed scan ChIP-chip and genome-scan ChIP-chip for each tissue (Kim et al. 2005b; Zheng et al. 2005). We required that a peak of Polr2a binding predicted in the condensed scan is within 500 bp of a peak predicted in the genome scan (Fig. 1; Supplemental Materials).
Figure 1.

Schematic of genome-wide promoter mapping strategy by ChIP-chip.
Using the procedure summarized in Figure 1, we defined a total of 24,363 high-confidence, non-overlapping Polr2a binding sites in the mouse genome across five tissues (Supplemental Table 1). Each of these sites has confirmed binding based on the genome scan and condensed scan for at least one tissue. These binding sites range in size from 50 bp to 18 kbp. By assaying Polr2a enrichment by ChIP with quantitative PCR (ChIP-qPCR) at 27 randomly selected gene promoters in mES cells, we estimated 70% sensitivity and 100% specificity for our method of defining Polr2a binding sites by ChIP-chip in each tissue (Supplemental Fig. S1). Additionally, we estimated a 100% positive predictive value (PPV) by ChIP-qPCR validation of 24 randomly selected Polr2a ChIP-chip bound sites in liver (Supplemental Fig. S2).
Since the hypophosphorylated form of Polr2a is expected to localize over transcription initiation sites in the genome (Cheng and Sharp 2003; Brodsky et al. 2005; Kim et al. 2005a), we compared the location of these binding regions with annotated mRNA transcript start sites (TSS) downloaded from the UCSC Genome Browser (MM5; refGene, knownGene, ensGene, and all_mrna) (Hinrichs et al. 2006); 16,976 (69%) of these sites mapped within 2.5 kbp of 66,559 distinct TSS based on RefSeq, Ensembl, UCSC knownGene, or GenBank annotation. These transcripts in turn correspond to 11,000 out of ∼24,000 mouse genes based on Entrez Gene annotation (Maglott et al. 2005). Of the remaining unmatched sites within and outside of known gene loci, 5153 mapped within 2.5 kbp of TSS based on 5′ cap analysis of gene-expression (CAGE) sequencing from a panel of 145 mouse cDNA libraries (Shiraki et al. 2003; Carninci et al. 2005). Taken together, these two lines of evidence provide independent support that 91% of these Polr2a binding regions correspond to known transcription initiation sites (Table 1).
Table 1.
Summary of Polr2a binding across tissues

Polr2a binding sites denote the number of sites associated with each tissue after merging the sites across tissues to define a total of 24,363 binding sites across tissues. Percent near TSS or CAGE is defined as being within 2.5 kbp of the 5′ end of the transcript or of the boundaries of the CAGE cluster.
The distance distribution of Polr2a binding sites to matching TSS clearly supports the accuracy of our method in defining known transcription initiation sites (Supplemental Fig. S3). In addition, the number of promoters relative to the number of genes suggests the prevalence of alternative promoter usage. For instance, a recent RNA interference study defined estrogen receptor beta (Esrrb) as one of seven genes that are critical for embryonic stem cell renewal in vitro (Ivanova et al. 2006). We identified two tissue-specific promoters for this gene; one has enriched Polr2a binding in mES, while the other shows enriched binding in kidney (Fig. 2). We estimate that 28% of genes with Polr2a binding utilize two or more alternative promoters across the five tissues. This estimate is half of the previous estimate in mammalian genomes and may be due to the limited number of tissues surveyed as well as the more limited resolution of transcription initiation sites based on Polr2a binding compared with the base-pair resolution of 5′ end sequencing methods (Carninci et al. 2006; Kimura et al. 2006).
Figure 2.

Polr2a binding profiles reveal alternative promoters usage across tissues. (A) ChIP-chip profiles for Polr2a spanning two alternative promoters for the Crmp1 gene. Each bar represents Polr2a ChIP-chip log2 ratio corresponding to a 50-bp probe. These probes are distributed along the genomic regions at 100-bp end-to-end spacing. (B) Similar Polr2a binding profile for the two alternative promoters of the Esrrb gene.
Additionally, in characterizing the genomic distribution of the CAGE-matched sites, we validate estimates of exonic transcription initiation activity based on CAGE data (Carninci et al. 2006). The majority (62%) of the CAGE-matched sites resides within known gene boundaries (exonic and intronic) (Supplemental Figs. S3, S4). A substantial fraction is tissue-specific (37%), and the prevalence of these sites underscores the role of transcription initiation, along with splicing, in defining the complexity of transcript populations even from within known gene loci. A previous study based on CAGE tag frequency has correlated this exonic promoter activity with tissue-specific genes (Carninci et al. 2006).
By examining the co-localization of H3K4me3, an epigenetic mark associated with 5′ ends of active genes from yeast to human (Pokholok et al. 2005; Heintzman et al. 2007), we predict 382 sites not near known TSS or CAGE tag clusters as putative promoters. This fraction (1.6%) of our catalog suggests that only a small number of transcription initiation sites are still missed by extensive 5′ end sequencing efforts to annotate the mouse transcriptome (Supplemental Fig. S3). A large fraction (37%) of these putative promoters appears to be tissue specific. These putative promoters are primarily from mES (67%) and kidney (18%). Further investigations are necessary to determine the matching transcripts for these uncharacterized promoters.
Assessing promoter Polr2a occupancy across different tissues
In order to characterize the relative Poll II occupancy at each promoter across a number of tissues, we used the Polr2a ChIP-chip log2ratio enrichment and defined an index of tissue activity for each promoter by adapting a Shannon entropy previously applied to microarray gene expression and EST data (Schug et al. 2005). We defined the relative Polr2a binding in a tissue t for a given site s as pt/s = Bt,s/∑1≤t≤NBt,s, where Bt,s is the average ChIP-chip log2ratio in the 1-kbp neighborhood centered at the midpoint of Polr2a binding site s, and N is the total number of tissues surveyed. The entropy of a site’s Polr2a binding distribution across tissues is then defined as Hs = −∑1≤t≤Npt/s log2pt/s. The measure Hs has units of bits, and, as in its use with expression data, the value of Hs ranges from zero for genes bound by Polr2a in a single tissue to log2(N) for sites bound uniformly in all tissues surveyed. We also adapted the companion measure of “categorical tissue-specificity” to characterize the bias of a Polr2a binding site for a particular tissue defined as Qs/t = Hs − log2(pt/s). This index also has units of bits and as before has a minimum of zero when a site is bound by Polr2a predominantly in the tissue and grows without bound as the relative binding of Polr2a in that tissue goes to zero.
We used these measures of entropy and categorical tissue-specificity to assess the usage of all Polr2a binding sites across tissues. When applied to sites not matched to known mRNAs but near known microRNAs (miRNAs), 10 of 19 matched miRNAs were classified as tissue-specific. Recent studies have provided evidence that miRNAs play a pivotal role in defining tissue- and cellspecific expression patterns (Table 2; Ambros 2004; Lim et al. 2005). Indeed, seven of the 10 promoters we defined as tissue-specific for the miRNA were cloned from the corresponding tissue source or the closely related tissue source, in the case of mES and testis (Griffiths-Jones et al. 2006). Two of these tissue-specific miRNAs have been shown to down-regulate a large number of mRNAs in human: miR-124 transfection in HeLa cells shifted the expression profile toward that of brain, while miR-1 shifted the expression profile of HeLa cells toward heart and skeletal muscles (Lim et al. 2005).
Table 2.
MicroRNAs matched to Polr2a binding across tissues.

Genomic location is given based on the Polr2a binding site. Starred are microRNAs we found enriched in the same or related cell type as the cloning source.
Overall, the majority of transcript-matched promoters have ubiquitous activity (H ≥ 2) by the Polr2a binding entropy across the tissues surveyed (Fig. 3). As expected, the promoters uniformly bound by Polr2a overlap significantly with CpG islands compared to promoters with Polr2a binding enriched in specific tissues (Gardiner-Garden and Frommer 1987; Cross and Bird 1995; Schug et al. 2005; Carninci et al. 2006). Tissue-specific promoters defined by a low entropy measure (H ≤ 1) have a fivefold decrease in CpG island overlap (15%) compared with promoters with a high entropy measure (H ≥ 2) associated with ubiquitous activity (75%). Profiling of Polr2a and active chromatin modifications at CpG versus non-CpG island promoters suggests that nearly all promoters overlapping CpG islands have some H3K4me3 across tissues even when Polr2a binding and H3ac appears weak (Fig. 4A). ChIP-qPCR of Polr2a and H3K4me3 enrichment at five randomly selected promoters with variable Polr2a occupancy supports this observation (Supplemental Fig. S5). By contrast, most non-CpG island promoters are associated with the active chromatin marks and Polr2a in a tissue-restricted manner (Fig. 4B). This result suggests that CpG-island promoters and non-CpG island promoter likely employ distinct mechanisms in their regulation.
Figure 3.

Quantitative index of tissue-specific Polr2a occupancy reveals an inverse relationship between CpG islands and tissue-specific promoter activity. Distribution of known promoters is plotted across a range of tissue-specificity, as measured by Shannon entropy (H) defined based on Polr2a ChIP-chip profiles (see Methods). On the primary Y-axis (left), promoter counts across the different bins (bin size = 0.2 bits) for the range of tissue-specificity values (H), H ∈ [0, log2(N)] are shown. Low values of H indicate tissue-specific expression and the maximal value denotes uniform expression across tissues surveyed. The second axis (right) shows the fraction of promoters within each bin overlapping CpG Islands (dashed line).
Figure 4.

Polr2a binding and chromatin modification states at CpG and non-CpG island promoters across different mouse tissues. (A) ChIP-chip profiles of Polr2a, H3Ac, and H3K4me3 are shown in pseudocolors for CpG island promoters (n = 8374). Each row is the concatenation of the log2-transformed enrichment ratio over a 4-kbp window for Polr2a, H3ac, and H3K4me3 in brain, heart, kidney, liver, and mES. The yellow color indicates high enrichment ratios, while the black indicates no enrichment. The window is centered on the peak of Polr2a binding for the known CpG island promoter identified in these tissues. Rows are grouped according to the tissue with the highest relative Polr2a binding and ordered within each tissue according to the Polr2a entropy score or H (right bar). (B) ChIP-chip profiles of Polr2a, H3Ac, and H3K4me3 are shown for non-CpG island promoters (n = 8602). Note that subtle enrichments of H3ac and H3K4me3 revealed by these promoter profiles across tissues are not likely to be called “present” by typical ChIP-chip analysis methods.
Tissue-specific Polr2a binding and expression
To further characterize the relationships among promoter Polr2a binding, active chromatin modifications, and transcript levels, we focused the remainder of our analysis on 9% of the gene promoters (937) with Polr2a binding enriched in a specific tissue and profiled the Polr2a, H3ac, and H3K4me3 ChIP-chip log2ratios 2 kbp upstream of and downstream from a reference start site. To initially validate our classification, we also assessed the normalized expression signal across tissues (Fig. 5).
Figure 5.

Complex relationship between Polr2a occupancy and active chromatin modifications at the tissue-specific promoters. (A) Polr2a occupancy and chromatin modification profiles at brain, heart, kidney, or liver specific promoters are shown in black–yellow pseudocolors. Each row in the left panel is the concatenation of the ChIP-chip log2 ratio profile over a 4-kbp window for Polr2a, H3ac, and H3K4me3 in the corresponding tissue. The window is centered on the peak of Polr2a binding for the tissue-specific promoter. Along the same row for each promoter, the expression levels of the corresponding transcript across the same tissues is shown in red–green pseudocolors in the adjacent panel (middle panel). In addition, the corresponding transcript levels in the 61 tissues profiled in the GNF SymAtlas are also shown (right panel). Rows are grouped according to the tissue-specific classification (brain, heart, kidney, or liver) of the promoter based on Polr2a binding. (B) Polr2a binding, chromatin modifications, and expression profiles are shown for mES-specific promoters. Note that two classes of mES-specific promoters can be seen with distinct chromatin modification profiles in adult tissues. While both classes are characterized by ES-specific gene-expression profiles (middle and right panel), the chromatin modification states of these promoters are different in adult tissues.
The panels in Figure 5 illustrate that tissue-enriched Polr2a binding correlate as expected with higher gene expression levels in that tissue relative to other tissues, not just based on our expression array data but also from a compendium of expression data from 61 mouse tissues (Su et al. 2002, 2004). To quantitatively measure this correlation, we created ranked lists of all genes for each tissue ordered by their categorical tissue-specificity based on our expression data (Schug et al. 2005). We then assessed the enrichment of each set of genes defined as tissue-specific based on Polr2a binding at the top of the ranked list for each tissue based on categorical tissue-specific expression. Not surprisingly, the measures of categorical tissue-specificity using binding and expression data correlate significantly (Supplemental Table S2). We highlight the top 10 tissue-specific genes defined by expression within each set of genes defined as tissue-specific based on Polr2a binding (Supplemental Fig. S6). Among these genes are those known to be highly specific and highly expressed in heart, such as cardiac myosin (Myl2) and actin (Actc1), as well as mES-enriched genes reported to be characteristic of stem cells, such as Tdgf1, Zfp42, Nanog, and Pou5f1.
Comparison of genes defined as tissue-specific based on binding and expression allows the identification of a high-confidence set of genes with tissue-enriched activity. Conversely, examining the genes defined as tissue-specific by Polr2a binding but not supported by expression data can be useful in identifying possible misassignment of Polr2a binding to a gene based on the nearest 5′ end assumption or the transcript to gene mapping annotation. Alternatively, this minority might represent tissue-specific promoters for genes which might be regulated at steps beyond initiation (Ambros 2004; Saunders et al. 2006). For instance, two genes with enriched Polr2a binding and histone modifications at their promoter region have no enrichment in mES based on our expression profiling data: 4930511H11Rik appears to be more highly expressed, albeit in low levels in adult tissues, while Tmcc3 is called absent across the tissues we surveyed. Based on the GNF expression atlas, 4930511H11Rik appears to be selectively expressed in testis, while Tmcc3 is selectively expressed in the oocyte and fertilized egg (Supplemental Fig. S7).
Tissue-specific Polr2a binding and chromatin modifications
Across tissues, tissue-specific Polr2a enrichment matches the enrichment of epigenetic marks generally associated with transcriptional activity (Fig. 5). In mES, however, genes with specific Polr2a binding can be further partitioned into two major classes. For example, in the first category (mES c1), Polr2a and histone modifications are enriched only in mES and not detectable by ChIP-chip in other tissues as shown for the Lin28 gene (Fig. 6A). The second category (mES c2) shows that, although there is preferential Polr2a binding and gene expression in mES, other tissues have detectable histone modifications over the promoter region of the gene as shown for Dnmt3b (Fig. 6B).
Figure 6.

Two examples of mES c1 and mES c2 promoters. (A) Polr2a and H3K4me3 ChIP-chip enrichment across tissues over the Lin28 promoter is shown in a bar graph. The 5′ end position (arrow) and relative gene orientation indicated by transcript schematic at the bottom. Each vertical bar represents the ChIP-chip log2 ratio for the corresponding 50-bp probe. (B) Similar promoter profile for Dnmt3b. (C) Relative expression of Lin28 across the tissues surveyed based on normalized log10 signals from Affymetrix expression profiling. Expression enrichment from low to high is represented by color gradient from green to black to red. (D) Relative expression for Dnmt3b. (E) Lin28 expression across a panel of cell types in the GNF expression atlas (copyright GNF). Each horizontal bar is the normalized signal for the tissue listed along the Y-axis. (F) Dnmt3b expression across a panel of cell types in the GNF expression atlas (copyright GNF).
ChIP with quantitative PCR (qPCR) for Polr2a, H3K4me3, and H3ac at four genes from each mES category confirm the Polr2a enrichment at these promoters specific to mES. We also verify the partitioning of these two categories by the relative enrichment of histone modifications, in particular of H3K4me3, in adult tissues for mES c2 (Fig. 7). Polr2a binding enrichment is at least fivefold greater in mES compared to all other tissues for each gene promoter in both c1 and c2 (Fig. 7A). Relative enrichment of H3ac in adult tissues for promoters in c2 is lower than in mES, but this detection in adult tissues is notable relative to promoters in c1 and the control (Fig. 7B). H3K4me3 enrichment is clearly comparable between adult tissues and mES at mES c2 promoters except for the Sox2 promoter (Fig. 7C).
Figure 7.

Validation of mES c1 and c2 promoter classification using ChIP with quantitative PCR. (A) ChIP-qPCR fold difference for Polr2a ChIP DNA relative to input DNA is shown in (Z-axis) for the mES c2 promoters (Y-axis, red), mES c1 promoters (Y-axis, black), and an intergenic control (Y-axis, blue) across the various tissues (X-axis). Similar graphs for (B) H3ac and (C) H3K4me3.
To examine the extent that H3K4me3 generally occurs without Polr2a enrichment at promoters, we performed individual H3K4me3 ChIP-chip for brain, heart, kidney, and liver using an array covering a nearly 60-Mbp stretch of chromosome 11. Since chromatin modification data do not conform to the peak-finding model assumptions, we used an adaptive promoter-focused hit calling strategy to define both Polr2a and H3K4me3 enrichment at these promoters (Supplemental Methods). From this analysis, 20%–38% of the promoters enriched with H3K4me in adult tissues have no detectable Polr2a binding (Table 3). This suggests that the observation of H3K4me3 enrichment at promoters without detectable Polr2a binding for mES c2 promoters in adult tissues may be a special case of a more general phenomenon.
Table 3.
Comparative summary of Polr2a and H3K4me3 promoter enrichment calls for Chr11.

Functional annotation of tissue-specific genes
To compare our grouping of genes based on tissue-enriched Polr2a promoter binding with existing functional annotation, we determined the enriched GO biological process (GO-BP) categories in each group (Zhang et al. 2004; Gene Ontology Consortium 2006). We found that the most enriched GO-BP categories correspond to the known physiological roles of the tissue and cell type (Supplemental Table S3). In mES, we observed that the two classes of gene promoters have a subtle difference in the ranking of the most enriched GO-BP categories. The mES c2 class is most enriched in genes related to cell cycle and cell division, while mES c1 is most enriched in genes related to cell proliferation and pattern specification. Among the genes in mES c2 are those which may not have restricted expression in mES but clearly enriched activity such as a host of cell-cycle–related genes (Ube2c, Sgol2, Bub1, Bub1b, Aurkb, Cdc2a, Cdca2, Cdca7, Cdc25c) and DNA replication genes (Mcm3, Mcm8). Among genes in mES c2 with reported roles in development are Gli zinc finger transcription factors (Gli1, Gli2, Zic3) activated through the Sonic hedgehog (Shh) signal-transduction pathway as well as a hedgehog receptor gene, Ptch2 (Ruiz i Altaba et al. 2002). Gli1 and Gli2—both of which mediate Hh signals—have been implicated in tumorigenesis and are reported to be found among precursor cells in adult tissues (Ruiz i Altaba et al. 2002). Additionally, the lymphoid enhancer factor 1 (Lef1) gene, which mediates the effects of the Wnt signaling pathway, belongs in this class (Reya and Clevers 2005).
Among the mES c1 genes, we find the majority of genes that have known roles in stem-cell renewal and pluripotency such as Pou5f1 and Nanog (Boyer et al. 2005; Loh et al. 2006), as well as additional stem-cell markers such as Dppa4, Nr0b1, Utf1, Tdgf1, and Zfp42 (Wei et al. 2005; Niakan et al. 2006). We also define previously identified ES-enriched genes in the TGF-β signaling pathway such as Lefty1, Lefty2, and Nodal (Besser 2004; Wei et al. 2005) as well as fibroblast growth factors such as Fgf4, Fgf15, and Fgf17. Among these FGFs, Fgf4 has a reported role in trophoblast stem-cell proliferation (Tanaka et al. 1998). Because the comparison of Polr2a binding in mES is relative to adult tissues, genes with reported roles in development were also found in mES c1. These may not necessarily be ES-specific transcription factors but may have poised promoters marked by Polr2a binding and H3K4me3 or basal transcriptional activity (Bernstein et al. 2006). Gbx2 has reported roles in nervous system development (Joyner et al. 2000); Pitx2, heart development (Kioussi et al. 2002); and Six6os, eye development (Alfano et al. 2005).
Sequence motifs at tissue-specific promoters
Nearly half (45%) of the promoters in mES c2 overlap CpG islands. This proportion is more than twofold higher than the overlap of promoters in mES c1 with CpG islands (20%). Among the adult tissues, brain appears to have the largest overlap (24%) between tissue-specific gene promoters and CpG islands compared with heart (10%), kidney (14%), and liver (9%). This is in agreement with a previous observation that, among transcripts with specific expression patterns, promoters associated with the central nervous system were exceptionally CpG-rich (Carninci et al. 2006).
In order to define discriminating sequence motifs within each tissue-specific promoter set, we used two complementary motif-finding strategies. The first strategy measures motif enrichment in each tissue-promoter set relative to a background set based on a balanced error measure which equally weighs a motif’s ability to identify promoters in the set (sensitivity) and to correctly discriminate against promoters not in the set (specificity) (Smith et al. 2005, 2006, 2007). Using this strategy, we characterized the enrichment of known vertebrate motifs from TRANSFAC (Matys et al. 2006) and JASPAR (Sandelin et al. 2004) in each tissue-specific promoter set relative to two types of background promoter sets: (1) a random set of mouse promoters from CSHLMPD (Xuan et al. 2005), and (2) the relative complement of the tissue-specific promoter set in the set of all tissue-specific promoters (Table 4). To identify novel motifs in each tissue-specific promoter set, we used a previously described de novo motif finder, DME (Smith et al. 2005, 2006, 2007). We evaluated the significance of these novel motifs using the same misclassification metric and report the novel motifs for each set (Table 4). To complement this strategy, we also used relative overrepresentation of conserved occurrences to define characteristic motifs for each tissue set. By these methods, we identified binding sites for transcription factors with previously reported roles in the specific tissue or cell type, as well as others whose roles remain unclear or whose binding domains appear similar to those of transcription factors with reported roles in that tissue (Table 4).
Table 4.
Summary of known and novel motifs identified in each tissue using a relative conservation metric and a balanced misclassification metric

Significant motifs identified using the relative conservation metric are based on a P value threshold which takes into account the number of motifs and tissues tested (P value cutoff < 1/(motifs × tissues)). Error-rate P values do not require multiple testing adjustment and are filtered at P < 0.05.
Discussion
One of the first steps toward a comprehensive understanding of the mechanisms of cell diversity is to define and profile the active promoters in different cell types. Here we describe an integrated approach for profiling the epigenetic and sequence features of active promoters in mouse embryonic stem cells and four adult organs. We defined 24,363 Pol II binding sites that include 16,976 annotated 5′ ends of known transcripts and 5153 TSS previously supported by CAGE evidence alone. We confirmed widespread usage of alternative promoters by mammalian genes, and identified over four thousand promoters as tissue-specific. These tissue-specific promoters led to the identification of transcription factor motifs for genes with tissue-specific expression. Our results also reveal complex relationships among Polr 2a binding, chromatin modifications, and gene expression in different tissues. We showed that most CpG island promoters are associated with Polr2a and active chromatin marks in nearly all the tissues, but non-CpG island promoters are accompanied with the active chromatin marks and Polr2a in a highly tissue-restricted manner. For most tissue-specific promoters, there is a general correspondence between Polr2a binding and presence of active chromatin marks at the promoters. However, a subset of ES cell gene promoters are persistently marked by active chromatin modifications even in the absence of detectable Polr2a binding in adult tissues. Therefore, distinct mechanisms of gene regulation appear to be involved in CpG and non-CpG promoters and at different classes of tissue specific promoters.
To characterize the tissue-specificity of factor binding by ChIP-chip at promoters, we adapted a quantitative index based on Shannon entropy (Schug et al. 2005). This strategy overcomes some of the limitations associated with ChIP-chip technology. The current emphasis on “bound” versus “unbound” sites in ChIP-chip analysis sacrifices sensitivity for specificity in defining sites associated with a particular factor. This naïve binary classification becomes especially problematic, however, when comparing factor occupancy at genomic sites across cell types or conditions. Further development of quantitative measures of relative ChIP-enrichment for a factor’s genomic localization across samples or conditions will be critical in circumventing these issues.
We used two complementary approaches—classification and conservation—to define the sequence motifs associated with tissue-specific promoters based on our entropy measure. Although we identified known motifs previously associated with these tissue-specific promoters, none of the novel motifs defined based on classification ability was significantly enriched based on the strict conservation metric. In particular, conservation did not support the novel motif, which was the only motif identified in mES c1. In general, promoters with mES-enriched activity were characterized by a dearth of significant motifs, known and novel, relative to adult tissues. Although our limited motif results in mES cells may reflect the bias of existing motif databases and the limitations of our motif-analyses strategies, we posit that long-range or distal regulatory elements might play a more critical role in regulating the expression of enriched transcripts in ES cells.
Although in general there are close associations among Polr2a binding, histone modifications, and transcript levels at most tissue-specific promoters, we showed H3K4me3 enrichment at a substantial fraction of promoters with weak to undetectable Polr2a occupancy in adult tissues. This trend is striking for roughly half of the promoters defined as mES-specific based on Polr2a binding and gene expression (mES c2). These promoters with enriched activity in mES remain epigenetically marked by H3ac and H3K4me3 in adult tissues even without detectable Polr2a binding. Modifications associated with transcriptional activity, in particular H3K4me3, have been suggested to play additional roles as markers of recent transcription or poised activation at promoters, directly or indirectly inhibiting other forms of chromatin-mediated repression (Kouskouti and Talianidis 2005; Bernstein et al. 2006; Roh et al. 2006; Ruthenburg et al. 2007; Weber et al. 2007). Subtle differences in the known function and identity of genes between the two mES classes reveal more known mouse embryonic stem-cell markers within mES c1 (Nanog, Pouf51, Dppa4, Nr0b1, Utf1, Tdgf1). Promoters in mES c2 might be associated with a unique set of genes, such as the Gli zinc finger transcription factors, expressed at low levels, or in a small subset of cell types, within adult tissues (Ruiz i Altaba et al. 2002). The mES c2 category, relative to its complement among promoters with mES enriched activity, is distinguished by a twofold higher overlap with CpG islands (45%). This sequence distinction might provide a clue to understanding this class and its regulation (Roh et al. 2006; Weber et al. 2007). Further work is underway to more precisely characterize this phenomenon and its extent.
Our approach toward understanding tissue-specific gene expression integrates Polr2a binding, chromatin modifications, and sequence features of promoters with measurements of relative transcript abundance. The genomic maps of Polr2a binding and chromatin modifications will be valuable resources that complement profiles of transcript levels and abundance for unraveling the layers of control governing gene expression patterns across cell types. Mapping these features at additional cell types at various developmental stages will likely provide further insight as to how cell-specific programs of expression are specified by sequence and epigenetic features across development.
Methods
Sample preparation
R1 ES cells (a gift from Dr. Don Cleveland, Ludwig Institute for Cancer Research, San Diego) were maintained on top of feeder cells in a cell culture dish with DMEM high-glucose medium supplemented with 15% FBS, 0.1 mM nonessential amino acid, 1 mM sodium pyruvate, 1 μM β-mercaptoethanol, 2 mM l-glutamine, 50 g/mL pen/strep, and LIF. Cells were passed once on 0.1% gelatin without feeder cells before being harvested. Cells were harvested and cross-linked with 1% formaldehyde for 20 min when they reached ∼80% confluence on the plates. Mouse tissues were dissected from a female BL6 mouse at 10–12 wk, chopped into small pieces (∼1 mm3) with a razor blade in cold 1× PBS, and cross-linked with 1% formaldehyde for 30 min at room temperature. All samples were then sonicated according to previously described protocols (Li et al. 2003).
Chromatin immunoprecipitation with microarrays (ChIP-chip)
Chromatin immunoprecipitation was performed as previously described (Li et al. 2003). Briefly, 2 mg of sonicated chromatin (OD260) was incubated with 10 μg of antibody (anti-RNA polymerase II, MMS-126R, Covance; anti-AcH3, 06-599, Upstate; anti-Me3H3K4, 07-473, Upstate) coupled to the IgG magnetic beads (Dynal Biotech). The magnetic beads were washed eight times with RIPA buffer (50 mM HEPES at pH 8.0, 1 mM EDTA, 1% NP-40, 0.7% DOC, and 0.5 M LiCl, supplemented with Complete protease inhibitors from Roche Applied Science), and washed once with TE (10 mM Tris at pH 8.0, 1 mM EDTA). After washing, the bound DNA was eluted at 65°C in elution buffer (10 mM Tris at pH 8.0, 1 mM EDTA, and 1% SDS). The eluted DNA was incubated at 65°C overnight to reverse the cross-links. Following incubation, the immunoprecipitated DNA was treated sequentially with Proteinase K and RNase A and was then desalted using the QIAquick PCR purification kit (Qiagen). The purified DNA was blunt ended using T4 polymerase (New England Biolabs) and ligated to the linkers (oJW102, 5′-GCGGTGACCCGGGAGATCT GAATTC-3′, and oJW103, 5′-GAATTCAGATC-3′). The ligated DNA was subjected to ligation-mediated PCR, labeled with Cy3 and Cy5 dCTP using a BioPrime DNA labeling kit (Invitrogen), and hybridized to the mouse genome tiling microarray.
The 37 genome-scan tiling array set containing 14.3 50-mer oligonucleotides, positioned at every 100 bp were designed and fabricated using the maskless array synthesis technology (MAS) by NimbleGen Systems. These arrays were designed to contain all the non-repetitive sequences throughout the mouse genome (NCBIv33, mm5).
Initial identification of Polr2a binding sites in five tissues
After scanning and image extraction, Cy5 (ChIP DNA) and Cy3 (input) signal values for each of the 37 genome tiling arrays were normalized by intensity-dependent Loess using the R package limma (Gentleman et al. 2004; Smyth 2005). Median filtering (window size=3 probes) was used to smooth log2 (Cy5/Cy3) data across the tiled regions. For each array, ChIP-enriched probe clusters were defined as regions with a minimum of four probes separated by a maximum of 500 bp with filtered log2R greater than 2.5 standard deviations from the mean log ratio, as used in our previous study of TAF1 binding in the human genome (Kim et al. 2005b).
The application of the analysis above for each genome-scan tiling set corresponding to Polr2a ChIP-chip for each tissue resulted in five sets (brain, heart, kidney, liver, embryonic stem cells) of putative Polr2a binding regions in the mouse.
Condensed array ChIP-chip
We designed a condensed array by combining the five sets of putative Polr2a binding regions from the five Polr2a genome-wide scans. Each binding region was extended by 2000 bp upstream and downstream and overlapping regions from the Polr2a ChIP-chip of different tissues were merged to yield a set of 32,482 putative Polr2a binding regions for condensed array design. NimbleGen Systems used the same probe designs from the genome-scan tiling set overlapping the 32,482 regions to synthesize the condensed scan array set containing 1.5 million probes in four arrays.
We performed 15 ChIP-chip experiments over the condensed array design for three factors (Polr2a, H3ac, H3K4me3) across five mouse tissues. After scanning and image extraction, Cy5 (ChIP DNA) and Cy3 (input) signal values for each of the four condensed-scan tiling arrays (in each set) were normalized by applying either intensity-dependent Loess or median-scaling normalization with the correction based only on the intensities of 14,572 control probes (designated RANDOM_GC11_GC34). The R package limma was used to implement the normalization (Gentleman et al. 2004; Smyth 2005).
Final catalog of Polr2a binding sites
To define a final catalog of Polr2a binding sites we applied an improved version of the peakfinding algorithm which we previously used to define Taf1 binding in human IMR90 cells (Kim et al. 2005b; Zheng et al. 2005). This algorithm predicts a binding site for a factor at the probe-level resolution. The P value for significant peaks is based on the following test-statistic:
 |
Here n is the number of probes in the window forming a triangle centered at the predicted peak; Yi is the log ratio for probe i within the window. The algorithm does not use a prespecified window size but computes the statistic for all possible windows of a certain size range containing triangles centered at the predicted peak. We chose a P value cutoff of P < 0.05 to define significant peaks for Polr2a binding in both the condensed scan and genome-wide scan for each tissue. We designated a peak in the condensed scan as confirmed if the peak is predicted within 500 bp of the peak identified in the genome-wide scan for each tissue. We define the coordinates of the confirmed peaks as the range defined by the matching condensed scan peak and genome scan peak.
As a second step in defining a catalog of Polr2a binding sites, we pooled the confirmed peaks in each tissue and merged all the sites that are within 1000 bp of each other. This cutoff was based on the distribution of nearest-neighbor distances between confirmed peaks. Sites were then merged across tissues if there was any base pair overlap. The Polr2a binding site is then defined as the range of the confirmed peaks merged across tissues.
Expression analysis
To complement the Polr2a mapping strategy, we defined the set of genes with transcripts relatively enriched in each tissue. We identified these genes by analyzing the genome-wide expression profiles of the each tissue using Affymetrix GeneChip Mouse Genome 430 2.0, which represents >39,000 mouse transcripts. Total RNA from each mouse tissue was extracted using Trizol reagent (Invitrogen, Carlsbad, CA) and further purified using RNeasy Mini Kit (Qiagen, Valencia, CA) according to the manufacturer’s recommendations. The purified total RNA was submitted to UCSD Cancer Center Microarray Resource for GeneChip RNA expression analysis using Mouse Genome 430 2.0 arrays. The resulting hybridization data were analyzed using Affymetrix GeneChip Operating Software (GCOS) v. 2.0 to determine the detection call as present (P), marginal (M), or absent (A) at significance level P < 0.05.
We used annotation from the Affymetrix library file Mouse430_2.cdf to match probe sets to corresponding Entrez Gene identifiers. Probe sets with identifier extension “x_at” were removed from the analysis. A total of 20,827 Entrez genes were mapped to the remaining probe sets. We performed quantile normalization on the probe set signals across tissues using the R package, affy (Bolstad et al. 2003; Gentleman et al. 2004). To assign a signal for a gene in each tissue, we selected the maximum normalized expression signal of all probe sets matched to the gene if there are multiple probe sets for a gene. Tissue-specific measures of entropy and categorical tissue-specificity based on expression were computed as previously described (Schug et al. 2005).
Promoter-focused ChIP-chip hit calling
H3K4me3 ChIP-chip for each tissue was performed using the array covering chr11:36,912,182–99,375,819. To circumvent issues in identifying sites of H3K4me3 enrichment, we developed a promoter-focused strategy to answer this question. We took the set of known promoters surveyed (refGene, knownGene, and ensGene) and merged them into a non-redundant set of 1265 nonoverlapping promoter regions 1 kbp wide [−500,+500] from the TSS. This set does not include bidirectional promoters to prevent potential mismatching of H3K4me3 and Polr2a enrichment at head-to-head promoters.
Every array for a tissue and marker (H3K4me3, Polr2a) combination was normalized using a recently reported sequence/GC-based normalization method, MA2C (Song et al. 2007). We reanalyzed corresponding Polr2a ChIP-chip array data for each tissue to make the results directly comparable. For each experiment, the average ChIP-chip log ratio in the 1-kbp window spanned by each promoter was defined as its ChIP-chip enrichment index. The distributions of the average ChIP-chip log ratios over all the promoters for all tissues, for both H3K4me3and Polr2a clearly show a bimodal distribution (mixture of two Gaussian distributions). We used an expectation-maximization (EM) strategy for estimating the parameters for a mixture of two Gaussians (http://www.mathworks.com/matlabcentral/fileexchange/loadFile.do?objectId=8636). A score cutoff for promoter ChIP enrichment is determined for each factor and tissue combination based on the estimated parameters of the null distribution centered near 0. This cutoff is defined as two standard deviations above the mean.
Motif analysis
Classification
We identified motifs for each set of tissue-specific gene promoters by examining the relative over-representation of known vertebrate transcription factor binding site (TFBS) matrices based on TRANSFAC (Matys et al. 2006) and JASPAR (Sandelin et al. 2004) (673) in each set compared to two types of background sets: (1) a random set of mammalian promoters or (2) the relative complement of the set in the set of all tissue-specific gene promoters. The mES c2 set was excluded from the relative complement sets of tissue-specific promoters because its pattern of histone modification enrichment was not tissue-specific. A previously described enumerative strategy, DME, was also used to determine the highest ranked de novo discriminative motifs of different widths (w = 6, 8, 10, 12, 14) in each tissue-specific set compared to each of the two types of background sets (Smith et al. 2005, 2006).
For known and de novo motifs, a motif’s ability to classify the foreground sequences from background sequences is measured by the balanced misclassification error rate. This error rate is defined as:
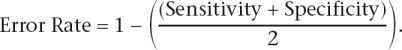 |
Sensitivity is defined as the proportion of promoters in the foreground set containing the motif, and specificity is defined as the proportion of promoters in the background set without the motif. The threshold for motif matching is optimized for each matrix to minimize the error rate.
The significance of the balanced misclassification error rate for a motif (P value) is determined by estimating the expected distribution of the error rates for a given comparison.
Conservation
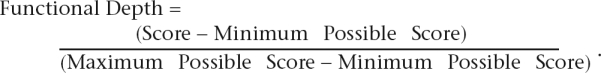
Given the set of known vertebrate TFBS matrices from TRANSFAC and JASPAR (678), the best occurrence of each motif was mapped at every orthologous pair of promoter in mouse and human in each tissue-specific set using the CREAD (http://rulai.cshl.edu/cread/index.shtml) utility storm. Promoter occurrences for all motifs were filtered to those scoring above a functional depth threshold of 0.85:
 |
For every motif, we counted the number of promoters in which the best occurrence of the motif overlapped in the orthologous mouse and human promoters (aligned). We defined the total number of orthologous promoter pairs as P, the total number of orthologous promoter pairs with conserved occurrences of a motif m as C, the number of orthologous promoter pairs specific to the tissue as T, and the number of orthologous promoter pairs in T with conserved occurrences of the motif as k. We then scored the tissue-enrichment of the conserved occurrences for each motif (m) and for each tissue (t) by using the hypergeometric distribution (Tavazoie et al. 1999).
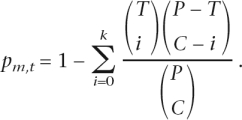 |
P values obtained from each of the 4038 tests (673 motifs, 6 tissue sets) were classified as significant based on a P value cutoff of P < 1/4038 to account for multiple testing.
Please see Supplemental Methods for additional methods and detailed explanations. For software used in expectation-maximization (EM) strategy for estimating parameters for a mixture of two Gaussians see http://www.mathworks.com/matlabcentral/fileexchange/loadFile.do?objectId=8636. For the CREAD utility storm, see http://rulai.cshl.edu/cread/index.shtml.
Acknowledgments
We thank Dr. Keith Ching for bioinformatics advice and Grace Liu for style suggestions. This research was supported in part by a Ford Foundation Pre-Doctoral Fellowship (L.O.B.); Ludwig Institute for Cancer Research (B.R.); R33CA105829 (B.R.), R21CA116365-01 (R.D.G.), and HG001696 (M.Q.Z.) from NIH; and EIA-0324292 (M.Q.Z.) from NSF.
Footnotes
[Supplemental material is available online at www.genome.org. The sequence data from this study have been submitted to the Gene Expression Omnibus under accession no. GSE7688.]
Article published online before print. Article and publication date are at http://www.genome.org/cgi/doi/10.1101/gr.6654808
References
- Aitola M.H., Pelto-Huikko M.T., Pelto-Huikko M.T. Expression of Arnt and Arnt2 mRNA in developing murine tissues. J. Histochem. Cytochem. 2003;51:41–54. doi: 10.1177/002215540305100106. [DOI] [PubMed] [Google Scholar]
- Alberts B., Johnson A., Lewis J., Raff M., Roberts K., Walter P., Johnson A., Lewis J., Raff M., Roberts K., Walter P., Lewis J., Raff M., Roberts K., Walter P., Raff M., Roberts K., Walter P., Roberts K., Walter P., Walter P. Molecular biology of the cell. Garland Publishing; New York: 2002. [Google Scholar]
- Alfano G., Vitiello C., Caccioppoli C., Caramico T., Carola A., Szego M.J., McInnes R.R., Auricchio A., Banfi S., Vitiello C., Caccioppoli C., Caramico T., Carola A., Szego M.J., McInnes R.R., Auricchio A., Banfi S., Caccioppoli C., Caramico T., Carola A., Szego M.J., McInnes R.R., Auricchio A., Banfi S., Caramico T., Carola A., Szego M.J., McInnes R.R., Auricchio A., Banfi S., Carola A., Szego M.J., McInnes R.R., Auricchio A., Banfi S., Szego M.J., McInnes R.R., Auricchio A., Banfi S., McInnes R.R., Auricchio A., Banfi S., Auricchio A., Banfi S., Banfi S. Natural antisense transcripts associated with genes involved in eye development. Hum. Mol. Genet. 2005;14:913–923. doi: 10.1093/hmg/ddi084. [DOI] [PubMed] [Google Scholar]
- Ambros V. The functions of animal microRNAs. Nature. 2004;431:350–355. doi: 10.1038/nature02871. [DOI] [PubMed] [Google Scholar]
- Apone S., Hauschka S.D., Hauschka S.D. Muscle gene E-box control elements. Evidence for quantitatively different transcriptional activities and the binding of distinct regulatory factors. J. Biol. Chem. 1995;270:21420–21427. doi: 10.1074/jbc.270.36.21420. [DOI] [PubMed] [Google Scholar]
- Bernstein B.E., Mikkelsen T.S., Xie X., Kamal M., Huebert D.J., Cuff J., Fry B., Meissner A., Wernig M., Plath K., Mikkelsen T.S., Xie X., Kamal M., Huebert D.J., Cuff J., Fry B., Meissner A., Wernig M., Plath K., Xie X., Kamal M., Huebert D.J., Cuff J., Fry B., Meissner A., Wernig M., Plath K., Kamal M., Huebert D.J., Cuff J., Fry B., Meissner A., Wernig M., Plath K., Huebert D.J., Cuff J., Fry B., Meissner A., Wernig M., Plath K., Cuff J., Fry B., Meissner A., Wernig M., Plath K., Fry B., Meissner A., Wernig M., Plath K., Meissner A., Wernig M., Plath K., Wernig M., Plath K., Plath K., et al. A bivalent chromatin structure marks key developmental genes in embryonic stem cells. Cell. 2006;125:315–326. doi: 10.1016/j.cell.2006.02.041. [DOI] [PubMed] [Google Scholar]
- Besser D. Expression of nodal, lefty-a, and lefty-B in undifferentiated human embryonic stem cells requires activation of Smad2/3. J. Biol. Chem. 2004;279:45076–45084. doi: 10.1074/jbc.M404979200. [DOI] [PubMed] [Google Scholar]
- Blackshear P.J., Graves J.P., Stumpo D.J., Cobos I., Rubenstein J.L., Zeldin D.C., Graves J.P., Stumpo D.J., Cobos I., Rubenstein J.L., Zeldin D.C., Stumpo D.J., Cobos I., Rubenstein J.L., Zeldin D.C., Cobos I., Rubenstein J.L., Zeldin D.C., Rubenstein J.L., Zeldin D.C., Zeldin D.C. Graded phenotypic response to partial and complete deficiency of a brain-specific transcript variant of the winged helix transcription factor RFX4. Development. 2003;130:4539–4552. doi: 10.1242/dev.00661. [DOI] [PubMed] [Google Scholar]
- Bolstad B.M., Irizarry R.A., Astrand M., Speed T.P., Irizarry R.A., Astrand M., Speed T.P., Astrand M., Speed T.P., Speed T.P. A comparison of normalization methods for high density oligonucleotide array data based on variance and bias. Bioinformatics. 2003;19:185–193. doi: 10.1093/bioinformatics/19.2.185. [DOI] [PubMed] [Google Scholar]
- Boyer L.A., Lee T.I., Cole M.F., Johnstone S.E., Levine S.S., Zucker J.P., Guenther M.G., Kumar R.M., Murray H.L., Jenner R.G., Lee T.I., Cole M.F., Johnstone S.E., Levine S.S., Zucker J.P., Guenther M.G., Kumar R.M., Murray H.L., Jenner R.G., Cole M.F., Johnstone S.E., Levine S.S., Zucker J.P., Guenther M.G., Kumar R.M., Murray H.L., Jenner R.G., Johnstone S.E., Levine S.S., Zucker J.P., Guenther M.G., Kumar R.M., Murray H.L., Jenner R.G., Levine S.S., Zucker J.P., Guenther M.G., Kumar R.M., Murray H.L., Jenner R.G., Zucker J.P., Guenther M.G., Kumar R.M., Murray H.L., Jenner R.G., Guenther M.G., Kumar R.M., Murray H.L., Jenner R.G., Kumar R.M., Murray H.L., Jenner R.G., Murray H.L., Jenner R.G., Jenner R.G., et al. Core transcriptional regulatory circuitry in human embryonic stem cells. Cell. 2005;122:947–956. doi: 10.1016/j.cell.2005.08.020. [DOI] [PMC free article] [PubMed] [Google Scholar]
- Brodsky A.S., Meyer C.A., Swinburne I.A., Hall G., Keenan B.J., Liu X.S., Fox E.A., Silver P.A., Meyer C.A., Swinburne I.A., Hall G., Keenan B.J., Liu X.S., Fox E.A., Silver P.A., Swinburne I.A., Hall G., Keenan B.J., Liu X.S., Fox E.A., Silver P.A., Hall G., Keenan B.J., Liu X.S., Fox E.A., Silver P.A., Keenan B.J., Liu X.S., Fox E.A., Silver P.A., Liu X.S., Fox E.A., Silver P.A., Fox E.A., Silver P.A., Silver P.A. Genomic mapping of RNA polymerase II reveals sites of co-transcriptional regulation in human cells. Genome Biol. 2005;6:R64. doi: 10.1186/gb-2005-6-8-r64. [DOI] [PMC free article] [PubMed] [Google Scholar]
- Carninci P., Kasukawa T., Katayama S., Gough J., Frith M.C., Maeda N., Oyama R., Ravasi T., Lenhard B., Wells C., Kasukawa T., Katayama S., Gough J., Frith M.C., Maeda N., Oyama R., Ravasi T., Lenhard B., Wells C., Katayama S., Gough J., Frith M.C., Maeda N., Oyama R., Ravasi T., Lenhard B., Wells C., Gough J., Frith M.C., Maeda N., Oyama R., Ravasi T., Lenhard B., Wells C., Frith M.C., Maeda N., Oyama R., Ravasi T., Lenhard B., Wells C., Maeda N., Oyama R., Ravasi T., Lenhard B., Wells C., Oyama R., Ravasi T., Lenhard B., Wells C., Ravasi T., Lenhard B., Wells C., Lenhard B., Wells C., Wells C., et al. The transcriptional landscape of the mammalian genome. Science. 2005;309:1559–1563. doi: 10.1126/science.1112014. [DOI] [PubMed] [Google Scholar]
- Carninci P., Sandelin A., Lenhard B., Katayama S., Shimokawa K., Ponjavic J., Semple C.A., Taylor M.S., Engstrom P.G., Frith M.C., Sandelin A., Lenhard B., Katayama S., Shimokawa K., Ponjavic J., Semple C.A., Taylor M.S., Engstrom P.G., Frith M.C., Lenhard B., Katayama S., Shimokawa K., Ponjavic J., Semple C.A., Taylor M.S., Engstrom P.G., Frith M.C., Katayama S., Shimokawa K., Ponjavic J., Semple C.A., Taylor M.S., Engstrom P.G., Frith M.C., Shimokawa K., Ponjavic J., Semple C.A., Taylor M.S., Engstrom P.G., Frith M.C., Ponjavic J., Semple C.A., Taylor M.S., Engstrom P.G., Frith M.C., Semple C.A., Taylor M.S., Engstrom P.G., Frith M.C., Taylor M.S., Engstrom P.G., Frith M.C., Engstrom P.G., Frith M.C., Frith M.C., et al. Genome-wide analysis of mammalian promoter architecture and evolution. Nat. Genet. 2006;38:626–635. doi: 10.1038/ng1789. [DOI] [PubMed] [Google Scholar]
- Cheng C., Sharp P.A., Sharp P.A. RNA polymerase II accumulation in the promoter-proximal region of the dihydrofolate reductase and γ-actin genes. Mol. Cell. Biol. 2003;23:1961–1967. doi: 10.1128/MCB.23.6.1961-1967.2003. [DOI] [PMC free article] [PubMed] [Google Scholar]
- Cross S.H., Bird A.P., Bird A.P. CpG islands and genes. Curr. Opin. Genet. Dev. 1995;5:309–314. doi: 10.1016/0959-437x(95)80044-1. [DOI] [PubMed] [Google Scholar]
- Dabrowski M., Aerts S., Kaminska B., Aerts S., Kaminska B., Kaminska B. Prediction of a key role of motifs binding E2F and NR2F in down-regulation of numerous genes during the development of the mouse hippocampus. BMC Bioinformatics. 2006;7:367. doi: 10.1186/1471-2105-7-367. [DOI] [PMC free article] [PubMed] [Google Scholar]
- Diagana T.T., North D.L., Jabet C., Fiszman M.Y., Takeda S., Whalen R.G., North D.L., Jabet C., Fiszman M.Y., Takeda S., Whalen R.G., Jabet C., Fiszman M.Y., Takeda S., Whalen R.G., Fiszman M.Y., Takeda S., Whalen R.G., Takeda S., Whalen R.G., Whalen R.G. The transcriptional activity of a muscle-specific promoter depends critically on the structure of the TATA element and its binding protein. J. Mol. Biol. 1997;265:480–493. doi: 10.1006/jmbi.1996.0752. [DOI] [PubMed] [Google Scholar]
- Durand B., Vandaele C., Spencer D., Pantalacci S., Couble P., Vandaele C., Spencer D., Pantalacci S., Couble P., Spencer D., Pantalacci S., Couble P., Pantalacci S., Couble P., Couble P. Cloning and characterization of dRFX, the Drosophila member of the RFX family of transcription factors. Gene. 2000;246:285–293. doi: 10.1016/s0378-1119(00)00093-7. [DOI] [PubMed] [Google Scholar]
- Flink I.L., Edwards J.G., Bahl J.J., Liew C.C., Sole M., Morkin E., Edwards J.G., Bahl J.J., Liew C.C., Sole M., Morkin E., Bahl J.J., Liew C.C., Sole M., Morkin E., Liew C.C., Sole M., Morkin E., Sole M., Morkin E., Morkin E. Characterization of a strong positive cis-acting element of the human β-myosin heavy chain gene in fetal rat heart cells. J. Biol. Chem. 1992;267:9917–9924. [PubMed] [Google Scholar]
- Gardiner-Garden M., Frommer M., Frommer M. CpG islands in vertebrate genomes. J. Mol. Biol. 1987;196:261–282. doi: 10.1016/0022-2836(87)90689-9. [DOI] [PubMed] [Google Scholar]
- Gene Ontology Consortium The Gene Ontology (GO) Project in 2006. Nucleic Acids Res. 2006;34:D322–D326. doi: 10.1093/nar/gkj021. [DOI] [PMC free article] [PubMed] [Google Scholar]
- Gentleman R.C., Carey V.J., Bates D.M., Bolstad B., Dettling M., Dudoit S., Ellis B., Gautier L., Ge Y., Gentry J., Carey V.J., Bates D.M., Bolstad B., Dettling M., Dudoit S., Ellis B., Gautier L., Ge Y., Gentry J., Bates D.M., Bolstad B., Dettling M., Dudoit S., Ellis B., Gautier L., Ge Y., Gentry J., Bolstad B., Dettling M., Dudoit S., Ellis B., Gautier L., Ge Y., Gentry J., Dettling M., Dudoit S., Ellis B., Gautier L., Ge Y., Gentry J., Dudoit S., Ellis B., Gautier L., Ge Y., Gentry J., Ellis B., Gautier L., Ge Y., Gentry J., Gautier L., Ge Y., Gentry J., Ge Y., Gentry J., Gentry J., et al. Bioconductor: Open software development for computational biology and bioinformatics. Genome Biol. 2004;5:R80. doi: 10.1186/gb-2004-5-10-r80. [DOI] [PMC free article] [PubMed] [Google Scholar]
- Griffiths-Jones S., Grocock R.J., van Dongen S., Bateman A., Enright A.J., Grocock R.J., van Dongen S., Bateman A., Enright A.J., van Dongen S., Bateman A., Enright A.J., Bateman A., Enright A.J., Enright A.J. miRBase: MicroRNA sequences, targets and gene nomenclature. Nucleic Acids Res. 2006;34:D140–D144. doi: 10.1093/nar/gkj112. [DOI] [PMC free article] [PubMed] [Google Scholar]
- Guenther M.G., Levine S.S., Boyer L.A., Jaenisch R., Young R.A., Levine S.S., Boyer L.A., Jaenisch R., Young R.A., Boyer L.A., Jaenisch R., Young R.A., Jaenisch R., Young R.A., Young R.A. A chromatin landmark and transcription initiation at most promoters in human cells. Cell. 2007;130:77–88. doi: 10.1016/j.cell.2007.05.042. [DOI] [PMC free article] [PubMed] [Google Scholar]
- Guillemette B., Bataille A.R., Gevry N., Adam M., Blanchette M., Robert F., Gaudreau L., Bataille A.R., Gevry N., Adam M., Blanchette M., Robert F., Gaudreau L., Gevry N., Adam M., Blanchette M., Robert F., Gaudreau L., Adam M., Blanchette M., Robert F., Gaudreau L., Blanchette M., Robert F., Gaudreau L., Robert F., Gaudreau L., Gaudreau L. Variant histone H2A.Z is globally localized to the promoters of inactive yeast genes and regulates nucleosome positioning. PLoS Biol. 2005;3:e384. doi: 10.1371/journal.pbio.0030384. [DOI] [PMC free article] [PubMed] [Google Scholar]
- Heintzman N.D., Stuart R.K., Hon G., Fu Y., Ching C.W., Hawkins R.D., Barrera L.O., Van Calcar S., Qu C., Ching K.A., Stuart R.K., Hon G., Fu Y., Ching C.W., Hawkins R.D., Barrera L.O., Van Calcar S., Qu C., Ching K.A., Hon G., Fu Y., Ching C.W., Hawkins R.D., Barrera L.O., Van Calcar S., Qu C., Ching K.A., Fu Y., Ching C.W., Hawkins R.D., Barrera L.O., Van Calcar S., Qu C., Ching K.A., Ching C.W., Hawkins R.D., Barrera L.O., Van Calcar S., Qu C., Ching K.A., Hawkins R.D., Barrera L.O., Van Calcar S., Qu C., Ching K.A., Barrera L.O., Van Calcar S., Qu C., Ching K.A., Van Calcar S., Qu C., Ching K.A., Qu C., Ching K.A., Ching K.A., et al. Distinct and predictive chromatin signatures of transcriptional promoters and enhancers in the human genome. Nat. Genet. 2007;39:311–318. doi: 10.1038/ng1966. [DOI] [PubMed] [Google Scholar]
- Herdegen T., Leah J.D., Leah J.D. Inducible and constitutive transcription factors in the mammalian nervous system: Control of gene expression by Jun, Fos and Krox, and CREB/ATF proteins. Brain Res Rev. 1998;28:370–490. doi: 10.1016/s0165-0173(98)00018-6. [DOI] [PubMed] [Google Scholar]
- Hinrichs A.S., Karolchik D., Baertsch R., Barber G.P., Bejerano G., Clawson H., Diekhans M., Furey T.S., Harte R.A., Hsu F., Karolchik D., Baertsch R., Barber G.P., Bejerano G., Clawson H., Diekhans M., Furey T.S., Harte R.A., Hsu F., Baertsch R., Barber G.P., Bejerano G., Clawson H., Diekhans M., Furey T.S., Harte R.A., Hsu F., Barber G.P., Bejerano G., Clawson H., Diekhans M., Furey T.S., Harte R.A., Hsu F., Bejerano G., Clawson H., Diekhans M., Furey T.S., Harte R.A., Hsu F., Clawson H., Diekhans M., Furey T.S., Harte R.A., Hsu F., Diekhans M., Furey T.S., Harte R.A., Hsu F., Furey T.S., Harte R.A., Hsu F., Harte R.A., Hsu F., Hsu F., et al. The UCSC Genome Browser Database: Update 2006. Nucleic Acids Res. 2006;34:D590–D598. doi: 10.1093/nar/gkj144. [DOI] [PMC free article] [PubMed] [Google Scholar]
- Ivanova N., Dobrin R., Lu R., Kotenko I., Levorse J., Decoste C., Schafer X., Lun Y., Lemischka I.R., Dobrin R., Lu R., Kotenko I., Levorse J., Decoste C., Schafer X., Lun Y., Lemischka I.R., Lu R., Kotenko I., Levorse J., Decoste C., Schafer X., Lun Y., Lemischka I.R., Kotenko I., Levorse J., Decoste C., Schafer X., Lun Y., Lemischka I.R., Levorse J., Decoste C., Schafer X., Lun Y., Lemischka I.R., Decoste C., Schafer X., Lun Y., Lemischka I.R., Schafer X., Lun Y., Lemischka I.R., Lun Y., Lemischka I.R., Lemischka I.R. Dissecting self-renewal in stem cells with RNA interference. Nature. 2006;442:533–538. doi: 10.1038/nature04915. [DOI] [PubMed] [Google Scholar]
- Joyner A.L., Liu A., Millet S., Liu A., Millet S., Millet S. Otx2, Gbx2 and Fgf8 interact to position and maintain a mid-hindbrain organizer. Curr. Opin. Cell Biol. 2000;12:736–741. doi: 10.1016/s0955-0674(00)00161-7. [DOI] [PubMed] [Google Scholar]
- Junghans D., Chauvet S., Buhler E., Dudley K., Sykes T., Henderson C.E., Chauvet S., Buhler E., Dudley K., Sykes T., Henderson C.E., Buhler E., Dudley K., Sykes T., Henderson C.E., Dudley K., Sykes T., Henderson C.E., Sykes T., Henderson C.E., Henderson C.E. The CES-2-related transcription factor E4BP4 is an intrinsic regulator of motoneuron growth and survival. Development. 2004;131:4425–4434. doi: 10.1242/dev.01313. [DOI] [PubMed] [Google Scholar]
- Kim T.H., Barrera L.O., Qu C., Van Calcar S., Trinklein N.D., Cooper S.J., Luna R.M., Glass C.K., Rosenfeld M.G., Myers R.M., Barrera L.O., Qu C., Van Calcar S., Trinklein N.D., Cooper S.J., Luna R.M., Glass C.K., Rosenfeld M.G., Myers R.M., Qu C., Van Calcar S., Trinklein N.D., Cooper S.J., Luna R.M., Glass C.K., Rosenfeld M.G., Myers R.M., Van Calcar S., Trinklein N.D., Cooper S.J., Luna R.M., Glass C.K., Rosenfeld M.G., Myers R.M., Trinklein N.D., Cooper S.J., Luna R.M., Glass C.K., Rosenfeld M.G., Myers R.M., Cooper S.J., Luna R.M., Glass C.K., Rosenfeld M.G., Myers R.M., Luna R.M., Glass C.K., Rosenfeld M.G., Myers R.M., Glass C.K., Rosenfeld M.G., Myers R.M., Rosenfeld M.G., Myers R.M., Myers R.M., et al. Direct isolation and identification of promoters in the human genome. Genome Res. 2005a;15:830–839. doi: 10.1101/gr.3430605. [DOI] [PMC free article] [PubMed] [Google Scholar]
- Kim T.H., Barrera L.O., Zheng M., Qu C., Singer M.A., Richmond T.A., Wu Y., Green R.D., Ren B., Barrera L.O., Zheng M., Qu C., Singer M.A., Richmond T.A., Wu Y., Green R.D., Ren B., Zheng M., Qu C., Singer M.A., Richmond T.A., Wu Y., Green R.D., Ren B., Qu C., Singer M.A., Richmond T.A., Wu Y., Green R.D., Ren B., Singer M.A., Richmond T.A., Wu Y., Green R.D., Ren B., Richmond T.A., Wu Y., Green R.D., Ren B., Wu Y., Green R.D., Ren B., Green R.D., Ren B., Ren B. A high-resolution map of active promoters in the human genome. Nature. 2005b;436:876–880. doi: 10.1038/nature03877. [DOI] [PMC free article] [PubMed] [Google Scholar]
- Kim T.H., Ren B., Ren B. Genome-wide analysis of protein–DNA interactions. Annu. Rev. Genomics Hum. Genet. 2006;7:81–102. doi: 10.1146/annurev.genom.7.080505.115634. [DOI] [PubMed] [Google Scholar]
- Kimura K., Wakamatsu A., Suzuki Y., Ota T., Nishikawa T., Yamashita R., Yamamoto J., Sekine M., Tsuritani K., Wakaguri H., Wakamatsu A., Suzuki Y., Ota T., Nishikawa T., Yamashita R., Yamamoto J., Sekine M., Tsuritani K., Wakaguri H., Suzuki Y., Ota T., Nishikawa T., Yamashita R., Yamamoto J., Sekine M., Tsuritani K., Wakaguri H., Ota T., Nishikawa T., Yamashita R., Yamamoto J., Sekine M., Tsuritani K., Wakaguri H., Nishikawa T., Yamashita R., Yamamoto J., Sekine M., Tsuritani K., Wakaguri H., Yamashita R., Yamamoto J., Sekine M., Tsuritani K., Wakaguri H., Yamamoto J., Sekine M., Tsuritani K., Wakaguri H., Sekine M., Tsuritani K., Wakaguri H., Tsuritani K., Wakaguri H., Wakaguri H., et al. Diversification of transcriptional modulation: Large-scale identification and characterization of putative alternative promoters of human genes. Genome Res. 2006;16:55–65. doi: 10.1101/gr.4039406. [DOI] [PMC free article] [PubMed] [Google Scholar]
- Kioussi C., Briata P., Baek S.H., Wynshaw-Boris A., Rose D.W., Rosenfeld M.G., Briata P., Baek S.H., Wynshaw-Boris A., Rose D.W., Rosenfeld M.G., Baek S.H., Wynshaw-Boris A., Rose D.W., Rosenfeld M.G., Wynshaw-Boris A., Rose D.W., Rosenfeld M.G., Rose D.W., Rosenfeld M.G., Rosenfeld M.G. Pitx genes during cardiovascular development. Cold Spring Harb. Symp. Quant. Biol. 2002;67:81–87. doi: 10.1101/sqb.2002.67.81. [DOI] [PubMed] [Google Scholar]
- Kouskouti A., Talianidis I., Talianidis I. Histone modifications defining active genes persist after transcriptional and mitotic inactivation. EMBO J. 2005;24:347–357. doi: 10.1038/sj.emboj.7600516. [DOI] [PMC free article] [PubMed] [Google Scholar]
- Lee C.K., Shibata Y., Rao B., Strahl B.D., Lieb J.D., Shibata Y., Rao B., Strahl B.D., Lieb J.D., Rao B., Strahl B.D., Lieb J.D., Strahl B.D., Lieb J.D., Lieb J.D. Evidence for nucleosome depletion at active regulatory regions genome wide. Nat. Genet. 2004;36:900–905. doi: 10.1038/ng1400. [DOI] [PubMed] [Google Scholar]
- Levine M., Tjian R., Tjian R. Transcription regulation and animal diversity. Nature. 2003;424:147–151. doi: 10.1038/nature01763. [DOI] [PubMed] [Google Scholar]
- Li Z., Van Calcar S., Qu C., Cavenee W.K., Zhang M.Q., Ren B., Van Calcar S., Qu C., Cavenee W.K., Zhang M.Q., Ren B., Qu C., Cavenee W.K., Zhang M.Q., Ren B., Cavenee W.K., Zhang M.Q., Ren B., Zhang M.Q., Ren B., Ren B. A global transcriptional regulatory role for c-Myc in Burkitt’s lymphoma cells. Proc. Natl. Acad. Sci. 2003;100:8164–8169. doi: 10.1073/pnas.1332764100. [DOI] [PMC free article] [PubMed] [Google Scholar]
- Lim L.P., Lau N.C., Garrett-Engele P., Grimson A., Schelter J.M., Castle J., Bartel D.P., Linsley P.S., Johnson J.M., Lau N.C., Garrett-Engele P., Grimson A., Schelter J.M., Castle J., Bartel D.P., Linsley P.S., Johnson J.M., Garrett-Engele P., Grimson A., Schelter J.M., Castle J., Bartel D.P., Linsley P.S., Johnson J.M., Grimson A., Schelter J.M., Castle J., Bartel D.P., Linsley P.S., Johnson J.M., Schelter J.M., Castle J., Bartel D.P., Linsley P.S., Johnson J.M., Castle J., Bartel D.P., Linsley P.S., Johnson J.M., Bartel D.P., Linsley P.S., Johnson J.M., Linsley P.S., Johnson J.M., Johnson J.M. Microarray analysis shows that some microRNAs down-regulate large numbers of target mRNAs. Nature. 2005;433:769–773. doi: 10.1038/nature03315. [DOI] [PubMed] [Google Scholar]
- Loh Y.H., Wu Q., Chew J.L., Vega V.B., Zhang W., Chen X., Bourque G., George J., Leong B., Liu J., Wu Q., Chew J.L., Vega V.B., Zhang W., Chen X., Bourque G., George J., Leong B., Liu J., Chew J.L., Vega V.B., Zhang W., Chen X., Bourque G., George J., Leong B., Liu J., Vega V.B., Zhang W., Chen X., Bourque G., George J., Leong B., Liu J., Zhang W., Chen X., Bourque G., George J., Leong B., Liu J., Chen X., Bourque G., George J., Leong B., Liu J., Bourque G., George J., Leong B., Liu J., George J., Leong B., Liu J., Leong B., Liu J., Liu J., et al. The Oct4 and Nanog transcription network regulates pluripotency in mouse embryonic stem cells. Nat. Genet. 2006;38:431–440. doi: 10.1038/ng1760. [DOI] [PubMed] [Google Scholar]
- Maglott D., Ostell J., Pruitt K.D., Tatusova T., Ostell J., Pruitt K.D., Tatusova T., Pruitt K.D., Tatusova T., Tatusova T. Entrez Gene: Gene-centered information at NCBI. Nucleic Acids Res. 2005;33:D54–D58. doi: 10.1093/nar/gki031. [DOI] [PMC free article] [PubMed] [Google Scholar]
- Matys V., Kel-Margoulis O.V., Fricke E., Liebich I., Land S., Barre-Dirrie A., Reuter I., Chekmenev D., Krull M., Hornischer K., Kel-Margoulis O.V., Fricke E., Liebich I., Land S., Barre-Dirrie A., Reuter I., Chekmenev D., Krull M., Hornischer K., Fricke E., Liebich I., Land S., Barre-Dirrie A., Reuter I., Chekmenev D., Krull M., Hornischer K., Liebich I., Land S., Barre-Dirrie A., Reuter I., Chekmenev D., Krull M., Hornischer K., Land S., Barre-Dirrie A., Reuter I., Chekmenev D., Krull M., Hornischer K., Barre-Dirrie A., Reuter I., Chekmenev D., Krull M., Hornischer K., Reuter I., Chekmenev D., Krull M., Hornischer K., Chekmenev D., Krull M., Hornischer K., Krull M., Hornischer K., Hornischer K., et al. TRANSFAC and its module TRANSCompel®: Transcriptional gene regulation in eukaryotes. Nucleic Acids Res. 2006;34:D108–D110. doi: 10.1093/nar/gkj143. [DOI] [PMC free article] [PubMed] [Google Scholar]
- Mégy K., Audic S., Claverie J.M., Audic S., Claverie J.M., Claverie J.M. Heart-specific genes revealed by expressed sequence tag (EST) sampling. Genome Biol. 2002;3 doi: 10.1186/gb-2002-3-12-research0074. RESEARCH0074. [DOI] [PMC free article] [PubMed] [Google Scholar]
- Mito Y., Henikoff J.G., Henikoff S., Henikoff J.G., Henikoff S., Henikoff S. Genome-scale profiling of histone H3.3 replacement patterns. Nat. Genet. 2005;37:1090–1097. doi: 10.1038/ng1637. [DOI] [PubMed] [Google Scholar]
- Nakashima K., Yanagisawa M., Arakawa H., Kimura N., Hisatsune T., Kawabata M., Miyazono K., Taga T., Yanagisawa M., Arakawa H., Kimura N., Hisatsune T., Kawabata M., Miyazono K., Taga T., Arakawa H., Kimura N., Hisatsune T., Kawabata M., Miyazono K., Taga T., Kimura N., Hisatsune T., Kawabata M., Miyazono K., Taga T., Hisatsune T., Kawabata M., Miyazono K., Taga T., Kawabata M., Miyazono K., Taga T., Miyazono K., Taga T., Taga T. Synergistic signaling in fetal brain by STAT3-Smad1 complex bridged by p300. Science. 1999;284:479–482. doi: 10.1126/science.284.5413.479. [DOI] [PubMed] [Google Scholar]
- Niakan K.K., Davis E.C., Clipsham R.C., Jiang M., Dehart D.B., Sulik K.K., McCabe E.R., Davis E.C., Clipsham R.C., Jiang M., Dehart D.B., Sulik K.K., McCabe E.R., Clipsham R.C., Jiang M., Dehart D.B., Sulik K.K., McCabe E.R., Jiang M., Dehart D.B., Sulik K.K., McCabe E.R., Dehart D.B., Sulik K.K., McCabe E.R., Sulik K.K., McCabe E.R., McCabe E.R. Novel role for the orphan nuclear receptor Dax1 in embryogenesis, different from steroidogenesis. Mol. Genet. Metab. 2006;88:261–271. doi: 10.1016/j.ymgme.2005.12.010. [DOI] [PubMed] [Google Scholar]
- O’Donovan K.J., Tourtellotte W.G., Millbrandt J., Baraban J.M., Tourtellotte W.G., Millbrandt J., Baraban J.M., Millbrandt J., Baraban J.M., Baraban J.M. The EGR family of transcription-regulatory factors: Progress at the interface of molecular and systems neuroscience. Trends Neurosci. 1999;22:167–173. doi: 10.1016/s0166-2236(98)01343-5. [DOI] [PubMed] [Google Scholar]
- Okazaki Y., Furuno M., Kasukawa T., Adachi J., Bono H., Kondo S., Nikaido I., Osato N., Saito R., Suzuki H., Furuno M., Kasukawa T., Adachi J., Bono H., Kondo S., Nikaido I., Osato N., Saito R., Suzuki H., Kasukawa T., Adachi J., Bono H., Kondo S., Nikaido I., Osato N., Saito R., Suzuki H., Adachi J., Bono H., Kondo S., Nikaido I., Osato N., Saito R., Suzuki H., Bono H., Kondo S., Nikaido I., Osato N., Saito R., Suzuki H., Kondo S., Nikaido I., Osato N., Saito R., Suzuki H., Nikaido I., Osato N., Saito R., Suzuki H., Osato N., Saito R., Suzuki H., Saito R., Suzuki H., Suzuki H., et al. Analysis of the mouse transcriptome based on functional annotation of 60,770 full-length cDNAs. Nature. 2002;420:563–573. doi: 10.1038/nature01266. [DOI] [PubMed] [Google Scholar]
- Pokholok D.K., Harbison C.T., Levine S., Cole M., Hannett N.M., Lee T.I., Bell G.W., Walker K., Rolfe P.A., Herbolsheimer E., Harbison C.T., Levine S., Cole M., Hannett N.M., Lee T.I., Bell G.W., Walker K., Rolfe P.A., Herbolsheimer E., Levine S., Cole M., Hannett N.M., Lee T.I., Bell G.W., Walker K., Rolfe P.A., Herbolsheimer E., Cole M., Hannett N.M., Lee T.I., Bell G.W., Walker K., Rolfe P.A., Herbolsheimer E., Hannett N.M., Lee T.I., Bell G.W., Walker K., Rolfe P.A., Herbolsheimer E., Lee T.I., Bell G.W., Walker K., Rolfe P.A., Herbolsheimer E., Bell G.W., Walker K., Rolfe P.A., Herbolsheimer E., Walker K., Rolfe P.A., Herbolsheimer E., Rolfe P.A., Herbolsheimer E., Herbolsheimer E., et al. Genome-wide map of nucleosome acetylation and methylation in yeast. Cell. 2005;122:517–527. doi: 10.1016/j.cell.2005.06.026. [DOI] [PubMed] [Google Scholar]
- Raisner R.M., Hartley P.D., Meneghini M.D., Bao M.Z., Liu C.L., Schreiber S.L., Rando O.J., Madhani H.D., Hartley P.D., Meneghini M.D., Bao M.Z., Liu C.L., Schreiber S.L., Rando O.J., Madhani H.D., Meneghini M.D., Bao M.Z., Liu C.L., Schreiber S.L., Rando O.J., Madhani H.D., Bao M.Z., Liu C.L., Schreiber S.L., Rando O.J., Madhani H.D., Liu C.L., Schreiber S.L., Rando O.J., Madhani H.D., Schreiber S.L., Rando O.J., Madhani H.D., Rando O.J., Madhani H.D., Madhani H.D. Histone variant H2A.Z marks the 5′ ends of both active and inactive genes in euchromatin. Cell. 2005;123:233–248. doi: 10.1016/j.cell.2005.10.002. [DOI] [PMC free article] [PubMed] [Google Scholar]
- Reya T., Clevers H., Clevers H. Wnt signaling in stem cells and cancer. Nature. 2005;434:843–850. doi: 10.1038/nature03319. [DOI] [PubMed] [Google Scholar]
- Rodriguez C., Huang L.J., Son J.K., McKee A., Xiao Z., Lodish H.F., Huang L.J., Son J.K., McKee A., Xiao Z., Lodish H.F., Son J.K., McKee A., Xiao Z., Lodish H.F., McKee A., Xiao Z., Lodish H.F., Xiao Z., Lodish H.F., Lodish H.F. Functional cloning of the proto-oncogene brain factor-1 (BF-1) as a Smad-binding antagonist of transforming growth factor-β signaling. J. Biol. Chem. 2001;276:30224–30230. doi: 10.1074/jbc.M102759200. [DOI] [PubMed] [Google Scholar]
- Roh T.Y., Cuddapah S., Cui K., Zhao K., Cuddapah S., Cui K., Zhao K., Cui K., Zhao K., Zhao K. The genomic landscape of histone modifications in human T cells. Proc. Natl. Acad. Sci. 2006;103:15782–15787. doi: 10.1073/pnas.0607617103. [DOI] [PMC free article] [PubMed] [Google Scholar]
- Ruiz i Altaba A., Sanchez P., Dahmane N., Sanchez P., Dahmane N., Dahmane N. Gli and hedgehog in cancer: Tumors, embryos, and stem cells. Nat. Rev. Cancer. 2002;2:361–372. doi: 10.1038/nrc796. [DOI] [PubMed] [Google Scholar]
- Ruthenburg A.J., Allis C.D., Wysocka J., Allis C.D., Wysocka J., Wysocka J. Methylation of lysine 4 on histone H3: Intricacy of writing and reading a single epigenetic mark. Mol. Cell. 2007;25:15–30. doi: 10.1016/j.molcel.2006.12.014. [DOI] [PubMed] [Google Scholar]
- Sandelin A., Alkema W., Engstrom P., Wasserman W.W., Lenhard B., Alkema W., Engstrom P., Wasserman W.W., Lenhard B., Engstrom P., Wasserman W.W., Lenhard B., Wasserman W.W., Lenhard B., Lenhard B. JASPAR: An open-access database for eukaryotic transcription factor binding profiles. Nucleic Acids Res. 2004;32:D91–D94. doi: 10.1093/nar/gkh012. [DOI] [PMC free article] [PubMed] [Google Scholar]
- Saunders A., Core L.J., Lis J.T., Core L.J., Lis J.T., Lis J.T. Breaking barriers to transcription elongation. Nat. Rev. Mol. Cell Biol. 2006;7:557–567. doi: 10.1038/nrm1981. [DOI] [PubMed] [Google Scholar]
- Schedl A., Hastie N.D., Hastie N.D. Cross-talk in kidney development. Curr. Opin. Genet. Dev. 2000;10:543–549. doi: 10.1016/s0959-437x(00)00125-8. [DOI] [PubMed] [Google Scholar]
- Schoenherr C.J., Anderson D.J., Anderson D.J. The neuron-restrictive silencer factor (NRSF): A coordinate repressor of multiple neuron-specific genes. Science. 1995;267:1360–1363. doi: 10.1126/science.7871435. [DOI] [PubMed] [Google Scholar]
- Schug J., Schuller W.P., Kappen C., Salbaum J.M., Bucan M., Stoeckert C.J., Schuller W.P., Kappen C., Salbaum J.M., Bucan M., Stoeckert C.J., Kappen C., Salbaum J.M., Bucan M., Stoeckert C.J., Salbaum J.M., Bucan M., Stoeckert C.J., Bucan M., Stoeckert C.J., Stoeckert C.J. Promoter features related to tissue specificity as measured by Shannon entropy. Genome Biol. 2005;6:R33. doi: 10.1186/gb-2005-6-4-r33. [DOI] [PMC free article] [PubMed] [Google Scholar]
- Senkel S., Lucas B., Klein-Hitpass L., Ryffel G.U., Lucas B., Klein-Hitpass L., Ryffel G.U., Klein-Hitpass L., Ryffel G.U., Ryffel G.U. Identification of target genes of the transcription factor HNF1beta and HNF1alpha in a human embryonic kidney cell line. Biochim. Biophys. Acta. 2005;1731:179–190. doi: 10.1016/j.bbaexp.2005.10.003. [DOI] [PubMed] [Google Scholar]
- Sharov A.A., Piao Y., Matoba R., Dudekula D.B., Qian Y., VanBuren V., Falco G., Martin P.R., Stagg C.A., Bassey U.C., Piao Y., Matoba R., Dudekula D.B., Qian Y., VanBuren V., Falco G., Martin P.R., Stagg C.A., Bassey U.C., Matoba R., Dudekula D.B., Qian Y., VanBuren V., Falco G., Martin P.R., Stagg C.A., Bassey U.C., Dudekula D.B., Qian Y., VanBuren V., Falco G., Martin P.R., Stagg C.A., Bassey U.C., Qian Y., VanBuren V., Falco G., Martin P.R., Stagg C.A., Bassey U.C., VanBuren V., Falco G., Martin P.R., Stagg C.A., Bassey U.C., Falco G., Martin P.R., Stagg C.A., Bassey U.C., Martin P.R., Stagg C.A., Bassey U.C., Stagg C.A., Bassey U.C., Bassey U.C., et al. Transcriptome analysis of mouse stem cells and early embryos. PLoS Biol. 2003;1:E74. doi: 10.1371/journal.pbio.0000074. [DOI] [PMC free article] [PubMed] [Google Scholar]
- Shin D.H., Lee H.W., Jeon G.S., Lee H.Y., Lee K.H., Cho S.S., Lee H.W., Jeon G.S., Lee H.Y., Lee K.H., Cho S.S., Jeon G.S., Lee H.Y., Lee K.H., Cho S.S., Lee H.Y., Lee K.H., Cho S.S., Lee K.H., Cho S.S., Cho S.S. Constitutive expression of c-myb mRNA in the adult rat brain. Brain Res. 2001;892:203–207. doi: 10.1016/s0006-8993(00)03300-x. [DOI] [PubMed] [Google Scholar]
- Shiraki T., Kondo S., Katayama S., Waki K., Kasukawa T., Kawaji H., Kodzius R., Watahiki A., Nakamura M., Arakawa T., Kondo S., Katayama S., Waki K., Kasukawa T., Kawaji H., Kodzius R., Watahiki A., Nakamura M., Arakawa T., Katayama S., Waki K., Kasukawa T., Kawaji H., Kodzius R., Watahiki A., Nakamura M., Arakawa T., Waki K., Kasukawa T., Kawaji H., Kodzius R., Watahiki A., Nakamura M., Arakawa T., Kasukawa T., Kawaji H., Kodzius R., Watahiki A., Nakamura M., Arakawa T., Kawaji H., Kodzius R., Watahiki A., Nakamura M., Arakawa T., Kodzius R., Watahiki A., Nakamura M., Arakawa T., Watahiki A., Nakamura M., Arakawa T., Nakamura M., Arakawa T., Arakawa T., et al. Cap analysis gene expression for high-throughput analysis of transcriptional starting point and identification of promoter usage. Proc. Natl. Acad. Sci. 2003;100:15776–15781. doi: 10.1073/pnas.2136655100. [DOI] [PMC free article] [PubMed] [Google Scholar]
- Smith E.O., Lomax M.I., Lomax M.I. Structural organization of the bovine gene for the heart/muscle isoform of cytochrome c oxidase subunit VIa. Biochim. Biophys. Acta. 1993;1174:63–71. doi: 10.1016/0167-4781(93)90092-r. [DOI] [PubMed] [Google Scholar]
- Smith A.D., Sumazin P., Zhang M.Q., Sumazin P., Zhang M.Q., Zhang M.Q. Identifying tissue-selective transcription factor binding sites in vertebrate promoters. Proc. Natl. Acad. Sci. 2005;102:1560–1565. doi: 10.1073/pnas.0406123102. [DOI] [PMC free article] [PubMed] [Google Scholar]
- Smith A.D., Sumazin P., Xuan Z., Zhang M.Q., Sumazin P., Xuan Z., Zhang M.Q., Xuan Z., Zhang M.Q., Zhang M.Q. DNA motifs in human and mouse proximal promoters predict tissue-specific expression. Proc. Natl. Acad. Sci. 2006;103:6275–6280. doi: 10.1073/pnas.0508169103. [DOI] [PMC free article] [PubMed] [Google Scholar]
- Smith A.D., Sumazin P., Zhang M.Q., Sumazin P., Zhang M.Q., Zhang M.Q. Tissue-specific regulatory elements in mammalian promoters. Mol. Syst. Biol. 2007;3:73. doi: 10.1038/msb4100114. [DOI] [PMC free article] [PubMed] [Google Scholar]
- Smyth G.K. Limma: Linear models for microarray data. In: Gentleman V.C. R., et al., editors. Bioinformatics and computational biology solutions using R and Bioconductor. Springer; New York: 2005. pp. 397–420. [Google Scholar]
- Song J.S., Johnson W.E., Zhu X., Zhang X., Li W., Manrai A.K., Liu J.S., Chen R., Liu X.S., Johnson W.E., Zhu X., Zhang X., Li W., Manrai A.K., Liu J.S., Chen R., Liu X.S., Zhu X., Zhang X., Li W., Manrai A.K., Liu J.S., Chen R., Liu X.S., Zhang X., Li W., Manrai A.K., Liu J.S., Chen R., Liu X.S., Li W., Manrai A.K., Liu J.S., Chen R., Liu X.S., Manrai A.K., Liu J.S., Chen R., Liu X.S., Liu J.S., Chen R., Liu X.S., Chen R., Liu X.S., Liu X.S. Model-based analysis of 2-color arrays (MA2C) Genome Biol. 2007;8:R178. doi: 10.1186/gb-2007-8-8-r178. [DOI] [PMC free article] [PubMed] [Google Scholar]
- Stead E., White J., Faast R., Conn S., Goldstone S., Rathjen J., Dhingra U., Rathjen P., Walker D., Dalton S., White J., Faast R., Conn S., Goldstone S., Rathjen J., Dhingra U., Rathjen P., Walker D., Dalton S., Faast R., Conn S., Goldstone S., Rathjen J., Dhingra U., Rathjen P., Walker D., Dalton S., Conn S., Goldstone S., Rathjen J., Dhingra U., Rathjen P., Walker D., Dalton S., Goldstone S., Rathjen J., Dhingra U., Rathjen P., Walker D., Dalton S., Rathjen J., Dhingra U., Rathjen P., Walker D., Dalton S., Dhingra U., Rathjen P., Walker D., Dalton S., Rathjen P., Walker D., Dalton S., Walker D., Dalton S., Dalton S. Pluripotent cell division cycles are driven by ectopic Cdk2, cyclin A/E and E2F activities. Oncogene. 2002;21:8320–8333. doi: 10.1038/sj.onc.1206015. [DOI] [PubMed] [Google Scholar]
- Su A.I., Cooke M.P., Ching K.A., Hakak Y., Walker J.R., Wiltshire T., Orth A.P., Vega R.G., Sapinoso L.M., Moqrich A., Cooke M.P., Ching K.A., Hakak Y., Walker J.R., Wiltshire T., Orth A.P., Vega R.G., Sapinoso L.M., Moqrich A., Ching K.A., Hakak Y., Walker J.R., Wiltshire T., Orth A.P., Vega R.G., Sapinoso L.M., Moqrich A., Hakak Y., Walker J.R., Wiltshire T., Orth A.P., Vega R.G., Sapinoso L.M., Moqrich A., Walker J.R., Wiltshire T., Orth A.P., Vega R.G., Sapinoso L.M., Moqrich A., Wiltshire T., Orth A.P., Vega R.G., Sapinoso L.M., Moqrich A., Orth A.P., Vega R.G., Sapinoso L.M., Moqrich A., Vega R.G., Sapinoso L.M., Moqrich A., Sapinoso L.M., Moqrich A., Moqrich A., et al. Large-scale analysis of the human and mouse transcriptomes. Proc. Natl. Acad. Sci. 2002;99:4465–4470. doi: 10.1073/pnas.012025199. [DOI] [PMC free article] [PubMed] [Google Scholar]
- Su A.I., Wiltshire T., Batalov S., Lapp H., Ching K.A., Block D., Zhang J., Soden R., Hayakawa M., Kreiman G., Wiltshire T., Batalov S., Lapp H., Ching K.A., Block D., Zhang J., Soden R., Hayakawa M., Kreiman G., Batalov S., Lapp H., Ching K.A., Block D., Zhang J., Soden R., Hayakawa M., Kreiman G., Lapp H., Ching K.A., Block D., Zhang J., Soden R., Hayakawa M., Kreiman G., Ching K.A., Block D., Zhang J., Soden R., Hayakawa M., Kreiman G., Block D., Zhang J., Soden R., Hayakawa M., Kreiman G., Zhang J., Soden R., Hayakawa M., Kreiman G., Soden R., Hayakawa M., Kreiman G., Hayakawa M., Kreiman G., Kreiman G., et al. A gene atlas of the mouse and human protein-encoding transcriptomes. Proc. Natl. Acad. Sci. 2004;101:6062–6067. doi: 10.1073/pnas.0400782101. [DOI] [PMC free article] [PubMed] [Google Scholar]
- Swanson H.I., Chan W.K., Bradfield C.A., Chan W.K., Bradfield C.A., Bradfield C.A. DNA binding specificities and pairing rules of the Ah receptor, ARNT, and SIM proteins. J. Biol. Chem. 1995;270:26292–26302. doi: 10.1074/jbc.270.44.26292. [DOI] [PubMed] [Google Scholar]
- Takahashi K., Yamanaka S., Yamanaka S. Induction of pluripotent stem cells from mouse embryonic and adult fibroblast cultures by defined factors. Cell. 2006;126:663–676. doi: 10.1016/j.cell.2006.07.024. [DOI] [PubMed] [Google Scholar]
- Tanaka S., Kunath T., Hadjantonakis A.K., Nagy A., Rossant J., Kunath T., Hadjantonakis A.K., Nagy A., Rossant J., Hadjantonakis A.K., Nagy A., Rossant J., Nagy A., Rossant J., Rossant J. Promotion of trophoblast stem cell proliferation by FGF4. Science. 1998;282:2072–2075. doi: 10.1126/science.282.5396.2072. [DOI] [PubMed] [Google Scholar]
- Tavazoie S., Hughes J.D., Campbell M.J., Cho R.J., Church G.M., Hughes J.D., Campbell M.J., Cho R.J., Church G.M., Campbell M.J., Cho R.J., Church G.M., Cho R.J., Church G.M., Church G.M. Systematic determination of genetic network architecture. Nat. Genet. 1999;22:281–285. doi: 10.1038/10343. [DOI] [PubMed] [Google Scholar]
- Walton M.R., Dragunow I., Dragunow I. Is CREB a key to neuronal survival? Trends Neurosci. 2000;23:48–53. doi: 10.1016/s0166-2236(99)01500-3. [DOI] [PubMed] [Google Scholar]
- Wasserman W.W., Fickett J.W., Fickett J.W. Identification of regulatory regions which confer muscle-specific gene expression. J. Mol. Biol. 1998;278:167–181. doi: 10.1006/jmbi.1998.1700. [DOI] [PubMed] [Google Scholar]
- Wasserman W.W., Palumbo M., Thompson W., Fickett J.W., Lawrence C.E., Palumbo M., Thompson W., Fickett J.W., Lawrence C.E., Thompson W., Fickett J.W., Lawrence C.E., Fickett J.W., Lawrence C.E., Lawrence C.E. Human-mouse genome comparisons to locate regulatory sites. Nat. Genet. 2000;26:225–228. doi: 10.1038/79965. [DOI] [PubMed] [Google Scholar]
- Weber M., Hellmann I., Stadler M.B., Ramos L., Paabo S., Rebhan M., Schubeler D., Hellmann I., Stadler M.B., Ramos L., Paabo S., Rebhan M., Schubeler D., Stadler M.B., Ramos L., Paabo S., Rebhan M., Schubeler D., Ramos L., Paabo S., Rebhan M., Schubeler D., Paabo S., Rebhan M., Schubeler D., Rebhan M., Schubeler D., Schubeler D. Distribution, silencing potential, and evolutionary impact of promoter DNA methylation in the human genome. Nat. Genet. 2007;39:457–466. doi: 10.1038/ng1990. [DOI] [PubMed] [Google Scholar]
- Wei C.L., Miura T., Robson P., Lim S.K., Xu X.Q., Lee M.Y., Gupta S., Stanton L., Luo Y., Schmitt J., Miura T., Robson P., Lim S.K., Xu X.Q., Lee M.Y., Gupta S., Stanton L., Luo Y., Schmitt J., Robson P., Lim S.K., Xu X.Q., Lee M.Y., Gupta S., Stanton L., Luo Y., Schmitt J., Lim S.K., Xu X.Q., Lee M.Y., Gupta S., Stanton L., Luo Y., Schmitt J., Xu X.Q., Lee M.Y., Gupta S., Stanton L., Luo Y., Schmitt J., Lee M.Y., Gupta S., Stanton L., Luo Y., Schmitt J., Gupta S., Stanton L., Luo Y., Schmitt J., Stanton L., Luo Y., Schmitt J., Luo Y., Schmitt J., Schmitt J., et al. Transcriptome profiling of human and murine ESCs identifies divergent paths required to maintain the stem cell state. Stem Cells. 2005;23:166–185. doi: 10.1634/stemcells.2004-0162. [DOI] [PubMed] [Google Scholar]
- Xie X., Lu J., Kulbokas E.J., Golub T.R., Mootha V., Lindblad-Toh K., Lander E.S., Kellis M., Lu J., Kulbokas E.J., Golub T.R., Mootha V., Lindblad-Toh K., Lander E.S., Kellis M., Kulbokas E.J., Golub T.R., Mootha V., Lindblad-Toh K., Lander E.S., Kellis M., Golub T.R., Mootha V., Lindblad-Toh K., Lander E.S., Kellis M., Mootha V., Lindblad-Toh K., Lander E.S., Kellis M., Lindblad-Toh K., Lander E.S., Kellis M., Lander E.S., Kellis M., Kellis M. Systematic discovery of regulatory motifs in human promoters and 3′ UTRs by comparison of several mammals. Nature. 2005;434:338–345. doi: 10.1038/nature03441. [DOI] [PMC free article] [PubMed] [Google Scholar]
- Xuan Z., Zhao F., Wang J., Chen G., Zhang M.Q., Zhao F., Wang J., Chen G., Zhang M.Q., Wang J., Chen G., Zhang M.Q., Chen G., Zhang M.Q., Zhang M.Q. Genome-wide promoter extraction and analysis in human, mouse, and rat. Genome Biol. 2005;6:R72. doi: 10.1186/gb-2005-6-8-r72. [DOI] [PMC free article] [PubMed] [Google Scholar]
- Yuan G.C., Liu Y.J., Dion M.F., Slack M.D., Wu L.F., Altschuler S.J., Rando O.J., Liu Y.J., Dion M.F., Slack M.D., Wu L.F., Altschuler S.J., Rando O.J., Dion M.F., Slack M.D., Wu L.F., Altschuler S.J., Rando O.J., Slack M.D., Wu L.F., Altschuler S.J., Rando O.J., Wu L.F., Altschuler S.J., Rando O.J., Altschuler S.J., Rando O.J., Rando O.J. Genome-scale identification of nucleosome positions in S. cerevisiae. Science. 2005;309:626–630. doi: 10.1126/science.1112178. [DOI] [PubMed] [Google Scholar]
- Zhang W., Morris Q.D., Chang R., Shai O., Bakowski M.A., Mitsakakis N., Mohammad N., Robinson M.D., Zirngibl R., Somogyi E., Morris Q.D., Chang R., Shai O., Bakowski M.A., Mitsakakis N., Mohammad N., Robinson M.D., Zirngibl R., Somogyi E., Chang R., Shai O., Bakowski M.A., Mitsakakis N., Mohammad N., Robinson M.D., Zirngibl R., Somogyi E., Shai O., Bakowski M.A., Mitsakakis N., Mohammad N., Robinson M.D., Zirngibl R., Somogyi E., Bakowski M.A., Mitsakakis N., Mohammad N., Robinson M.D., Zirngibl R., Somogyi E., Mitsakakis N., Mohammad N., Robinson M.D., Zirngibl R., Somogyi E., Mohammad N., Robinson M.D., Zirngibl R., Somogyi E., Robinson M.D., Zirngibl R., Somogyi E., Zirngibl R., Somogyi E., Somogyi E., et al. The functional landscape of mouse gene expression. J. Biol. 2004;3:21. doi: 10.1186/jbiol16. [DOI] [PMC free article] [PubMed] [Google Scholar]
- Zhang H., Roberts D.N., Cairns B.R., Roberts D.N., Cairns B.R., Cairns B.R. Genome-wide dynamics of Htz1, a histone H2A variant that poises repressed/basal promoters for activation through histone loss. Cell. 2005;123:219–231. doi: 10.1016/j.cell.2005.08.036. [DOI] [PMC free article] [PubMed] [Google Scholar]
- Zheng M., Barrera L.O., Ren B., Wu Y., Barrera L.O., Ren B., Wu Y., Ren B., Wu Y., Wu Y. Proceedings of the American Statistical Association, Statistical Computing Section. American Statistical Association; Alexandria, VA: 2005. ChIP-chip: Data, model, and analysis. [Google Scholar]