

Abstract
Bok/Mtd (Bcl-2-related ovarian killer/Matador) is considered a pro-apoptotic member of the Bcl-2 family. Though identified in 1997, little is known about its biological role. We have previously demonstrated that Bok mRNA is upregulated following E2F1 over-expression. In the current work, we demonstrate that Bok RNA is low in quiescent cells and rises upon serum stimulation. To determine the mechanism underlying this regulation, we cloned and characterized the mouse Bok promoter. We find that the mouse promoter contains a conserved E2F binding site (−43 to −49) and that a Bok promoter-driven luciferase reporter is activated by serum stimulation dependent on this site. Chromatin immunoprecipitation assays demonstrate that endogenous E2F1 and E2F3 associate with the Bok promoter in vivo. Surprisingly, we find that H1299 cells can stably express high levels of exogenous Bok. However, these cells are highly sensitive to chemotherapeutic drug treatment. Taken together these results demonstrate that Bok represents a cell cycle-regulated pro-apoptotic member of the Bcl-2 family, which may predispose growing cells to chemotherapeutic treatment.
The E2F family of transcription factors has key roles in regulating the G1/S transition (1–4). There are nine E2F members identified, so far (5–15). This family can be divided into three distinct groups based on both structure and function. E2F1, 2 and 3A make up the first distinct group. Structurally, a long N-terminal region, of unclear function, distinguishes these E2Fs. They also contain a cyclin A binding domain important for their down regulation in S phase (16–18). At the C-terminus, each possesses a potent transcriptional activation domain that contains an Rb binding motif (5,8,10,11). Functionally, these E2Fs appear necessary for cell cycle progression (3,19,20), they are primarily expressed at the G1/S boundary (3,7,21–28) and they potently drive S phase when expressed in otherwise quiescent rodent fibroblast (1,2,29,30).
In contrast, members of the second group of E2Fs (3B, 4 and 5) lack the N-terminal region and are expressed ubiquitously through the cell cycle (31). They can activate transcription of G1/S genes when over expressed in rodent fibroblast, particularly E2F3B (32), but do so less efficiently than E2F1-3A (2,29). These E2Fs appear essential to maintain growth arrest (33,34) and contribute to differentiation (34,35). Mechanistically these E2Fs may primarily serve to tether Rb to E2F-regulated promoters during G0 (33,35), and may also serve to generate an initial pulse of E2F activity that is subsequently amplified by activating the transcription of the more potent E2F1, 2 and 3A.
Finally, E2F6, 7 and 8 represent the third group. These E2Fs appear to lack the transcriptional activation/Rb binding domain present in other E2Fs and serve exclusively to repress transcription via interaction with transcriptional repressors (6,12–15,36,37). For example, E2F6 binds to transcriptional co-repressors due to its ability to bind polycomb protein molecules and generally serves to repress growth (36).
Apoptosis or programmed cell death is an important process for the maintenance of tissue homeostasis and the prevention of diseases such as cancer. While the E2F family is clearly implicated in the control of cell cycle there is also extensive evidence that E2Fs play a critical role in the regulation of programmed cell death (29,38–40). A number of targets in E2F-regulated cell death have been identified and these include members of the Bcl-2 family (38,41–43). The Bcl-2 family of proteins consists of different anti- and pro-apoptotic members that mediate cytochrome C release from mitochondria and thus play important roles in the “decision” step of the intrinsic apoptotic pathway (44,45). Bok, a pro-apoptotic member of the Bcl-2 family, was first cloned in a yeast two hybrid screen of an ovarian cDNA library for proteins that interacted with Mcl-1, BHRF1 and Bfl-1 (46). The mouse homolog (Mtd) was identified bioinformatically (47). Bok contains Bcl-2 homology domains (BH1, 2, 3) and can heterodimerize with Mcl-1, BHRF-1 and Bfl-1, but not Bcl-2 or Bcl-xl (46–48). Bok can induce apoptosis in a variety of cell types (46–51) and this activity is inhibited by Mcl-1, BHRF-1 and Bfl-1, but not Bcl-2 or Bcl-xl. In the present work, we investigated the transcriptional regulation of Bok and its potential roles in cell cycle. We find that Bok is an E2F-regulated gene activated by serum stimulation, and that it may function as a checkpoint sensitizing growing cells to stress-induced apoptosis.
EXPERIMENTAL PROCEDURES
Cloning the Bok promoter
Approximately 5×10⁵ plaques from a Sau3A I partially digested 129SV mouse genomic library in λFIXII (Stratagene) were screened in duplicate at high stringency with a mixture of human and mouse Bok cDNA probes. Following plaque purification, seven purified positive plaques were identified. Phage DNA was extracted from plate lysates using the Qiagen MIDI lambda kit according to manufacturer’s specifications. Not I digestion of the phage DNA indicated that each clone had a different sized insert, each in the ~15–20 kb range. Restriction digestion and Southern blotting showed that the clones were unique and covered the entire Bok genomic locus. Each of the phage DNAs was then digested with NotI to excise the entire insert for cloning into pBluescript (pBS). In addition, based on differential hybridization patterns, phage DNAs were also digested with Xho I or Sst I to subclone smaller fragments into pBS. Bluescript clones containing inserts were sequenced with T3 and T7 promoter to confirm the ends of each clone against the published genomic sequence (NT_039173).
Plasmids
Mouse Bok promoters were generated by digestion of pBS-13S2 with Sst I and ligated into pGL3 basic. Initial PCR primers were design to amplify 331 bp (−244/+87) of our sequenced Bok promoter, which are numbered relative to the transcriptional start site. The forward (192 F) and reverse (141 R) PCR primers for the Bok promoter were 5’-GGTACCAGAACTTGTGCTGGCCTTTCT-3’ and 5’-AAGCTTAGTTCTGGTTTCAGGACCCGC-3’, respectively. The forward primer added a Kpn I site, and the reverse added a Hind III site to facilitate sub-cloning. The E2F binding site mutant of the Bok promoter was generated by site-directed mutagenesis with PCR. The initial reaction was done using 192 F and 192 R (5’-TCCGCCGGTCTTCCATCGCGC-3’); a second reaction used primer 141 F (5’-CGCGATGGAAGACCGGCGGA-3’) and 141 R. The PCR products from these reactions, 192 bp and 141 bp respectively, were band purified, phenol/chloroform extracted and ethanol precipitated. They were then resuspended in water, combined, and used as template in another PCR reaction using the flanking primers 192 F and 141 R. The resulting PCR product was inserted in pCRII-TOPO, followed by digestion with Kpn I and Hind III (to excise PCR insert). Insert was then band purified and ligated to pGL3 luciferase vector. The E2F1 mutant constructs, E2F1 (1–284) and E2F1 (Eco 132) have been previously described (52,53).
Cell culture
Mouse NIH 3T3 fibroblasts were cultured in Dulbecco’s Modified Eagles Medium (DMEM) supplemented with 5% calf serum. The H1299 lung cancer cell line was cultured in DMEM supplemented with 5% fetal bovine serum. H1299 cells that constitutively express Flag-Bok fusion protein were obtained by transfecting with pcDNA3-Flag-Bok (a gift from Gabriel Nunez, Univ. of Michigan) and selecting for transformants in 400 μg/ml G418. G418-resistant lines were screened for expression of Flag-Bok. Adenoviruses were described previously (54) and were titered by plaque assay. Cell cycle parameters were measured by fixing cells with 70% ethanol-PBS, staining with propidium iodide (PI) and analyzing by FACS, using ModFit.
Biochemical assays
Transfections were performed using LipofecAMINE PLUS™ Reagent from Invitrogen with test DNA totaling 2.85 μg of DNA per 60-mm dish. Transfections included 100 ng of expression plasmids (pcDNA3-based vectors), 2.5 μg of test construct firefly luciferase reporter plasmid (pGL3, Promega), and 250 ng of renilla luciferase reporter plasmid (pRL-TK, Promega). Cells were harvested 48 hrs after transfection, and luciferase assays were performed using the Dual-Luciferase Reporter Assay System following the manufacturer’s protocol (Promega). Experiments were done in duplicate or triplicates, and the relative activities and standard deviation values were determined. To control for transfection efficiency, firefly luciferase values were normalized to the values for renilla luciferase. Western blots were performed as previously described (39) using monoclonal antibody against Flag epitope (F3165, Sigma) or against PARP antibody (Cell signaling 9542). Western blots were stripped and re-probed with an antibody to actin (A5441, Sigma) to ensure equivalent loading.
RT-PCR
Isolation of total RNA was done using the RNeasy mini kit (Qiagen 74104) as recommended by manufacturer. Total RNA was primed with random hexamers and cDNA created using SuperScrip™ First Strand Synthesis System for RT-PCR (Invitrogen 11904-018). PCR primers were designed to amplify 490 bp. The forward and reverse primers were 5’-CGCTCGCCCACAGACAAGGAG-3’ and 5’-TCTGTGCTGACCACACACTTG-3’.
Chromatin Immunoprecipitation (ChIP)
ChIP assays were performed as previously described (39,55–59). Briefly, asynchronously growing NIH 3T3 cells were treated with formaldehyde to create protein-DNA cross-links, and the cross-linked chromatin was then extracted, diluted with ChIP buffer, and sonicated. Sonicated chromatin was divided into equal samples for immuno-precipitation. Antibodies used included E2F1 (sc-193X), E2F3 (sc-878X), and IgG (sc-2027) (from Santa Cruz Biotechnology).
Results
Bok mRNA is induced by E2F1 over-expression and by serum stimulation
In a previous microarray screen (54), we identified Bok as a potential E2F1 target gene. To confirm this observation, we tested if over-expression of E2F1 would correlate with increased expression of Bok mRNA. NIH 3T3 cells were brought to quiescence by 48-hrs incubation in 0.5% calf serum. Cells were then stimulated with 10% fetal calf serum or were infected with ten plaque-forming units of the indicated adenovirus per cell. Fig. 1A highlights the observation that Bok mRNA is very low in quiescent NIH3T3 fibroblasts (lane 3), but is highly induced following infection with an E2F1-expressing adenovirus (lane 1). Lane 4 reveals that serum treatment, which stimulates quiescent cells to enter S phase, also elevated Bok message (lane 4), suggesting that Bok is E2F and cell cycle regulated. Data provided in Fig. 1B confirm the cell cycle status of treated cells (Fig. 1A).
Figure 1. Bok mRNA is activated by E2F1 or serum stimulation.

NIH 3T3 cells were brought to quiescence by 48-hrs incubation in 0.5% calf serum. Cells were then stimulated with 10% fetal calf serum or were infected with ten plaque-forming units of the indicated adenovirus per cell. Cells were harvested after 24 hrs (serum) or 30 hrs (virus). (A) Twenty microgram of total RNA were subjected to Northern analysis using the indicated cDNA probes. (B) NIH 3T3 cells were treated as above, fixed with 70% ethanol-PBS, stained with PI and analyzed by FACS.
The Bok promoter contains a conserved E2F binding sequence central to its cell cycle regulation
To understand how Bok is regulated in an E2F/cell cycle-dependent manner, we compared the genomic sequences of human (AC110299) and mouse Bok (NT_039173). To obtain authentic Bok genomic sequence from mouse, we screened a lambda phage library using a mixture of human cDNA probes and mouse UTR Bok probes. Fig 2A shows a schematic of the various clones obtained. One of the sub-clones, 13S2, which contains the first two Bok exons and over 900 bp of upstream promoter region, was sequenced. Comparison of the mouse and human Bok 5’ regions (shown in Fig. 3) revealed significant sequence homology within the first exon (non-coding) and in a region −244 upstream of the putative transcriptional start site in mouse (60).
Figure 2. Overlapping subclones in pBS encompassing the entire Bok genomic locus.

(A) Subclones were excised from the phage clones with Sst I (S), Xho I (X) or Not I (N). Not I subclones represent the entire insert of the phage clones, whereas Sst I and Xho I subclones contain only part of the original phage clone. Numbering is relative to the Mus musculus chromosome 1 genomic contig NT_039173.2, which contains the Bok locus. Solid boxes indicate exons. Exon 1 is noncoding. The ATG start codon is located at position 8083483 in exon 2. The stop codon is located at position 8092198 in exon 5. (B) The pBS-13S2 was further subcloned into pGL3 luciferase vector using Sst I, Sma I or Xba I. These subclones contain the Bok promoter region and the longest four putative E2F binding sites marked by black circles.
Figure 3. Evolutionary conserved E2F binding site.

An alignment between the mouse (NT_039173) and human (AC110299) Bok gene sequences using MegAlign (DNASTAR, Inc) showed a conserved putative E2F binding site that extends from position −42 to −49 relative to the putative transcriptional start site in the mouse sequence. Shaded blocks indicate sequence identity of at least five base pairs. Boxed areas indicate putative transcription factor binding sites identified by MatInspector (Genomatix). The highlighted G at +1 in the mouse sequence indicates the putative transcription start site based on NCBI annotations (60).
Crude deletion analysis localized the promoter to −244/+87 (not shown). Potentially important motifs within this region include numerous SP1 binding sites and, most importantly, a conserved E2F1 consensus-binding site. We used PCR to generate a luciferase reporter vector using the mouse genomic sequence from −244/+87. To examine the role of the conserved E2F1 site spanning from position −43 to −49, we also generated a mutated version of the −244/+87 construct in which the E2F1 site was rendered nonfunctional. Fig. 4A shows a schematic representation of the constructs generated. They differ in that the consensus E2F binding site CGCGCGGGAAGACCGGCGGA (wild type) is changed to CGCGATGGAAGACCGGCGGA (mutant).
Figure 4. The Bok promoter is activated by addition of serum dependent upon a conserved E2F binding site.

(A) Schematic representation of the Bok promoter containing wild type (closed circle) or mutated (X) E2F binding site. These fragments were then cloned into pGL3. (B) NIH 3T3 cell were transfected with the WT or MUT −244/+87 Bok promoter luciferase construct and then brought to quiescent by 48-hrs incubation with 0.5% calf-serum. Following starvation cells were stimulated with 10% fetal calf serum and harvested every 6-hrs and assayed for luciferase activity. (C) Cells cycle progression of NIH 3T3 cells after treatment as in B. Cells were fixed with 70% ethanol-PBS, stained with PI and analyzed by FACS.
To characterize the activity of the cloned Bok promoter throughout the cell cycle, NIH 3T3 cells were transfected with Bok −244/+87 WT or MUT promoter/reporter. Cells were brought to quiescence by incubation with 0.5% calf serum for 48 hrs and were then serum stimulated with 10% fetal calf serum and harvested every 6 hrs. In parallel, cells were fixed with 70% ethanol-PBS, stained with PI and analyzed by FACS to determine cell cycle status. Fig. 4B shows that the activity of the WT Bok promoter is maximal at 6 and 12 hrs after addition of serum corresponding to the mid to late G1 phase of the cell cycle (Fig 4C). This pattern of regulation is very typical of an E2F1-regulated gene. In contrast, the activity of the MUT Bok promoter is unaffected by serum addition. This supports the conclusion that the conserved E2F binding site at −49/−43 is central to the cell cycle regulation of Bok.
Activation of the Bok promoter is not specific to E2F1
E2F1 is the most potent inducer of apoptosis amongst the E2F family of proteins and appears essential for E2F-induced apoptosis (29,61). Since Bok is a known pro-apoptotic protein, we anticipated that E2F1 might be a specific activator of Bok. To test this idea, we compared the ability of various E2Fs to induce the Bok luciferase reporter. We co-transfected the wild type (Bok −244/+87 WT) promoter, or the E2F site mutant (Bok −244/+87 MUT) in the presence and absence of exogenous E2F proteins (Fig 5A). E2Fs 1, 2 and 3B expression each led to promoter activation. This result suggests that activation of Bok is not specific to E2F1. The growth-repressing members of the E2F family E2F4, 5 and 6 did not significantly activate the promoter and neither did two E2F1 mutants. E2F11–283 is a C-terminally truncated version of E2F1 (52) that does not have a transcriptional activation domain, indicating that activation of the Bok promoter requires the activation domain. Likewise, the DNA binding E2F1 mutant, Eco 132 (53), was unable to activate transcription. Thus, DNA binding is required for activation of the Bok promoter.
Figure 5. S phase promoting members of the E2F family activate the Bok promoter.

(A) E2F binding site MUT and WT Bok promoters were co-transfected with expression vectors for different members of the E2F family and their ability to activate the Bok promoter was measured. (B) Same as in A except focusing on strongest S phase promoting E2Fs. E2F3A is the most potent activator of the Bok promoter.
Since E2F1 and E2F3B were the most potent activators of the Bok promoter in the comparison of Fig. 5A, we focused experiments comparing E2F1, E2F3A and E2F3B. Together Fig. 5A and 5B reveal that E2F3A is the most potent inducer of the Bok promoter followed by E2F3B, E2F1 and E2F2. Although the importance of this pattern of activity is not certain, it is clear that E2F1 is unlikely to be the sole regulator of Bok. The observation that over-expression of E2Fs can stimulate the MUT Bok reporter suggests that additional functional E2F binding sites may exist in the promoter, if E2F levels are sufficiently high.
E2F1 and E2F3 associate with the Bok promoter in vivo
In light of the fact that E2F1 and E2F3A potently activate the Bok promoter in context of a luciferase reporter, we wanted to determine whether E2Fs associate with the Bok promoter in vivo. For this, we turned to chromatin immunoprecipitation assay of asynchronous NIH 3T3 cells. As shown in Fig. 6, using Bok specific oligonucleotide primers that span −244 to +87 of the murine Bok gene, E2F1 and E2F3 each associate with the Bok promoter in vivo, in agreement with the aforementioned luciferase result. The fact that immunoprecipitation with a control antibody (anti-IgG) results in absence of signal from the Bok promoter, demonstrates the specificity of the interaction between E2Fs and the Bok promoter. In addition, the lower panel in Fig. 6 reveals that the murine albumin promoter, which does not possess E2F sites and has been shown not to associate with E2F (55), is not immunoprecipitated with E2F antibodies under identical conditions.
Figure 6. E2F1 and E2F3 associate with the Bok promoter in vivo.
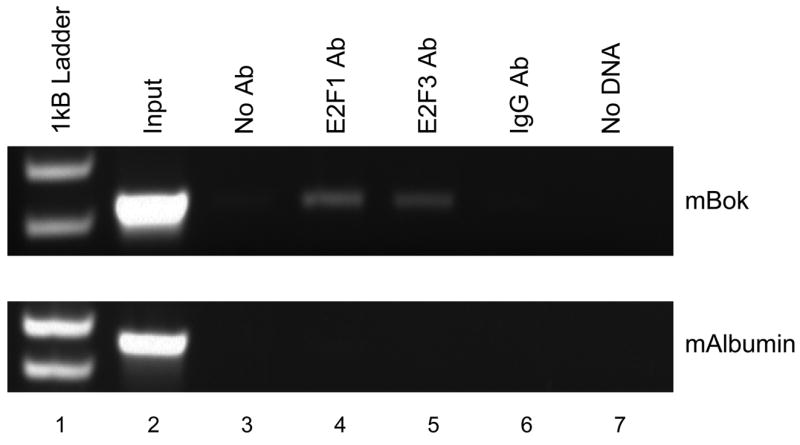
Asynchronously growing NIH 3T3 were subject to chromatin immunoprecipitation analysis with antibodies against E2F1 (lane 4), E2F3 (lane 5), or IgG (lane 6). Following DNA purification, samples were subject to PCR with primers designed to amplify the Bok promoter or the albumin promoter as control.
Bok expression sensitizes cells to flavopiridol-induced apoptosis
To determine the functional effect of increased Bok expression, we created H1299 cells lines that constitutively express a Flag epitope-tagged version of Bok. Expression of the introduced Flag-Bok transgene was confirmed via RT-PCR and Western blot (Fig. 7A and 7B). Surprisingly, constitutive expression of Flag-Bok did not necessarily induce spontaneous apoptosis in these cells, and several lines were developed. Clone #8 expressed the highest level of Flag-Bok and was this used for subsequent experiments. The Flag-Bok expressing cells grew at the same rate as parental H1299s (Fig 7C).
Figure 7. Stable over-expression of Flag-Bok protein sensitizes H1299 cells to flavopiridol-induced apoptosis.


(A) Flag-Bok expressing H1299 cell lines were generated by transfection with pcDNA3-Flag-Bok followed by selection with G418 (see Methods). G418-resistant colonies emerged with same efficiency as control pcDNA3. Of the first six lines emerging from this screen three expressed Flag-Bok as measured by anti-Flag Western blot. Clone #8 was used for subsequent experiments. (B) Total RNA was harvested from indicated cell lines and subjected to RT-PCR. 1 μg or 10 ng of RNA were used as template in the reverse transcriptase step, then 1/20 of the RT reaction was used for PCR with radioactive dNTPs for 25 cycles. (C) H1299 and H1299 Flag-Bok cell line #8 were plated in 60-mm plates and their growth rate/survival was measured by trypsinization, followed by counting trypan blue excluding cells after treatment with DMSO control or flavopiridol [200 nM]. (D) In parallel, sub-G1 DNA content was measured by propidium iodide (PI) labeling after flavopiridol treatment. (E) Protein extracts of H1299 or H129 Flag-Bok cell lines after treatment of flavopiridol were harvested in 24 hr intervals and Western blotted for PARP.
In light of the observation that Bok over-expression alone is not sufficient for apoptosis induction, we sought to determine whether over-expression of Bok sensitizes cells to stress-induced apoptosis. To this end, the H1299-Flag-Bok #8 cell line (as well as parental H1299s) were assayed for viability after treatment with the cyclin-dependent kinase inhibitor flavopiridol, which we have previously shown to induce apoptosis in H1299 cells (39,40). Fig. 7A reveals that flavopiridol-induced loss of viability is greatly accelerated in Bok expressing cells. Similar results were obtained with other chemotherapeutic agents (not shown).
We next sought to verify our viability assay in a more direct measurement of apoptosis induction. The H1299–Flag-Bok cell line and control H1299s were treated with flavopiridol, harvested at 24 hrs intervals, stained with propidium iodide (PI) and assayed for sub-G1 DNA content via flow cytometry. In agreement with low viability, there was a significant increase in sub-G1 content within the flavopiridol treated H1299-Flag-Bok cell lines in comparison to the parental controls (Fig. 7D). For further confirmation, we conducted Western blot analysis for the presence of poly-ADP ribose polymerase (PARP) cleavage (a measurement of apoptosis) within the same experiment. As expected, both H1299-Flag-Bok and parental H1299s displayed cleavage of PARP, however, PARP cleavage began 24 hrs post flavopiridol treatment and was maximal at 48 hrs in the Bok expressing cell line, whereas PARP cleavage was noticeable 48 hrs and maximal at 72 hrs within the H1299 parental controls (Fig. 7E). Taken together, these data suggest that expression of Bok sensitizes cells to rapid apoptosis induction.
Discussion
In the current work we show that the Bok promoter is activated by serum addition in a manner dependent upon a conserved E2F site in the promoter. The Bok promoter is also activated by over-expression of S phase promoting members of the E2F family. We also show by ChIP assay that E2F1 and E2F3 both bind the Bok promoter region in vivo. Finally we find that Bok over-expression sensitizes to flavopiridol-induced apoptosis.
Our understanding of the interactions between the E2F and Bcl-2 families of proteins that modulate survival are growing increasingly complex and interwoven. This is the first example of a pro-apoptotic member of the Bcl-2 family found to have its expression tied to cell cycle progression, although this is not the first example of regulation of Bcl-2 family by E2F1 in its apoptotic role. It has been known for some time that E2F1 can repress the expression of Bcl-2 (42) and, we have demonstrated that E2F1 can directly repress the Mcl-1 promoter (38,54). Other laboratories have found that several pro-apoptotic BH3-only members of the Bcl-2 family (PUMA, Noxa, Bim, and Hrk/DP5) are also activated by E2F1 (43). In the current work, we find that E2F1 can directly activate expression of Bok. Since E2F1 is a well-characterized inducer of apoptosis its effects on Mcl-1, PUMA, Noxa, Bim, Hrk/DP5 and Bok are logical. The net consequence of over-active E2F1 is thus to tip the balancing act within the Bcl-2 family toward apoptosis.
The transcriptional activation of Bok at the G1/S boundary by serum stimulation was not anticipated since Bok is considered a pro-apoptotic member of the Bcl-2 family. Bok might have a number of roles at G1/S. Bok might serve a specific G1/S or S phase function. For example, recent work has shown that BID (a pro-apoptotic Bcl-2 protein) can induce an S phase arrest following its phosphorylation by ATM (62–64). While we cannot formally exclude the possibility that Bok has a specific G1/S function, we have performed extensive siRNA and shRNAi experimentation aimed at depleted proliferating cells of Bok. Though we are confident in our ability to deplete cells of 80–90% of endogenous Bok mRNA or exogenous protein, we obtained no convincing evidence that Bok deficiency affects cell cycle progression. Of course these studies are hampered by the lack of good quality antibody to Bok, and so, it is possible that future studies will find an additional role for Bok in cell cycle
An alternative role for Bok induction at the G1/S boundary would be to serve as a checkpoint. G1/S phase cells are known to be highly sensitive to apoptosis induction and it reasonable that expression of Bok might mediate this sensitivity, at least in part. This model would lead to the prediction that cells expressing exogenous Bok would survive and grow normally, but would be sensitive to apoptosis-inducing stresses. Indeed, this appears to be the case since Flag-Bok expressing H1299 cell lines are obtained with high efficiency and they grow normally, yet they are much more readily killed by treatment with flavopiridol, as well as by other death-inducing agents (not shown). Taken together the results in this manuscript demonstrate that Bok is a cell cycle regulated member of the Bcl-2 family that serves as a checkpoint sensitizing replicating cells to stress-induced apoptosis.
Acknowledgments
This work was supported by funds from the National Cancer Institute (CA90489, W.D.C.), Minority Supplement to CA090489 (JMR), Department of Defense (National Functional Genomics Pilot Project 12-12990-01-01, W.D.C.) and by the Molecular Biology, Flow Cytometry, Analytical Microscopy, and the Molecular Imaging Core Facilities of the Moffitt Cancer Institute. We also acknowledge Scott Freeman for scientific input and review.
References
- 1.Johnson DG, Schwarz JK, Cress WD, Nevins JR. Nature. 1993;365(6444):349–352. doi: 10.1038/365349a0. [DOI] [PubMed] [Google Scholar]
- 2.Lukas J, Petersen BO, Holm K, Bartek J, Helin K. Mol Cell Biol. 1996;16(3):1047–1057. doi: 10.1128/mcb.16.3.1047. [DOI] [PMC free article] [PubMed] [Google Scholar]
- 3.Leone G, DeGregori J, Yan Z, Jakoi L, Ishida S, Williams RS, Nevins JR. Genes Dev. 1998;12(14):2120–2130. doi: 10.1101/gad.12.14.2120. [DOI] [PMC free article] [PubMed] [Google Scholar]
- 4.Mann DJ, Jones NC. Curr Biol. 1996;6(4):474–483. doi: 10.1016/s0960-9822(02)00515-8. [DOI] [PubMed] [Google Scholar]
- 5.Helin K, Lees JA, Vidal M, Dyson N, Harlow E, Fattaey A. Cell. 1992;70(2):337–350. doi: 10.1016/0092-8674(92)90107-n. [DOI] [PubMed] [Google Scholar]
- 6.Cartwright P, Muller H, Wagener C, Holm K, Helin K. Oncogene. 1998;17(5):611–623. doi: 10.1038/sj.onc.1201975. [DOI] [PubMed] [Google Scholar]
- 7.Sardet C, Vidal M, Cobrinik D, Geng Y, Onufryk C, Chen A, Weinberg RA. Proc Natl Acad Sci U S A. 1995;92(6):2403–2407. doi: 10.1073/pnas.92.6.2403. [DOI] [PMC free article] [PubMed] [Google Scholar]
- 8.Ivey-Hoyle M, Conroy R, Huber HE, Goodhart PJ, Oliff A, Heimbrook DC. Mol Cell Biol. 1993;13(12):7802–7812. doi: 10.1128/mcb.13.12.7802. [DOI] [PMC free article] [PubMed] [Google Scholar]
- 9.He Y, Armanious MK, Thomas MJ, Cress WD. Oncogene. 2000;19(30):3422–3433. doi: 10.1038/sj.onc.1203682. [DOI] [PubMed] [Google Scholar]
- 10.Kaelin WG, Jr, Krek W, Sellers WR, DeCaprio JA, Ajchenbaum F, Fuchs CS, Chittenden T, Li Y, Farnham PJ, Blanar MA, et al. Cell. 1992;70(2):351–364. doi: 10.1016/0092-8674(92)90108-o. [DOI] [PubMed] [Google Scholar]
- 11.Lees JA, Saito M, Vidal M, Valentine M, Look T, Harlow E, Dyson N, Helin K. Mol Cell Biol. 1993;13(12):7813–7825. doi: 10.1128/mcb.13.12.7813. [DOI] [PMC free article] [PubMed] [Google Scholar]
- 12.Trimarchi JM, Fairchild B, Wen J, Lees JA. Proc Natl Acad Sci U S A. 2001;98(4):1519–1524. doi: 10.1073/pnas.041597698. [DOI] [PMC free article] [PubMed] [Google Scholar]
- 13.Maiti B, Li J, de Bruin A, Gordon F, Timmers C, Opavsky R, Patil K, Tuttle J, Cleghorn W, Leone G. J Biol Chem. 2005;280(18):18211–18220. doi: 10.1074/jbc.M501410200. [DOI] [PubMed] [Google Scholar]
- 14.de Bruin A, Maiti B, Jakoi L, Timmers C, Buerki R, Leone G. J Biol Chem. 2003;278(43):42041–42049. doi: 10.1074/jbc.M308105200. [DOI] [PubMed] [Google Scholar]
- 15.Di Stefano L, Jensen MR, Helin K. Embo J. 2003;22(23):6289–6298. doi: 10.1093/emboj/cdg613. [DOI] [PMC free article] [PubMed] [Google Scholar]
- 16.Kitagawa M, Higashi H, Suzuki-Takahashi I, Segawa K, Hanks SK, Taya Y, Nishimura S, Okuyama A. Oncogene. 1995;10(2):229–236. [PubMed] [Google Scholar]
- 17.Krek W, Xu G, Livingston DM. Cell. 1995;83(7):1149–1158. doi: 10.1016/0092-8674(95)90141-8. [DOI] [PubMed] [Google Scholar]
- 18.Xu M, Sheppard KA, Peng CY, Yee AS, Piwnica-Worms H. Mol Cell Biol. 1994;14(12):8420–8431. doi: 10.1128/mcb.14.12.8420. [DOI] [PMC free article] [PubMed] [Google Scholar]
- 19.Wu L, Timmers C, Maiti B, Saavedra HI, Sang L, Chong GT, Nuckolls F, Giangrande P, Wright FA, Field SJ, Greenberg ME, Orkin S, Nevins JR, Robinson ML, Leone G. Nature. 2001;414(6862):457–462. doi: 10.1038/35106593. [DOI] [PubMed] [Google Scholar]
- 20.Humbert PO, Verona R, Trimarchi JM, Rogers C, Dandapani S, Lees JA. Genes Dev. 2000;14(6):690–703. [PMC free article] [PubMed] [Google Scholar]
- 21.Adams PD, Kaelin WG., Jr Curr Top Microbiol Immunol. 1996;208:79–93. doi: 10.1007/978-3-642-79910-5_4. [DOI] [PubMed] [Google Scholar]
- 22.Flores AM, Kassatly RF, Cress WD. Oncogene. 1998;16(10):1289–1298. doi: 10.1038/sj.onc.1201633. [DOI] [PubMed] [Google Scholar]
- 23.Hsiao KM, McMahon SL, Farnham PJ. Genes Dev. 1994;8(13):1526–1537. doi: 10.1101/gad.8.13.1526. [DOI] [PubMed] [Google Scholar]
- 24.Ikeda MA, Jakoi L, Nevins JR. Proc Natl Acad Sci U S A. 1996;93(8):3215–3220. doi: 10.1073/pnas.93.8.3215. [DOI] [PMC free article] [PubMed] [Google Scholar]
- 25.Johnson DG, Ohtani K, Nevins JR. Genes Dev. 1994;8(13):1514–1525. doi: 10.1101/gad.8.13.1514. [DOI] [PubMed] [Google Scholar]
- 26.Moberg K, Starz MA, Lees JA. Mol Cell Biol. 1996;16(4):1436–1449. doi: 10.1128/mcb.16.4.1436. [DOI] [PMC free article] [PubMed] [Google Scholar]
- 27.Neuman E, Sellers WR, McNeil JA, Lawrence JB, Kaelin WG., Jr Gene. 1996;173(2):163–169. doi: 10.1016/0378-1119(96)00184-9. [DOI] [PubMed] [Google Scholar]
- 28.Sears R, Ohtani K, Nevins JR. Mol Cell Biol. 1997;17(9):5227–5235. doi: 10.1128/mcb.17.9.5227. [DOI] [PMC free article] [PubMed] [Google Scholar]
- 29.DeGregori J, Leone G, Miron A, Jakoi L, Nevins JR. Proc Natl Acad Sci U S A. 1997;94(14):7245–7250. doi: 10.1073/pnas.94.14.7245. [DOI] [PMC free article] [PubMed] [Google Scholar]
- 30.Kowalik TF, DeGregori J, Schwarz JK, Nevins JR. J Virol. 1995;69(4):2491–2500. doi: 10.1128/jvi.69.4.2491-2500.1995. [DOI] [PMC free article] [PubMed] [Google Scholar]
- 31.Vairo G, Livingston DM, Ginsberg D. Genes Dev. 1995;9(7):869–881. doi: 10.1101/gad.9.7.869. [DOI] [PubMed] [Google Scholar]
- 32.He Y, Cress WD. J Biol Chem. 2002;277(26):23493–23499. doi: 10.1074/jbc.M202629200. [DOI] [PubMed] [Google Scholar]
- 33.Gaubatz S, Lindeman GJ, Ishida S, Jakoi L, Nevins JR, Livingston DM, Rempel RE. Mol Cell. 2000;6(3):729–735. doi: 10.1016/s1097-2765(00)00071-x. [DOI] [PubMed] [Google Scholar]
- 34.Rempel RE, Saenz-Robles MT, Storms R, Morham S, Ishida S, Engel A, Jakoi L, Melhem MF, Pipas JM, Smith C, Nevins JR. Mol Cell. 2000;6(2):293–306. doi: 10.1016/s1097-2765(00)00030-7. [DOI] [PubMed] [Google Scholar]
- 35.Persengiev SP, Kondova II, Kilpatrick DL. Mol Cell Biol. 1999;19(9):6048–6056. doi: 10.1128/mcb.19.9.6048. [DOI] [PMC free article] [PubMed] [Google Scholar]
- 36.Ogawa H, Ishiguro K, Gaubatz S, Livingston DM, Nakatani Y. Science. 2002;296(5570):1132–1136. doi: 10.1126/science.1069861. [DOI] [PubMed] [Google Scholar]
- 37.Logan N, Delavaine L, Graham A, Reilly C, Wilson J, Brummelkamp TR, Hijmans EM, Bernards R, La Thangue NB. Oncogene. 2004 doi: 10.1038/sj.onc.1207649. [DOI] [PubMed] [Google Scholar]
- 38.Croxton R, Ma Y, Song L, Haura EB, Cress WD. Oncogene. 2002;21(9):1359–1369. doi: 10.1038/sj.onc.1205157. [DOI] [PubMed] [Google Scholar]
- 39.Ma Y, Cress WD, Haura EB. Mol Cancer Ther. 2003;2(1):73–81. [PubMed] [Google Scholar]
- 40.Ma Y, Freeman SN, Cress WD. Cancer Biol Ther. 2004;3:12. doi: 10.4161/cbt.3.12.1239. [DOI] [PubMed] [Google Scholar]
- 41.Flinterman M, Guelen L, Ezzati-Nik S, Killick R, Melino G, Tominaga K, Mymryk JS, Gaken J, Tavassoli M. J Biol Chem. 2005;280(7):5945–5959. doi: 10.1074/jbc.M406661200. [DOI] [PubMed] [Google Scholar]
- 42.Eischen CM, Packham G, Nip J, Fee BE, Hiebert SW, Zambetti GP, Cleveland JL. Oncogene. 2001;20(48):6983–6993. doi: 10.1038/sj.onc.1204892. [DOI] [PubMed] [Google Scholar]
- 43.Hershko T, Ginsberg D. J Biol Chem. 2004;279(10):8627–8634. doi: 10.1074/jbc.M312866200. [DOI] [PubMed] [Google Scholar]
- 44.Reed JC. Nature. 1997;387(6635):773–776. doi: 10.1038/42867. [DOI] [PubMed] [Google Scholar]
- 45.Cory S, Huang DC, Adams JM. Oncogene. 2003;22(53):8590–8607. doi: 10.1038/sj.onc.1207102. [DOI] [PubMed] [Google Scholar]
- 46.Hsu SY, Kaipia A, McGee E, Lomeli M, Hsueh AJ. Proc Natl Acad Sci U S A. 1997;94(23):12401–12406. doi: 10.1073/pnas.94.23.12401. [DOI] [PMC free article] [PubMed] [Google Scholar]
- 47.Inohara N, Ekhterae D, Garcia I, Carrio R, Merino J, Merry A, Chen S, Nunez G. J Biol Chem. 1998;273(15):8705–8710. doi: 10.1074/jbc.273.15.8705. [DOI] [PubMed] [Google Scholar]
- 48.Hsu SY, Hsueh AJ. J Biol Chem. 1998;273(46):30139–30146. doi: 10.1074/jbc.273.46.30139. [DOI] [PubMed] [Google Scholar]
- 49.Suominen JS, Yan W, Toppari J, Kaipia A. Eur J Endocrinol. 2001;145(6):771–778. doi: 10.1530/eje.0.1450771. [DOI] [PubMed] [Google Scholar]
- 50.Ha SH, Lee SR, Lee TH, Kim YM, Baik MG, Choi YJ. Mol Cells. 2001;12(3):368–371. [PubMed] [Google Scholar]
- 51.Brown CY, Bowers SJ, Loring G, Heberden C, Lee RM, Neiman PE. Dev Comp Immunol. 2004;28(6):619–634. doi: 10.1016/j.dci.2003.09.017. [DOI] [PubMed] [Google Scholar]
- 52.Cress WD, Nevins JR. J Virol. 1994;68(7):4213–4219. doi: 10.1128/jvi.68.7.4213-4219.1994. [DOI] [PMC free article] [PubMed] [Google Scholar]
- 53.Cress WD, Johnson DG, Nevins JR. Mol Cell Biol. 1993;13(10):6314–6325. doi: 10.1128/mcb.13.10.6314. [DOI] [PMC free article] [PubMed] [Google Scholar]
- 54.Ma Y, Croxton R, Moorer RL, Jr, Cress WD. Arch Biochem Biophys. 2002;399(2):212–224. doi: 10.1006/abbi.2002.2761. [DOI] [PubMed] [Google Scholar]
- 55.Wells J, Boyd KE, Fry CJ, Bartley SM, Farnham PJ. Mol Cell Biol. 2000;20(16):5797–5807. doi: 10.1128/mcb.20.16.5797-5807.2000. [DOI] [PMC free article] [PubMed] [Google Scholar]
- 56.Wells J, Graveel CR, Bartley SM, Madore SJ, Farnham PJ. Proc Natl Acad Sci U S A. 2002;99(6):3890–3895. doi: 10.1073/pnas.062047499. [DOI] [PMC free article] [PubMed] [Google Scholar]
- 57.Wells J, Yan PS, Cechvala M, Huang T, Farnham PJ. Oncogene. 2003;22(10):1445–1460. doi: 10.1038/sj.onc.1206264. [DOI] [PubMed] [Google Scholar]
- 58.Rezai-Zadeh N, Zhang X, Namour F, Fejer G, Wen YD, Yao YL, Gyory I, Wright K, Seto E. Genes Dev. 2003;17(8):1019–1029. doi: 10.1101/gad.1068003. [DOI] [PMC free article] [PubMed] [Google Scholar]
- 59.Gyory I, Wu J, Fejer G, Seto E, Wright KL. Nat Immunol. 2004;5(3):299–308. doi: 10.1038/ni1046. [DOI] [PubMed] [Google Scholar]
- 60.Maglott D, Ostell J, Pruitt KD, Tatusova T. Nucleic Acids Res. 2005;33(Database issue):D54–58. doi: 10.1093/nar/gki031. [DOI] [PMC free article] [PubMed] [Google Scholar]
- 61.Kowalik TF, DeGregori J, Leone G, Jakoi L, Nevins JR. Cell Growth Differ. 1998;9(2):113–118. [PubMed] [Google Scholar]
- 62.Gross A. Cell Cycle. 2006;5(6):582–584. doi: 10.4161/cc.5.6.2575. [DOI] [PubMed] [Google Scholar]
- 63.Zinkel SS, Hurov KE, Ong C, Abtahi FM, Gross A, Korsmeyer SJ. Cell. 2005;122(4):579–591. doi: 10.1016/j.cell.2005.06.022. [DOI] [PubMed] [Google Scholar]
- 64.Kamer I, Sarig R, Zaltsman Y, Niv H, Oberkovitz G, Regev L, Haimovich G, Lerenthal Y, Marcellus RC, Gross A. Cell. 2005;122(4):593–603. doi: 10.1016/j.cell.2005.06.014. [DOI] [PubMed] [Google Scholar]