Abstract
Numerous experiments have shown fluid flow to be a potent stimulator of bone cells in vitro, suggesting that fluid flow is an important physical signal in bone mechanotransduction. In fluid flow experiments, bone cells are exposed to both time-dependent (e.g. oscillating or pulsing) and time-independent (e.g. steady) flow profiles. Interestingly, the signaling response of bone cells shows dependence on loading frequency and/or rate that has been postulated to be due to viscoelastic behavior. Thus, the objective of this study was to investigate the time-dependent deformations of bone cells exposed to fluid flow in vitro. Specifically, our goal was to characterize the mechanical response of bone cells exposed to oscillatory flow from 0.5-2.0Hz and steady flow, since these flow profiles have previously been shown to induce different morphological and biochemical responses in vitro. By tracking cell-bound sulfate and collagen coated fluorescent beads of varying sizes, we quantified the normalized peak deformation (peak displacement normalized by the maximum peak displacement observed for all frequencies) and phase lag in bone cells exposed to 1.0Pa oscillating flow at frequencies of 0.5-2.0Hz. The phase lag was small (3~10°) and frequency dependent, while the normalized peak displacements decreased as a weak power law of frequency (~f-0.2). During steady flow, the cells exhibited a nearly instantaneous deformation, followed by creep. Our results suggest that while substantial viscous deformation may occur during steady flow (compared to oscillating flow at ~1Hz), bone cells behave primarily as elastic bodies when exposed to flow at frequencies associated with habitual loading.
Keywords: Viscoelastic, Cell mechanics, Bone, Osteoblast, Fluid flow
INTRODUCTION
It is well accepted that the mechanical environment of bone can regulate its structure and function. However, the process by which bone cells detect mechanical stimuli and transduce them into biochemical signals (mechanotransduction) remains elusive. Nonetheless, numerous experiments have shown fluid flow to be a potent stimulator of bone cells in vitro, suggesting that fluid flow is an important physical signal in bone mechanotransduction (Cowin et al. 1995; Weinbaum et al. 1994).
In fluid flow experiments, cells are exposed to dynamic (e.g. oscillating or pulsing) or static (e.g. steady) flow profiles. Interestingly, the signaling response of bone cells exposed to fluid flow has been shown to depend on the flow profile to which the cells are exposed. For example, when exposed to dynamic flow, the percentage of bone cells exhibiting an intracellular calcium response has been shown to decrease with increasing frequency from 0.5-2.0Hz (Jacobs et al. 1998). Exposing bone cells to static versus dynamic flow profiles has also been shown to induce different biochemical and morphological responses (Malone et al. 2007; Mullender et al. 2006; Ponik et al. 2006). This dependence on flow profile has been postulated to be due to viscoelastic behavior (Donahue et al. 2001), since the cells may be deforming more at lower loading rates. However, assessing the extent to which this is occurring based on what is currently understood about cellular viscoelasticity (Alcaraz et al. 2003; Balland et al. 2006; Fabry et al. 2003; Kole et al. 2004; Puig-de-Morales et al. 2001; Shroff et al. 1995; Wilhelm et al. 2003; Yamada et al. 2000) is difficult for several reasons. First, oscillatory fluid shear is a loading paradigm that has not been previously investigated, and may probe viscoelastic phenomena associated with different length and time scales than those measured using techniques previously used to probe cellular viscoelasticity (e.g., microrheology, magnetic twisting cytometry, etc.). Second, there is considerable variation in the reported viscoelastic stiffness in adherent cells at frequencies close to 1Hz (e.g., cells have been characterized as both primarily elastic-like and solid-like), making interpretation of these measurements difficult.
Thus, the objective of this study was to investigate the time-dependent deformations of bone cells exposed to fluid flow in vitro. Specifically, our goal was to characterize the mechanical response of bone cells exposed to oscillatory flow from 0.5-2.0Hz and steady flow, since these flow profiles have previously been shown to induce different morphological and biochemical responses in vitro. Deformations were tracked using fluorescent beads, which have previously been used as displacement markers in cells subjected to substrate stretch (Barbee et al. 1994; Caille et al. 1998) and undergoing migration (Simon and Schmid-Schonbein 1990). During oscillatory flow, we characterized the dependence of phase lag and normalized peak deformation on different flow frequencies. During steady flow, the cells exhibited a nearly instantaneous deformation, followed by creep. Our results suggest that while substantial viscous deformation may occur during steady flow (compared to oscillating flow at ~1Hz), bone cells behave primarily as elastic bodies when exposed to oscillating flow at frequencies associated with habitual loading.
METHODS
Cell Culture and Fluid Flow
MC3T3-E1 osteoblastic cells were cultured in α-MEM (Invitrogen, Carlsbad, CA) media containing 10% fetal bovine serum (ATCC, Manassus, VA) and 1% penicillin-streptomycin (Invitrogen, Carlsbad, CA) at 37°C in a 5% CO2 humidified incubator. 72h prior to experimentation cells were subcultured on quartz slides coated with fibronectin. A ~1.5×10⁸ beads/ml suspension of 1μm diameter sulfate coated, 1μm diameter collagen I coated or 2μm diameter collagen I coated fluorescent polystyrene beads (Molecular Probes, Eugene, OR) was added to each slide. The cells were incubated for ~1h to allow attachment and rinsed with PBS to remove unbound beads (Fig. 1). The beads were incubated in serum-free conditions to minimize the potential for proteins to adsorb onto the surface of the beads before binding to the cell. The incubation time was selected based on preliminary experiments showing beads that appeared to be internalized after this time. The cells were loaded into a previously described parallel-plate flow chamber (Jacobs et al. 1998), and exposed to 10s of sinusoidal oscillatory fluid flow resulting in 1.0Pa peak shear stress at frequencies of 0.5, 1.0, or 2.0Hz, or 10s of steady fluid flow resulting in 1.0Pa shear stress.
Fig. 1.
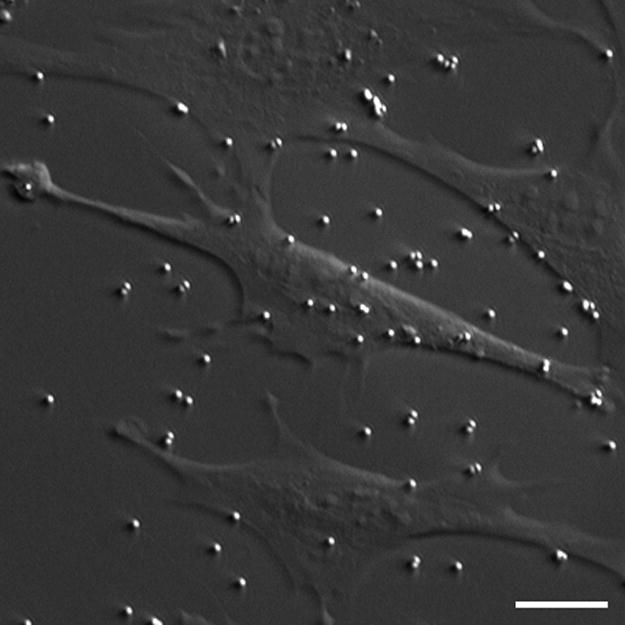
HMC/fluorescent image of MC3T3-E1 osteoblastic cells and 1μm diameter sulfate coated fluorescent beads (shown bound to the membrane as well as to the quartz substrate). The beads were used to track fluid flow-induced deformations. 1μm and 2μm diameter collagen I coated beads were also used in this study. Scale bar: 10μm.
Visualization of Bead Embedding Depth
To determine the degree to which the beads were being internalized into the cells, the cells were incubated for 1.5 hours in the presence of beads and stained with 5μM CMTPX Cell Tracker Red (Molecular Probes, Eugene, OR) according to manufacturer’s protocol. The cells were fixed, and a laser scanning confocal microscope (60× 1.4NA objective) was used to generate three-dimensional image stacks (Fig. 2).
Fig. 2.
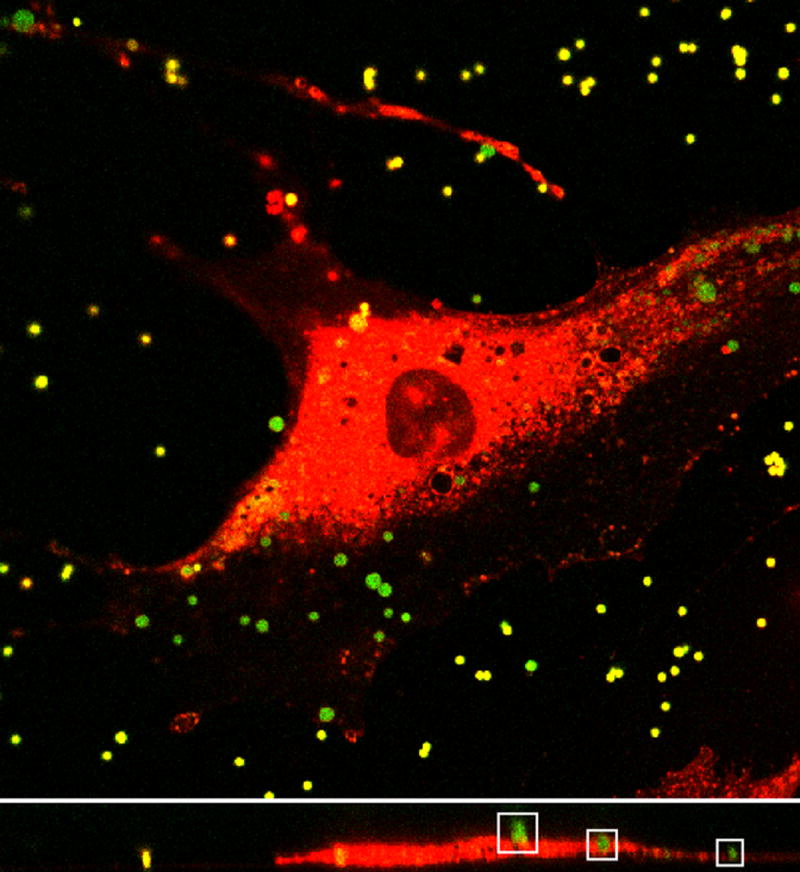
Top: Image plane within a three-dimensional image stack of MC3T3-E1 cell (red) and 1μm diameter sulfate coated fluorescent beads (green) obtained using confocal laser scanning microscopy. Bottom: Representative cross section from image stack. Outlined in the white boxes are three beads with various degrees of internalization. Note that some of the beads look smaller than others because they are slightly out of the cross sectional focal plane.
Determining Bead Position and Flow Rate
Image sequences were obtained of cells in the absence and presence of flow. One bead per cell was imaged at ~30 frames per second. Image kernels that contained the intensity distribution of the beads from the first image in each image sequence were cross-correlated with each subsequent image in the sequence. Bead positions were found by calculating the centroids of the cross-correlation fields (Gelles et al. 1988). In general, the displacement in the direction perpendicular to flow was negligible. Thus, we analyzed bead displacements only in the direction of flow. Flow rate was sampled using an ultrasonic flow meter (Transonic Inc., Ithaca, NY) and converted into shear stress (Jacobs et al. 1998). All measurements were taken within 2h of introducing the beads.
Calculating Displacement Due to Thermal Motions and Active Transport
In the absence of flow, the displacement curves exhibited small fluctuations over short time scales due to noise in the images and/or thermal (Brownian) motions, and large fluctuations over long time scales due to active cell transport/processes. The frame-to-frame displacement was quantified by finding the mean change in bead position between consecutive image frames in the absence of flow. The mean transport velocity was calculated by finding the mean of change in position between the first and last image frames in the absence of flow, divided by the time between the first and last image frames. Note that although we only analyze the mean thermal motion and transport velocity in the direction parallel to flow, these quantities were essentially identical in the directions perpendicular to flow (data not shown).
Correcting for Thermal Motions and Active Transport
Thermal motions and active bead transport caused the reference positions of the beads to change in time (Fig. 3). During oscillatory flow, the reference position at time t was approximated as the mean bead position in the interval [t-T/2, t+T/2], where T is the period of oscillation. In the absence of flow, the reference position was similarly approximated with T=1s. During steady flow, the reference position was the mean position of the bead for the first 10 frames before the onset of flow.
Fig. 3.
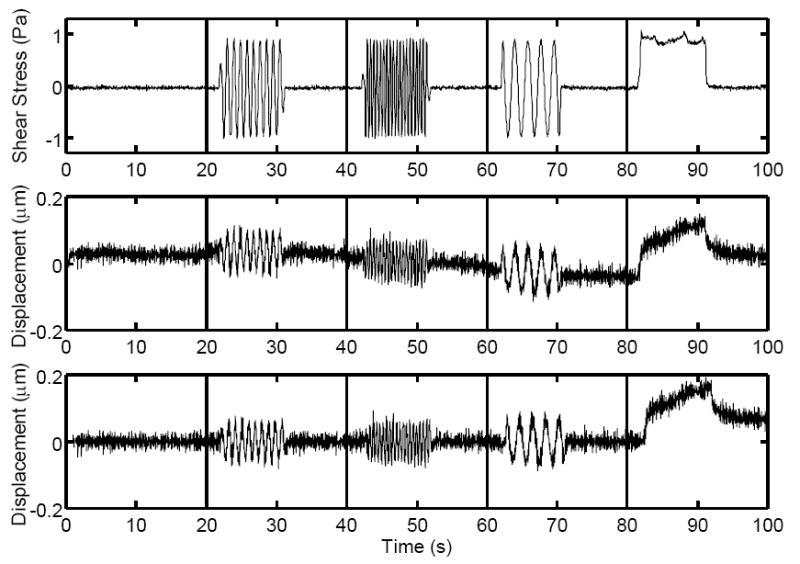
Top: Typical fluid shear stress curve as a function of time during (from left to right) no flow, 1.0Hz oscillatory flow, 0.5Hz oscillatory flow, 2.0Hz oscillatory flow, and steady flow. Middle: Displacement curve resulting from applied fluid shear stress. Small fluctuations due to image noise and/or thermal motions and drift in the displacement curve due to active cell transport can be seen. Bottom: Above displacement curve corrected for active transport by changing the reference position at each time point. Note the frequency-independent peak deformations during oscillatory flow and creep during steady flow.
Calculating Phase Lag and Normalized Peak Displacement During Oscillatory Flow
The peak displacement during oscillatory flow was calculated as half the difference between the maximum and minimum displacement during flow. For each bead, the peak displacement was normalized by the maximum peak displacement observed for the same bead from 0.5-2.0Hz. The phase lag was quantified by fitting the fluid shear stress and bead displacement curves to the functions τ(t)=τ0sin(2πft+ϕτ) and u(t)=u0sin(2πft+ϕu), respectively. Phase lag ϕ was calculated as ϕ=ϕu-ϕτ. Note that for test functions τtest(t)=sin(2πt) and utest(t)=sin(2πt+ϕtest)+rand(t), where rand(t) is a random function from [-1,1], computational studies showed that this method was able to predict ϕtest, on average, to within ~2° when the functions were sampled at 30Hz.
Statistical Analysis
Data are expressed as mean±SE. All experiments were analyzed using one-way ANOVA followed by Fisher’s PLSD. Statistical difference was indicated by a significance of p<0.05. The number of samples was chosen in order to obtain a statistical power of 0.80 based on preliminary experiments. All computation was performed using custom software developed in MATLAB (Mathworks, Natick, MA).
RESULTS
In the absence of flow, there was no significant difference (p=0.177-0.401, n=18-19 cells for each bead type) in the mean frame-to-frame displacement or transport velocity when using 1μm sulfate, 1μm collagen, or 2μm collagen beads (Table 1). When oscillatory flow was applied, the phase lag between the applied fluid shear stress and the resulting displacement exhibited a statistically significant decrease (p<0.0001-0.0061, n=28-46 for each frequency) with increasing frequency (Fig. 4). However, the phase lag was not significantly different (p=0.613-0.886, n=34-41 for each bead type) when using different bead types. The mean normalized peak displacement exhibited a decreasing trend with increasing frequency (Fig. 5) that was statistically significant between 0.5Hz to 1Hz (p=0.003, n=56), and between 0.5Hz to 2Hz (p<0.0001, n=56). Note that the decrease in the mean normalized peak displacement from 1Hz to 2Hz exhibited a low, but not significant, p-value (p=0.062, n=56). No significant dependence (p=0.284-0.967, n=54-57 for each bead type) on bead type was detected. Finally, during steady flow, no statistical difference (instantaneous deformation: p=0.510-0.999, creep rate: p=0.617-0.834, n=5-12 for each bead type) in the instantaneous deformation or creep rate was observed when using different bead types (Fig. 6, Table 2).
Table 1.
Mean frame-to-frame displacement and transport velocity in the absence of flow using different bead types. Using different bead types did not cause a significant difference in any of the measurements.
| 1μm Collagen | 1μm Sulfate | 2μm Collagen | |
|---|---|---|---|
|
Frame to Frame
Displacement (μm) |
0.019±0.001 | 0.017±0.001 | 0.017±0.001 |
|
Transport
Velocity (μm/s) |
0.002±2.85×10⁻⁴ | 0.002±4.49×10⁻⁴ | 0.002±2.49×10⁻⁴ |
Fig. 4.
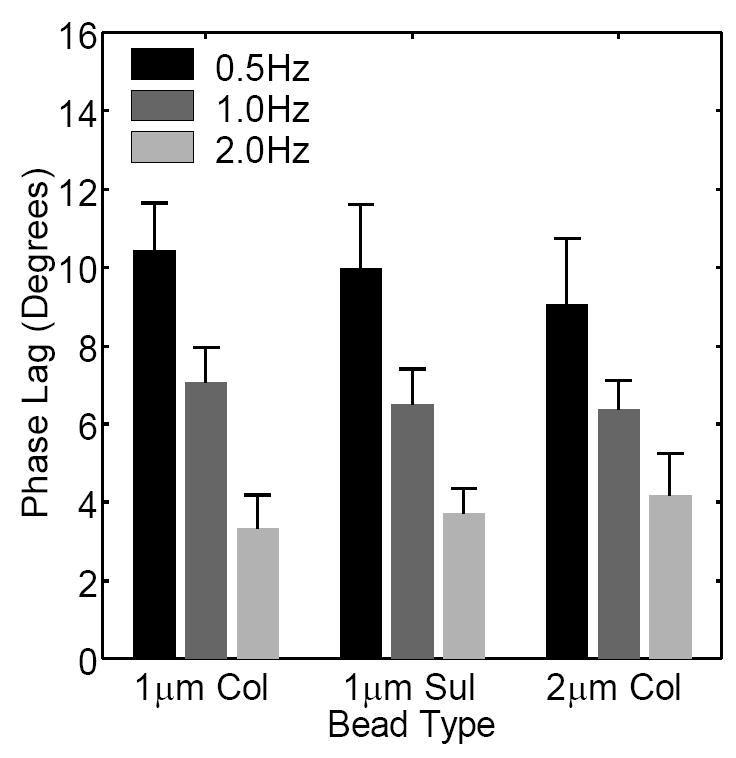
Phase lag between the applied fluid shear stress and the resulting displacement during oscillatory flow measured using different frequencies and bead types. A statistically significant decrease in phase lag with increasing frequency was observed. Using different bead types did not cause a statistical difference. The small magnitudes of the phase lags (3~10°) suggest that viscous effects were small in our experiments.
Fig. 5.
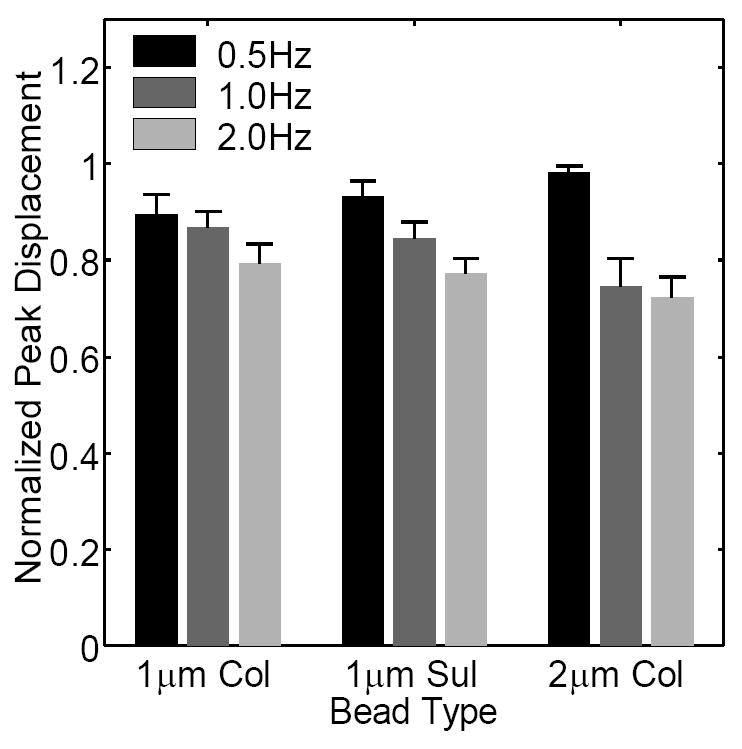
Normalized peak displacements during oscillatory flow measured using different frequencies and bead types. The normalized peak displacements decrease with increasing frequency (statistically significant from 0.5-1Hz and from 0.5-2Hz). No significant dependence on bead type was detected.
Fig. 6.
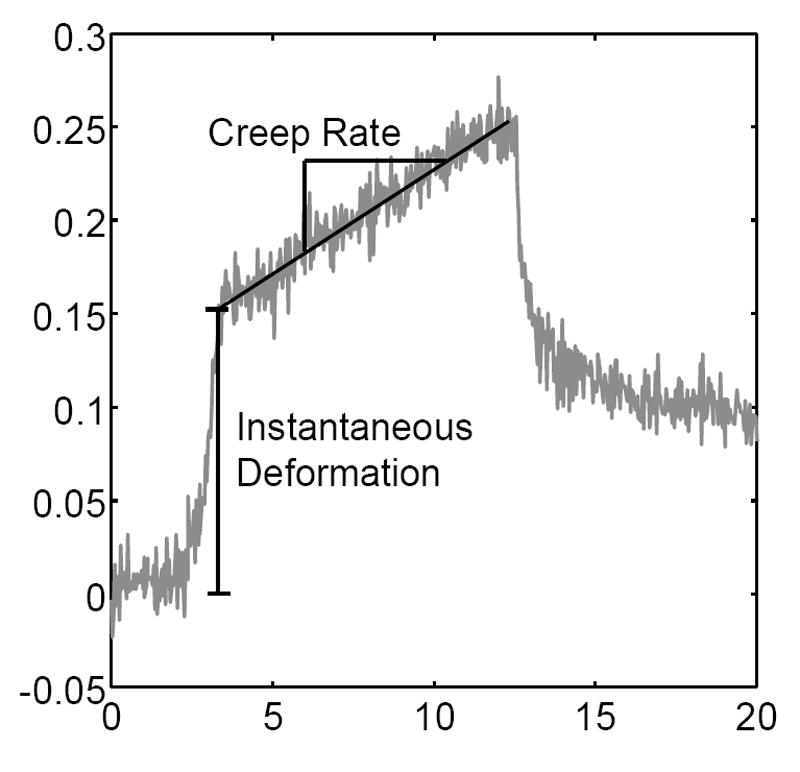
Schematic demonstrating the instantaneous deformation and average creep rate during steady flow.
Table 2.
Quantification of the instantaneous deformation and average creep rate during steady flow. No significant difference in any of the measurements was detected when using different bead types.
| 1μm Collagen | 1μm Sulfate | 2μm Collagen | |
|---|---|---|---|
|
Instantaneous
Deformation (μm) |
0.19±0.16 | 0.13±0.04 | 0.13±0.05 |
|
Creep Rate
(μm/s) |
0.009±0.002 | 0.008±0.002 | 0.007±0.002 |
DISCUSSION
In this study, we tracked the movements of cell-bound fluorescent beads in order to quantify time-dependent deformations in bone cells exposed to flow in vitro. During oscillatory flow, we found that the cells deformed primarily like elastic bodies, in that the phase lags were small, and the normalized peak displacements were only weakly frequency-dependent. Previous experiments have demonstrated that osteoblasts exhibit a decrease in the number of cells exhibiting a flow-induced calcium response with increasing frequency of oscillatory fluid flow from 0.2-2.0Hz (Donahue et al. 2001; Jacobs et al. 1998). This frequency dependence has been attributed to cellular viscoelasticity, in that the cells may be deforming more at lower frequencies/loading rates, allowing the molecular mechanisms which “sense” cellular deformation (e.g. stretch-activated ion channels) to be activated (Donahue et al. 2001). However, the weak frequency dependence of the cellular deformations found in our experiments suggest that the frequency-dependent flow-induced calcium response in bone cells is not attributable to viscoelastic behavior, and instead may be due to other rate-dependent phenomena, such as decreased molecular transport of calcium agonists at higher frequencies (Donahue et al. 2001; Jacobs et al. 1998).
Our results suggest that compared to oscillating flow at frequencies associated with habitual loading (~1Hz), substantial viscous deformation may occur in cells exposed to static flow, or very low frequency dynamic flow. For example, during steady flow, the cells underwent substantial creep (i.e., increasing deformation with time). During oscillatory flow, the normalized displacements decreased weakly with frequency (~f-0.2, Fig. 7). This is consistent with a growing body of evidence that the complex modulus in cells increases as a weak power law of frequency of ~f0.2-0.3 (Alcaraz et al. 2003; Balland et al. 2006; Fabry et al. 2003; Lau et al. 2003; Puig-de-Morales et al. 2001), suggesting that the scaling of ~f-0.2 will be valid over several decades of frequency. In this case, we estimate a normalized displacement of ~2 occurring at 0.01Hz (Fig. 7), suggesting that twice as much deformation will occur at ~0.01Hz compared to ~1Hz.
Fig. 7.
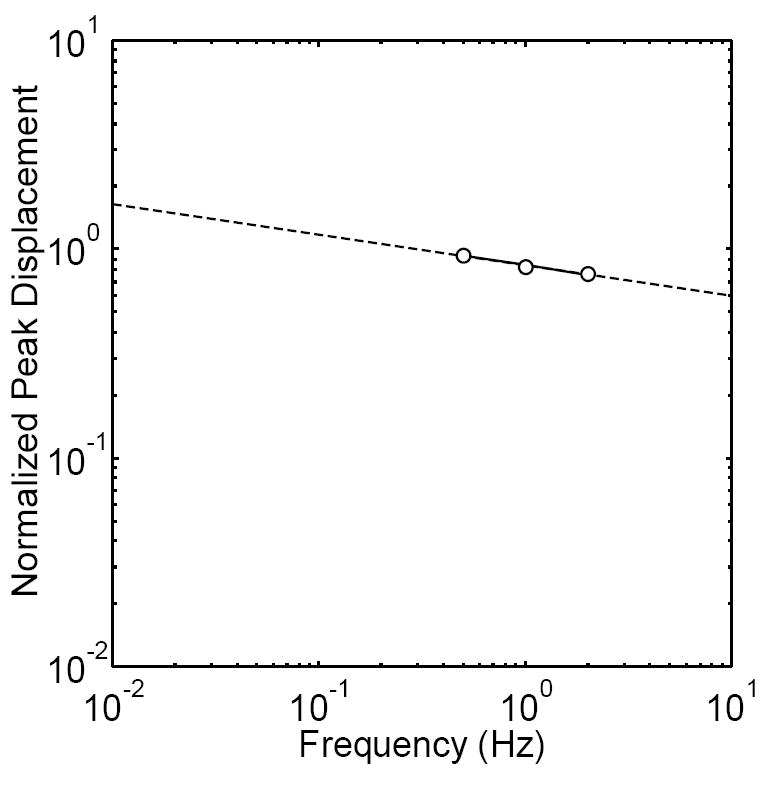
Normalized peak displacement versus frequency on a log-log scale. We found that a linear fit described the data well, indicating a power law dependence on frequency (~f-0.2, R2=0.975). The decrease in the normalized peak displacements as a weak power law of frequency is in good agreement with the increase in complex modulus as a weak power law of frequency previously observed in other cell types. Note that a normalized peak displacement of ~2 occurs at 0.01Hz, suggesting that twice as much deformation will occur at ~0.01Hz compared to ~1Hz.
In this study, we used beads with two different types of functionalized surfaces since previous investigations using magnetic twisting cytometry have found that the cellular mechanical response can depend on the bead coating (Puig-de-Morales et al. 2004; Wang et al. 1993). This is likely due to receptor-mediated structural remodeling upon bead binding (Puig-de-Morales et al. 2004). For all experiments, using beads functionalized with either sulfate groups or collagen I did not cause a significant difference in any of our mechanical measurements. The collagen beads bind integrins (surface receptors which indirectly bind F-actin via linker proteins) and therefore were likely to be coupled to the actin cytoskeleton. The sulfate beads have hydrophobic surfaces and bind membrane proteins noncovalently and nonspecifically. It has been previously shown that when using magnetic twisting cytometry to measure mechanical properties, utilizing beads mechanically coupled to the actin cytoskeleton results in an increase in the apparent cellular stiffness (Puig-de-Morales et al. 2004; Wang et al. 1993). Thus, the independence of our measurements on bead surface suggests that the sulfate beads, like the collagen beads, may also have been mechanically coupled to the actin cytoskeleton. This could occur, for example, by the direct noncovalent binding of sulfate beads to integrins, or through the receptor-mediated actin cytoskeletal rearrangement that accompanies phagocytosis (indeed, we observed that beads of both types could become phagocytosed during our experiments).
To compare the phase lags we obtained with the literature, Karcher and colleagues (Karcher et al. 2003) used magnetic beads bound to the membranes of NIH-3T3 fibroblasts and a sinusoidal (pulsing) forcing function from 0-125pN to find phase lag at 1.0Hz. Yamada and colleagues (Yamada et al. 2000) used laser-tracked endogenous granules within COS-7 epithelial cells to determine phase lag in the cytoplasm over several decades of frequency. In our experiments, we found a trend of decreasing phase lag with increasing frequency, consistent with Yamada et al. When comparing magnitudes, we obtained a phase lag of ~7° at 1.0Hz, compared to ~22.5° found by Karcher et al. and ~56° found by Yamada et al. The small phase lags we observed suggest that viscous effects were much less prevalent in our experiments in comparison to the literature. The wide discrepancies in the phase lag magnitudes and the dissimilarities in methodology in all three experiments may also suggest that differences in phase lags reflect differences in experimental methodology rather than differences in cell type. This will be verified in future experiments that quantify flow-induced phase lag in different cells under identical conditions.
Several important limitations of our study need to be considered when interpreting our findings. First, the uncertainty in our deformation measurements due to image noise/thermal motions (approximated as the mean frame-to-frame displacement in the absence of flow) and active transport (approximated as the mean active transport velocity in the absence of flow multiplied by the period of acquisition) are both ~20nm, and we are unable to resolve deformations less than this. Therefore, measurements and properties calculated in this study may reflect those of the most compliant cells in our sample and may not be representative of the entire population. This is an inherent technical limit that may be overcome by applying higher (but non-physiological) flow levels or through the development and/or use of an alternative measurement technique with higher spatial resolution. Second, when we visualized the bead and cells in three dimensions, we found a large variation in the embedding depth (from barely penetrating the cell surface, to completely endocytosed within the cell body). Beads not completely internalized experience fluid drag forces, and these forces may result in large bead motions relative to beads that are completely internalized. Since each bead experiences a different magnitude of fluid drag, it is difficult to discriminate whether differences in the displacement magnitudes of different beads are due to differences in cellular stiffness versus differences in the degree to which they are internalized. This makes, for example, converting the quantities obtained during steady flow into cellular continuum properties problematic. However, we show in Appendix A that the normalized peak displacement and phase lag are two parameters that ideally are independent of the magnitude of fluid drag. Indeed, in our experiments the normalized peak displacement and phase lag did not depend on whether they were measured with 1μm or 2μm diameter beads. Since larger diameter beads experience larger drag forces, the independence of these two quantities on bead size is consistent with the notion that these two parameters are independent of drag force magnitude. However, future experiments which measure deformations using beads and a marker-free technique under identical conditions may provide conclusive evidence in this regard.
In conclusion, we used fluorescent beads as displacement markers in order to quantify time-dependent deformations in bone cells exposed to fluid flow in vitro. During oscillatory flow, the phase lag was small (3~10°) and frequency-dependent. The normalized peak displacements decreased weakly with frequency as a power law. Thus, the cells deform primarily as elastic bodies under oscillatory flow from 0.5-2.0Hz, in contrast to steady flow, where we observed substantial creep. Although fluid flow has shown to be a potent physical stimulus in the regulation of bone cell metabolism, it remains unclear whether the cells are responding to deformations caused by fluid shear stresses, or other effects associated with the fluid, such as chemotransport (e.g., fluid transport of nutrients or signaling agonists (Donahue et al. 2003)). Our findings suggest the use of fluorescent beads as a promising technique for future investigation of the relationship between fluid flow, cellular deformation, and fluid flow-induced signaling.
Supplementary Material
Acknowledgments
The authors would like to acknowledge NIH grant AR45989, the NSF Graduate Fellowship and the Veterans Affairs Palo Alto Bone and Joint Center for funding, Oluwasheyi A. Ayeni for technical assistance, and Joyce Tang for editing comments.
APPENDIX A
In this appendix, we show that the normalized peak displacement and phase lag are two parameters that ideally are independent of the magnitude of fluid drag. Let u(f) and U(f) be the peak displacement of a cell-bound bead during oscillatory flow of frequency f if the bead is or is not exposed to fluid drag forces, respectively. Idealizing the cell as a linear elastic, homogenous, isotropic continuum, then these two quantities will be related by a constant such that u(f)=αU(f). In this case, the normalized peak displacement
| (A1) |
is equivalent if the bead in the presence and absence of fluid drag forces.
Similarly, let the complex displacements (found by taking the Fourier transform of the bead displacement over time) if the bead is or is not exposed to fluid drag forces be u(ω)=u’(ω)+iu”(ω) and U(ω)=U’(ω)+iU”(ω), respectively. The complex displacements will also be related to each other such that u(ω)=αU(ω). In this case, the loss tangent (i.e., the tangent of the phase lag)
| (A2) |
is equivalent in the presence or absence of fluid drag forces.
Footnotes
Publisher's Disclaimer: This is a PDF file of an unedited manuscript that has been accepted for publication. As a service to our customers we are providing this early version of the manuscript. The manuscript will undergo copyediting, typesetting, and review of the resulting proof before it is published in its final citable form. Please note that during the production process errors may be discovered which could affect the content, and all legal disclaimers that apply to the journal pertain.
References
- Alcaraz J, Buscemi L, Grabulosa M, Trepat X, Fabry B, Farré R, Navajas D. Microrheology of human lung epithelial cells measured by atomic force microscopy. Biophysical Journal. 2003;84(3):2071–2079. doi: 10.1016/S0006-3495(03)75014-0. [DOI] [PMC free article] [PubMed] [Google Scholar]
- Balland M, Desprat N, Icard D, Féréol S, Asnacios A, Browaeys J, Hénon S, Gallet F. Power laws in microrheology experiments on living cells: Comparative analysis and modeling. Physical Review E. 2006;74(2):021911. doi: 10.1103/PhysRevE.74.021911. [DOI] [PubMed] [Google Scholar]
- Barbee KA, Macarak EJ, Thibault LE. Strain measurements in cultured vascular smooth-muscle cells subjected to mechanical deformation. Annals of Biomedical Engineering. 1994;22(1):14–22. doi: 10.1007/BF02368218. [DOI] [PubMed] [Google Scholar]
- Caille N, Tardy Y, Meister JJ. Assessment of strain field in endothelial cells subjected to uniaxial deformation of their substrate. Annals of Biomedical Engineering. 1998;26(3):409–416. doi: 10.1114/1.132. [DOI] [PubMed] [Google Scholar]
- Cowin SC, Weinbaum S, Zeng Y. A case for bone canaliculi as the anatomical site of strain generated potentials. Journal of Biomechanics. 1995;28(11):1281–1297. doi: 10.1016/0021-9290(95)00058-p. [DOI] [PubMed] [Google Scholar]
- Donahue SW, Jacobs CR, Donahue HJ. Flow-induced calcium oscillations in rat osteoblasts are age, loading frequency, and shear stress dependent. American Journal of Physiology - Cell Physiology. 2001;281(5):C1635–C1641. doi: 10.1152/ajpcell.2001.281.5.C1635. [DOI] [PubMed] [Google Scholar]
- Donahue TLH, Haut TR, Yellowley CE, Donahue HJ, Jacobs CR. Mechanosensitivity of bone cells to oscillating fluid flow induced shear stress may be modulated by chemotransport. Journal of Biomechanics. 2003;36(9):1363–1371. doi: 10.1016/s0021-9290(03)00118-0. [DOI] [PubMed] [Google Scholar]
- Fabry B, Maksym GN, Butler JP, Glogauer M, Navajas D, Taback NA, Millet EJ, Fredberg JJ. Time scale and other invariants of integrative mechanical behavior in living cells. Physical Review E. 2003;68(4):041914. doi: 10.1103/PhysRevE.68.041914. [DOI] [PubMed] [Google Scholar]
- Gelles J, Schnapp BJ, Sheetz MP. Tracking kinesin-driven movements with nanometre-scale precision. Nature. 1988;331(6155):450–453. doi: 10.1038/331450a0. [DOI] [PubMed] [Google Scholar]
- Jacobs CR, Yellowley CE, Davis BR, Zhou Z, Cimbala JM, Donahue HJ. Differential effect of steady versus oscillating flow on bone cells. Journal of Biomechanics. 1998;31(11):969–976. doi: 10.1016/s0021-9290(98)00114-6. [DOI] [PMC free article] [PubMed] [Google Scholar]
- Karcher H, Lammerding J, Huang HD, Lee RT, Kamm RD, Kaazempur-Mofrad MR. A three-dimensional viscoelastic model for cell deformation with experimental verification. Biophysical Journal. 2003;85(5):3336–3349. doi: 10.1016/S0006-3495(03)74753-5. [DOI] [PMC free article] [PubMed] [Google Scholar]
- Kole TP, Tseng Y, Huang L, Katz JL, Wirtz D. Rho kinase regulates the intracellular micromechanical response of adherent cells to rho activation. Molecular Biology of the Cell. 2004;15(7):3475–3484. doi: 10.1091/mbc.E04-03-0218. [DOI] [PMC free article] [PubMed] [Google Scholar]
- Lau AWC, Hoffman BD, Davies A, Crocker JC, Lubensky TC. Microrheology, stress fluctuations, and active behavior of living cells. Physical Review Letters. 2003;91(19):198101. doi: 10.1103/PhysRevLett.91.198101. [DOI] [PubMed] [Google Scholar]
- Malone AM, Batra NN, Shivaram G, Kwon RY, You L, Kim CH, Rodriguez J, Jair K, Jacobs CR. The Role of the Actin Cytoskeleton in Oscillatory Fluid Flow Induced Signaling in MC3T3-E1 Osteoblasts. American Journal of Physiology - Cell Physiology. 2007 doi: 10.1152/ajpcell.00352.2005. Epub ahead of print. [DOI] [PMC free article] [PubMed] [Google Scholar]
- Mullender MG, Dijcks SJ, Bacabac RG, Semeins CM, Van Loon JJWA, Klein-Nulend J. Release of nitric oxide, but not prostaglandin E2, by bone cells depends on fluid flow frequency. Journal of Orthopaedic Research. 2006;24(6):1170–1177. doi: 10.1002/jor.20179. [DOI] [PubMed] [Google Scholar]
- Ponik S, Triplett J, Pavalko F. Osteoblasts and osteocytes respond differently to oscillatory and unidirectional fluid flow profiles. Journal of Cellular Biochemistry. 2006 doi: 10.1002/jcb.21089. [DOI] [PubMed] [Google Scholar]
- Puig-de-Morales M, Grabulosa M, Alcaraz J, Mullol J, Maksym GN, Fredberg JJ, Navajas D. Measurement of cell microrheology by magnetic twisting cytometry with frequency domain demodulation. Journal of Applied Physiology. 2001;91(3):1152–1159. doi: 10.1152/jappl.2001.91.3.1152. [DOI] [PubMed] [Google Scholar]
- Puig-de-Morales M, Millet E, Fabry B, Navajas D, Wang N, Butler JP, Fredberg JJ. Cytoskeletal mechanics in adherent human airway smooth muscle cells: probe specificity and scaling of protein-protein dynamics. American Journal of Physiology - Cell Physiology. 2004;287(3):C643–C654. doi: 10.1152/ajpcell.00070.2004. [DOI] [PubMed] [Google Scholar]
- Shroff SG, Saner DR, Lal R. Dynamic micromechanical properties of cultured rat atrial myocytes measured by atomic force microscopy. American Journal of Physiology. 1995;269(38):C286–C292. doi: 10.1152/ajpcell.1995.269.1.C286. [DOI] [PubMed] [Google Scholar]
- Simon SI, Schmid-Schonbein GW. Kinematics of cytoplasmic deformation in neutrophils during active motion. Journal of Biomechanical Engineering. 1990;112(3):303–310. doi: 10.1115/1.2891188. [DOI] [PubMed] [Google Scholar]
- Wang N, Butler JP, Ingber DE. Mechanotransduction across the cell-surface and through the cytoskeleton. Science. 1993;260(5111):1124–1127. doi: 10.1126/science.7684161. [DOI] [PubMed] [Google Scholar]
- Weinbaum S, Cowin SC, Zeng Y. A model for the excitation of osteocytes by mechanical loading-induced bone fluid shear stresses. Journal of Biomechanics. 1994;27(3):339–360. doi: 10.1016/0021-9290(94)90010-8. [DOI] [PubMed] [Google Scholar]
- Wilhelm C, Gazeau F, Bacri J-C. Rotational magnetic endosome microrheology: viscoelastic architecture inside living cells. Physical Review E. 2003;67(6):061908. doi: 10.1103/PhysRevE.67.061908. [DOI] [PubMed] [Google Scholar]
- Yamada S, Wirtz D, Kuo SC. Mechanics of living cells measured by laser tracking microrheology. Biophysical Journal. 2000;78(4):1736–1747. doi: 10.1016/S0006-3495(00)76725-7. [DOI] [PMC free article] [PubMed] [Google Scholar]
Associated Data
This section collects any data citations, data availability statements, or supplementary materials included in this article.


