

Abstract
Recent advances in the use of paramagnetic relaxation enhancement (PRE) in structure refinement and in the analysis of transient dynamic processes involved in macromolecular complex formation are presented. In the slow exchange regime, we show, using the SRY/DNA complex as an example, that the PRE provides a powerful tool that can lead to significant increases in the reliability and accuracy of NMR structure determinations. Refinement necessitates the use of an ensemble representation of the paramagnetic center and a model free extension of the Solomon-Bloembergen equations. In the fast exchange regime, the PRE provides insight into dynamic processes and the existence of transient, low population intermediate species. The PRE allows one to characterize dynamic non-specific binding of a protein to DNA; to directly demonstrate that the search process whereby a transcription factor locates its specific DNA target site involves both intramolecular (sliding) and intermolecular (hopping and intersegment transfer) translocation; and to detect and visualize the distribution of an ensemble of transient encounter complexes in protein-protein association.
Introduction
The history of paramagnetic relaxation enhancement (PRE) and the nuclear Overhauser effect (NOE) dates back to the 1950's (1). The NOE delineates short interproton distance contacts (≤ 6 Å) and provides the main source of geometric information currently used in macromolecular NMR structure determination (2,3). The PRE arises from magnetic dipolar interactions between a nucleus (e.g. 1H) and the unpaired electrons of a paramagnetic center, and results in an increase in the relaxation rate of the nuclear magnetization (4). For an electron-nucleus distance r, the magnitude of the PRE is proportional to r−6, a relationship analogous to that between the magnitude of the NOE and interproton distance. However, because the magnetic moment of the unpaired electron is large, the PRE effects are large and can provide long-range distance information, extending in the case of Mn2+, for example, up to ~35 Å.
Not surprisingly, the PRE has seen extensive use in metalloproteins that possess a rigid intrinsic paramagnetic center (5–7). Other systems necessitate the attachment of an extrinsic paramagnetic group to the macromolecule of interest through appropriate chemical modification. As a result, it is only relatively recently, with advances in biochemical methodology that permit the reliable conjugation of a paramagnetic group to a specific site, that the use of the PRE has seen a resurgence. The potential of the PRE for protein structure determination, however, was first demonstrated about 20 years ago on spin-labeled lysozyme and bovine pancreatic trypsin inhibitor (8,9).
Nitroxide spin labels or EDTA-Mn2+ which have an unpaired electron with an isotropic g-tensor, are particularly suited for PRE measurements since they do not give rise to pseudo-contact shifts and Curie-spin relaxation is negligible. Recent applications include rapid determination of protein folds (10–15), analysis of unfolded and partially unfolded states (16–20), elucidation of protein-protein (21–24), protein-oligosaccharide (25–27) and protein-nucleic acid (28–32) complexes, and studies of membrane protein structure (33,34). Perhaps the most intriguing new application of the PRE relates to the study of low population encounter complexes involved in protein-nucleic acid (35) and protein-protein (36–38) recognition, as well as the study of large scale dynamics that entail significant changes in paramagnetic center-1H distances, including for example, non-specific protein-DNA interactions (39,40) and large scale domain motions (41).
Measurement of the PRE
The PRE rate, Γ, is simply given by the difference in relaxation rates measured in the paramagnetic and control diamagnetic states. In general, we feel that the transverse PRE (Γ2) is the most reliable way to make use of the PRE for two reasons (42). First, the large magnitude of the 1H-Γ2 PRE makes it a highly sensitive probe. This is due to the large nuclear gyromagnetic ratio of the proton and the primary dependence of 1H-Γ2 on the spectral density function at zero-frequency. Second, the transverse 1H-Γ2 rate is much less susceptible to internal motions and cross-relaxation than the longitudinal PRE rate, 1H-Γ1.
Quantitative application of the PRE requires that 1H-Γ2 rates be measured precisely and accurately. The majority of examples in the literature make use of a single time-point measurement in which two regular HSQC correlation spectra, one of the paramagnetic state, the other of the diamagnetic state at the same concentration, are used to determine 1H-Γ2 rates from the equation Ipara(0)/Idia(0)=R2,diae−Γ2τ/(R2,dia + Γ2), where Ipara(0) and Idia(0) are the peak intensities in the paramagnetic and diamagnetic states, respectively, R2,dia is the transverse relaxation rate in the diamagnetic state, and τ is the overall 1H transverse period for coherence transfers (42). Unfortunately, this simplistic approach severely underestimates the true value of 1H-Γ2 unless a very long repetition delay is employed (>20 s for a 2H-labeled protein). This is because at short repetition delays, the recovery levels for the paramagnetic sample are always higher than those of the corresponding diamagnetic sample owing to the PRE on longitudinal relaxation rates (Γ1). Accurate 1H-Γ2 rates, however, can be obtained in the same measurement time from a two time-point measurement without requiring any fitting procedures or complicated error estimations. 1H-Γ2 for the two time-point measurement is given by (31,42):
| (1) |
with errors in Γ2 given by:
| (2) |
where Ta and Tb are the two time points, σpara and σdia are the standard deviations of the noise in the spectra recorded for the paramagnetic and diamagnetic states, respectively. By using a relatively short time interval for the two time-point measurement, errors in Γ2 introduced by any potential diamagnetic contamination can also be significantly reduced (42).
Using the PRE for structure determination
One of the most difficult aspects of using NOEs for protein structure determination relates to unambiguous cross-peak assignment (2,3). Owing to extensive spectral overlap, it is often difficult to unambiguously assign a NOE cross-peak to a single interaction, even in four-dimensional spectra. Consequently, the strategy for structure determination generally relies on an iterative strategy in which a low resolution fold is calculated on the basis of relatively few unambiguous NOE cross-peaks, followed by iterative refinement to assign all the remaining cross-peaks in the NOE spectra (3). Not surprisingly, it is quite easy to make mistakes (i.e. proceed down an incorrect path), whether this process is carried out manually or automatically by computer algorithms (43). The identification of a PRE effect, just like a residual dipolar coupling, on the other hand, is entirely straightforward, since the assignment of cross-peaks in the correlation spectra are already known from through-bond scalar triple resonance experiments.
One of the intrinsic problems in making use of the PRE for structure determination is the fact that extrinsic paramagnetic probes are invariably conjugated to the macromolecule of interest via a flexible linker with several rotatable bonds. Thus, it is absolutely essential to treat the paramagnetic center by a multiple conformer representation (31). If only a single conformer representation is employed, it may still be possible to fit the PRE data but at the expense of coordinate accuracy; that it to say inappropriate treatment of the PRE data will actually result in structural distortion and reduced coordinate accuracy (31). Generally, a three-member ensemble for the paramagnetic center is sufficient, but in some cases a larger ensemble may be required. For a N-site jump model with appropriate ensemble averaging for the PRE, Γ2, using a model-free extension of the Solomon-Bloembergen equations, is given by (31):
| (3) |
where τc is the correlation time defined as (τr−1 + τs−1)−1, and τt the total correlation time defined as (τr−1 + τs−1 + τi−1)−1. τr, τs and τi are the rotational correlation time, the effective electron relaxation time and the internal correlation time, respectively. r−6fSB,2(τc) corresponds to the classical Solomon-Bloembergen equation for Γ2 (31). <r−6> is calculated as:
| (4) |
where N is the ensemble size and np the number of equivalent protons. The PRE order parameter is given by the product of angular and radial components:
| (5) |
where the angular and radial components are given by:
| (6) |
| (7) |
Optimization of the conformer representation for the paramagnetic center is readily achieved using simulated annealing in torsion angle space (31). A quantitative measure of agreement between observed and calculated Γ2 rates can be obtained by calculating a Q-factor given by (31):
| (8) |
In the context of tight macromolecular complexes, the PRE provides a very powerful additional source of intermolecular distance restraints containing both translational and orientational information. Fig. 1 shows an example of the results of structure refinement incorporating intermolecular PRE data for the SRY/DNA complex (31). Using an ensemble size of N = 3 for each paramagnetic center, 438 intermolecular 1H-Γ2 restraints, derived from three complexes with dT-EDTA-Mn2+ incorporated at three different sites, are readily satisfied without impacting the agreement with other experimental restraints, including residual dipolar couplings. In addition, complete cross-validation was able to demonstrate that the incorporation of PRE restraints results in significant gains in coordinate accuracy. The power of the PRE for studying intermolecular complexes is illustrated in Fig. 2, which compares an ensemble of structures for the SRY/DNA complex calculated on the basis of only a single intermolecular NOE restraint: with no PRE data the orientation of SRY relative to the DNA cannot be determined; addition of the intermolecular PRE data allows the structure to be resolved unambiguously (31).
Fig. 1.
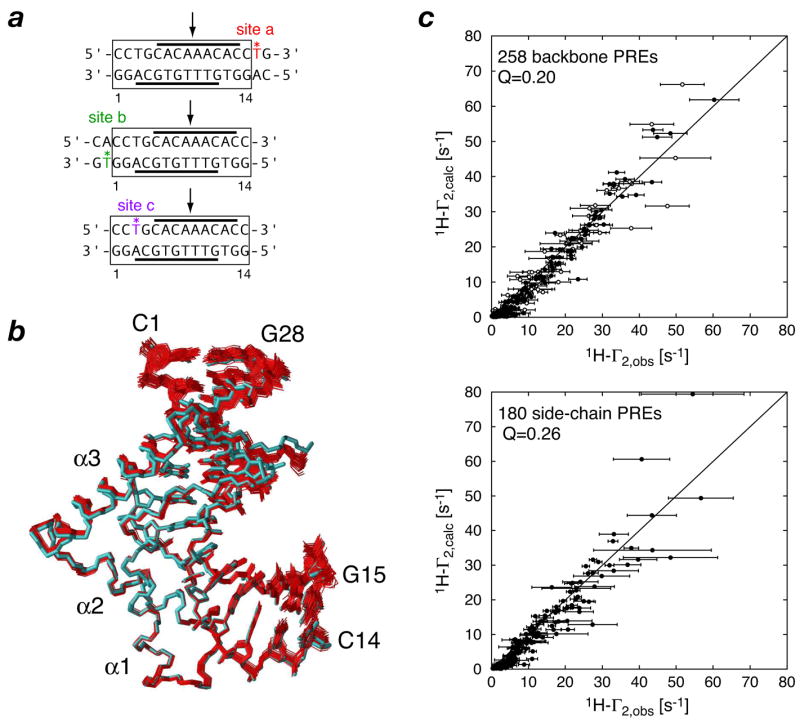
The intermolecular PRE in structure refinement of the SRY/DNA complex. (a) Oligonucleotides with location of the paramagnetic center (dT-EDTA-Mn2+) indicated by an asterisk and color-coded. The location of the specific SRY binding site is indicated by the solid bars and the site of intercalation of Ile13 is shown by an arrow. (b) Best-fit superposition of 40 simulated annealing structures (red) refined against 438 intermolecular 1H-PRE restraints (31) on the restrained regularized mean coordinates (cyan) generated from structures based on NOE, dipolar coupling, J coupling and torsion angle restraints calculated without 1H-PRE restraints (58). (c) Agreement between observed and calculated values of 1H-Γ2 rates for backbone and side-chain 1H-PREs after refinement using a three-conformer ensemble representation for each paramagnetic center. Adapted from ref. 31.
Fig. 2.

Impact of intermolecular PRE on coordinate accuracy of the SRY/DNA complex when only a single intermolecular NOE restraint located at the center of the protein-DNA interface is employed. Best-fit superposition of 30 simulated annealing structures (SRY, red, DNA, blue) calculated (a) without and (b) with 438 intermolecular 1H-PRE restraints. The original restrained regularized mean structure of the SRY/DNA complex (58) determined using 168 intermolecular NOE restraints and 375 residual dipolar couplings is shown in cyan (SRY) and yellow (DNA). Adapted from ref. 31.
Intermolecular PRE and non-specific protein-DNA interactions
Structural characterization of non-specific protein-DNA interactions in a system where the protein is not constrained to a single location but can dynamically sample all possible binding sites on the DNA during the course of the measurement represents a challenging problem since the experimental observables represent ensemble averages of all the states present in solution (39,40). Fig. 3a compares the PRE profiles observed for the specific SRY/DNA complex versus that for the non-specific HMG-1A/DNA complex (39). The two proteins are members of the HMG-box family, bind in the minor groove and bend the DNA. The PRE profile for the SRY/DNA complex is fully consistent with a single specific complex (cf. Fig. 1). For the HMG-1A/DNA complex, however, the PRE profiles observed with the dT-EDTA-Mn2+ paramagnetic center placed at either end of the DNA duplex are not only significantly larger than those observed for the specific SRY/DNA complex, but even more importantly are very similar to one another. The latter is diagnostic of multiple binding sites in multiple orientations. The former indicates the presence of binding sites close to the paramagnetic center, since Γ2 is proportional to <rMn-H>−6 and hence strongly influenced by the minimum value of rMn-H. Similar results have been observed for non-specific HoxD9 homeodomain/DNA complexes (40).
Fig. 3.

Characterization of non-specific DNA binding of HMGB-1A by PRE. (a) Comparison of PRE profiles observed for the non-specific HMGB-1A/DNA complex and the specific SRY/DNA complex with two DNA duplexes bearing dT-EDTA-Mn2+ at opposite ends of the DNA. A diagrammatic depiction of the states giving rise to the observed PREs is shown on the right hand-side of the figure. (b) Semi-quantitative estimation of the distribution and occupancy of HMGB-1A binding sites along a 14-bp duplex DNA. There are 13 potential intercalation sites and HMGB-1A can bind in two orientations related by a 180° rotation (top left panel). The optimized distribution for the two orientations (bottom two panels) yields a PRE Q-factor of 0.36 (top right panel). Adapted from ref. 39.
It is possible to go one step further by carrying out a semi-quantitative analysis to ascertain the populations of individual binding states (39). If we assume an N discrete binding state model where the transitions between the states are slower than the rotational correlation time but fast on the chemical shift time scale, the spectral density for a dipole-dipole interaction vector is independent of the transition rates rates and angles between the vectors of the individual states. The ensemble average <Γ2> rate is therefore given by the weighted average of the Γ2 rates for the individual states (39):
| (9) |
where ρk and Γ2,k are the population and 1HN-Γ2 PRE rate, respectively, for state k. The populations ρk can be obtained by back-calculating the Γ2 rates from structural models of the individual states and minimizing the χ2 function (39):
| (10) |
where i is the index for each data point; Γ2,obs(i), the observed value of 1H-Γ2; Γ2,calc,k(i), the calculated value of 1H-Γ2 for binding state k; and σ(i), the experimental error for Γ2,obs(i). The highest populations of binding are located around the central region of the DNA duplex, and the population in the two possible orientations is approximately equal (Fig. 3b).
Using the PRE to study transient low-population intermediates in macromolecular interactions
In an exchanging system comprising two or more species in equilibrium, the observed PRE measured on the resonance of the major species will be modulated by the minor species, the extent of which depends upon the rate of exchange (kex) between the species (35). This phenomenon is most easily appreciated by considering a simple two-site exchange system in which the major species (A) has an occupancy of 99% with a paramagnetic center-proton distance of 30 Å, while the minor species (B, only 1%) has a paramagnetic center-proton distance of 8 Å (Fig. 4). For a 30 kDa system, the 1H-Γ2 rate arising from Mn2+ will be ~2 s−1 for the major species and ~5600 s−1 for the minor one. When kex is slow (<50 s−1), the presence of the minor species has no impact on the apparent Γ2 rate ( ) observed on the resonance of the major species. As kex increases, so the apparent Γ2 rate increases, When is given by the population weighted average of the Γ2 rates of the two species. In this particular example, will be ~30 times larger than , allowing one to both infer the presence of the minor species and derive structural information on it.
Fig. 4.

Intermolecular PRE in an exchanging system. (a) Diagrammatic depiction of a two site-exchange process involving major (99%) and minor (1%) species with paramagnetic-1H distances of 30 and 8 Å, respectively. (b) Effect of increasing exchange rate on NMR line-shape with (red) and without (black) PRE. In the slow exchange regime the PRE is insensitive to presence of minor state; in the fast exchange regime, however, the PRE sensitive to the presence of minor species and can be used to reveal footprint of minor species. Adapted from ref. 35.
Intra- and intermolecular translocation in specific protein-DNA recognition
A long-standing question in protein-DNA recognition pertains to the search process whereby a transcription factor locates its specific cognate site among a sea of non-specific sites. Both kinetic and theoretical considerations have suggested that non-specific binding can significantly enhance the rate of specific recognition via two complementary mechanisms (44–47): (a) intramolecular translocation or sliding that results in a reduction in the dimensionality of the search process from three-dimensions to one; and (b) intermolecular translocation or hopping from one DNA molecule to another or from one DNA segment to another via looping.
15N z-exchange spectroscopy in which the HoxD9 homeodomain was mixed with an equimolar concentration of two DNA duplexes differing in only a single base pair mutation at the edge of the specific binding site demonstrated that intermolecular translocation occurs very efficiently at relatively high (submillimolar) DNA concentrations even at low salt (20 mM NaCl) (48). The apparent rate of this process is proportional to the concentration of free DNA, is highly dependent on salt concentration, and occurs via direct transfer without ever involving the intermediary of free protein (48). Given the extremely high concentration of DNA in the nucleus, intermolecular translocation represents an important pathway for the transfer of a transcription factor from one DNA site to another.
PRE measurements at low salt (20 mM NaCl) on the specific HoxD9/DNA complex are fully consistent with the crystal structure of the highly homologous antennapedia homeodomain/DNA complex (35). The overall PRE Q-factor (QPRE) for the data collected from four different locations of the paramagnetic center along the DNA was 0.26 (Fig. 5). As the salt concentration is raised to 100 and 160 mM NaCl, however, the PRE data are completely inconsistent with the structure of the specific complex (QPRE = 0.66), and the profiles reflect the footprint of binding intermediates involved in the target search process (Fig. 5), even though the value of Kdiss is 1.5 nM at 100 mM NaCl. The observed PREs at high salt cannot be attributed to structural changes since the observed spectrum remains unaltered and the dipolar coupling data are fully consistent with the crystal structure (35).
Fig. 5.

Intermolecular PREs observed for the HoxD9/DNA complex in the slow (20 mM NaCl) and fast (160 mM NaCl) exchange regimes. (a) DNA duplex containing the HoxD9 specific binding site (boxed) and showing the location of the 4 sites used to introduce dT-EDTA-Mn2+ (one at a time). (b) Schematic illustration of the ground state specific complex and the target search process. (c) and (d) PRE profiles observed for site 1 at low (20 mM NaCl) and high (100 and 160 mM NaCl) salt, respectively. (e) and (f) Correlation between observed and calculated PREs for all 4 sites at low (20 mM NaCl) and high (160 mM NaCl) salt, respectively. Below the correlation diagrams, the PRE data are mapped on the structural model of the HoxD9/DNA complex, with the color scale depicting Γ2 rates. Adapted from ref. 35.
The observed PRE profiles on the specific HoxD9/DNA complex can be attributed to intra- and/or inter-molecular translocation. To assess the relative contributions of these two processes, two experiments were carried out involving HoxD9 in the presence of equal mixtures of two DNA duplexes (Fig. 6): sample 1 comprised the specific duplex without a paramagnetic center and a non-specific duplex bearing the dT-EDTA-Mn2+ paramagnetic center; sample 2 comprised the specific duplex with dT-EDTA-Mn2+ and a non-specific duplex without a paramagnetic center (35). In sample 1, intermolecular PREs can only occur via a mechanism involving intermolecular translocation, while for sample 2 both intra- and intermolecular translocation can contribute to the observed PREs. The PRE profiles for the two samples are very similar, indicating that intermolecular translocation is a major contributor. Upon further examination of the PRE profiles, however, it is apparent that the Γ2 rates for residues 24–33 and 41–42 are 30–100% larger for sample 2 than those for sample 1, whereas those for the N-terminal arm region are the same. The larger PRE values for a limited region of the protein in sample 2 are directly attributable to intramolecular translocation which gives rise to bias arising from the fact that the orientation of the protein bound to the specific site is favored as the protein slides along the DNA (35). Thus, as the protein slides away from the specific site, residues 24–33 and 41–42 can readily come into very close proximity to the paramagnetic center; the N-terminal tail, however, can only approach the paramagnetic center following an intermolecular translocation event resulting in a 180° flip in the binding orientation of the protein along the DNA duplex.
Fig. 6.

Intra- and intermolecular translocation in the HoxD9/DNA system. (a) PRE data were collected on HoxD9 in the presence of equal mixture of two DNA duplexes, one with and the other without the specific site (indicated in blue). In sample 1, the non-specific DNA bears the paramagnetic center and PREs only arise from intermolecular translocation; in sample 2, the specific DNA has the paramagnetic center and PREs can arise from both inter- and intra-molecular translocation. (b) Observed PRE profiles. (c) Schematic representation of sliding along the DNA with HoxD9 color coded according to the Γ2(sample 2)/Γ2(sample 1) ratio. Adapted from ref. 35.
Transient encounter complexes in protein-protein recognition
Kinetic studies on many protein-protein associations suggest the formation of a pre-equilibrium encounter complex that subsequently relaxes to the stereospecific complex. Further, site-specific mutagenesis studies and Brownian dynamics simulations have provided evidence of modulation of association rate constants via perturbations involving charged residues located outside the specific interaction surfaces (49–52). This suggests that non-specific encounter complexes may facilitate protein-protein recognition either by a reduction in dimensionality, in this instance from a three- to a two-dimensional search process (53), or by the presence of a short-range, non-specific attractive potential (47). We set out to detect such encounter complexes by means of PRE measurements using a relatively weak complex (Kdiss ∼10 μM) comprising the N-terminal domain of enzyme I (EIN) and HPr. The 40 kDa EIN/HPr complex had previously been solved by NMR on the basis of extensive NOE and dipolar coupling measurements (54). This complex catalyses the transfer of a phosphoryl group from His189 of EIN to His15 of HPr, and the NMR structure of the complex is fully consistent with the formation of a pentacoordinate phosphoryl transition state intermediate without requiring any significant structural perturbation (54). EDTA-Mn2+ was introduced at three separate sites (E5C, E25C and E32C) on HPr, and intra and intermolecular PRE data were measured (37). The intramolecular PRE data observed for HPr are fully consistent with the X-ray structure of HPr with an overall intramolecular PRE Q-factor of 0.18 (Fig. 7a). Although the intermolecular PRE profiles observed on EIN display features that clearly arise from the stereospecific complex, other features are present indicative of the presence of alternative modes of binding involving non-specific encounter complexes (Fig. 7c). As a result the overall intermolecular PRE Q-factor calculated from the stereospecific complex is 0.61 and the correlation between observed and calculated Γ2 rates is poor (Fig. 7b).
Fig. 7.

Intermolecular PREs for the EIN-HPr complex. EDTA-Mn2+ was conjugated to an engineered surface cysteine at 3 sites (E5C, E25C and E32C). (a) Correlation between observed and calculated intramolecular Γ 2 rates for HPr. (b) Correlation between observed and calculated intermolecular Γ2 rates measured on EIN and arising from paramagnetically labeled HPr. (c) Intermolecular PRE profiles observed for the 3 sites, with experimental Γ2 rates denoted by the red circles, and the theoretical Γ2 rates calculated from the structure of the stereospecific complex by the black line. Adapted from ref. 37.
A semi-quantitative description of the observed intermolecular PRE data for the EIN-HPr complex can be obtained by direct rigid body simulated annealing refinement (55) of a system comprising the stereospecific complex (whose structure is fixed) with population λ in rapid exchange with an ensemble of encounter complexes comprising N states with overall population (1 − λ) (Fig. 8) (37). Complete cross-validation indicates that the encounter complexes is best represented by an ensemble of size N = 10–20 at a population of ∼10%. The resulting intermolecular PRE Q-factor is 0.21.When the distribution of the non-specific encounter complexes is examined, there appears to be a qualitative correlation with electrostatic potential, with the positively charged face of HPr populating regions of EIN with highly negative electrostatic potentials (Fig. 9). Interestingly, the region occupied by the stereospecific complex is only minimally populated by non-specific encounter complexes suggesting that once HPr reaches this region, formation of the stereospecific complex occurs with high probability (37). The characteristics of the non-specific encounter complexes are quite distinct from the stereospecific complex that possesses a well-defined array of complementary van der Waals and electrostatic interactions (54). The buried accessible surface area at the protein-protein interface is on average an order of magnitude smaller, the gap index is much larger (i.e. the interface is less well packed), and the interfacial composition of charged residues is increased for the non-specific encounter complexes relative to the stereopecific complex (37).
Fig. 8.

Ensemble refinement of intermolecular PRE data for the EIN-HPR complex. (a) The observed Γ2 rates in the fast exchange regime are a weighted average of the Γ2 rates for the specific complex and an encounter complex ensemble comprising N species. (b) Dependence of working (Qe and Qee) and complete cross-validated (Qfree) Q-factors on ensemble size N. (c) Dependence of working Q factors on population of the encounter complex ensemble. (d) Correlation between observed and calculated Γ2 rates obtained with a population of 10% for the encounter complex species represented by an ensemble of size N = 20. (Qe and Qee are the average Q-factor <Q> for all 100 calculated ensembles, and Qee is the ensemble of ensembles average Q-factor. Adapted from ref. 37.
Fig. 9.
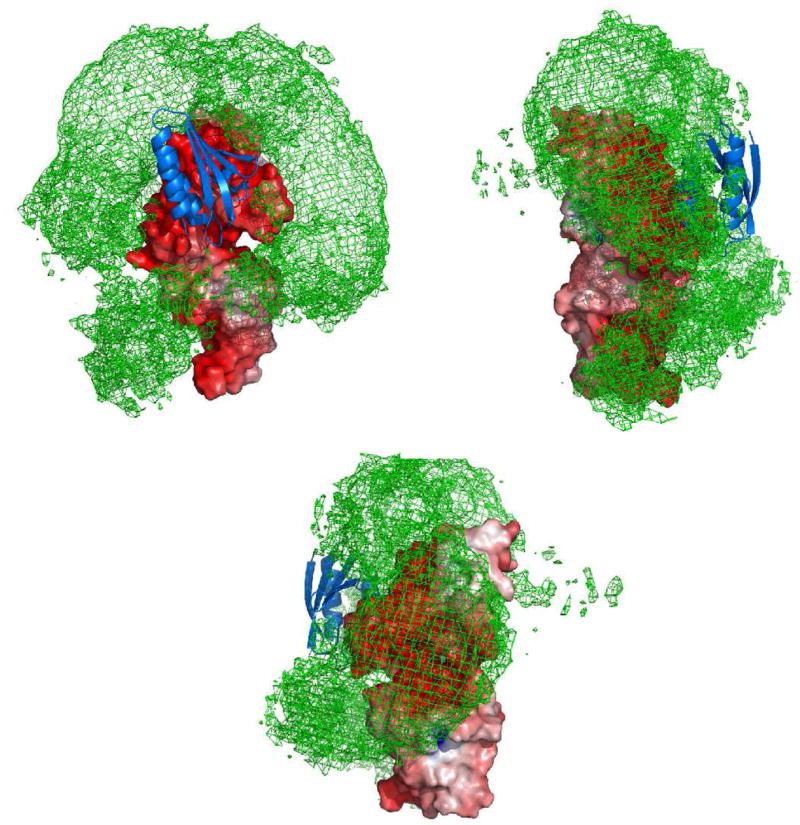
Three views of a reweighted atomic probability map illustrating the distribution of HPr molecules on the surface of EIN that make up the ensemble of encounter complexes. The encounter complex probability map (green mesh plotted at a threshold of 20% maximum) is calculated from 100 independent calculations of ensemble size N = 20 at a population of 10%; the molecular surface of EIN is color coded by electrostatic potential (± 8 kT); and the location of HPr in the steterospecific complex is shown as a blue ribbon. Adapted from ref. 37.
The direct detection of non-specific encounter complexes by PRE is quite general for systems with relatively weak affinity. We observed similar phenomena for two other complexes involving HPr and the proteins IIAMannitol and IIAMannose (37) Contemporaneously, similar observations have been made for the interaction of cytochrome c and cytochrome c peroxidase (38). These findings probably reflect a general principle of steered macromolecular diffusion and protein-protein association whereby weak, transient, non-specific encounter complexes are formed, presumably via long-range non-specific electrostatic interactions supplemented by short range van der Waals ones, thereby facilitating the rapid formation of the stereospecific complex (37). The non-specific encounter complexes are sufficiently long-lived to permit a two-dimensional search on the surface of the proteins, until the region of the specific interaction surfaces is reached and the complex falls into a narrow energy funnel that leads rapidly and directly to the formation of the stereospecific complex. Very recently, using chemical shift mapping and NMR relaxation dispersion measurements, non-specific encounter complex formation has also been shown to play a key role in coupled folding and binding of an intrinsically disordered peptide to its target protein (56).
Concluding remarks
The PRE provides a very powerful tool for studying both structure and large scale dynamic phenomena in solution. In terms of structure, the PRE is particularly useful since Γ2 rates are measured from through-bond correlation spectra and hence the effects can be unambiguously assigned to specific paramagnetic center-proton interactions with little effort. Unlike FRET measurements where only a single distance between two fluorescent labels can be measured from a single sample (57), the PRE affords the simultaneous measurements of hundreds of paramagnetic center-proton distances. For direct refinement against PRE data it is critical that accurate Γ2 rates be obtained and that the extrinsic paramagnetic center be represented by an ensemble. The application of the PRE for structure determination of complexes, however, must be restricted to systems in slow exchange, since the presence of transient intermediates in fast exchange with the major species may significantly impact the observed PREs, particularly when the paramagnetic center-proton distances are shorter in the minor species than the major one. This is due to the fact the magnitude of the PRE is proportional to <r−6> and hence heavily weighted by shorter paramagnetic center-proton distances. Although this represents a caveat in the use of the PRE for structure determination of complexes, it affords a unique tool to easily detect, visualize and characterize transient, low population intermediates or species at equilibrium. Even if the population of the intermediate species is a low as 1%, the PRE permits structural information relating to such species to be obtained. The effect, of course, depends critically on time scale and the intermediates can only be detected in the fast exchange regime. We foresee that the PRE will yield unique insights into large-scale domain motions, the recognition processes involved in macromolecular interactions, and the formation of higher order complexes.
Acknowledgments
This work was supported by the AIDS Directed Antiviral Program of the Office of the Director of the National Institutes of Health and by the Intramural Research program of the National Institute of Diabetes and Digestive and Kidney Diseases, National Institutes of Health (to G.M.C.).
Abbreviations
- NMR
nuclear magnetic resonance
- PRE
paramagnetic relaxation enhancement
- NOE
nuclear Overhauser effect
- HSQC
heteronuclear single quantum coherence
- FRET
fluorescence energy transfer
Footnotes
Publisher's Disclaimer: This is a PDF file of an unedited manuscript that has been accepted for publication. As a service to our customers we are providing this early version of the manuscript. The manuscript will undergo copyediting, typesetting, and review of the resulting proof before it is published in its final citable form. Please note that during the production process errors may be discovered which could affect the content, and all legal disclaimers that apply to the journal pertain.
References and recommended reading
Papers of particular interest, published within the annual period of review, have been highlighted as:
● of special interest
● of outstanding interest
- 1.Solomon I. Relaxation processes in a system of two spins. Phys Rev. 1955;99:559–565. [Google Scholar]
- 2.Wüthrich K. NMR of Proteins and Nucleic Acids. John Wiley; New York: 1986. [Google Scholar]
- 3.Clore GM, Gronenborn AM. Two, three and four dimensional NMR methods for obtaining larger and more precise three-dimensional structures of protein in solution. Ann Rev Biophys Biophys Chem. 1991;20:29–63. doi: 10.1146/annurev.bb.20.060191.000333. [DOI] [PubMed] [Google Scholar]
- 4.Bloembergen N, Morgan LO. Proton relaxation times in paramagnetic solutions: effects of electron spin relaxation. J Chem Phys. 1961;34:842–850. [Google Scholar]
- 5.Cheng H, Markley JL. NMR spectroscopic of paramagnetic proteins: iron sulfur proteins. Ann Rev Biophys Biomol Struct. 1995;24:209–237. doi: 10.1146/annurev.bb.24.060195.001233. [DOI] [PubMed] [Google Scholar]
- 6.Bertini I, Luchinat C, Licciolini M. Paramagnetic probes in metalloproteins. Methods Enzymol. 2001;339:314–340. doi: 10.1016/s0076-6879(01)39320-5. [DOI] [PubMed] [Google Scholar]
- 7.Ubbink M, Worral JAR, Canters GW, Groenen EJJ, Huber M. Paramagnetic resonance of biological metal centers. Ann Rev Biophys Biomolec Struct. 2002;31:393–422. doi: 10.1146/annurev.biophys.31.091701.171000. [DOI] [PubMed] [Google Scholar]
- 8.Schmidt PG, Kuntz ID. Distance measurements in spin-labeled lyzozyme. Biochemistry. 1984;23:4261–4266. doi: 10.1021/bi00313a038. [DOI] [PubMed] [Google Scholar]
- 9.Kosen PA, Scheek RM, Naderi H, Basus VJ, Manogaran S, Schmidt PG, Oppenheimer NJ, Kuntz ID. Two-dimensional 1H-NMR of three spin-labeled derivatives of bovine pancreatic trypsin inhibitor. Biochemistry. 1986;25:2356–2364. doi: 10.1021/bi00357a009. [DOI] [PubMed] [Google Scholar]
- 10.Kosen PA. Spin labeling of proteins. Methods Enzymol. 1989;177:86–121. doi: 10.1016/0076-6879(89)77007-5. [DOI] [PubMed] [Google Scholar]
- 11.Battiste JL, Wagner G. Utilization of site-directed spin-labeling and high-resolution heteronuclear nuclear magnetic resonance for global fold determination of large proteins with limited nuclear Overhauser effect data. Biochemistry. 2000;39:5355–5365. doi: 10.1021/bi000060h. [DOI] [PubMed] [Google Scholar]
- 12.Gaponenko V, Howarth JW, Columbus G, Gasmi-Seabrook J, Yuan WL, Hubbell PR, Rosevear PR. Protein global fold determination using site-directed spin and isotope labeling. Protein Sci. 2000;9:302–309. doi: 10.1110/ps.9.2.302. [DOI] [PMC free article] [PubMed] [Google Scholar]
- 13.Donaldson LW, Skrynnikov WY, Choy DR, Muhandiram B, Sarkar JD, Forman-Kay JD, Kay LE. Structural characterization of proteins with an attached ATCUN motif by paramagnetic relaxation enhancement NMR spectroscopy. J Am Chem Soc. 2001;123:9843–9847. doi: 10.1021/ja011241p. [DOI] [PubMed] [Google Scholar]
- 14.Dvotretzky A, Gaponenko V, Rosevear PR. Derivation of structural restraints using a thiol-reactive chelator. FEBS Lett. 2002;528:189–192. doi: 10.1016/s0014-5793(02)03297-0. [DOI] [PubMed] [Google Scholar]
- 15.Pintacuda G, Mosref A, Leonchiks A, Shapiro A, Otting G. Site-specific labeling with a metal chelator for protein structure refinement. J Biomol NMR. 2004;29:351–361. doi: 10.1023/B:JNMR.0000032610.17058.fe. [DOI] [PubMed] [Google Scholar]
- 16.Gillespie JR, Shortle D. Characterization of long-range structure in the denatured state of staphylococcal nuclease. I Paramagnetic relaxation enhancement by nitroxide spin labels. J Mol Biol. 1997;268:158–169. doi: 10.1006/jmbi.1997.0954. [DOI] [PubMed] [Google Scholar]
- 17.Bertoncini CW, Jung YS, Fernandrez CO, Hoyer W, Griesinger C, Jovin TM, Zweckstetter M. Release of long-range tertiary interactions potentiates aggregation of natively unstructured α-synuclein. Proc Natl Acad Sci USA. 2005;102:1430–1435. doi: 10.1073/pnas.0407146102. ●●Using both PRE and dipolar coupling measurements, the authors shows that intrinsically disordered α-synuclein assumes transient conformations that are stabilized by long-range interactions and act to inhibit oligomerization and aggregation. [DOI] [PMC free article] [PubMed] [Google Scholar]
- 18.Dedmon MM, Lindorff-Larsen K, Chistodoulou J, Vendruscolo M, Dobson CM. Mapping long-range interactions in α-synuclein using spin-label NMR and ensemble molecular dynamics simulations. J Am Chem Soc. 2005;127:476–477. doi: 10.1021/ja044834j. ●●Using PRE meaurements the authors show that α-synuclein adopts a broad distribution of conformations with an ensemble averaged hydrodynamic radius that is significantly smaller than that expected for a random coil. [DOI] [PubMed] [Google Scholar]
- 19.Krisjansdottir S, Lindorff-Larsen K, Fieber W, Dobson CM, Vendruscolo M, Poulsen FM. Formation of native and non-native interactions in ensembles of denatured ACBP molecules from paramagnetic relaxation enhancement studies. J Mol Biol. 2005;347:1053–1062. doi: 10.1016/j.jmb.2005.01.009. ●The authors use the PRE to show that denatured acyl coenzyme A binding protein has some residual structure with long-range interactions present. [DOI] [PubMed] [Google Scholar]
- 20.Vise P, Baral B, Stancik A, Lowry DF, Daughdrill GW. Identifying long-range structure in the intrinsically unstructured transactivation domain of p53. Proteins: Struct Funct Bioinformatics. 2007;67:526–530. doi: 10.1002/prot.21364. ●The PRE is used to demonstrate the presence of long-range transient structure for the intrinsically disordered activation domain of p53. [DOI] [PubMed] [Google Scholar]
- 21.Mahoney NM, Rastogi VK, Cahill SM, Girvin ME, Almo SC. Binding orientation of proline-rich peptides in solution: polarity of the profilin-ligand interaction. J Am Chem Soc. 2000;122:7851–7852. [Google Scholar]
- 22.Mal TK, Ikura M, Kay LE. The ATCUN domain as a probe of intermolecular interactions: application to calmodulin-peptide complexes. J Am Chem Soc. 2002;124:14002–14003. doi: 10.1021/ja028109p. [DOI] [PubMed] [Google Scholar]
- 23.Gross JD, Moerke NJ, van deer Haar R, Lugovsky AA, Sachs AB, McCarthy JE, Wagner G. Ribosome loading onto the mRNA cap is driven by conformational coupling between eIF4G and eIF4E. Cell. 2003;115:739–750. doi: 10.1016/s0092-8674(03)00975-9. [DOI] [PubMed] [Google Scholar]
- 24.Card PB, Erbel PJA, Gardner KH. Structural basis of ARNT PAS-B dimerization: use of a common β-sheet interface for hetero- and homodimerization. J Mol Biol. 2005;353:664–677. doi: 10.1016/j.jmb.2005.08.043. [DOI] [PubMed] [Google Scholar]
- 25.Johnson PE, Brun E, MacKenzie LF, Withers SG, McIntosh LP. The cellulose-binding domains from Cellulomonas fimi β-1,4-glucanase CenC bind nitroxide spin-labeled cellooligosaccharides in multiple orientations. J Mol Biol. 1999;287:609–625. doi: 10.1006/jmbi.1999.2627. [DOI] [PubMed] [Google Scholar]
- 26.Jain NU, Venot K, Umemoto H, Leffler H, Prestegard JH. Distance mapping of protein binding sites using spin-labeled oligosaccharide ligands. Protein Sci. 2001;10:2393–2400. doi: 10.1110/ps.17401. [DOI] [PMC free article] [PubMed] [Google Scholar]
- 27.Macnaughtan MA, Kamar M, Alvarez-Manilla G, Venot A, Glushka J, Pierce JM, Prestegard JH. NMR structural characterization of substrates bound to N-acetylglucosaminyltransferase. J Mol Biol. 2007;366:1266–1281. doi: 10.1016/j.jmb.2006.12.015. ●●The authors make use of a novel PRE experiment arising from a spin-labeled analogue of one of the two ligands of the 95 kDa enzyme N-acetylglucosaminyltransferase V to elucidate the orientation of the bound donor and acceptor ligands. [DOI] [PMC free article] [PubMed] [Google Scholar]
- 28.Ramos A, Varani G. A new method to detect long-range protein-RNA contacts; NMR detection of electron-proton relaxation induced by nitroxide spin-labeled RNA. J Am Chem Soc. 1998;120:10992–10993. [Google Scholar]
- 29.Varani L, Gundersdon IW, Mattaj IW, Kay LE, Neuhaus D, Varani G. The NMR structure of the 38 kDa U1A protein-PIE RNA complex reveals the basis of cooperativity in regulation of polyadenylation by human U1A protein. Nature Struct Biol. 2000;7:329–335. doi: 10.1038/74101. [DOI] [PubMed] [Google Scholar]
- 30.Iwahara J, Anderson DE, Murphy EC, Clore GM. EDTA-derivatized deoxythymidine as a tool for rapid determination of protein binding polarity to DNA by intermolecular paramagnetic relaxation enhancement. J Am Chem Soc. 2003;125:6634–6635. doi: 10.1021/ja034488q. [DOI] [PubMed] [Google Scholar]
- 31.Iwahara J, Schwieters CD, Clore GM. Ensemble approach for NMR structure refinement against 1H paramagnetic relaxation enhancement data arising from flexible paramagnetic group attached to a macromolecule. J Am Chem Soc. 2004;126:5879–5896. doi: 10.1021/ja031580d. [DOI] [PubMed] [Google Scholar]
- 32.Ueda T, Kato A, Ogawa T, Torizawa T, Kuramitsu S, Iwai S, Terasawa H, Shimada I. NMR study of repair mechanism of DNA photolyase by FAD-induced paramagnetic relaxation enhancement. J Biol Chem. 2004;279:52574–52579. doi: 10.1074/jbc.M409942200. [DOI] [PubMed] [Google Scholar]
- 33.Roosild TP, Greenwald J, Vega S, Castronovo S, Riek R, Choe S. NMR structure of Mistic, a membrane-integrating protein for membrane protein expression. Science. 2005;307:1317–1321. doi: 10.1126/science.1106392. ●An example of the use of the PRE as an aid in structure determination of membrane bound proteins. [DOI] [PubMed] [Google Scholar]
- 34.Liang B, Bushweller JH, Tamm LK. Site-directed parallel spin-labeling and paramagnetic relaxation enhancement in structure determination of membrane proteins by solution NMR spectroscopy. J Am Chem Soc. 2006;128:4389–4397. doi: 10.1021/ja0574825. ●A demonstration of the utility of the PRE arising from multiple spin-labeled sites to facilitate the structure determination of a membrane bound protein for which traditional NOE data are sparse and difficult to obtain. [DOI] [PMC free article] [PubMed] [Google Scholar]
- 35.Iwahara J, Clore GM. Detecting transient intermediates in macromolecular binding by paramagnetic NMR. Nature. 2006;440:1227–1230. doi: 10.1038/nature04673. ●●PRE data collected on the HoxD9 homeodomain/DNA specific complex at moderate salt concentrations provides the first direct demonstration for the existence of transient intermediates formed in a stochastic manner at non-cognate sites involving both intramolecular sliding of HoxD9 along the DNA and intermolecular hopping of HoxD9 from one DNA molecule to another. [DOI] [PubMed] [Google Scholar]
- 36.Hansen DF, Hass MAS, Christensen HM, Ulstrup J, Led JJ. Detection of short-lived transient protein-protein interactions by intermolecular nuclear paramagnetic relaxation: plastocyanin from Anabaena variabilis. J Am Chem Soc. 2003;125:6858–6859. doi: 10.1021/ja034013z. [DOI] [PubMed] [Google Scholar]
- 37.Tang C, Iwahara J, Clore GM. Visualization of transient encounter complexes in protein-protein association. Nature. 2006;444:383–386. doi: 10.1038/nature05201. ●●This paper illustrates the first quantitative demonstration of the use of the PRE to demonstrate the existence and visualize the distribution of an ensemble of transient non-specific encounter complexes under equilibrium conditions in protein-protein association. The existence of such encounter complexes is demonstrated for three different protein-protein associations involving complexes from the bacterial phosphotransferase system. [DOI] [PubMed] [Google Scholar]
- 38.Volkov AN, Worall JAR, Holtzmann H, Ubbink M. Solution structure and dynamics of the complex between cytochrome c and cytochrome c peroxidase determined by paramagnetic NMR. Proc Natl Acad Sci USA. 2006;103:18945–18950. doi: 10.1073/pnas.0603551103. ●●The conformational space sampled by two electron transfer proteins prior to the formation of a stereospecific electron transfer complex is investigated using the PRE. [DOI] [PMC free article] [PubMed] [Google Scholar]
- 39.Iwahara J, Schwieters CD, Clore GM. Characterization of nonspecific protein-DNA interactions by 1H paramagnetic relaxation enhancement. J Am Chem Soc. 2004;126:12800–12808. doi: 10.1021/ja046246b. [DOI] [PubMed] [Google Scholar]
- 40.Iwahara J, Zweckstetter M, Clore GM. NMR structural and kinetic characterization of a homeodomain diffusing and hopping on non-specific DNA. Proc Nat Acad Sci USA. 2006;103:15062–15067. doi: 10.1073/pnas.0605868103. ●●This paper makes use of multiple NMR spectroscopic techniques to characterize the structural and kinetic features of a nonspecific protein-DNA complex in which the protein can both hop and slide on the DNA. The data demonstrate unambiguously that HoxD9 binds to nonspecific DNA with the same binding mode and orientation as that observed for the specific complex. [DOI] [PMC free article] [PubMed] [Google Scholar]
- 41.Baker KA, Hilty C, Peti W, prince A, Pfaffinger PJ, Wider K, Wüthrich K, Choe S. NMR-derived dynamic aspects of N-type inactivation of a Kv channel suggest a transient interaction with the T1 domain. Biochemistry. 2006;45:1663–1672. doi: 10.1021/bi0516430. ●●PRE measurements are used to demonstrate that there exists a small population of conformers in which the N-terminal inactivation peptide of the voltage-gated K+ channel is in close proximity to the tetramerization domain, providing direct evidence for large scale interdomain motions. [DOI] [PMC free article] [PubMed] [Google Scholar]
- 42.Iwahara J, Tang C, Clore GM. Practical aspects of 1H transverse paramagnetic relaxation enhancement measurements on macromolecules. J Magn Reson. 2007;184:185–195. doi: 10.1016/j.jmr.2006.10.003. ●●A detailed analysis of the practical aspects of PRE measurements is presented. [DOI] [PMC free article] [PubMed] [Google Scholar]
- 43.Kuszewski J, Schwieters CD, Garrett DS, Byrd RA, Tjandra N, Clore GM. Completely automated, highly error tolerant macromolecular structure determination from multidimensional nuclear Overhauser enhancement spectra and chemical shift assignments. J Am Chem Soc. 2004;126:6258–6273. doi: 10.1021/ja049786h. [DOI] [PubMed] [Google Scholar]
- 44.Berg OG, von Hippel PH. Diffusion-controlled macromolecular interactions. Ann Rev Biophys Biophys Chem. 1985;14:131–160. doi: 10.1146/annurev.bb.14.060185.001023. [DOI] [PubMed] [Google Scholar]
- 45.von Hippel PH, Berg OG. Facilitated target location in biological systems. J Biol Chem. 1989;264:675–678. [PubMed] [Google Scholar]
- 46.Halford SE, Marko JF. How do site-specific DNA-binding proteins find their targets? Nucl Acids Res. 2004;32:3040–3052. doi: 10.1093/nar/gkh624. [DOI] [PMC free article] [PubMed] [Google Scholar]
- 47.Zhou HX, Szabo A. Enhancement of association rates by non-specific binding to DNA and cell membranes. Phys Rev Lett. 2004;204(93):178101. doi: 10.1103/PhysRevLett.93.178101. [DOI] [PubMed] [Google Scholar]
- 48.Iwahara J, Clore GM. Direct observation of enhanced translocation of a homeodomain between DNA cognates sites by NMR exchange spectroscopy. J Am Chem Soc. 2006;128:404–405. doi: 10.1021/ja056786o. ●●A novel approach is described to analyze the kinetics of specific protein-DNA interactions using z-exchange spectroscopy on a system in which the DNA binding protein is mixed with equimolar amounts of two DNA duplexes differing by a single base pair mutation at the edge of the DNA recognition site thereby producing slightly different chemical shifts for the two complexes without perturbing the equilibrium dissociation constant. Rapid direct hopping of HoxD9 from one DNA molecule to another without going through the intermediary of free protein is demonstrated with translocation rates that are over three orders of magnitude faster than the dissociation rate constant determined from gel shift assays at very low concentrations of free DNA. [DOI] [PubMed] [Google Scholar]
- 49.Schreiber G, Fersht AR. Rapid electrostatically assisted association of proteins. Nature Struct Biol. 1996;3:427–431. doi: 10.1038/nsb0596-427. [DOI] [PubMed] [Google Scholar]
- 50.Selzer T, Albeck S, Schreiber G. Rational design of faster asociating and tighter binding complexes. Nature Struct Biol. 2000;7:537–541. doi: 10.1038/76744. [DOI] [PubMed] [Google Scholar]
- 51.Northrup SH, Boles JO, Reynolds JCL. Brownian dynamics of cytochrome c and cytochrome c peroxidase association. Science. 1988;241:67–70. doi: 10.1126/science.2838904. [DOI] [PubMed] [Google Scholar]
- 52.Spaar A, Dammer C, Gabdoulline RR, Wade RC, Helms V. Diffusional encounter of barnase and barstar. Biophys J. 2006;90:1913–1924. doi: 10.1529/biophysj.105.075507. [DOI] [PMC free article] [PubMed] [Google Scholar]
- 53.Adams G, Delbruck M. Reduction of dimensionality in biological diffusion processes. In: Rich A, Davdison N, editors. Structural Chemistry and Molecular Biology. Freeman & Co; San Francisco: 1968. pp. 198–215. [Google Scholar]
- 54.Garrett DS, Seok YJ, Peterkofsky A, Gronenborn AM, Clore GM. Solution structure of the 40,000 Mr phosphoryl transfer complex between the N-terminal domain of enzyme I and HPr. Nature Struct Biol. 1999;6:166–173. doi: 10.1038/5854. [DOI] [PubMed] [Google Scholar]
- 55.Schwieters CD, Kuszewski J, Clore GM. Using Xplor-NIH for NMR molecular structure determination. Progr Nucl Magn Reson Spectroscopy. 2006;38:47–62. [Google Scholar]
- 56.Sugase K, Dyson JH, Wright PE. Mechanism of coupled folding and binding of an intrinsically disordered peptide. Nature. 2007 doi: 10.1038/nature05858. Advance online publication doi:10.1038/nature05860. ●●Using chemical shift mapping and NMR relaxation dispersion analysis the authors show that non-specific encounter complexes are formed during the course of coupled folding and binding of an intrinsically disordered peptide to its target protein. [DOI] [PubMed] [Google Scholar]
- 57.Hillisch A, Lorenz M, Diekman S. Recent advances in FRET: distance determination in protein-DNA complexes. Curr Op Struct Biol. 2001;11:201–207. doi: 10.1016/s0959-440x(00)00190-1. [DOI] [PubMed] [Google Scholar]
- 58.Murphy EC, Zhurkin VB, Louis JM, Cornilescu G, Clore GM. Structural basis for SRY-dependent 46-X,Y sex reversal: modulation of DNA bending by a naturally occuring point mutation. J Mol Biol. 2001;312:481–499. doi: 10.1006/jmbi.2001.4977. [DOI] [PubMed] [Google Scholar]