Abstract
Gd-DO3A-diph and Gd-AAZTAC17 are lipophilic magnetic resonance imaging (MRI) agents that display high affinity for low-density lipoprotein (LDL) particles. However, on binding to LDL, Gd-DO3A-diph shows a decreased hydration that results in a lower enhancement of water proton relaxation rate. Conversely, Gd-AAZTAC17 displays a strong relaxation enhancement at the imaging fields. Each LDL particle can load up to 100 and 400 UNITS of Gd-DO3A-diph and Gd-AAZTAC17, respectively. Their LDL adducts are taken up by human hepatoblastoma G2 (HepG2) and melanoma B16 tumor cells when added to the incubation medium. T1 measurements of the labeled cells indicate that Gd-AAZTAC17 is significantly more efficient than Gd-DO3A-diph. Furthermore, it has been found that HepG2 hepatoma cells can internalize higher amounts of Gd-AAZTAC17 than B16 cells and the involvement of LDL receptors (LDLRs) has been demonstrated in competition assays with free LDL. Gd-AAZTAC17/LDL adduct proved to be an efficient probe in the magnetic resonance (MR) visualization of subcutaneous tumors in animal models obtained by injecting B16 melanoma cells into the right flank of mice. Finally, confocal microscopy validation of the distribution of LDL-based probes in the tumor has been obtained by doping the Gd-AAZTAC17/LDL adduct with a fluorescent phospholipid moiety.
Keywords: Magnetic resonance imaging, LDL, Gd complexes, tumor, dual imaging probe
Introduction
The possibility of designing molecular imaging protocols based on magnetic resonance imaging (MRI) is very attractive because of the superb anatomical resolution that is attainable by this technique. However, MRI suffers from an intrinsic insensitivity with respect to the competing imaging modalities. This drawback has to be overcome in designing suitable amplification procedures based both on the development of reporting units endowed with an enhanced sensitivity and on the identification of efficient routes of accumulation of imaging agents at the targeting sites [1–3].
The contrast agents which are routinely used in clinical practice are mainly paramagnetic chelates of Gd3+ ions that act by enhancing the longitudinal relaxation rate of water protons (1/T1) in the tissues where they distribute. Much has been done in the last two decades to identify the structural and dynamic characteristics of Gd(III) chelates to improve their relaxivity (r1p = relaxation enhancement of water protons in the presence of the paramagnetic complex at 1 mM concentration) [4–6]. However, the success of a magnetic resonance (MR) molecular imaging protocol strongly relies on the amplification effects associated with the accumulation of the agents at the cells of interest. A general strategy for achieving this goal uses nanosized systems such as liposome, micelles, microemulsions, polymers, and so on, to deliver a huge payload of Gd complexes [7–11]. The nanocarriers are then functionalized with the suitable vectors that provide the overall particles with the required recognition capabilities toward the selected cellular target. A straightforward extension of this approach involves the exploitation of naturally occurring nanosized aggregates such as the different types of lipoproteins [12,13]. These proteins represent an attractive option because they are endogenous constituents of blood, consisting of an insoluble core of cholesterol esters and triglycerides surrounded by a shell of amphipathic phospholipids and specialized proteins called apolipoproteins. The low-density lipoproteins (LDLs) are members of the lipoproteins family and are the main biological carriers in human plasma of unesterified and esterified cholesterol to extrahepatic tissue. The membrane-associated protein ApoB100 mediates the recognition of the LDL to its receptor and the subsequent uptake into cells through receptor-mediated endocytosis [14]. The complex LDL-LDL receptor (LDLR) is internalized through clathrincoated pits, and entrapped into endosomes where LDL dissociate from the LDLR, which can recycle back to the cell surface to bind another LDL particle. LDL is then transported to lysosomes where it is degraded releasing cholesterol that is used for the synthesis of plasma membrane, steroid hormones, and bile acids. With a recycle time of 10 minutes and a lifetime of 24 hours, LDLR efficiently transports many LDL to LDLR-expressing cells. Among nonmalignant tissues, liver, adrenal glands, and ovaries make use of the LDLR system. Altered LDLR levels are found in a variety of pathological conditions (e.g., atherosclerosis) [15] and several tumors overexpress LDLR to supply the high cholesterol demand of a rapidly dividing cell [16]. In nonmalignant conditions, high levels of LDLR can be regulated directly by the physiological cholesterol homeostasis or by pharmacological intervention. In contrast, such regulation is absent in tumor-expressing LDLR. In the last few years, there has been much interest to exploit the LDL transporting system beyond its biological significance of lipid transport and cholesterol homeostasis to investigate its potential in the diagnosis and/or therapeutic delivery of LDL-based drugs to neoplastic tissues.
Several authors report the use of LDL as carriers for hydrophobic drugs such as antitumoral drugs [17,18], photodynamic therapy agents [19–21], and imaging probes [22–28]. Recently, Corbin et al. [29] reported the MRI visualization of human hepatoblastoma G2 (HepG2) xenographs in mice using a Gd-diethylenetriaminepentaaceticacid (DTPA)-bis(stearylamide) complex able to form strong adducts with LDL. This work has clearly established that Gd-loaded LDL particles are very good systems for targeting tumor cells. Unfortunately, the proposed system displays a relatively low relaxivity. This drawback is intrinsically related to the relaxometric properties of the bis-amide Gd3+-DTPA complex as it has been well established that for this class of complexes the long exchange lifetime of the coordinated water quenches any relaxation enhancement that is expected on formation of slowly moving macromolecular chelates [30]. Moreover, the use of DTPA bis-amide as chelating system might not yield to produce sufficiently stable complexes as it has been shown that Gd-DTPA-BMA (diethylenetriaminepentaacetic bis-methyl-amide) system release high amounts of Gd3+ ions in the incubation medium that are taken up by tumor cells [31]. Finally, the complexation procedure followed in the work of Corbin et al. [29] does not guarantee that all the added Gd is sequestered by the DTPA ligand because the complexation step takes place when the lipophilic ligand has already been incorporated in the LDL particle. It might be possible that other coordinating environments, exhibiting even lower stability, become available on the surface of the particle involving, for instance, oxygen of the phospholipid heads and/or donor groups on the amino acid residue of the ApoB100 protein. On this basis, it was deemed interesting to develop new Gd-loaded LDL systems characterized by an enhanced relaxivity and an improved thermodynamic stability of the Gd-containing cages.
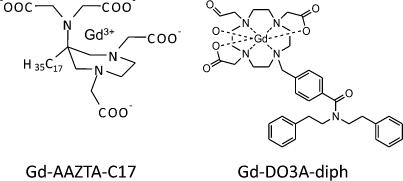
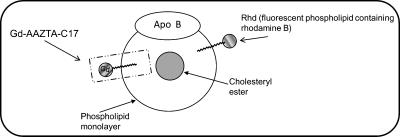
In this study, two novel Gd complexes, namely Gd-DO3A-diph and Gd-AAZTAC17 (Figure 1), containing a hydrophobic moiety (able to intercalate in the LDL phospholipid monolayer) were considered. Both complexes have two coordinated water molecules (q = 2) in fast exchange with the solvent. The relaxation enhancement showed by Gd-AAZTAC17 after binding to fatty acid-free human serum albumin (HSA) ( (20 MHz, 298 K) = 84 mM-1 s-1) is by far the highest relaxivity reported until now for noncovalent paramagnetic adducts with slowly moving substrates [32]. Furthermore, LDLs were also loaded with a fluorescent phospholipid obtaining a bimodal imaging probe (Figure 2) that allowed assessment of its intracellular localization on a microscopic level.
Figure 1.
Schematic representation of Gd-AAZTAC17 and Gd-DO3Adiph complexes.
Figure 2.
Schematic representation of LDL labeled with Gd-based and fluorescent probes.
Materials and Methods
1H nuclear magnetic resonance (NMR) and 13C NMR spectra were measured with a Bruker AC 200 spectrometer (200 and 50.3MHz, respectively) (Bruker BioSpin S.r.l., Milan, Italy). Mass spectra were obtained with a VG 7070 EQ spectrometer (VG Instruments, Manchester, UK).
The longitudinal water proton relaxation rates were measured on the Stelar Spinmaster spectrometer (Stelar, Mede, Italy) operating at 20MHz by means of the standard inversion-recovery technique (16 experiments, 2 scans). A typical 90° pulse width was 3.5 µs and the reproducibility of the T1 data was ± 0.5%. The 1/T1 nuclear magnetic relaxation dispersion (NMRD) profiles of water protons were measured over a continuum of magnetic field strength from 0.00024 to 0.5 T (corresponding to 0.01–20 MHz proton Larmor frequency) on the fast field-cycling relaxometer (Stelar Spinmaster FFC 2000; Stelar) equipped with a silver magnet. The relaxometer operates under complete computer control with an absolute uncertainty in the 1/T1 values of ± 1%. The typical field sequences used were the nonpolarized sequence between 40 and 8 MHz and prepolarized sequence between 8 and 0.01 MHz. The observation field was set at 13 MHz. Sixteen experiments of two scans each were used for the T1 determination for each field. All starting materials were obtained from Sigma-Aldrich Co. (St. Louis, MO) and were used without futher purification.
Gd-AAZTAC17 (AAZTAC17 = 6-bis(carboxymethyl) amino-4-carboxymethyl-6-heptadecyl-1,4-diazepan-1-yl]acetic acid) was synthesized according to the previously reported procedure [32].
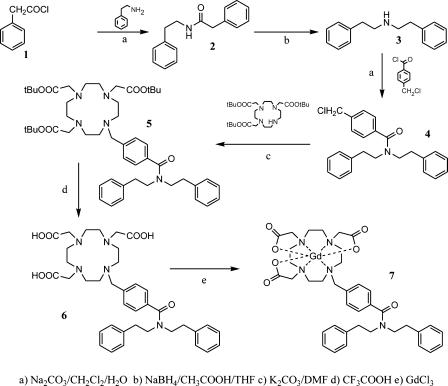
Synthesis of Gd-DO3A-diph
N-Phenethyl-2-phenylacetamide (2): 2-Phenethylamine (2.63 g, 21.7 mmol) was added to a vigorously stirred mixture of CH2Cl2 (40 ml) and H2O (10 ml), where 2-phenylacethylchloride 1 (3.36 g, 21.7 mmol) and Na2CO3 (11.5 g, 108.5 mmol) were previously solubilized. After 8 hours, NaOH (40 ml, 0.5 M) was added and the reaction products were extracted with CH2Cl2. The organic phase was washed twice with HCl (0.5 M), dried over Na2SO4, and filtered. Evaporation of the solvent afforded 4.11 g of compound 2 (79%) as a white amorphous solid. 1H NMR (200 MHz, CDCl3); δ 7.35-7.02 (m, 10H), 5.38 (m, 1H), 3.55-3.42 (m, 4H), 2.77-2.70 (m, 2H), m/z (EI) 239.
Diphenethylamine (3): N-Phenethyl-2-phenylacetamide 2 (1.5 g, 6.26 mmol) was added to a stirred suspension of NaBH4 (2.37 g, 62.65 mmol) in tetrahydrofolate (20 ml) at 10°C. CH3COOH (3.76 g, 62.61 mmol) was slowly added dropwise and the reaction was then refluxed for 6 hours. Water was added (3 ml) and the tetrahydrofolate was removed at reduced pressure affording a white solid, which, after filtration, was extracted with 3 M HCl (100 ml) and toluene (3 x 50 ml). The organic phase was dried with Na2SO4 and the solvent was evaporated at reduced pressure. The compound 3 was isolated as hydrochloride (1.06 g, 75%). 1H NMR (200 MHz, CDCl3) δ 2.70–2.77 (m, 4H); 3.01–3.07 (m, 4H); 7.07–7.17 (m, 10H). m/z (FAB) 226 (M + 1).
4-(Chloromethyl)-N,N-diphenethylbenzamide (4): 4-(Chloromethyl)benzoyl chloride (0.59 g, 3.12 mmol), diphenethylamine 3 (0.63 g, 2.4 mmol), and Na2CO3 (1.27 g, 12 mmol) were added to a binary phase system constituted by CH2Cl2 (15 ml) and H2O (5 ml). The mixture was stirred for 8 hours and was then diluted with H2O and CH2Cl2. The two phases were separated and the organic phase was dried with Na2SO4; the solvent was evaporated in vacuo to afford a crude material which was purified by flash column chromatography (silica gel, petroleum ether/ethyl acetate 8:2) to give 4 a pale yellow oil (0.53 g, 59%). 1H NMR (200 MHz, CDCl3) δ 7.37-6.88 (m, 14H); 4.60 (s, 2H); 3.83-2.68 (m, 8H). δc 34.97; 33.71; 45.55; 51.16; 46.84; 126.47; 126.70; 128.51; 136.76; 137.70; 138.30; 139.03; 171.25. m/z (EI) 378.
10-[4-(Diphenethylcarbamoyl)benzyl]-1,4,7,10-tetrazacyclododecane-1,4,7-triacetic acid tri tert-butyl ester (5): A suspension of anhydrous K2CO3 (0.39 g, 2.82 mmol), 1,4,7,10-tetrazacyclododecane-1,4,7-triacetic acid tri tert-butyl ester 5 (0.63 g, 1.23 mmol), and compound 4 (0.46 g, 1.23 mmol) was stirred at 120°C in dry dimethylformamide (7 ml) for 3 days. The solvent was evaporated under reduced pressure and the residue was extracted with H2O and CH2Cl2. The organic phase was dried with Na2SO4 and the crude material obtained after concentrating the solution was purified by flash column chromatography (silica gel, CH2Cl2/MeOH/conc. NH3 9:1:0.1). The pure product 5 was obtained as an amorphous solid (0.25 g, 24%). 1H NMR (200 MHz, CDCl3) δ 7.54–6.88 (m, 14H); 3.89-2.29 (m, 32H); 1.58-1.46 (s, 27H). δc 27.82; 27.74; 34.95; 33.67; 49.56; 51.20; 46.77; 55.86; 55.52; 59.02; 82.25; 82.75; 126.45; 128.46; 129.79; 136.17; 137.62; 138.23; 171.18; 172.40; 173.41. m/z (EI) 856.
10-[4-(Diphenethylcarbamoyl)benzyl]-1,4,7,10-tetrazacyclododecane-1,4,7-triacetic acid (6) (DO3A-diph): A solution of 5 (0.22 g, 2.62 mmol) in trifluoroacetic acid (12 ml) was stirred for 8 hours at room temperature. The acid was removed under reduced pressure and the residue was taken up in methanol (3 ml). Addition of diethyl ether to this solution led the formation of a precipitate which was collected by filtration to afford 6 (0.112 g, 62%) as an amorphous pale yellow solid. 1H NMR (200 MHz, D2O) δ 7.35-6.62 (m, 14H); 4.30-2.29 (m, 2H); δc 133.34; 127.46; 141.30; 139.36; 165.31; 164.60; 174.57. m/z (FAB) 688 (M + 1); 710 (M + Na).
10-[4-(Diphenethylcarbamoyl)benzyl]-1,4,7,10-tetrazacyclododecane-1,4,7-triacetic acid Gd complex (7) (Gd-DO3A-diph): An equimolar amount of GdCl3 solution was slowly added to a 5 mM ligand solution maintaining the pH value at 6.5 with NaOH. The mixture was allowed to stir overnight at room temperature, the pH raised to 8.5, and then the mixture was stirred for 2 hours. Centrifugation at 7000 rpm for 5 minutes at 10°C allowed the separation of Gd(OH)3 from the solution. The amount of residual-free Gd3+ ion was assessed by the Orange Xylenol (Sigma-Aldrich) UV method [33]; the overall Gd contents was determined by 1H NMR T1 measurement of the mineralized complex solution (in 6M HCl at 120°C for 16 hours). Gd3+ concentrations were determined from a calibration curve obtained with standard GdCl3 solutions (from 0.01 to 2mM). The method was double-checked by inductively coupled plasma (ICP) measurements and an excellent correspondence in quantifying Gd by the two methods has been found. When the amount of residual-free Gd3+ ion was higher than 0.3% (mol/mol), an equivalent amount of ligand was added and allowed to react overnight.
Mass spectrometry yielded very intense molecular peak at m/z = 863.2, 864.2, 865.2 (M + Na) with an isotopic distribution pattern consistent with the presence of coordinated Gd.
LDL Adducts Preparation
Gd-AAZTAC17 and Gd-DO3A-diph were incubated with native human LDL (Biomedical Technology, Stoughton, MA) at 37°C for 2 hours using a complex/LDL molar ratio of 300:1 and 80:1, respectively. The concentration of the Gd complexes was below their critical micellar concentration (CMC) (0.09 mM) to avoid the binding of the complexes in their micellar form with the LDL particles. The CMC was determined by measuring the 1H NMR relaxation rates as a function of Gd complex concentration as shown in the study of Gianolio et al. [32]. In fact, self-assembling systems such as Gd-AAZTAC17 show a variation of the linear slope of the relaxation rate when the system passes from the monomeric state to micellar aggregates. The intercept between the two straight lines (low and high concentration ranges) provides a good estimate of the CMC value.
The LDL adducts were concentrated to a final volume of 1ml using Vivaspin centrifuge filters (Sigma) (molecular weight cutoff = 10,000), and the unbound complex was eliminated by washing three times with 5 ml of PBS in the same tubes. The final Gd concentration was determined by 1H NMR T1 measurement of the mineralized complex solution (in 6 M HCl at 120°C for 16 hours) and the protein concentration was determined by a commercial Bradford assay (Biorad, Hercules, CA). The labeling of LDL with the fluorescent phospholipid 1,2-dioleoyl-sn-glycero-3-phosphoethanolamine-n-lissamine rhodamine B (Avanti Polar Lipids, Alabaster, AL) was carried out by dissolving 0.075 mmol of the fluorescent phospholipid (rhodamine-labeled phospholipid (Rdh)) in 2 ml of chloroform. The lipid was dried under reduced pressure and then hydrated in 5 ml of 150 µg/ml LDL (Rdh/LDL, 50:1) and heated at 37°C for 2 hours. Gd-AAZTAC17 was then intercalated in the LDL containing Rdh as described above.
Size
The hydrated mean diameter of the adducts was determined using a Malvern dynamic light-scattering spectrophotometer (Malvern Instruments, Malvern, UK). All samples were analyzed at 25°C in filtered (cutoff = 30 nm) PBS buffer (pH 7).
Cell Culture
Mouse melanoma cell line (B16-F10) and human liver carcinoma cell line (HepG2) were obtained from the American Type Culture Corporation. The B16 and HepG2 cells were cultured in RPMI 1640 and minimum essential medium, respectively; both media contained 4.5 g/l glucose, 10% (v/v) FBS, 2 mM glutamine, 100 U/ml penicillin, and 100 µg/ml streptomycin. The cells were incubated at 37°C in a humidified atmosphere of 5% CO2. At 80% confluency, cells were trypsinized with 0.1% trypsin and 0.02% EDTA in PBS.
Cell Viability
Cell viability was measured using a colorimetric assays based on the ability of the cells to cleave tetrazolium salts by mitochondrial dehydrogenases (WST-1, 4-[3-[4-lodophenyl]-2-4 (4-nitrophenyl)-2H-5-tetrazolio-1,3-benzene disulfonate]). Assays were performed according to the manufacturer's instructions (Roche Molecular Biochemical, Mannheim, Germany). A total of 80,000 B16 and 100,000 HepG2 cells/well were seeded in 24-well plates in culture medium. The day after, cells were incubated with the same medium containing 10% of a lipoprotein-deficient serum (LPDS) to increase LDLRs' expression [34]. After 24 hours, cells were incubated with zero or different concentrations (10, 30, and 60 mg/ml) of Gd-AAZTAC17-LDL, Gd-AAZTAC17, or LDL in medium containing LPDS. After 16 hours of exposure, cells were washed twice with PBS before adding the cell proliferation reagent WST-1, and incubated for 1 hour of shaking at 37°C. Absorbance (A480) was determined using an spectrophotometer (Cadas 200; Lange, Hegnau, Switzerland). Viability was reported relative to untreated control cells and was expressed as a percentage of the control value. Experiments were repeated three times in two replicates.
Uptake Experiments
For the in vitro uptake experiments, about 3 x 10⁵ of B16 and 5 x 10⁵ HepG2 were seeded in 6-cm-diameter culture dishes. The day after, cells were incubated for 24 hours with culture media added with 10% LPDS to increase LDLR expression. After 24 hours, cells were incubated for 16 hours with increasing concentrations of LDL adducts (10–60 µg/ml). At the end of incubation, cells were washed three times with 10 ml ice-cold PBS, detached with trypsin/EDTA, and transferred into glass capillaries for MRI analysis (see below). Gd content of B16 and HepG2 was determined using inductively coupled plasma mass spectrometry (ICP-MS) (Element-2; Thermo-Finnigan, Rodano (MI), Italy). Sample digestion was performed with 2 ml of concentrated HNO3 (70%) under microwawe heating (Milestone MicroSYNTH Microwave labstation equipped with an optical fiber temperature control and HPR-1000/6M six position high-pressure reactor, Bergamo, Italy). After digestion, the volume of each sample was brought to 2 ml with ultrapure water and the sample was analyzed by ICP-MS. Three replicates of each sample solution were analyzed. Protein concentration of each sample was determined from cell lysates by the Bradford method using bovine serum albumin as standard.
Experimental Mice and Induction of Transplantable Tumors
Adult C57BL/6 mice were maintained in specific pathogenfree conditions at both the animal facilities of the Department of Clinical and Biological Sciences, Turin University, Italy, and Charles River Laboratories (Calco, Italy). Handling and all manipulations were carried out in accordance with the European Community guidelines, and all the experiments were approved by the Ethical Committee of the University of Turin. B16 cells line were cultured as described above and tumors were generated by subcutaneous injection into the right flank of 2 x 10⁵ cells in 0.2 ml PBS. One week after B16 injection, mice developed solid tumor of 3 to 4 mm in diameter and were used for imaging evaluation and/or for the confocal analysis.
MRI
All MR images were acquired on a Bruker Avance300 spectrometer (7 T) equipped with a Micro 2.5 microimaging probe (Bruker BioSpin). The system is equipped with two birdcage resonators with 30- and 10-mm inner diameter, respectively.
In vitro The glass capillaries containing about 2 x 10⁶ cells were placed in an agar phantom and MR imaging was performed using a standard T1-weighted multislice multiecho sequence (TR/TE/NEX = 200:3.3/8, FOV = 1.2 cm, one slice = 1 mm, in-plane resolution = 94 x 94 µm).
In vivo Before MRI examination, animals were anesthetized by injecting tiletamine/zolazepam (Zoletil 100; Virbac, Milan, Italy) 20 mg/kg + xylazine (Rompun; Bayer, Milan, Italy) 5 mg/kg.
Gd-AAZTAC17 or Gd-AAZTAC17/LDL (300:1) or Gd-AAZTAC17/Rhd/LDL (300:50:1) (0.06 mmol/kg) was injected through tail vein injection in groups 1 (n = 7 mice), 2 (n = 10 mice), and 3 (n = 3 mice), respectively.
In groups 1 and 2, MR images were acquired before, 10 and 30 minutes after, and 3, 8, 24, and 48 hours after the contrast administration using a T1-weighted, fat-suppressed, multislice multiecho protocol (TR/TE/NEX = 250:3.2:6, FOV = 3 cm, one slice = 1 mm). Fat suppression was performed by applying a presaturation pulse (90° BW = 1400 Hz) at the absorption frequency of fat (-1100 Hz from water). Group 3 mice were examined by MRI before and 8 hours after Gd-AAZTAC17/Rhd/LDL administration, then were sacrificed by intramuscular injection of a lethal dose of anesthesia. Their tumors were then excised, fixed, and analyzed by MRI and confocal microscopy. Ex vivo imaging was performed using a T1-weighted spin echo protocol (TR/TE/NEX = 250:3.2:12, FOV = 2.6 cm, one slice = 0.7 mm). Two tumors from untreated mice were analyzed as control.
Imaging Data Analysis and Processing
The mean signal intensity (SI) values were calculated on a region of interest (ROI) manually drawn on the whole tumor, and on the muscle, kidneys, and liver, in all intervals whenever MR imaging was performed. The mean SI measured was normalized using a standard Gd solution. The mean SI enhancement (% enhancement) of target tissues (TTs) was calculated according to the following equation:
In a second set of analysis, pixels were defined enhanced when SI was increased more than three times the SD of the tumor signal at baseline (i.e., enhancement > 60% of the variation seen at baseline). Student's t test was used to compare the differences between groups. A P value < 0.05 was considered statistically significant.
Confocal Analysis
After MRI examination, the excised tumors from group 3 mice were washed in rinse water, treated with 0.1 mol Tris (pH 7.5) with 0.2% glycine, then dewaxed, and embedded in paraffin wax. Serial sections (4 µm) were taken and finally mounted on glass microscope slides (Bacto Laboratories, New South Wales, Australia). HepG2 and B16 cells grown to 80% confluence were detached from the dishes with a solution of trypsin (0.05%) in PBS/1 mM EDTA, washed and maintained in suspension in serum-free medium to recover from trypsin treatment. The cells were seeded on glass coverslips in six-well plastic dishes (3 x 10⁵ cells in each 60-mm well) and were allowed to attach overnight at 37°C and 5% CO2 in their respective medium. The following morning, the cells were rinsed twice in PBS and then incubated for 24 hours in a medium containing 10% of LPDS at 37°C. Cells were then incubated with Gd-AAZTAC17/Rhd/LDL (30 µg/ml LDL) for 30 minutes and for 3, 8, 24, and 48 hours. After rinsing three times with PBS, the cells were fixed with 4% formaldehyde in PBS for 10 minutes followed by two washes with PBS. The coverslips were then permeabilized for 7 minutes with PBS-0.2% Triton X-100, blocked with PBS-10% BSA for 20 minutes, and incubated with an anti-Rab5 monoclonal antibody (1:1000 in 0.1%BSA in PBS) for 1 hour at room temperature. The cells were rinsed twice with PBS and then incubated with an Alexa488-conjugated rabbit anti-mouse (Molecular Probes, Milan, Italy; 1:1000) for 1 hour at room temperature. After rinsing three times with PBS, the coverslips were air-dried and mounted with Mowiol 4–88 (Calbiochem, San Diego, CA). Confocalmicroscopy analysis was performed with a confocal laser scanning microscopy system equipped with an argon ion laser (LSM510; Zeiss, Jena, Germany) with excitation wavelengths at 505 to 530 nm and emission at 590 nm. All the images were taken using the same exposure time and brightness/contrast setting. Images of 512 x 512 were acquired.
Results
Relaxometric Characterization of Gd-DO3A-diph/LDL and Gd-AAZTAC17/LDL Adducts
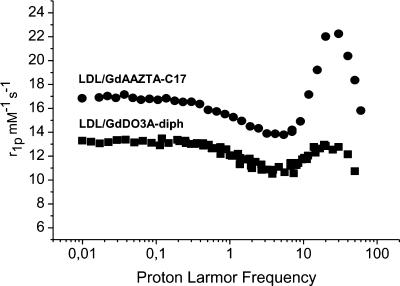
Gd-DO3A-diph is a new derivative of the well-known family of GdDO3A complexes. The ligand has been synthesized in a three-step reaction (Scheme 1). The obtained ligand acts as heptadentate chelator for Gd3+ ions thus providing a metal chelate that displays two water molecules in the inner coordination sphere. Gd-DO3A-diph has been characterized by measuring the proton relaxation rate of its aqueous solutions. At a very low concentration (< 0.1 mM), the observed relaxivity is 8.0 mM-1 s-1 whereas at higher concentration the linearity between the observed relaxation rate and the actual concentration of the paramagnetic agent is lost. This appears as a clear indication of the occurrence of chelate self-assembly in a defined micellar-like formation. The interaction of the two types of Gd complexes with LDL was studied using the proton relaxation enhancement method by measuring the relaxation rates, at 20 MHz and 25°C, of a 0.09 mM PBS solution of each complex in the presence of increasing concentrations of LDL in PBS. Table 1 reports the binding parameters obtained carrying out this procedure. Both complexes showed high affinities for the lipoproteins, whereas the relaxation enhancement of the bound forms was rather different. This was confirmed by comparing the 1/T1 NMRD profiles of the two adducts recorded at 25°C in PBS (Figure 3). At any field, the relaxation rate of the solution containing the Gd-AAZTAC17/LDL adduct is higher than that of the Gd-DO3A-diph/LDL, whereas the relaxivities of the two complexes in water are quite similar. The limited relaxation enhancement observed for the adduct with Gd-DO3A-diph can be ascribed to the displacement of one of the two coordinated water molecules by donor groups present on the surface of the LDL particles. This behavior has already been observed for other Gd-DO3A-type complexes [35]. This drawback is not present in the case of Gd-AAZTA-type complexes in which the structural arrangement of the coordination cage does not allow other donor moieties to enter the coordination sphere and replace the bound water molecules [32,36]. Interestingly, the number of lipophilic Gd complexes that can be bound on each LDL particle is quite different. In fact, the linear aliphatic chain of Gd-AAZTAC17 appears more favored in respect to the more sterically demanding substituent present in Gd-DO3A-diph. The titrations of the solutions containing the Gd chelates with LDL showed that each LDL particle can load up to 400 Gd-AAZTAC17, whereas only one fourth of Gd-DO3A-diph can be accommodated.
Table 1.
Proton relaxation enhancement titration of Gd-AAZTAC17 and Gd-DO3A-diph with LDL (25°C, 20 MHz).
| Adduct | Ka (M-1) | rb (mM-1 s-1) | n |
| Gd-AAZTAC17/LDL | 1 x 10⁵ | 22 | 400 |
| Gd-DO3A-diph/LDL | 5 x 10⁵ | 12 | 100 |
The binding strength or thermodynamic association constant (Ka), the number of binding sites (n), and the relaxivity of the macromolecular adduct (rb) were calculated from the resultant curves.
Figure 3.
1/T1 1H NMRD profile (0.01 – 80 MHz, pH 7, and 25°C) of Gd-AAZTAC17 (300:1) and Gd-DO3A-diph (80:1) LDL adducts. The profiles were acquired using 0.09 mM Gd complex solution and normalized to the relaxivity (mM-1 s-1).
As far as the size of the Gd-loaded LDL particles is concerned, the measured diameters of the two adducts are only slightly higher than the diameter of the unlabelled LDL (Table 2). This finding is taken as an indication that, under the conditions used for preparation of the complexes, either the lipophilic Gd complexes interact as single molecules rather than self-assembled systems maintaining the overall dimensions of the LDL particles on their loading with the imaging reporters.
Table 2.
Light scattering measurements of native LDL, Gd-AAZTAC17/LDL, and Gd-DO3A-diph/LDL adducts.
| Compound | Size (nm) |
| Gd-AAZTAC17 | 6.6 ± 0.6 |
| Gd-DO3A-diph | 5.7 ± 0.8 |
| Native LDL | 20.6 ± 1.4 |
| Gd-AAZTAC17/LDL (300:1) | 22.9 ± 0.7 |
| Gd-DO3A-diph/LDL | (80:1) 21.3 ± 0.9 |
Uptake of Gd-DO3A-diph/LDL and Gd-AAZTAC17/LDL Adducts into Tumor Cells
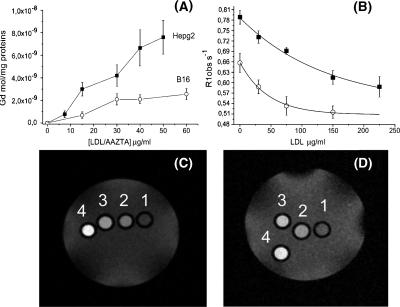
The affinity of the two LDL adducts for two different tumor cell lines overexpressing LDLR (HepG2 and B16) [37,38] has been assessed. To this purpose, about 1.6 million cells were incubated for 16 hours at 37°C with Gd-AAZTAC17/LDL and with Gd-DO3A-diph/LDL adducts (300:1 and 80:1 Gd/LDL ratios, respectively; see Materials and Methods section) in RPMI 1640 and minimum essential medium, respectively, after 24 hours of preincubation in a medium containing 10% of a LPDS to increase LDLRs' expression. After incubation, the cells were washed three times with ice-cold PBS and detached from the culture flasks enzymatically. The relaxation rates (R1obs), measured at 7 T, of pelleted HepG2 and B16 treated with Gd-AAZTAC17/LDL (30 µg/ml LDL in the incubation medium) were 1.16 and 0.85 s-1, respectively. Conversely, in the presence of the same amount of Gd-DO3A-diph/LDL adduct, the R1obs (recorded at 7 T) were significantly lower (0.52 and 0.44 s-1 with HepG2 and B16, respectively). This is a consequence of the differences in relaxivities (as reported in the previous paragraph) and in the overall labeling efficiency. On this basis, the more efficient Gd-AAZTAC17/LDL was selected for further studies. Hepatoma and melanoma cells were incubated for 16 hours with increasing amounts of Gd-AAZTAC17/LDL (from 10 to 60 µg/ml), and the Gd moles taken up by the different cell lines were determined by ICP-MS. Both cells showed a saturating behavior, whereas the Gd moles internalized by HepG2 were significantly higher than those taken up by B16, as a consequence of their lower LDL binding affinity (Figure 4A) [37–39]. The amount of internalized Gd is sufficient to generate hyperintense signals in the corresponding MR images of both HepG2 and B16 cells (Figure 4, B and C). To demonstrate that the uptake of Gd-AAZTAC17/LDL adduct involves LDLRs, competition assays with free LDL were carried out. Figure 4B shows that the uptake of the adduct by both HepG2 and B16 cells markedly decreases as the concentration of the free LDLs added to the culture medium increases. To measure cell proliferation in response to Gd-AAZTAC17/LDL, Gd-AAZTAC17, and LDL treatment, the WST-1 cell viability assay was performed. In both cell lines, after incubation with Gd-AAZTAC17/LDL complex, no relevant difference between native LDL and the Gd-AAZTAC17/LDL adduct was observed. On the contrary, the cytotoxic and cytostatic effect of Gd-AAZTAC17 incubated in the absence of LDL was significantly higher. In particular, using 30 µg/ml Gd-AAZTAC17/LDL or LDL alone, HepG2 cell viability was 85 ± 3% and 83 ± 4%, respectively, whereas it was 55 ± 7% when the incubation was carried out in the presence of the same concentration of Gd-AAZTAC17. The number of viable B16 cells after overnight incubation of 30 µg/ml Gd-AAZTAC17-LDL and LDL was 71 ± 4% and 69 ± 5%, respectively, whereas after incubation of the same Gd-AAZTAC17 concentration, it was 45 ± 4%.
Figure 4.
(A) Internalization of Gd chelates in HepG2 (■) and B16 (○) on incubation for 16 hours at 37°C of ca. 2 x 10⁶ cells, in the presence of increasing concentrations of LDL adducts (10–60 µg/ml). (B) Effect of the addition of unlabeled LDL to the observed proton relaxation rates (R1obs), measured at 7 T, of HepG2 (■) and B16 (○) cellular pellets (2 x 10⁶ cells) incubated for 16 hours at 37°C with Gd-AAZTAC17/LDL 15 µg/ml. (C) T1-weighted spin-echo MR image (measured at 7 T), of an agar phantom containing: unlabelled HepG2 (1), HepG2 incubated with increasing amounts of Gd-AAZTAC17/LDL: 15 µg/ml LDL (2), 30 µg/ml LDL (3), and 60 µg/ml LDL (4). (D) T1-weighted spin-echo MR image (measured at 7 T), of an agar phantom containing: unlabelled B16 (1), B16 incubated with increasing amounts of Gd-AAZTAC17/LDL: 15 µg/ml LDL (2), 30 µg/ml LDL (3), and 60 µg/ml LDL (4).
In Vitro Confocal Analysis
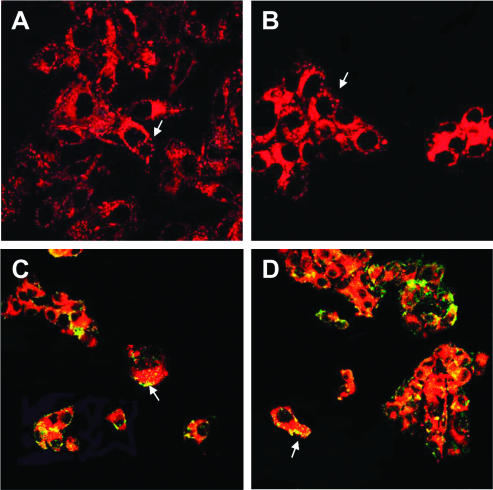
The cell internalization of labeled LDL was confirmed in vitro by confocal analysis. B16 and HepG2 cells were incubated for 30 minutes at 37°C with the fluorescent Gd-AAZTAC17/LDL/Rhd. As shown in Figure 5, A and B, a broad rhodamine fluorescence signal throughout the membrane and in the cytoplasm is clearly observed, indicating active cellular uptake. Moreover, large dots resembling vesicles are present in the cytoplasm and under the membrane (arrows), suggesting that the probe enters the cells through an endocytic route.
Figure 5.
Confocal analysis of B16 (A) and HepG2 (B) cells incubated with Gd-AAZTAC17/LDL/Rhd for 30 minutes at 37°C. Rhd accumulates in the cytoplasm or in vescicle (arrows). The incubation of B16 (C) and HepG2 (D) cells with Rab5 to label endosomes shows many vesicles containing Rhd (arrows). Original magnifications: A and B, x 63; B and D, x 40.
To confirm this hypothesis, B16 (Figure 5C) and HepG2 (Figure 5D) cells were incubated with Gd-AAZTAC17/LDL/Rhd for 30 minutes at 37°C and then treated with an anti-Rab5 monoclonal antibody that is specific for early endosomes. Fluorescein isothiocyanate-labeled endosomes containing Rhd are well detected, as shown by the yellow-orange areas (arrows). Some vesicles that do not contain Rhd are also observed.
In Vivo Imaging of B16 Tumor-Bearing Mice
As it is known that Gd-AAZTAC17 has a high affinity for HSA [32] and that the latter protein is present in serum at a high concentration (40 mg/ml), an in vitro competition study between HSA and Gd-AAZTAC17/LDL has been carried out. Because the relaxivity of the Gd-AAZTAC17 adduct with HSA is about three times higher than the relaxivity of the LDL adduct, the formation of Gd-AAZTAC17/HSA can be followed by measuring the proton relaxation rate (R1obs) of the solution. To this purpose, R1obs of solutions containing Gd-AAZTAC17/LDL (300:1, prepared as described above, 0.8 mM in Gd) were measured before and after the addition of 40 mg/ml HSA at 37°C to simulate the in vivo conditions. The R1obs remained unchanged during the monitored period of 3 hours after HSA addition. We can conclude that the stability of the Gd-AAZTAC17/LDL adduct is high enough to prevent its dissociation when injected in the blood stream.
In vivo MRI experiments were carried out on subcutaneous tumors models obtained by injecting B16 melanoma cells into the right flank of adult C57BL/6 mice. Unfortunately, the growth of inoculated HepG2 cells in nude mice did not provide sufficient reproducibility. One week after implantation, all mice developed palpable solid tumors of 3 to 4 mm in diameter. At this time, a first group (group 1) of animals (n = 7) received intravenously 0.06 mmol/kg of Gd-AAZTAC17 and a second group (group 2) of animals (n = 10) received the same dose of Gd-AAZTAC17/LDL adduct. Fat-suppressed T1-weighted multislice multiecho MR images were recorded before, 10 minutes after, and 8, 24, and 48 hours after the contrast administration.
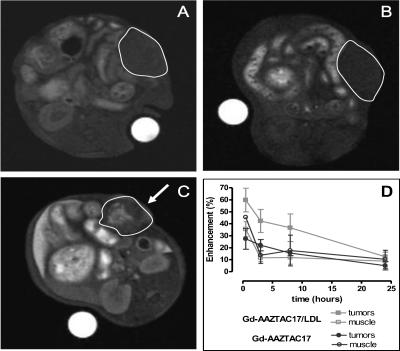
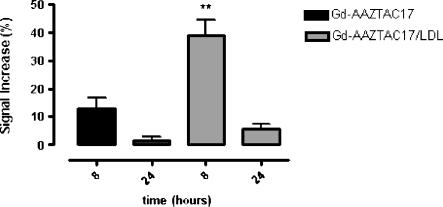
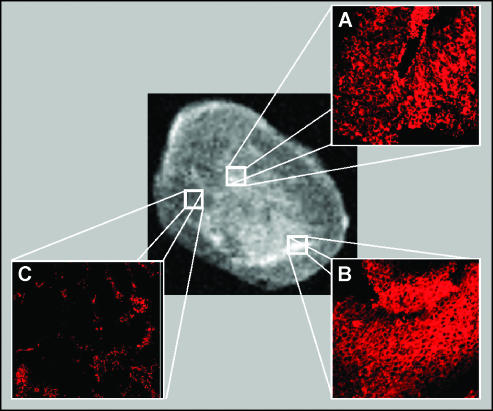
Figure 6 shows MR images of a mouse before (A) and 8 hours after Gd-AAZTAC17 (B) or Gd-AAZTAC17/LDL (C) injection. Hyperintense regions are detected in the tumor region (C). The analysis of SI enhancement measured in the ROI corresponding to the whole tumor showed that in all intervals analyzed the SI enhancement of Gd-AAZTAC17/LDL is significantly higher than that observed after the injection of Gd-AAZTAC17 alone (Figure 7). Because the SI is not homogenously distributed in the tumor mass, we performed a pixel by pixel analysis, in which pixels were classified as enhanced when SI was increased more than three times the SD of the tumor signal at baseline (i.e., enhancement > 60% of the variation seen at baseline). As shown in Figure 7, a significantly higher enhancement was observed in Gd-AAZTAC17/LDL-treated tumors 8 hours postinjection compared with Gd-AAZTAC17 alone (P = .001). The SI enhancements measured in the liver, kidneys, and muscle on administration of Gd-AAZTAC17/LDL and Gd-AAZTAC17 alone show that the elimination of both occurs largely through the liver. Table 3 shows the SI percent enhancement measured 4, 24, and 48 hours after the contrast agent administration in liver and tumor. The liver SI decreased 10-fold in 48 hours, thus indicating a rapid elimination through the biliary system of both free and LDL-bound Gd-AAZTAC17. The in vivo uptake of Gd-AAZTAC17/LDL was further confirmed by immunofluorescence following in vivo administration of LDL bearing both Gd-AAZTAC17 and a fluorescent phospholipid containing rhodamine (group 3 mice, n = 3). Group 3 mice were examined by MRI before and 8 hours after injection, and their tumors were then excised and analyzed by MRI. A marked percent SI enhancement of 90 ± 10 was detected in the central tumor region (Figure 8, central panel). Confocal microscopy analysis was performed on tumor serial sections (4 µm) mounted on glass microscope slides and indicated very intense Rhd-induced fluorescence in the hyperintense areas detected in the MR images (panels A and B). Conversely, the rhodamine response was weak (panel C) or completely absent in the other areas. Histological analysis showed that Rhd appearance occurs only in the tumors from mice injected with Gd-AAZTAC17/Rhd/LDL and not after simple injection of Gd-AAZTAC17 or Gd-AAZTAC17/LDL (data not shown).
Figure 6.
Fat-suppressed T1-weighted multislice multiecho MR images of C57BL/6 mice grafted subcutaneously with B16 melanoma cells. Images were obtained before (A) and 8 hours after the administration of Gd-AAZTAC17 (B) and Gd-AAZTAC17/LDL (C). Arrows show the enhanced tumor region (outlined in blank). (D) Course of SI enhancement measured in the ROI corresponding to the whole tumors and muscle from mice injected with Gd-AAZTAC17 (full and empty blue circles, respectively) and Gd-AAZTAC17/LDL (full and empty red squares, respectively). Graph shows the standard error of the means (SEM).
Figure 7.
Plot of MRI SI enhancement obtained considering tumor pixels where the signal is 3 SD more intense than the pre contrast tumor intensity. Significantly higher enhancement was observed 8 hours postinjection of Gd-AAZTAC17/LDL (blue) compared with Gd-AAZTAC17 alone. Graph shows the standard error of the means (SEM). **P = .001.
Table 3.
Percent enhancement measured after the injection of Gd-AAZTAC17 and Gd-AAZTAC17/LDL adduct.
| Tissue | 4 hours (%) | 24 hours (%) | 48 hours (%) | |||
| Gd-AAZTAC17 | Gd-AAZTAC17/LDL | Gd-AAZTAC17 | Gd-AAZTAC17/LDL | Gd-AAZTAC17 | Gd-AAZTAC17/LDL | |
| Liver | 207 ± 27 | 280 ± 23 | 78 ± 16 | 84 ± 15 | 37 ± 14 | 23 ± 7 |
| Tumor | 22 ± 5 | 42 ± 9 | 5 ± 3 | 13 ± 4 | 4 ± 1 | 10 ± 1 |
Figure 8.
Ex vivo MRI (central panel) and confocal analysis (A, B, and C) after administration of Gd-AAZTAC17/Rhd/LDL. The hyperintense areas detected in the MR images correspond to areas of greater Rhd fluorescence (A and B: magnification, x 10), whereas in the other regions the Rhd signal is weak or completely absent (C; magnification, x 10).
Discussion
The development of procedures that lead to the accumulation of imaging probes at the targeting site is an important task for molecular imaging applications. This objective is crucial for MRI as it is less sensitive with respect to other imaging modalities. To this purpose, among the different classes of Gd-based systems, it is fundamental to use complexes endowed with the highest sensitivity compatible with the resulting thermodynamic stability. GdDO3A and GdAAZTA have a relaxivity approximately 60% higher than the octadentate standard contrast agents (i.e., GdDOTA, GdHPDO3A, GdDTPA, and GdDTPA-BMA) because they contain two water molecules coordinated to the Gd3+ ion. Furthermore, both complexes are thermodynamically stable. For these reasons, these complexes have been selected for conjugation with hydrophobic groups to pursue the binding to LDL and use the resulting adducts as carriers to address tumor cells overexpressing LDLRs. The relaxivity enhancement observed after binding with LDL, due to the increase of the tumbling time of the macromolecular adduct, is more pronounced for the GdAAZTA- than for the GdDO3A-containing system. In fact, in the latter, the coordinated water molecules are partially replaced by donor groups from the protein or from phospholipids present on the LDL surface. This drawback that is often encountered for Gd(III) chelates containing two coordinated water molecules does not occur with Gd-AAZTA derivatives because the solution structure of Gd-AAZTA does not allow the replacement of the coordinated water molecules from other substrates [36]. MRI detection of the cellular uptake of LDL labeled with Gd- AAZTAC17 was shown in vitro on HepG2 and B16 cell lines, and competition studies demonstrated that this uptake is driven by LDLRs. The integrity of the adducts is maintained also in the presence of many competitor species to outline the overall stability of these systems. Interestingly, the intercalation of about 300 Gd complexes into the LDL particle does not change its affinity for its receptor although the negative charge of the complexes could partially neutralize the positively charged amino acid sequence involved in the binding to LDLR. Confocal analysis of B16 and HepG2 cells incubated with Gd-AAZTAC17/LDL/Rhd showed that the probe enters the cells and colocalizes in the endosome/lysosome compartment. MRI analysis performed in vivo on C57BL/6 mice grafted with melanoma B16 cells showed a good tumor SI enhancement (30–40%), 8 hours after the injection of Gd-AAZTAC17/LDL adduct, significantly higher than that measured after the injection of the Gd-AAZTAC17 alone. An important finding deals with the intratumor localization of the imaging probe. In fact, its enhanced accumulation could be the effect of the binding with the target receptors on nonendothelial cells or only the consequence of the increased permeability of tumor vessel (enhanced permeability and retention [EPR]). The intracellular localization evidenced by confocal analysis on excised tumors gives support to the view that the accumulation of the imaging probe in the tumor region is the result of an enhanced cell uptake. However, more in vivo competition studies with native LDL have to be performed to get a better insight on the determinants of the enhanced uptake of Gd-AAZTAC17/LDL adducts in the tumor region. Furthermore, nonspecific uptake could be investigated using tumors that do not express LDLR [21].
The capability of LDL to deliver different compounds inside the targeted cells may be exploited for developing efficient antitumor treatments. In fact, the pharmacological activity can be largely improved by an intracellular drug delivery. Furthermore, the loading of LDL with both Gd-AAZTAC17 and an antitumor drug makes possible for the direct MR imaging and quantification of drug delivery. The drawback of the association with normal tissues expressing LDLR can be overcome by rerouting labeled LDL particles to other selected receptors as shown in the works of Zheng et al. [20] and Chen et al. [28]. This was carried out conjugating folate-containing groups to the exposed lysines on ApoB100, responsible of the selective binding to LDLR.
In summary, as anticipated in the study of Corbin et al. [29], LDLs act as efficient carriers for the delivery of the lipophilic Gd complexes to tumor cells. Gd-AAZTAC17 displays a much higher sensitivity than Gd-DO3A-diph and any previously reported system and appears an excellent candidate for further structural modifications that may still improve the use of the high-capacity LDL receptors as in vivo markers of tumor cells.
Scheme 1.
Scheme of Gd-DO3A-diph synthesis.
Footnotes
This work was supported by Ministero Istruzione Università Ricerca (Progetto Ricerca Interesse Nazionale and Fondo Inegrativo Ricerca di Base) and it has been carried out under the frame of the European Cooperation in the field of Scientific and Technical Research D38 Action, Meditrans Integrated Project, European Molecular Imaging Laboratories, and Diagnostic Molecular Imaging, European Union Network of Excellence. Support from Bracco Imaging SpA is gratefully acknowledged.
References
- 1.Weissleder R, Mahmood U. Molecular imaging. Radiology. 2001;219:316–333. doi: 10.1148/radiology.219.2.r01ma19316. [DOI] [PubMed] [Google Scholar]
- 2.Artemov D, Bhujwalla ZM, Bulte JW. Magnetic resonance imaging of cell surface receptors using targeted contrast agents. Curr Pharm Biotechnol. 2004;5:485–494. doi: 10.2174/1389201043376553. [DOI] [PubMed] [Google Scholar]
- 3.Aime S, Cabella C, Colombatto S, Geninatti Crich S, Gianolio E, Maggioni F. Insights into the use of paramagnetic Gd(III) complexes in MR-molecular imaging investigations. J Magn Reson Imaging. 2002;16:394–406. doi: 10.1002/jmri.10180. [DOI] [PubMed] [Google Scholar]
- 4.Merbach AE, Toth E. The Chemistry of Contrast Agents in Medical Magnetic Resonance Imaging. Chichester, UK: JohnWiley & Sons; 2001. [Google Scholar]
- 5.Aime S, Botta M, Terreno E. Gd(III)-based contrast agents for MRI. Adv Inorg Chem. 2005;57:173–237. [Google Scholar]
- 6.Caravan P. Strategies for increasing the sensitivity of gadolinium based MRI contrast agents. Chem Soc Rev. 2006;35:512–523. doi: 10.1039/b510982p. [DOI] [PubMed] [Google Scholar]
- 7.Mulder WJ, Strijkers GJ, van Tilborg GA, Griffioen AW, Nicolay K. Lipid-based nanoparticles for contrast-enhanced MRI and molecular imaging. NMR Biomed. 2006;19:142–164. doi: 10.1002/nbm.1011. [DOI] [PubMed] [Google Scholar]
- 8.Caruthers SD, Wickline SA, Lanza GM. Nanotechnological applications in medicine. Curr Opin Biotechnol. 2007;18:26–30. doi: 10.1016/j.copbio.2007.01.006. [DOI] [PubMed] [Google Scholar]
- 9.Lipinski MJ, Amirbekian V, Frias JC, Aguinaldo JG, Mani V, Briley-Saebo KC, Fuster V, Fallon JT, Fisher EA, Fayad ZA. MRI to detect atherosclerosis with gadolinium-containing immunomicelles targeting the macrophage scavenger receptor. Magn Reson Med. 2006;56:601–610. doi: 10.1002/mrm.20995. [DOI] [PubMed] [Google Scholar]
- 10.Shiftan L, Israely T, Cohen M, Frydman V, Dafni H, Stern R, Neeman M. Magnetic resonance imaging visualization of hyaluronidase in ovarian carcinoma. Cancer Res. 2005;65:10316–10323. doi: 10.1158/0008-5472.CAN-04-3947. [DOI] [PubMed] [Google Scholar]
- 11.Parac-Vogt TN, Kimpe K, Laurent S, Pierart C, Elst LV, Muller RN, Binnemans K. Paramagnetic liposomes containing amphiphilic bisamide derivatives of Gd-DTPA with aromatic side chain groups as possible contrast agents for magnetic resonance imaging. Eur Biophys J. 2006;35:136–144. doi: 10.1007/s00249-005-0024-8. [DOI] [PubMed] [Google Scholar]
- 12.Shepard J, Fruchart JC, editors. Clinical Biochemistry: Principles, Methods, Application. Vol. 3. Berlin: Walter de Gruyter; 1989. Human Plasma Lipoproteins. [Google Scholar]
- 13.Chung NS, Wasan KM. Potential role of the low-density lipoprotein receptor family as mediators of cellular drug uptake. Adv Drug Deliv Rev. 2004;56:1315–1334. doi: 10.1016/j.addr.2003.12.003. [DOI] [PubMed] [Google Scholar]
- 14.Brown MS, Goldstein JL. Receptor-mediated endocytosis: insights from the lipoprotein receptor system. Proc Natl Acad Sci USA. 1979;76:3330–3337. doi: 10.1073/pnas.76.7.3330. [DOI] [PMC free article] [PubMed] [Google Scholar]
- 15.Choudhury RP, Fuster V, Fayad ZA. Molecular, cellular and functional imaging of atherothrombosis. Nat Rev Drug Discov. 2004;3:913–925. doi: 10.1038/nrd1548. [DOI] [PubMed] [Google Scholar]
- 16.Firestone RA. Low density lipoprotein as a vehicle for targeting antitumor compounds to cancer cells. Bioconjug Chem. 1994;5:105–113. doi: 10.1021/bc00026a002. [DOI] [PubMed] [Google Scholar]
- 17.Chu AC, Tsang SY, Lo EH, Fung KP. Low density lipoprotein as a targeted carrier for doxorubicin in nude mice bearing human hepatoma HepG2 cells. Life Sci. 2001;70:591–601. doi: 10.1016/s0024-3205(01)01441-2. [DOI] [PubMed] [Google Scholar]
- 18.Lo EH, Ooi VE, Fung KP. Circumvention of multidrug resistance and reduction of cardiotoxicity of doxorubicin in vivo by coupling it with low density lipoprotein. Life Sci. 2002;72:677–687. doi: 10.1016/s0024-3205(02)02180-x. [DOI] [PubMed] [Google Scholar]
- 19.Reddi E. Role of delivery vehicles for photosensitizers in the photodynamic therapy of tumours. J Photochem Photobiol B. 1997;37:189–195. doi: 10.1016/s1011-1344(96)07404-0. [DOI] [PubMed] [Google Scholar]
- 20.Zheng G, Li H, Zhang M, Lund-Katz S, Chance B, Glickson JD. Low-density lipoprotein reconstituted by pyropheophorbide cholesteryl oleate as target-specific photosensitizer. Bioconjug Chem. 2002;13:392–396. doi: 10.1021/bc025516h. [DOI] [PubMed] [Google Scholar]
- 21.Zheng G, Chen J, Li H, Glickson JD. Rerouting lipoprotein nanoparticles to selected alternate receptors for the targeted delivery of cancer diagnostic and therapeutic agents. Proc Natl Acad Sci USA. 2005;102:17757–17762. doi: 10.1073/pnas.0508677102. [DOI] [PMC free article] [PubMed] [Google Scholar]
- 22.Wu SP, Lee I, Ghoroghchian PP, Frail PR, Zheng G, Glickson JD, Therien MJ. Near-infrared optical imaging of B16 melanoma cells via low-density lipoprotein-mediated uptake and delivery of high emission dipole strength tris[(porphinato)zinc(II)] fluorophores. Bioconjug Chem. 2005;16:542–550. doi: 10.1021/bc0497416. [DOI] [PubMed] [Google Scholar]
- 23.Meding J, Urich M, Licha K, Reinhardt M, Misselwitz B, Fayad ZA, Weinmann HJ. Magnetic resonance imaging of atherosclerosis by targeting extracellular matrix deposition with Gadofluorine M. Contrast Media Mol Imaging. 2007;2:120–129. doi: 10.1002/cmmi.137. [DOI] [PubMed] [Google Scholar]
- 24.Berndt M, Pietzsch J, Wuest F. Labeling of low-density lipoproteins using the 18F-labeled thiol-reactive reagent N-[6-(4-18F]fluorobenzylidene) aminooxyhexyl]maleimide. Nucl Med Biol. 2007;34:5–15. doi: 10.1016/j.nucmedbio.2006.09.009. [DOI] [PubMed] [Google Scholar]
- 25.Li H, Gray BD, Corbin I, Lebherz C, Choi H, Lund-Katz S, Wilson JM, Zhou R, Zhou R. MR and fluorescent imaging of low-density lipoprotein receptors. Acad Radiol. 2004;11:1251–1259. doi: 10.1016/j.acra.2004.08.007. [DOI] [PubMed] [Google Scholar]
- 26.Gurudutta GU, Babbar AK, Shailaja S, Soumya P, Sharma RK. Evaluation of potential tracer ability of (99m)Tc-labeled acetylated LDL for scintigraphy of LDL-scavenger receptor sites of macrophageal origin. Nucl Med Biol. 2001;28:235–241. doi: 10.1016/s0969-8051(00)00185-2. [DOI] [PubMed] [Google Scholar]
- 27.Mitsumori LM, Ricks JL, Rosenfeld ME, Schmiedl UP, Yuan C. Development of a lipoprotein based molecular imaging MR contrast agent for the noninvasive detection of early atherosclerotic disease. Int J Cardiovasc Imaging. 2004;20:561–567. doi: 10.1007/s10554-004-7020-4. [DOI] [PubMed] [Google Scholar]
- 28.Chen J, Corbin IR, Li H, Cao W, Glickson JD, Zheng G. Ligand conjugated low-density lipoprotein nanoparticles for enhanced optical cancer imaging in vivo. J Am Chem Soc. 2007;129:5798–5799. doi: 10.1021/ja069336k. [DOI] [PubMed] [Google Scholar]
- 29.Corbin IR, Li H, Chen J, Lund-Katz S, Zhou R, Glickson JD, Zheng G. Low-density lipoprotein nanoparticles as magnetic resonance imaging contrast agents. Neoplasia. 2006;8:488–498. doi: 10.1593/neo.05835. [DOI] [PMC free article] [PubMed] [Google Scholar]
- 30.Aime S, Botta M, Fasano M. 1H and 17O-NMR relaxometric investigations of paramagnetic contrast agents for MRI. Clues for high relaxivities. Coord Chem Rev. 1999;185:321–333. [Google Scholar]
- 31.Cabella C, Geninatti Crich S, Corpillo D, Barge A, Ghirelli C, Bruno E, Lorusso V, Uggeri F, Aime S. Cellular labeling with Gd(III) chelates: only high thermodynamic stabilities prevent the cells to act as “sponges” of Gd3+ ions. Contrast Media Mol Imaging. 2006;1:23–29. doi: 10.1002/cmmi.88. [DOI] [PubMed] [Google Scholar]
- 32.Gianolio E, Giovenzana GB, Longo D, Longo I, Menegotto I, Aime S. Relaxometric and modelling studies of the binding of a lipophilic Gd-AAZTA complex to fatted and defatted human serum albumin. Chemistry. 2007;13:5785–5797. doi: 10.1002/chem.200601277. [DOI] [PubMed] [Google Scholar]
- 33.Barge A, Cravotto G, Gianolio E, Fedeli F. How to determine free Gd and free ligand in solution of Gd chelates. A technical note. Contrast Media Mol Imaging. 2006;1:184–188. doi: 10.1002/cmmi.110. [DOI] [PubMed] [Google Scholar]
- 34.Srivastava RA, Ito H, Hess M, Srivastava N, Schonfeld G. Regulation of low density lipoprotein receptor gene expression in HepG2 and Caco2 cells by palmitate, oleate, and 25-hydroxycholesterol. J Lipid Res. 1995;36:1434–1446. [PubMed] [Google Scholar]
- 35.Aime S, Gianolio E, Terreno E, Giovenzana GB, Pagliarin R, Sisti M, Palmisano G, Botta M, Lowe MP, Parker D. Ternary Gd(III)L-HSA adducts: evidence for the replacement of inner-sphere water molecules by coordinating groups of the protein. Implications for the design of contrast agents for MRI. J Biol Inorg Chem. 2000;5:488–497. doi: 10.1007/pl00021449. [DOI] [PubMed] [Google Scholar]
- 36.Aime S, Calabi L, Cavallotti C, Gianolio E, Giovenzana GB, Losi P, Maiocchi A, Palmisano G, Sisti M. [Gd-AAZTA]-: a new structural entry for an improved generation of MRI contrast agents. Inorg Chem. 2004;43:7588–7590. doi: 10.1021/ic0489692. [DOI] [PubMed] [Google Scholar]
- 37.Versluis AJ, van Geel PJ, Oppelaar H, van Berkel TJ, Bijsterbosch MK. Receptor-mediated uptake of low-density lipoprotein by B16 melanoma cells in vitro and in vivo in mice. Br J Cancer. 1996;74:525–532. doi: 10.1038/bjc.1996.396. [DOI] [PMC free article] [PubMed] [Google Scholar]
- 38.Mulder M, Lombardi P, Jansen H, van Berkel TJ, Frants RR, Havekes LM. Heparan sulphate proteoglycans are involved in the lipoprotein lipase-mediated enhancement of the cellular binding of very low density and low density lipoproteins. Biochem Biophys Res Commun. 1992;185:582–587. doi: 10.1016/0006-291x(92)91664-c. [DOI] [PubMed] [Google Scholar]
- 39.Li H, Zhang Z, Blessington D, Nelson DS, Zhou R, Lund-Katz S, Chance B, Glickson JD, Zheng G. Carbocyanine labeled LDL for optical imaging of tumors. Acad Radiol. 2004;11:669–677. doi: 10.1016/j.acra.2004.01.016. [DOI] [PubMed] [Google Scholar]


