Abstract
Mineralocorticoid receptor (MR)-deficient mice were generated by gene targeting. These animals had a normal prenatal development. During the first week of life, MR-deficient (−/−) mice developed symptoms of pseudohypoaldosteronism. They finally lost weight and eventually died at around day 10 after birth from dehydration by renal sodium and water loss. At day 8, −/− mice showed hyperkalemia, hyponatremia, and a strong increase in renin, angiotensin II, and aldosterone plasma concentrations. Methods were established to measure renal clearance and colonic transepithelial Na+ reabsorption in 8-day-old mice in vivo. The fractional renal Na+ excretion was elevated >8-fold. The glomerular filtration rate in −/− mice was not different from controls. The effect of amiloride on renal Na+ excretion and colonic transepithelial voltage reflects the function of amiloide-sensitive epithelial Na+ channels (ENaC). In −/− mice, it was reduced to 24% in the kidney and to 16% in the colon. There was, however, still significant residual ENaC-mediated Na+ reabsorption in both epithelia. RNase protection analysis of the subunits of ENaC and (Na++ K+)-ATPase did not reveal a decrease in −/− mice. The present data indicate that MR-deficient neonates die because they are not able to compensate renal Na+ loss. Regulation of Na+ reabsorption via MR is not achieved by transcriptional control of ENaC and (Na+ + K+)-ATPase in RNA abundance but by transcriptional control of other as yet unidentified genes. MR knockout mice will be a suitable tool for the search of these genes.
In rodents, the glucocorticoid corticosterone activates both the mineralocorticoid receptor (MR) and the glucocorticoid receptor (GR). The cloning of the GR (1) as well as the MR (2) allowed an unequivocal comparison of their expression patterns as well as of their affinities to gluco- and mineralocorticoids. The MR binds corticosterone with a 10-fold higher affinity than the GR and, in addition, the mineralocorticoid aldosterone with equal affinity (3). Although the GR is expressed in most if not all cells, MR expression is quite restricted. The MR is expressed in epithelial cells that line the distal part of the nephron, the distal colon, and the ducts of several exocrine glands (4). It is present in the limbic system of the brain (5) and in the heart (6). In epithelial cells, corticosteroid hormone action is controlled at a prereceptor level by the activity of the enzyme 11β-hydroxysteroid-dehydrogenase type 2 (11βOHSD2), which catalyses the interconversion of the hormone corticosterone to the inactive 11-dehydrocorticosterone (7–9). 11βOHSD2 thereby protects the MR from corticosterone, enabling aldosterone to interact with the MR. Na+ reabsorption in the respiratory tract is corticosteroid-regulated but not mineralocorticoid-specific (10). In other tissues in which MR is expressed but in which the prereceptor protection mechanism is absent, as in the limbic system of the brain, the MR is occupied mainly by corticosterone because of the several hundredfold higher circulating concentration of corticosterone vs. aldosterone. In the limbic system, both MR and GR control neural activity (11). MR and GR can, because of their different binding affinities for corticosterone, cover a wide range of corticosterone concentrations that physiologically vary from 0.5 to 100 nM. Therefore, it has been concluded that the two receptors might form a binary response system for corticosterone that is able to regulate differentially two overlapping networks of genes (12).
The most prominent action of aldosterone is control of Na+ and K+ homeostasis. Na+ and K+ homeostasis is maintained mainly by regulation of electrogenic Na+ reabsorption in the kidney. Na+ is reabsorbed from tubular fluid via amiloride-sensitive epithelial Na+ channels (ENaC) (13). ENaC is located in the luminal membrane of distal renal tubule cells (14). It constitutes the rate-limiting step for transepithelial Na+ transport whereas the (Na++ K+)-ATPase located in the basolateral membrane provides the driving force together with the cellular K+ conductance. The activity of ENaC and thereby the electrogenic Na+ transport is controlled by aldosterone (15).
There is a large body of evidence for the stimulatory effects of aldosterone on Na+ transport (16). The molecular mechanism of aldosterone action and the precise role of MR in ENaC regulation, however, are still subject to investigations (17–19).
Na+ balance, extracellular fluid volume, plasma aldosterone levels, and blood pressure are coordinated tightly. Aldosterone secretion is stimulated by hypovolemia, hyponatremia, and low blood pressure. These stimuli, however, do not directly affect aldosterone secretion by the adrenals but act on the juxtaglomerular cells of the kidney. Low blood pressure and low Na+ concentrations at the macula densa segment of the distal tubule lead to increased secretion of renin, which cleaves angiotensinogen secreted by the liver to angiotensin I. Angiotensin I then is cleaved by the angiotensin-converting enzyme to angiotensin II, the effector molecule of the renin–angiotensin–aldosterone system (RAAS). Angiotensin II elevates aldosterone secretion and causes vasoconstriction. Both actions increase blood pressure and inhibit renin release by the juxtaglomerular cells (20).
The first weeks of life are characterized by a dramatic requirement of Na+ and water. In the period between day 3 and day 12 after birth, mice gain between 0.5 and 1 g of body weight per day. To maintain their Na+ balance, these mice have to strictly conserve Na+ via kidney and colon because the NaCl supply by milk is limited (21).
To gain new insights into MR function and to separate MR-independent aldosterone effects in vivo, a genetic approach involving gene targeting in mouse embryonic stem (ES) cells was used. Mice with a null mutation in the MR gene die ≈10 days after birth and exhibit impaired amiloride-sensitive Na+ reabsorption, leading to changes similar to pseudohypoaldosteronism type 1. The impaired Na+ reabsorption results in severe Na+ and water loss, causing mortality in neonates because they are not able to compensate these losses by increased Na+ and water uptake.
MATERIALS AND METHODS
Generation of MR −/− Mice.
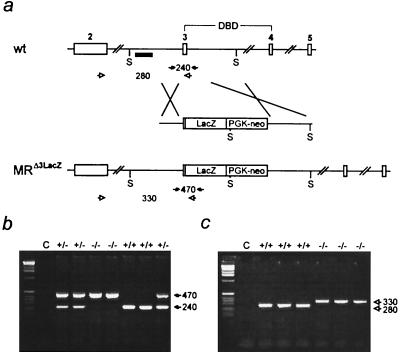
Mouse MR DNA was cloned from a strain 129 genomic library (30). The targeting construct contained 2.4- and 7.7-kilobase homology fragments inserted into the pHM2 vector (31). A portion (20 μg) of the targeting construct was linearized with NotI and was electroporated into 107 E14-J ES cells. Homologous recombinant clones (4 of 585) were identified by Southern blot analysis of SpeI-digested DNA with the 5′ external probe indicated in Fig. 1a and were confirmed with several internal probes (not shown). Targeted 129 ES cells were injected into C57BL/6 blastocysts to generate chimeric mice. Two of the chimeric animals mated and transmitted the mutant MR-allele to their agouti F1 offspring. F1 (+/−) mice harboring the MR mutation were bred to obtain wild-type (+/+) and homozygous mutant (−/−) mice. Mice were genotyped by PCR by using the following primers: 5′, TGCACTGACCAGGGCAGGAGAT; 3′, GAATTCGTAGAGGGAACAGCCA; and LacZ, GTAACCGTGCATCTGCCAGTTT (1.5 mM MgCl2, 32 cycles, 94°C for 0.5 min/63°C for 1 min/72°C for 1 min; wild-type band, 240 bp; mutant band, 470 bp).
Figure 1.
Inactivation of the mouse MR gene by gene targeting. (a) Targeting strategy. (Top) Part of the MR gene with exons 2, 3, 4, and 5. Exons 3 and 4 encode the two zinc fingers of the DNA binding domain (DBD). S indicates SpeI restriction sites, and the small black box indicates the 5′ probe used for Southern blot analysis. (Middle) Targeting construct. LacZ and PGK neo indicate the β-galactosidase gene and the neomycin-resistance gene driven by the phosphoglycerate kinase promoter. (Bottom) Targeted MR locus. (b) Genotyping by PCR of genomic tail DNA by using specific primers (filled arrows in a). Numbers between the arrows indicate the size of the amplified fragments in bp. C, water control. (c) Reverse transcription–PCR analysis of cDNA derived from total kidney RNA of wild-type (+/+) and MR-deficient (−/−) mice by using exon- and LacZ-specific primers (open arrows in a) demonstrates the absence of the 280-bp wild-type-specific band in MR −/− mice. Instead, only the 330-bp band specific for the MRΔ3-LacZ fusion mRNA is present.
RNA Analysis.
Total RNA was isolated from kidneys of 8-day-old mice after homogenization in guanidinium thiocyanate (32). For reverse transcription–PCR analysis, RNA was treated with RNase-free DNaseI and then was used for cDNA synthesis with M-MuLV reverse transcriptase (Boehringer Mannheim) according to the manufacture’s instruction. The following primers were used: 5′ MR exon 2, GTGGACAGTCCTTTCACTACCG; 3′ MR exon 3, TGACACCCAGAAGCCTCATCTC; and LacZ, CACGACGTTGTAAAACGACGGG (1.5 mM MgCl2, 35 cycles, 94°C for 0.5 min/63°C for 1 min/72°C for 1 min; wild-type band, 280 bp; mutant band, 330 bp).
Ribonuclease protection assay was performed as described (33) by using [32P]-αUTP-labeled antisense RNA probes. The probe-specific bands were quantified by PhosphorImager (Molecular Dynamics). The templates of the probes were cloned by reverse transcription—PCR, and their identity was confirmed by sequence analysis.
Histological and Immunocytochemical Analysis of the Kidney.
Sections for transmission electron micrography were prepared as described (34). Immunocytochemistry for renin was performed with a polyclonal rabbit antibody as described (35).
In Vivo Treatment of Animals.
Betamethasone was applied in 50 μl of water at a dose of 1 mg/kg body weight (BW) by s.c. injection. Amiloride was injected s.c. at a dose of 5 mg/kg BW in a volume of 100 nl/g BW. Anesthesia was performed by s.c. injection of ketamine (100 mg/kg BW) and thiopental (10 mg/kg BW) in a volume of 10 μl/g BW.
Plasma and Urine Measurements.
Blood for renin, angiotensin II, and aldosterone determination was collected in EDTA-coated tubes after decapitation. Blood for Na+ and K+ determination was collected by heart puncture with heparin-rinsed syringes. Urine was collected by puncture of the urinary bladder.
Renin and aldosterone concentrations were determined from EDTA-plasma as described (36, 37). For determination of angiotensin II, blood was collected into an inhibitor mixture consisting of EDTA, phenylmethylsulfonyl fluoride, o-phenantroline, captopril, pepstatin, and β-mercaptoethanol at final concentrations of 6.25 mmol/liter, 0.1 mmol/liter, 0.4 mg/ml, 1 μg/ml and 0.1%, respectively. The plasma then was processed as described (38).
Plasma and urine concentration of Na+ and K+ were determined by standard flame photometry (Eppendorf). Creatinine was measured by a commercial kit (CREA, Boehringer Mannheim), which was adapted to small sample volumes. The fractional excretion, i.e., the excreted part of filtered Na+ and K+ in the kidney, was calculated from urine and plasma values of Na+, K+, and creatinine.
Electrophysiological Analysis.
Colonic transepithelial potential difference was measured in vivo by a double-barreled flexible polyethylene tube that could be perfused by Ringer-type solution ± amiloride (3 μmol/liter). This tube was inserted into the rectum at a length of 7 mm. The electrical potential of this tube was measured by a high input resistance differential amplifier and was referenced to an Ag/AgCl electrode that was inserted under the skin. The method was adapted from ref. 39.
RESULTS
Inactivation of the MR Gene.
To generate mice lacking MR, we inactivated the MR gene by homologous recombination in mouse ES cells, as shown in Fig. 1a. Most of exon 3 of the MR gene that encodes the first zinc finger of the DNA binding domain was replaced by the β-galactosidase/neomycin cassette inserted in frame. The first zinc finger of the DNA binding domain of steroid hormone receptors was shown to be essential for DNA binding and binding specificity (22). Deletion of this zinc finger thereby creates a protein that is unable to bind to DNA. Homologous recombination was confirmed by Southern blot analysis (not shown). ES cells harboring the desired mutation were used to generate chimeric mice. Chimeric animals were crossed with C57BL/6 mice, and the resulting heterozygotes were interbred to obtain wild-type (+/+) and MR homozygous mutant (−/−) mice. Genotyping was done by PCR of genomic DNA (Fig. 1b), and disruption of the MR gene was verified by reverse transcription–PCR (Fig. 1c).
MR −/− Mice Die Around Day 10 After Birth and Exhibit Typical Features of Pseudohypoaldosteronism.
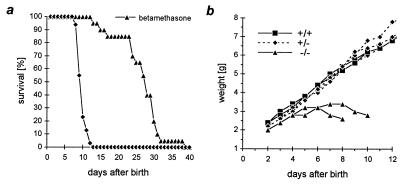
All MR homozygous mutant (−/−) mice died between days 8 and 13 after birth, on average at day 10 (Fig. 2a). After birth and until day 8, a Mendelian distribution of the three genotypes was found. MR −/− mice did not thrive, and weight loss preceded death (Fig. 2b). Heterozygous animals grew and bred normally. The decreased weight gain of the MR −/− mice was not caused by growth inhibition because determination of the length of femur, humerus, and tibia by using x-rays revealed no significant differences (data not shown). The hematocrit was elevated from 32% in wild-type to 44% in MR −/− mice (Table 1), indicating that the animals were severely dehydrated. MR −/− mice did not show any obvious morphological lung, heart, or central nervous system phenotype.
Figure 2.
Survival and weight curve. (a) Survival of MR −/− and betamethasone-treated MR −/− mice. Application of betamethasone from day 5 after birth prolonged survival on average by 17 days. (b) Weight curve of MR −/− mice and their heterozygous (+/−) and wild-type (+/+) littermates.
Table 1.
Weight, hematocrit, and analysis of the RAAS
| +/+ | +/− | −/− | |
|---|---|---|---|
| Measurement | |||
| 1. Weight, g | 5.2 ± 0.2 | 5.1 ± 0.1 | 3.3 ± 0.1** |
| (n = 22) | (n = 40) | (n = 22) | |
| 2. Hematocrit, % | 32.3 ± 0.7 | 33.3 ± 0.4 | 43.5 ± 0.7** |
| (n = 22) | (n = 40) | (n = 22) | |
| 3(a). Plasma renin concentration, ng ANGI/ml⋅h, day 8 | 577 ± 95 | 2022 ± 290** | 253201 ± 24917** |
| (n = 9) | (n = 22) | (n = 18) | |
| 3(b). Plasma renin concentration, ng ANGI/ml⋅h, day 4 | 697 ± 209 | 667 ± 79 | 5636 ± 1567* |
| (n = 6) | (n = 16) | (n = 9) | |
| 3(c). Plasma renin concentration, ng ANGI/ml⋅h, day 0 | 295 ± 39 | 335 ± 48 | 328 ± 43 |
| (n = 6) | (n = 21) | (n = 6) | |
| 4. Plasma angiotensin II, pg/ml | 69 ± 14 | 222 ± 27** | 3546 ± 401** |
| (n = 3) | (n = 6) | (n = 9) | |
| 5. Plasma aldosterone, pg/ml | 377 ± 69 | 1132 ± 140** | 24510 ± 1572** |
| (n = 11) | (n = 10) | (n = 8) |
All measurements were performed on 8-day-old mice, except 3(b) and 3(c). Results shown are mean ± SEM. Values of MR-deficient (−/−) or heterozygous (+/−) animals that are statistically different from wildtype (+/+) are marked with asterisks. ANGI, angiotensin I.
P < 0.05 (Student’s t test, unpaired).
P < 0.005 (Student’s t test, unpaired).
As hypovolemia and hyponatremia activate the RAAS to restore blood volume, the plasma levels of renin, angiotensin II, and aldosterone in MR wild-type (+/+), heterozygous (+/−), and knockout (−/−) mice were determined. The RAAS was strongly activated in MR −/− mice, with renin being increased 440-fold, angiotensin II being increased 50-fold, and aldosterone being increased 65-fold at day 8. At day 0, plasma renin concentration was unchanged whereas it was increased 8-fold at day 4 (Table 1), showing that RAAS stimulation increased gradually after birth. It should be noted that in, wild-type neonates, the ability of Na+ reabsorption was developed fully (fractional excretion of Na+, 0.33%; Table 2). The plasma renin levels, however, significantly rose after birth (P < 0.05) (Table 1) because suckling animals live on a rather limited Na+ supply.
Table 2.
Analysis of Na+ and K+ and of the ENaC-mediated Na+ reabsorption
| +/+ | +/− | −/− | |
|---|---|---|---|
| Measurement | |||
| 1. Plasma Na+, mmol/l | 141.1 ± 3.2 | 143.6 ± 2.0 | 132.8 ± 2.2* |
| (n = 15) | (n = 17) | (n = 13) | |
| 2. Plasma K+, mmol/l | 6.3 ± 0.3 | 6.3 ± 0.3 | 8.1 ± 0.5* |
| (n = 14) | (n = 15) | (n = 11) | |
| 3. Urine Na+, mmol/l | 9.1 ± 1.2 | 19.6 ± 2.5** | 35.4 ± 3.3** |
| (n = 19) | (n = 19) | (n = 14) | |
| 4. Urine K+, mmol/l | 83.7 ± 3.4 | 81.1 ± 5.3 | 71.9 ± 4.8 |
| (n = 18) | (n = 19) | (n = 14) | |
| 5. Fractional excretion of Na+, % | 0.33 ± 0.07 | 0.93 ± 0.15** | 2.74 ± 0.61** |
| (n = 13) | (n = 12) | (n = 9) | |
| 6. Fractional excretion of K+, % | 89.8 ± 15.8 | 80.9 ± 8.9 | 98.2 ± 15.4 |
| (n = 13) | (n = 12) | (n = 9) | |
| 7. Glomerular filtration rate, μl/min⋅g | 1.27 ± 0.16 | 1.12 ± 0.13 | 1.01 ± 0.29 |
| (n = 15) | (n = 24) | (n = 9) | |
| 8. Fractional excretion of Na+ after amiloride injection, % | 7.95 ± 1.27 | 8.47 ± 0.96 | 4.54 ± 0.54* |
| (n = 10) | (n = 13) | (n = 8) | |
| 9. Colonic amiloride inhibitable transepithelial voltage, Δ mV | 11.3 ± 0.9 | 10.8 ± 1.5 | 1.8 ± 0.4** |
| (n = 14) | (n = 8) | (n = 13) |
All measurements were performed on 8-day-old mice. Results shown are mean ± SEM.
Values of MR-deficient (−/−) or heterozygous (+/−) animals that are statistically different from wild-type animals (+/+) are marked with asterisks.
P < 0.05 (Student’s t test, unpaired).
P < 0.005 (Student’s t test, unpaired).
Analysis of the Na+ and K+ concentrations in plasma and urine in MR −/− mice as well as determination of their fractional excretion revealed all of the features of impaired distal tubular Na+ reabsorption. MR −/− mice showed hyponatremia and hyperkalemia and had an 8-fold increased fractional excretion of Na+ (Table 2). Of interest, heterozygous mice showed a 3-fold increase in fractional excretion of Na+ and a moderately activated RAAS (Tables 1 and 2).
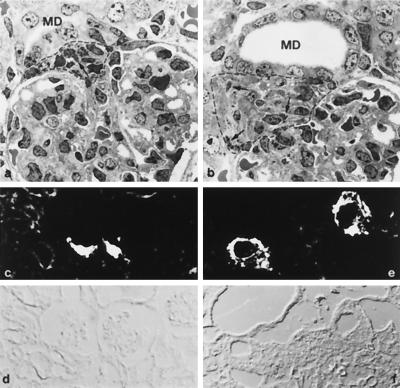
Histological examination of the kidney at day 8 revealed conspicuous morphological changes at the glomerular vascular pole in MR −/− mice (Fig. 3). The macula densa segment of the distal tubule was enlarged, the extraglomerular mesangium showed prominent hyperplasia (Fig. 3b), and renin producing granular cells were seen to extend upstream along the afferent arteriole. Moreover, renin granules were seen in almost all extraglomerular mesangium cells (Fig. 3b). First signs of these changes were observed at day 4. Renin activity in the vascular pole region (Fig. 3e) and along the entire afferent arteriole was increased dramatically in parallel with the rise of plasma renin.
Figure 3.
Histological and immunocytochemical analysis of the kidney. Transmission electron micrographs of glomeruli and vascular pole region of wild-type (a) and MR −/− mice (b) from day 8 after birth. In MR −/− mice, the macula densa segment of the distal tubule (MD) was enlarged. The extraglomerular mesangium (encircled by a dotted line) showed prominent hyperplasia with granules (arrows in a and b) in almost every cell. Renin immunocytochemistry (c and e) and corresponding phase contrast pictures (d and f) of 8-day-old mice. In MR −/− mice, (e) staining for renin at the vascular pole region is much more prominent than in wild-type mice (c).
Amiloride-Sensitive Na+ Reabsorption Is Reduced, but the Abundance of the mRNAs Encoding the ENaC and (Na++ K+)-ATPase Subunits Is Unchanged in MR −/− Mice.
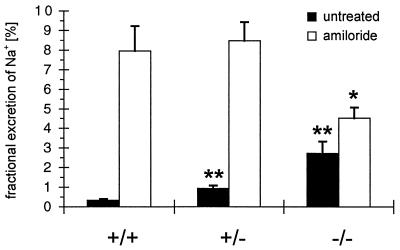
To directly follow ENaC-mediated Na+ transport, ENaC activity was determined in the kidney and the colon. In the kidney, fractional excretion of Na+ was measured before and after application of amiloride at a dose that specifically inhibits ENaC (13, 23). Treatment with amiloride significantly increased fractional excretion of Na+ in wild-type (+/+) animals from 0.3 to 8% and in heterozygous (+/−) animals from 0.9 to 8.5%. In MR −/− mice, the fractional excretion of Na+ was significantly increased by amiloride from 2.7 to 4.5% (P < 0.05). Hence, the fractional excretion of Na+ in MR −/− mice in the presence of amiloride was lower if compared with wild-type and heterozygous mice (Fig. 4, Table 2). In the colon, the amiloride-sensitive transepithelial voltage as a measure of ENaC-mediated Na+ reabsorption was reduced strongly in MR −/− mice by 85% compared with wild-type mice (Table 2).
Figure 4.
Fractional excretion of Na+. At day 8 after birth, the fractional excretion of Na+ of untreated (black columns) and amiloride-treated (white columns) MR −/−, heterozygous (+/−), and wild-type (+/+) animals was determined. Values of MR-deficient (−/−) or heterozygous (+/−) animals that are statistically different from wild-type (+/+) are marked with asterisks. ∗, P < 0.05; ∗∗, P < 0.005 (see also Table 2).
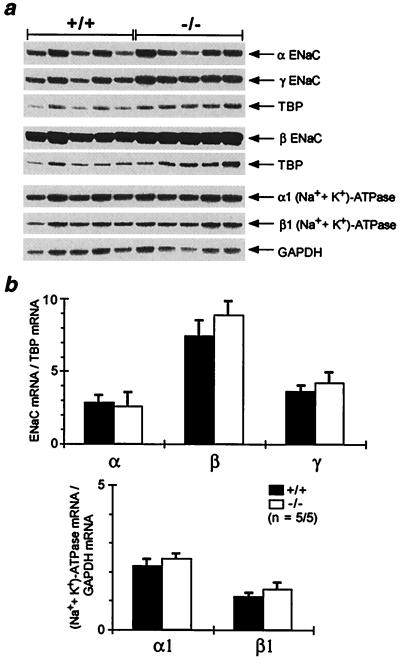
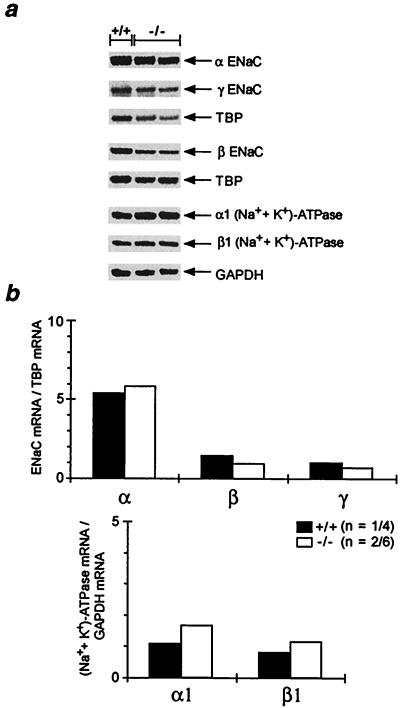
The ENaC consists of three homologous subunits, α, β and γ (13). The (Na++ K+)-ATPase consists of two subunits, with the isoform configuration α1 and β1 expressed in the kidney and in the colon (24). To see whether transcription of ENaC and (Na++ K+)-ATPase was affected, mRNA abundance of the respective subunits was determined by ribonuclease protection assay. In the kidney, inactivation of MR did not change significantly the mRNA abundance (Fig. 5). In the colon, there was no obvious reduction of the subunit mRNA abundance in MR −/− mice (Fig. 6). However, we cannot exclude minor changes in mRNA abundance.
Figure 5.
mRNA abundance of ENaC and (Na++ K+)-ATPase in kidney. (a) Analysis of the mRNA abundance of the α-, β-, and γ-subunit of the ENaC and α1- and β1-subunit of the (Na++ K+)-ATPase in kidneys of 8-day-old wild-type (+/+) and MR-deficient (−/−) mice by ribonuclease protection assay. (b) Ribonuclease protection assay signal was quantified by phosphoimaging, and results are expressed as ratio of the respective subunit mRNA to TBP (TATA-box binding protein) and GAPDH (glyceraldehydephosphate dehydrogenase) mRNA, respectively, used as internal standards. n, number of measurements/number of animals used.
Figure 6.
mRNA abundance of ENaC and (Na++ K+)-ATPase in colon. (a) Analysis of the mRNA abundance of the α-, β-, and γ-subunit of the ENaC and α1- and β1-subunit of the (Na++ K+)-ATPase in colons of 8-day-old wild-type (+/+) and MR-deficient (−/−) mice by ribonuclease protection assay. (b) Ribonuclease protection assay signal was quantified by phosphoimaging, and results are expressed as ratio of the respective subunit mRNA to TBP (TATA-box binding protein) and GAPDH (glyceraldehydephosphate dehydrogenase) mRNA, respectively, used as internal standards. n, number of measurements/number of animals used. Because single colon RNA preparations did not yield enough RNA, ribonuclease protection assays were performed with RNA from pooled colons. Therefore, no SEM bars are given in b.
Activation of GR Prolongs Survival of MR −/− Mice.
The DNA binding domains of MR and GR differ by only four amino acids, and both bind to the same regulatory elements (2). MR and GR are coexpressed in the principal cells of the collecting duct (25) although in these cells, glucocorticoids are inactivated selectively by 11βOHSD2 (7–9). To determine whether GR can substitute for MR function, we injected high doses of betamethasone, a synthetic glucocorticoid, to bypass the prereceptor protective mechanism (26). Daily injection of betamethasone from day 5 after birth prolonged survival of MR −/− mice on average by 17 days (Fig. 2a). However, betamethasone-treated MR −/− mice grew poorly and eventually died, indicating that an activated GR cannot take over MR function fully in aldosterone target tissues or that betamethasone itself has deleterious effects at the applied doses.
DISCUSSION
Analysis of MR-Dependent Na+ Transport by Gene Targeting.
Aldosterone acts in the kidney and the colon by regulation of amiloride-sensitive Na+ reabsorption. The key step of this transport process is luminal Na+ uptake via ENaC. Most of the studies on effects of aldosterone treatment or depletion leave a gap in the understanding of the mechanism that links aldosterone action to enhanced Na+ reabsorption (27). The present study describes the inactivation of MR by a genetic approach and the resulting consequences for Na+ metabolism. The availability of MR knockout mice will provide a useful tool for the investigation of those mechanisms that depend on transcriptional control via MR by aldosterone.
MR −/− Mice Do Not Thrive and Die Early Because of Impaired Na+ Reabsorption.
The phenotype of MR-deficient mice is dominated by renal salt wasting, dehydration, and the failure to thrive. The high growth rate after birth requires Na+ and water retention brought about stimulation of Na+ reabsorptive mechanisms. Impairment of this stimulation by MR deficiency cannot be compensated.
Renal salt wasting by reduced distal tubular Na+ reabsorption can be caused by loss-of-function mutations of ENaC (28) and was investigated by aldosterone depletion (adrenalectomy) and by inhibition of MR (e.g., spironolactone). Defective ENaC function in humans results in pseudohypoaldosteronism type 1 (28), but the increased levels of aldosterone leave MR-dependent pathways other than ENaC operative. Aldosterone depletion results in reduced MR-dependent Na+ transport. However, all other pathways that depend on aldosterone (16) are compromised, too. The conclusions that can be drawn from a pharmacological knock out of MR via spironolactone or other receptor antagonists strongly depend on the specificity and completeness of action of the antagonist. In contrast, inactivation of MR by gene targeting allows us to address directly MR function in a developing organism. The continuous absence of MR, on the other hand, might result in the activation of compensatory mechanisms that could weaken the phenotype or induce secondary symptoms.
MR −/− mice died between days 8 and 13. Measurements of weight, renin, and histological analysis of the kidney structure revealed that there was no detectable phenotype at birth. These findings and the normal Mendelian distribution until day 8 after birth indicate that MR does not play an important role in prenatal development but becomes crucial for the adaptation to the limited Na+ supply in the first period of life. This is evident in the measurements of parameters of Na+ metabolism that have been performed at day 8 after birth.
Because MR −/− mice at this age have a mean body weight of 3.3 g (Table 1), permitting only small plasma samples, the analysis of Na+ metabolism required the adaptation of standard methods and restricted the number of parameters that could be determined. We therefore concentrated on volume homeostasis, Na+ and K+ balance, kidney function, colonic Na+ reabsorption, and the RAAS. Taken together, all parameters showed that MR −/− mice had a strongly enhanced fractional excretion of Na+ that led to hypovolemia, hyponatremia, hyperkalemia, and failure to thrive.
At a glomerular filtration rate of ≈1 μl/g⋅min and 3% fractional renal excretion of Na+ (Table 2), MR −/− mice at day 8 would have to consume ≈15 μmol of Na+ per day, which corresponds to ≈0.6 ml of additional milk intake. This would far exceed the intake capability of these animals. The imbalance of Na+ uptake and loss resulted in the maximized stimulation of the RAAS, which was paralleled by the hyperplasia of the renin-producing cells of the juxtaglomerular apparatus. This activation was ineffective in MR −/− mice whereas heterozygotes that have a moderately increased fractional excretion of Na+ and the corresponding activation of RAAS can compensate for the Na+ loss.
Amiloride-Sensitive Na+ Transport Is Reduced in Kidney and Colon of MR −/− Mice.
Selective inhibition of ENaC by amiloride resulted in the expected increase in renal fractional Na+ excretion and decrease in colonic Na+ reabsorption in wild-type and heterozygous animals. In MR −/− mice, the effect of amiloride was reduced, indicating that the function of ENaC depends on the presence of MR. However, in the kidney and in the colon there was still a significant effect of amiloride, demonstrating that ENaC function is not controlled exclusively by MR.
In the presence of amiloride, MR −/− mice exhibit a lower fractional excretion of Na+ than wild-type and heterozygous animals, indicating that, in MR −/− mice, amiloride-independent Na+-reabsorbing mechanisms might be activated to compensate partially for their increased Na+ loss via reduced ENaC function.
Effect of MR on mRNA Abundance of ENaC and (Na++ K+)-ATPase.
Recent investigations showed that aldosterone depletion had no or only weak effects on ENaC α, β, γ, and (Na++ K+)-ATPase α1, β1 subunit mRNA abundance in the kidney (29). We demonstrate that MR deficiency did not affect the mRNA abundance of these subunits in the kidney of MR −/− mice, indicating that mRNA abundance of ENaC and (Na++ K+)-ATPase subunits in the kidney is not MR-dependent. In the colon, recent investigations showed that aldosterone depletion was able to modulate ENaC mRNA abundance (29). The observed regulatory effect was a gradual decrease of β- and γ-subunit mRNA in the absence of aldosterone. In MR −/− mice, we observed only minor decreases in mRNA abundance for these two subunits. Our data do not show an obvious correlation of ENaC and (Na++ K+)-ATPase subunit mRNA expression and decreased Na+ reabsorption in kidney and colon of MR −/− mice. Taken together, our measurements of mRNA abundance show that MR-mediated control of Na+ reabsorption is not achieved by transcriptional control of ENaC and (Na++ K+)-ATPase mRNA abundance but by transcriptional control of other as yet unidentified genes.
Acknowledgments
We thank E. Schmid, A. Klewe-Nebenius, J. Zimmer, and D. Bock for technical assistance. This work was supported by the Deutsche Forschungsgemeinschaft through Sonderforschungsbereich 229 and Boehringer Ingelheim 422/1–1, by the Fonds der Chemischen Industrie, by the European Community through Grant PL 96 0179, by the Bundesministerium füs Bildung und Forschung through the Human Genome Project Grant 01 KW 9606/7, by the Volkswagen-Stiftung, and by Boehringer Ingelheim.
ABBREVIATIONS
- MR
mineralocorticoid receptor
- ENaC
amiloide-sensitive epithelial Na+ channel
- GR
glucocorticoid receptor
- RAAS
renin–angiotensin–aldosterone system
- ES
embryonic stem
- BW
body weight
Footnotes
This paper was submitted directly (Track II) to the Proceedings Office.
References
- 1.Hollenberg S M, Weinberger C, Ong Estelita S, Cerelli G, Oro A, Lebo R, Thompson E B, Rosenfeld M G, Evans R M. Nature (London) 1986;318:635–641. doi: 10.1038/318635a0. [DOI] [PMC free article] [PubMed] [Google Scholar]
- 2.Arriza J L, Weinberger C, Cerelli G, Glaser T M, Handelin B L, Housman D E, Evans R M. Science. 1987;237:268–275. doi: 10.1126/science.3037703. [DOI] [PubMed] [Google Scholar]
- 3.Funder J W. J Steroid Biochem Mol Biol. 1992;43:389–394. doi: 10.1016/0960-0760(92)90074-s. [DOI] [PubMed] [Google Scholar]
- 4.Zennaro M C, Farman N, Bonvalet J P, Lombes M. J Clin Endocrinol Metab. 1997;82:1345–1352. doi: 10.1210/jcem.82.5.3933. [DOI] [PubMed] [Google Scholar]
- 5.Arriza J L, Simerly R B, Swanson L W, Evans R M. Neuron. 1988;1:887–900. doi: 10.1016/0896-6273(88)90136-5. [DOI] [PubMed] [Google Scholar]
- 6.Lombes M, Alfaidy N, Eugene E, Lessana A, Farman N, Bonvalet J P. Circulation. 1995;92:175–182. doi: 10.1161/01.cir.92.2.175. [DOI] [PubMed] [Google Scholar]
- 7.Edwards C R, Stewart P M, Burt D, Brett L, McIntyre M A, Sutanto W S, de Kloet E R, Monder C. Lancet. 1988;ii:986–989. doi: 10.1016/s0140-6736(88)90742-8. [DOI] [PubMed] [Google Scholar]
- 8.Funder J W, Pearce P T, Smith R, Smith A I. Science. 1988;242:583–585. doi: 10.1126/science.2845584. [DOI] [PubMed] [Google Scholar]
- 9.Albiston A L, Obeyesekere V R, Smith R E, Krozowski Z S. Mol Cell Endocrinol. 1994;105:R11–R17. doi: 10.1016/0303-7207(94)90176-7. [DOI] [PubMed] [Google Scholar]
- 10.Champigny G, Voilley N, Lingueglia E, Friend V, Barbry P, Lazdunski M. EMBO J. 1994;13:2177–2181. doi: 10.1002/j.1460-2075.1994.tb06494.x. [DOI] [PMC free article] [PubMed] [Google Scholar]
- 11.Joels M, de Kloet E R. Trends Neurosci. 1992;15:25–30. doi: 10.1016/0166-2236(92)90345-9. [DOI] [PubMed] [Google Scholar]
- 12.Evans R M, Arriza J L. Neuron. 1989;2:1105–1112. doi: 10.1016/0896-6273(89)90177-3. [DOI] [PubMed] [Google Scholar]
- 13.Canessa C M, Schild L, Buell G, Thorens B, Gautschi I, Horisberger J D, Rossier B C. Nature (London) 1994;367:463–467. doi: 10.1038/367463a0. [DOI] [PubMed] [Google Scholar]
- 14.Duc C, Farman N, Canessa C M, Bonvalet J P, Rossier B C. J Cell Biol. 1994;127:1907–1921. doi: 10.1083/jcb.127.6.1907. [DOI] [PMC free article] [PubMed] [Google Scholar]
- 15.Rossier C R, Palmer L G. In: The Kidney: Physiology and Pathophysiology. Seldin D W, Giebisch G, editors. New York: Raven; 1992. pp. 1373–1409. [Google Scholar]
- 16.Verrey F. J Membr Biol. 1995;144:93–110. doi: 10.1007/BF00232796. [DOI] [PubMed] [Google Scholar]
- 17.Ecke D, Bleich M, Greger R. Pflugers Arch. 1996;431:984–986. doi: 10.1007/s004240050095. [DOI] [PubMed] [Google Scholar]
- 18.Staub O, Dho S, Henry P, Correa J, Ishikawa T, McGlade J, Rotin D. EMBO J. 1996;15:2371–2380. [PMC free article] [PubMed] [Google Scholar]
- 19.Attali B, Latter H, Rachamim N, Garty H. Proc Natl Acad Sci USA. 1995;92:6092–6096. doi: 10.1073/pnas.92.13.6092. [DOI] [PMC free article] [PubMed] [Google Scholar]
- 20.Laragh J H. In: The Kidney: Physiology and Pathophysiology. Seldin D W, Giebisch G, editors. New York: Raven; 1992. pp. 1411–1453. [Google Scholar]
- 21.Al Dahhan J, Haycock G B, Chantler C, Stimmler L. Arch Dis Child. 1983;58:335–342. doi: 10.1136/adc.58.5.335. [DOI] [PMC free article] [PubMed] [Google Scholar]
- 22.Green S, Kumar V, Theulaz I, Wahli W, Chambon P. EMBO J. 1988;7:3037–3044. doi: 10.1002/j.1460-2075.1988.tb03168.x. [DOI] [PMC free article] [PubMed] [Google Scholar]
- 23.Palmer L G, Kleyman T R. In: Handbook of Experimental Pharmacology. Greger R, Knauf H, Mutschler E, editors. Berlin: Springer; 1995. pp. 363–394. [Google Scholar]
- 24.Lingrel J B, Kuntzweiler T. J Biol Chem. 1994;269:19659–62. [PubMed] [Google Scholar]
- 25.Farman N, Oblin M E, Lombes M, Delahaye F, Westphal H M, Bonvalet J P, Gasc J M. Am J Physiol. 1991;260:C226–C233. doi: 10.1152/ajpcell.1991.260.2.C226. [DOI] [PubMed] [Google Scholar]
- 26.Wang Z M, Yasui M, Celsi G. Am J Physiol. 1994;267:C450–C455. doi: 10.1152/ajpcell.1994.267.2.C450. [DOI] [PubMed] [Google Scholar]
- 27.Garty H, Palmer L G. Physiol Rev. 1997;77:359–396. doi: 10.1152/physrev.1997.77.2.359. [DOI] [PubMed] [Google Scholar]
- 28.Chang S S, Grunder S, Hanukoglu A, Rosler A, Mathew P M, Hanukoglu I, Schild L, Lu Y, Shimkets R A, Nelson Williams C, et al. Nat Genet. 1996;12:248–253. doi: 10.1038/ng0396-248. [DOI] [PubMed] [Google Scholar]
- 29.Escoubet B, Coureau C, Bonvalet J P, Farman N. Am J Physiol. 1997;272:C1482–C1491. doi: 10.1152/ajpcell.1997.272.5.C1482. [DOI] [PubMed] [Google Scholar]
- 30.Tamura T, Sumita K, Fujino I, Aoyama A, Horikoshi M, Hoffmann A, Roeder R G, Muramatsu M, Mikoshiba K. Nucleic Acids Res. 1991;19:3861–3865. doi: 10.1093/nar/19.14.3861. [DOI] [PMC free article] [PubMed] [Google Scholar]
- 31.Kaestner K H, Montoliu L, Kern H, Thulke M, Schutz G. Gene. 1994;148:67–70. doi: 10.1016/0378-1119(94)90234-8. [DOI] [PubMed] [Google Scholar]
- 32.Chomczynski P, Sacchi N. Anal Biochem. 1987;162:156–159. doi: 10.1006/abio.1987.9999. [DOI] [PubMed] [Google Scholar]
- 33.Kaestner K H, Ntambi J M, Kelly T J, Jr, Lane M D. J Biol Chem. 1989;264:14755–14761. [PubMed] [Google Scholar]
- 34.Kaissling, B. & Kriz, W. (1982) Kidney Int. 12, Suppl., S9–S17. [PubMed]
- 35.Bachmann S, Peters J, Engler E, Ganten D, Mullins J. Kidney Int. 1992;41:24–36. doi: 10.1038/ki.1992.4. [DOI] [PubMed] [Google Scholar]
- 36.Meier G. Clin Sci (Lond) 1988;75:551–557. doi: 10.1042/cs0750551. [DOI] [PubMed] [Google Scholar]
- 37.Peters J, Munter K, Bader M, Hackenthal E, Mullins J J, Ganten D. J Clin Invest. 1993;91:742–747. doi: 10.1172/JCI116292. [DOI] [PMC free article] [PubMed] [Google Scholar]
- 38.Peters J, Hilgers K F, Maser Gluth C, Kreutz R. Clin Exp Hypertens [A] 1996;18:933–948. doi: 10.3109/10641969609097909. [DOI] [PubMed] [Google Scholar]
- 39.Skrabal F, Aubock J, Edwards C R, Braunsteiner H. Lancet. 1978;i:298–302. doi: 10.1016/s0140-6736(78)90070-3. [DOI] [PubMed] [Google Scholar]


