

Abstract
A versatile, computationally-efficient two-dimensional (2D) speckle-tracking method based on high resolution ultrasound imaging is proposed to quantify regional myocardial dysfunction in mice. Ultrasound scans were performed on the hearts of normal and post myocardial infarction (MI) mice with a Vevo770 scanner (VisualSonics, Toronto, Canada) operating at 30 MHz frequency. Regional myocardial motion was tracked using a 2D Minimum Sum of Absolute Differences (MSAD) block-matching algorithm. Motion analyses calculated from ultrasound images were compared to "gold-standard" analyses performed using small animal Magnetic Resonance Imaging (MRI). The radial and circumferential components of strain were compared between ultrasound and MRI short axis views and promising correlations were obtained (R = 0.90 and R = 0.85 for radial and circumferential strain, respectively). Therefore, ultrasound imaging, followed by 2D image tracking, provides an effective, low cost, mobile method to quantify murine cardiac function accurately and reliably.
Keywords: myocardial infarction, regional contractile function, ultrasound, speckle tracking, magnetic resonance imaging
INTRODUCTION
The quantification of regional myocardial dysfunction serves as a valuable tool for the diagnosis and monitoring of myocardial infarction and heart failure. Quantification of left ventricular (LV) mechanical dyssynchrony can serve as a guide to cardiac resynchronization therapies (CRT) (Breithardt 2002; Bax 2004). Thus, there is an increasing demand for noninvasive imaging modalities that are capable of accurately assessing cardiac mechanics and wall motion abnormalities.
The mouse is widely used as an animal model for investigating cardiovascular disease (Michael 1995). Advances in transgenesis and gene targeting, combined with the sequencing of the mouse genome have greatly increased the utility of mice for determining how genetic factors influence cardiac disease and response to therapy (Yang 2000) Prior studies have used transgenic and knock-out mice to investigate the role of specific genes in the pathophysiology of MI. Despite the sophistication of modern medical imaging techniques, mouse cardiac contractile function remains difficult to quantify, due to the small size (< 6 mm x 8 mm) and rapid heart rate in mice (400–600 beats per minute for mice under anesthesia, 550 – 700 beats per minute for conscious mice). Additionally, the mouse species is widely preferred due to its low-cost and short reproductive cycle.
Various imaging modalities have been explored to assess small animal cardiac structure and function, including computed tomography (Gleason 1999), positron emission tomography (Aboagye 2005), and single-photon emission computed tomography (Acton 2003). However, these modalities have relatively low resolution and provide limited information regarding regional contractile function. Recently, studies have been reported using Magnetic Resonance Imaging (MRI) to examine contractile function in the mouse heart (Epstein 2002). MRI tagging (Zerhouni 1988), MRI velocity-encoded imaging (Arai 1999; Streif 2003), and MRI Displacement-ENcoded imaging using Stimulated Echoes (DENSE) have provided accurate and reliable tools for the analysis of regional contractile function in mice, both in 2D (Gilson 2004) and 3D (Gilson 2005). MRI is currently recognized as the gold standard for the assessment of cardiac morphology and physiology (Shah 2005). Although MRI has excellent spatial and contrast resolution, MRI scanners are expensive and have relatively slow data acquisition rates. In human MRI, subjects are frequently requested to hold their breath while the images are being acquired, or respiratory gating is used during acquisition. In comparison, intubation and artificial respiration are required in animals to approximate such breath-holding techniques. The rate of image acquisition by MRI is also significantly slower than by ultrasound, with longer MRI acquisitions yielding higher signal to noise ratios (SNR). Therefore, although DENSE MRI has been used to precisely measure regional myocardial strain from end-diastole (ED) to end-systole (ES), apart from the cost issue, it still remains to be seen whether small animal MRI systems have the temporal resolution necessary to measure myocardial strain rate by DENSE in mice.
Echocardiography plays an indispensable role in cardiac imaging due to its real-time acquisition capabilities and ease of maneuverability. Echocardiography is also inexpensive in comparison to MRI-based techniques. Acquisition costs for MRI scanners are 5–10 times as high as for echocardiography systems. Additionally, infrastructure (specialized building) costs and operating costs are significant for MR scanners and insignificant for echocardiography systems.
In recent years, Doppler-based ultrasound imaging techniques, including tissue Doppler imaging and strain rate imaging, have made remarkable progress in the evaluation of regional contractile function (Sutherland 1994; Heimdal 1998; D'hooge 2000; Sebag 2005). These techniques have proven to be increasingly powerful tools for the assessment of cardiac function in mice (D'hooge 2004). However, an intrinsic limitation of these Doppler techniques is that they are angle-dependent and only able to detect the motion component along the ultrasound beam. This angle-dependence limits the utility of Doppler techniques, especially in the short-axis view of cardiac images, where there is significant motion perpendicular to the ultrasound beam that cannot be detected by Doppler techniques. Two-dimensional radio-frequency (RF) data based tracking, operating on 1D kernels both along and perpendicular to the ultrasound beam, has proven to be applicable for sheep hearts (Langeland 2005), but it requires a very high image frame rate to avoid aliasing, rendering it difficult to apply in the rapidly beating mouse heart. Two-dimensional speckle tracking on B-mode image sequences overcomes angle-dependency and provides the capability to measure radial, circumferential and longitudinal (on long-axis view images) components of myocardial motion. Speckle tracking-based myocardial strain calculation has been recently employed in human ultrasound studies (Leitman 2004; Amundsen 2006) and canine studies (Toyoda 2004). However, in order to measure murine myocardial dynamics, it is necessary to use a higher resolution of spatial imaging and a higher effective frame rate than was employed in these earlier studies.
In this study, we present a high resolution 2D method for quantification of regional myocardial function in the mouse heart using speckle tracking on very fine resolution and high frame rate B-mode ultrasound images. This approach is angle-independent and has a relatively modest imaging frame rate requirement to avoid under-sampling effects. The ED-to-ES displacements and strains in mice hearts were measured using this method, and the results were validated by comparing them to those derived from cardiac MRI.
MATERIALS AND METHODS
Mouse Preparation
All the experiments in this study conformed with an animal protocol approved by the University of Virginia Animal Care and Use Committee. The mice used in this study were male C57BL/6 mice (8–10 weeks old, body weight 22–28 g) purchased from Jackson Laboratories (Bar Harbor, ME). A mouse model of reperfused MI was used, which approximates the contemporary clinical situation in which the majority of thrombosed coronary arteries are ultimately re-canalized or bypassed. MI was induced by a one-hour occlusion of the left anterior descending (LAD) coronary artery followed by reperfusion, as described in (Yang 2000). Briefly, the mouse was ventilated with an endotracheal tube and the chest was opened. Coronary artery ligation was achieved by passing a 7–0 silk suture beneath the LAD 2 to 3 mm inferior to the left auricle, then tightening it over a length of PE-20 tubing. After 60 minutes the tubing was removed to achieve reperfusion, and the chest was closed in layers. The endotracheal tube was removed once spontaneous breathing resumed. The mouse was allowed to recover from the operation for a day prior to imaging. This technique induces myocardial infarction in the apex and anterolateral walls of the mouse LV. The ultrasound and MRI imaging were performed one day after myocardial infarction (hereafter referred to as “D1 post-MI”).
During ultrasound scanning, the mouse was carefully maintained under light anesthesia by using an inhaled mixture of 1% isoflurane gas and atmospheric air. The mouse was placed supine on an electrical heating pad, and a tensor lamp was used to provide additional heat. The mouse core temperature was monitored with a rectal temperature probe coupled to a digital thermometer and was maintained at 37.0±0.2°C so as to minimize heart rate variation throughout the procedure. ECG signals were obtained by contacting the mouse limbs, coupled with electrically conductive gel, to ECG electrodes integrated into the heating pad. The chest area and limbs were shaved and depilated to improve contact for the ultrasound transducer and ECG electrodes respectively. Ultrasound gel was warmed to body temperature and applied to the skin carefully using a syringe to avoid the formation of air bubbles. Care was taken not to apply excess pressure onto the chest in order to avoid heart deformation. The mouse was kept in a similar condition during MRI scanning, except that circulating water, instead of a heating pad, was used to maintain body temperature.
Image Acquisitions
Six mice underwent cardiac ultrasound scans at 24 hours after experimental MI induced by coronary occlusion, and five of these mice underwent cardiac MRI scans in the short axis view (MRI short axis images were not acquired from the sixth mouse due to technical difficulties). Two normal mice were also scanned as controls. Cardiac image sequences were acquired using a VisualSonics Vevo770 high-resolution ultrasound scanner (VisualSonics Inc., Toronto, Ontario, Canada) operated at 30 MHz, and possessing a –6dB fractional bandwidth of approximately 60%. The operating conditions used in our studies resulted in approximately 50 μm –6dB axial resolution and 100 μm –6dB lateral resolution.
This system is one of the few commercially available ultrasound scanners that provides both the high spatial resolution and high frame rate necessary to obtain optimal results from speckle-tracking analysis, although a small number of prototype small animal ultrasound systems have been reported recently (Anderson 2003; Aristizabal 2005; Liu 2006). Premium clinical scanners, e.g. Siemens Sequoia with the 15L8 transducer (Scherrer-Crosbie 1999), Philips SONOS 5500 (Dawson 2004), and GE Vivid7 (Sebag 2005), have been used for mouse heart imaging . These scanners lack the spatial resolution of the Vevo scanner but are capable of sufficiently high frame rates (i.e. >100 frames/s). The techniques presented here can also be used on the Vevo scanner in non-EKV mode – i.e. “realtime” at approximately 100 frames/s. During our investigations of the performance of the techniques on data possessing inferior spatial and temporal resolution (using the Vevo in “realtime” mode and using Sequoia data), the accuracy of the tracking estimates degraded.
B-mode ultrasound short-axis images were collected at the mid-ventricular level and long-axis images were collected from the parasternal view. The field of view (FOV) was adjusted to maximize the display resolution of the region of interest (ROI). Image intensity was increased sufficiently high enough to illuminate the myocardial region in order to improve the SNR in this region. Image data acquired from multiple cardiac cycles were retrospectively assembled into a representative image sequence composed of over 100 images per cardiac cycle using the “ECG (Electrocardiogram)-based Kilohertz Visualization” (EKV) capability of the Vevo770 scanner (Cherin 2006). The EKV images are synchronized with respect to the ECG signal. Individual A-line captures that are corrupted by respiratory motion are automatically detected and omitted from the reconstruction. The time necessary to collect one complete EKV short-axis dataset was 2–3 minutes, and the time to complete a single ultrasound session ranged from 15–30 minutes per mouse. The acquired image sequences were then transferred to a PC for offline processing.
Immediately after the ultrasound imaging, the six post-MI mice and the two normal mice underwent MRI DENSE imaging on a 4.7 Tesla scanner (Varian, Palo Alto, CA), using a custom-made Litz RF coil (Doty Scientific, Columbia, SC). Scouting was first performed to select the short-axis, mid-ventricular slice of the LV that best matched the slice imaged during the previous ultrasound study. For each mouse, DENSE imaging was conducted in short-axis and long-axis views, with each view producing two sets of ECG-triggered ES displacement (respective to the initial ED phase) encoded images in X and Y directions. The time required to perform the DENSE imaging was approximately 35 minutes for each of the short-axis and long-axis views. Each DENSE image possessed a FOV 30 mm x 30 mm, and comprised 128 x 128 pixels. While it is possible to increase the resolution of the MRI image data, this could only be done at the expense of longer scan times or higher field strengths.
Data Processing
The acquired B-mode ultrasound image sequences were transferred to a PC for offline processing using the procedure shown schematically in Fig. 1. Figure 1A is an example short-axis view of a high-resolution B-mode cardiac image. The first step was to identify the ROI, i.e., the myocardium, by manually contouring (via graphical user interface) the endocardial and epicardial borders (Fig. 1B). Borders were contoured once every 20 image frames starting from the end-diastolic frame for each set of 100–110 images that defined a complete cardiac cycle. For the remaining image frames, borders were derived by linearly inter-frame interpolating between the manually contoured borders. In the second step, the ROI was populated with 2D pixel blocks for motion tracking (Fig. 1C). Myocardial tissue displacement was estimated by matching the 2D pixel blocks between each pair of image frames under investigation. Although the blocks shown in this figure are not overlapping (for clarity of display), the blocks for adjacent motion estimates were placed such that they overlapped by 75%, yielding an improved density of tracking blocks, and thus an improved perceived spatial resolution of resultant displacement fields. Subsequently, 2D pixel block-matching (“speckle tracking”) was performed on the image sequence (Fig. 1D).
Fig. 1.
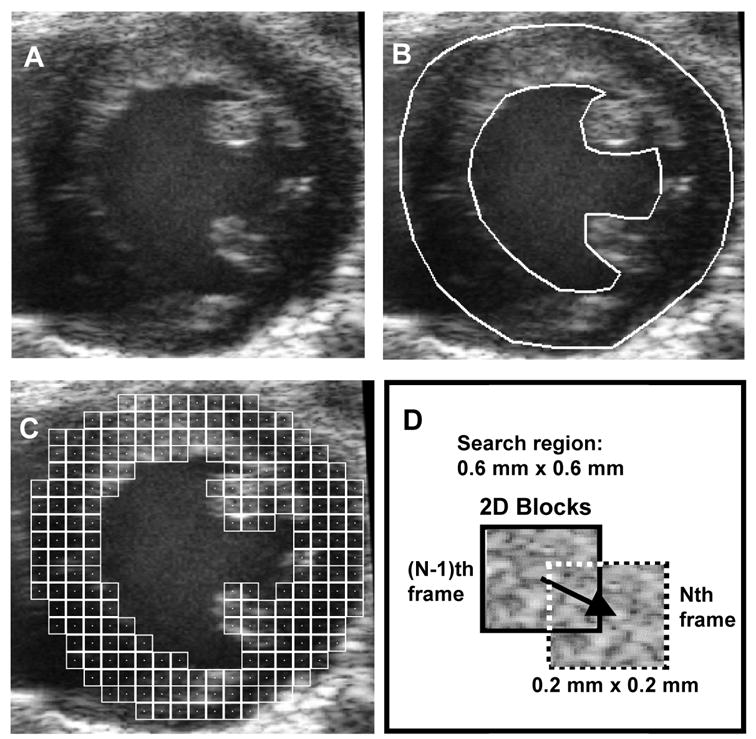
Schematic of the speckle tracking process. A, raw B-mode image. B, identification of ROI (i.e., LV myocardium). C, population of ROI with 2D pixel blocks for tracking displacement. D, schematic of 2D pixel block-matching between two adjacent frames.
Tissue displacement in the axial and lateral directions between a pair of subsequent image frames was estimated by translating the block over a pre-defined search region to find the best match determined using MSAD (Friemel 1995) as the match criterion. A tracking pixel block size of approximately 0.2 mm x 0.2 mm was used here. The centers of adjacent search blocks were spaced on a 50 x 50 μm grid resulting in 75% overlap between adjacent pixel blocks. The pixel dimensions were typically approximately 15 μm across. Tracking resolution in axial and lateral directions was improved by fitting a parabola to the SAD values surrounding the detected MSAD point to estimate the actual minimum to sub-pixel resolution in both axial and lateral directions. The 2σ error of the displacement estimates was examined in vitro using a phantom test and was found to be approximately 2.6% in the axial direction and 5.3% in the lateral direction. An in vivo determination of displacement error was not attempted due to the difficulty of obtaining an appropriate set of reference values.
The current MSAD implementation is highly computationally-efficient and compatible with Intel (Intel Corp., Santa Clara, CA) /AMD (Advanced Micro Devices, Inc, Sunnyvale, California, USA) Single-Instruction, Multiple-Data (SIMD) processing, which performs operations on either 8 or 16 pixels in parallel (depending on whether a 32 bit or newer 64 bit processor is being used). In the MSAD tracking, the pixel block size (200 μm/15 μm per pixel ≈ 13.3 pixels) was rounded to 16 pixels x 16 pixels (the nearest integer multiple of 8 pixels) in order to facilitate the 8-pixel parallel processing. The use of SIMD commands embedded in C++ code enabled us to achieve a processing speed of 0.11 seconds per frame (400 x 400 pixels) on a 2.9 GHz, 2 GB RAM Intel Pentium IV processor. Alternative match criteria, such as cross-correlation or Sum of Squared Differences, could also be used if desired. However, MSAD yields performance similar to that obtained using cross correlation at a lower computational cost (Friemel 1995). Meanwhile, since MSAD uses differences between data sets, it is more susceptible to degradation when image SNR is low. Thus, the echo images must possess high electronic SNR to be suitable for MSAD processing.
The frame-to-frame displacement map of tissue elements was represented by vectors with X and Y displacement components on a 2D grid. For each time step, the 2D grid location of the origin for a particular block-matching search was obtained from the displacement estimate in the previous time step in order to track, as accurately as possible, the same tissue element throughout the cardiac cycle. A cumulative displacement map was obtained by summing the frame-to-frame displacements from the end-diastolic starting point. A 3x3 Gaussian 2D filter was applied to the displacement maps to smooth the displacement estimates and reduce the impact of “outlier” estimates. Similarly, filtering was applied to successive frames, where a 1D median filter with a length of 5 was applied to the image sequences for a cardiac cycle comprised of over 100 image frames.
A metric for determining the cumulative tracking error is the ratio of the observed net displacement (d) of each anatomic tissue element to the total path length (l) through a complete cardiac cycle. This metric is based on the observation that the net displacement of each tissue element over a complete cardiac cycle should be zero, because the heart does not exhibit net displacement from one cardiac cycle to the next. The d/l ratio ranges from 0 to 1, where a perfect tracking yields a d/l value of 0. The d/l ratio is a suitable metric to determine cumulative tracking error in our studies because the heart rate remains relatively stable during the imaging session. The mean heart rate for all image acquisitions was 568 ± 31 bpm for normal mice and 550 ± 48 bpm for mice with MI. However, each EKV scan took less than 200 seconds for a short-axis scan and less than 300 seconds for a long-axis scan. The heart rate variation during each EKV acquisition (2–3 minutes duration) was maintained below ± 5 bpm for normal mice and ± 10 bpm for post-MI mice. Hence, the average error in time over a complete cardiac cycle was less than 1% for the normal mice and less than 2% for the post-MI mice.
Strain calculation
We computed Lagrangian strains in this study, following the convention in previous studies of myocardial displacement (D'hooge 2000; Epstein 2002; Gilson 2004). The strain vector (E) was computed in each 4-pixel neighborhood in the 2D displacement field by isoparametric formulation using quadrilateral elements (Moaveni 1999). The radial strain (Err) and circumferential strain (Ecc) component of E were computed by vector projection relative to the epicardial center of mass. Err of a tissue segment indicates the “thickening” of this segment in the radial direction (towards the centroid of the epicardium) with respect to the initial “thickness”. Ecc of a tissue segment indicates the change in arc length with respect to the initial arc length.
In most hearts, Err accounts for a greater part of the overall myocardial deformation than the other strain components, and thus was used as the primary measurement of myocardial function in this study. Sectional Err, defined as the mean Err of all the tissue segments within a given myocardial sector, was measured at all cardiac phases from ED to ES. A standardized six-segment model (Cerqueira 2002) of the mid-ventricle in the short-axis view was used in our analyses. In this report, all statistical values are mean ± 1 SD.
Validation with MRI
MRI DENSE images acquired from the same mice were processed to quantify regional myocardial strain to validate the proposed ultrasound-based method. Displacement vectors and radial and circumferential strains were calculated from MRI images as described previously (Gilson 2004). Briefly, the X-direction and Y-direction components of displacement of each pixel from ED to ES were reconstructed from the raw MRI data. Then the Lagrangian strain tensor E was calculated using isoparametric formulation using quadrilateral elements, and strain components Err and Ecc were derived by vector projection relative to the epicardial center of mass.
The agreement between the ultrasound-based and MRI-based measurement methods was examined using Bland-Altman analysis (Bland 1986). The Err and Ecc strain maps measured using ultrasound and MRI were compared using short-axis images positioned at the mid-ventricular level of the LV. The short-axis LV images, obtained using each modality, were divided into 32 equiangular sectors and the mean magnitudes of Err and Ecc values within each sector were calculated. The agreement between the two methods was assessed by calculating the difference between the two methods for the 32 measurements on each of 5 post-MI mice and 2 normal mice. The mean difference and 95% confidence interval (calculated as mean ± 2 SD) were then estimated relative to the mean measurement of both methods. In one of the 5 post-MI mice, 8 measurements in the septal region representing 1/4 of the LV circumference were excluded from the comparison because of signal drop out due to rib “shadows” in this region.
In addition, the correlation between the MRI and ultrasound measurements of Err and Ecc, and the least-squares fit linear regression of the measurements from the two methods, were also calculated using the 5 post-MI mice and 2 normal mice. The correlation coefficient was calculated as:
| (1) |
where <•,•> represents inner product, U and V are vectors containing the mean strain magnitudes of the 32 sectors measured with MRI and ultrasound, and ||•|| gives the Euclidean norm.
RESULTS
The results of the displacement analysis performed on cardiac ultrasound images from healthy mice were consistent with those from the corresponding analysis performed on cardiac MR images, demonstrating relatively uniform displacement throughout the LV (Fig. 2). The ED-to-ES displacements were calculated for the myocardial tissue elements at each 2D grid point, and the magnitudes and directions of the resultant displacement vectors for each tissue element were represented by arrows (Figs. 2A and 2B). The radial components of the ED-to-ES displacements from both MRI and US analyses were extracted and displayed in a color gradient map, with radially inward displacement defined as positive and outward as negative (Figs. 2C and 2D). The arrow lengths and color gradient were scaled from 0 to the maximum magnitude of displacement over the entire image sequence.
Fig. 2.
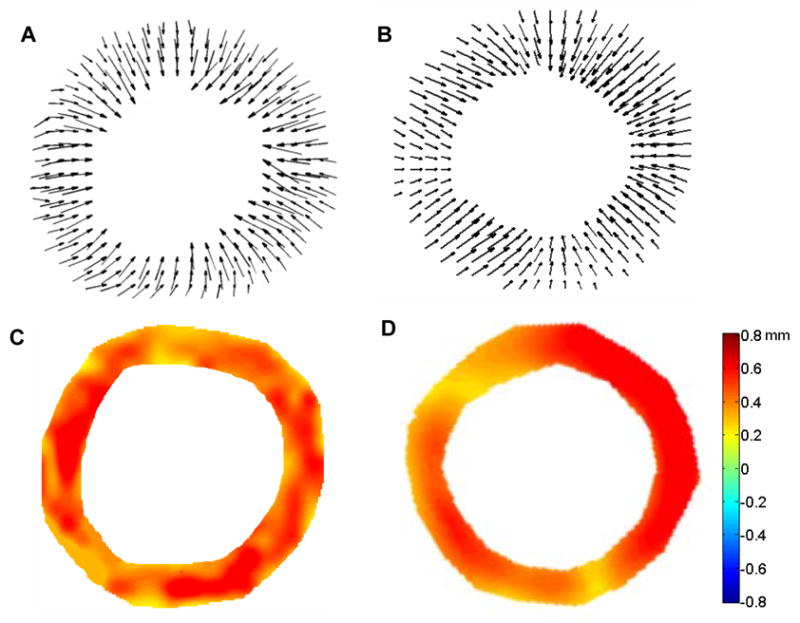
ED-to-ES displacement vector fields from short-axis views of the mid-ventricle from healthy C57BL/6 mice illustrated in “arrow” representations obtained via MRI (A) and ultrasound (B). ED-to-ES radial displacement maps in color gradient representations obtained via MRI (C) and ultrasound (D). Positive values in the color bar indicate radially inward displacements.
Assessment of ED-to-ES displacements from D1 post-MI mouse hearts revealed significantly reduced displacement in infarcted areas of the anterolateral wall, as illustrated by the displacement maps obtained from both the long-axis view (Figs. 3A and 3B) and the mid-ventricular, short-axis view (Figs. 3C and 3D).
Fig. 3.
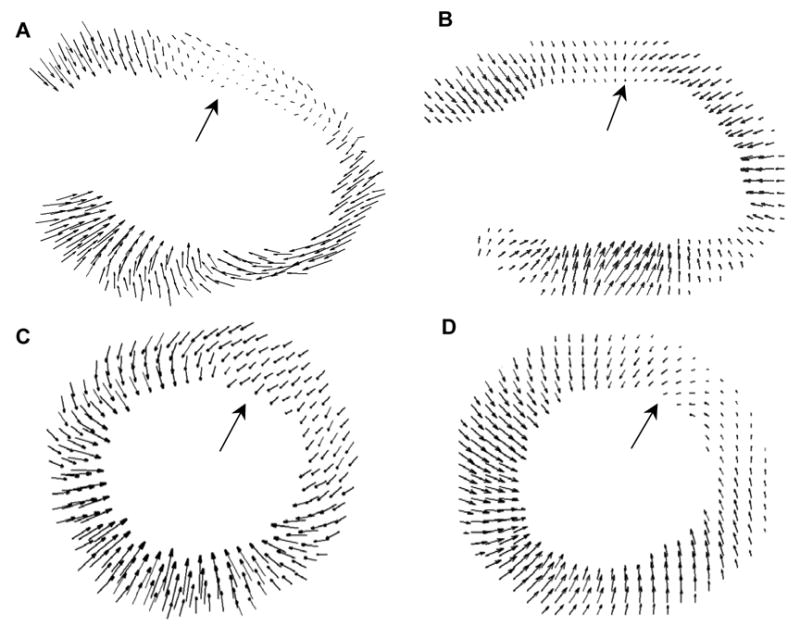
ED-to-ES displacement maps for a D1 post-MI mouse heart in long-axis view (top – lateral wall, bottom – septum) using MRI (A) and ultrasound (B); and in the mid-ventricular, short-axis view of another D1 post-MI mouse heart (left – septum, right – lateral wall, top – anterior wall, bottom – posterior wall), using MRI (C) and ultrasound (D). In both the MRI and ultrasound assessments, defects in contraction were evident in the lateral wall in the long-axis view and in the anterolateral segment in the short-axis view (indicated by large arrows)
Calculated displacement maps were superimposed onto the original ultrasound image sequences, as shown in Fig. 4, allowing each displacement vector to be visually compared with the underlying image data.
Fig. 4.
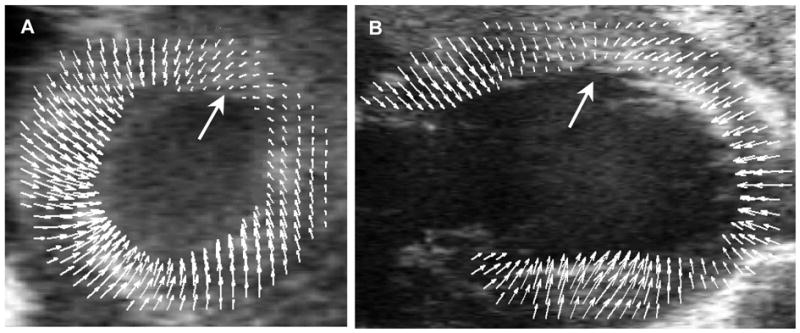
Displacement maps for a D1 post-MI mouse heart superimposed onto the original ultrasound images to provide a visual representation of the relationship between anatomy and function. A, mid-ventricular, short-axis view. B, long-axis view of a second D1 post-MI mouse heart. The orientations of A and B are the same as in Figure 3. Wall motion defects are indicated with large arrows.
The 2D ED-to-ES Err and Ecc maps were compared in the mid-ventricular, short-axis view from the ultrasound and MR images. By convention, normal Err values are positive and normal Ecc values are negative, since they describe wall thickening (in the radial direction) and wall shortening (in the circumferential direction), respectively. Contractile dysfunction in the D1 post-MI mouse hearts is evident in the ultrasound analyses and is consistent with the results derived from MRI (Fig. 5). A 5x5 pixel 2D Gaussian filter was applied to smooth the strain maps derived from both imaging modalities.
Fig. 5.
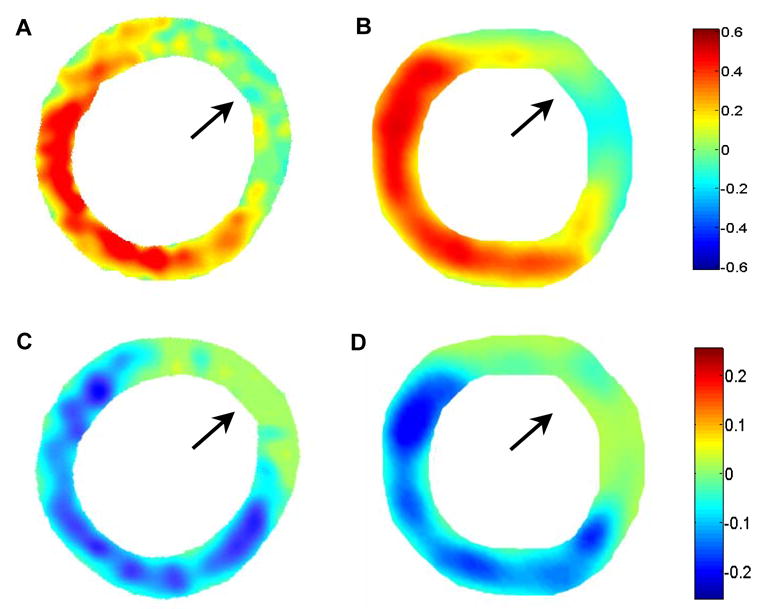
ED-to-ES Err strain maps from a D1 post-MI mouse heart using MRI (A) and ultrasound (B). ED-to-ES Ecc strain maps from the same mouse heart using MRI (C) and ultrasound (D). The orientation is the same as in the short-axis views shown in Figures 3 and 4. In both the Err and Ecc, maps, defects in contraction are observed in the anterolateral LV (as indicated by arrows).
Linear regression analysis of the Err and Ecc values measured by MRI and ultrasound yielded y = 0.87x + 0.024 and y = 0.81x - 0.022, respectively. The correlation coefficients calculated using Eqn. (1) were R = 0.90 (P < 0.001) for Err and R = 0.85 (P < 0.001) for Ecc in this study population (Figs. 6A and 6B). Different markers were used in the graphs to differentiate data points from the individual mice. The least-squares fit of a Bland–Altman analysis of the Err measured using the two modalities yielded y = 0.06x – 0.009, where x is the average Err of the measurements by MRI and ultrasound, and y is the difference between them. The 95% confidence interval was -0.050 to 0.058 (Fig. 6C), with the Err values ranging from 0 to 0.5. For the Ecc measurements, a similar fit of the Bland–Altman analysis produced y = 0.09x + 0.012 and the 95% confidence interval was -0.023 to 0.029 (Fig. 6D), with the Ecc values ranging from -0.2 to 0. All graphs show a good agreement between the two methods, with 95% of the ultrasound measurements within 10–12% of the MRI values for Err and within 11–15% of the MRI values for Ecc. While every effort was made to maintain comparable conditions between the two imaging sessions, note that real differences between the cardiovascular states of the mice during the ultrasound and MR imaging sessions may also have contributed to the differences observed in Ecc and Err between the two modalities.
Fig. 6.

Correlation of strain values as measured by ultrasound and MRI for Err (A) and for Ecc(B). Bland Altman plots for Err (C) and for Ecc (D) indicate the mean differences with dark lines and the 95% confidence intervals (CI) calculated as mean ± 2 SD with light lines. Different markers in the graphs are used to identify individual mice. ‘∆’ and ‘×’ represent the two normal mice; ‘○’, ‘*’,’ □’,’◇’ represent the five post-MI mice.
Notice that in this statistical analysis, the data were clustered (224 observations total from 7 mice, including 5 post-MI mice and 2 normal mice, 32 observations per mouse). Due to the small number of mice, their different physiological conditions, and the inherent relatedness of the observations within a mouse, i.e., intracluster correlation coefficient, the effective sample size of the experiment was actually smaller than 224(Kerry 1998; Killip 2004). (When taking into account the intracluster correlation coefficient, the effective sample size, calculated using the formula in (Killip 2004) is approximately 58 and 87 for Err and Ecc measurements, respectively.)
The standardized six-segment model (Cerqueira 2002) of the mid-ventricle in the short-axis view was used for the strain analyses. In the normal mice studied using ultrasound, the time course of Err over a cardiac cycle exhibited similar patterns and relatively uniform magnitudes in each of the myocardial sectors (Fig. 7). The ultrasound results were consistent with the results of the de facto gold standard (cardiac MRI). The difference between the peak radial strains in all six sectors measured by ultrasound and MRI was within 10% of the values measured by MRI.
Fig. 7.
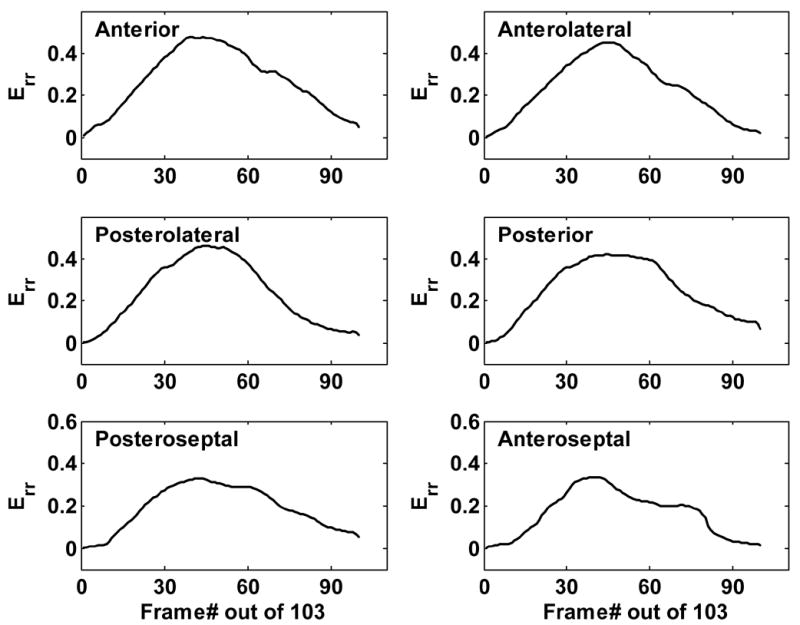
Time evolution of Err throughout a cardiac cycle in six myocardial sectors from a normal mouse heart assessed using ultrasound. Peak Err was 0.45 in the anterolateral wall and 0.38 in the septum, consistent with the results of cardiac MRI.
The same assessment of Err was performed on D1 post-MI mice, as illustrated in Fig. 8. Measured from ultrasound images, Err in non-infarcted septal regions was only approximately 10% lower than in normal mouse hearts. However, in the infarcted anterolateral sectors, Err was significantly reduced by 80–90%. The anterior and posterolateral sectors (bordering the infarcted region) showed a reduction of approximately 50% in Err. These measurements were consistent with those obtained using MRI (Table 1). Greater variance in strain measurements was observed with ultrasound imaging than with MRI. However, the mean values were comparable between the two modalities, and the regional contractile dysfunction resulting from myocardial infarction in the murine heart was clearly evident in the ultrasound strain analysis.
Fig. 8.
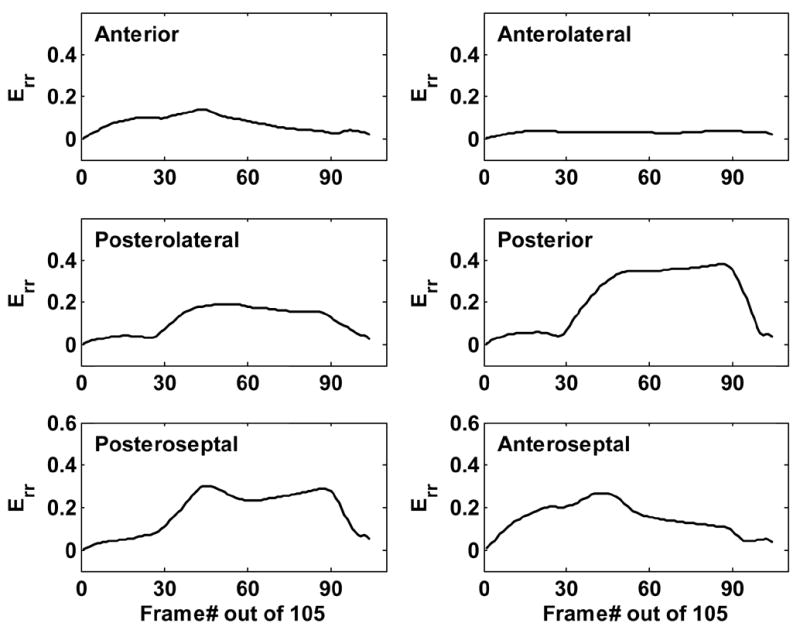
Time evolution of Err throughout a cardiac cycle in six myocardial sectors from a D1 post-MI mouse heart assessed using ultrasound. The magnitude of Err remains relatively unaffected in the posterior and posteroseptal walls, while the infarct region and its border zones exhibit a remarkable decrease in Err.
TABLE 1.
Peak Err by sector analysis in a D1 post-MI mouse heart as measured by Ultrasound and MRI
| Anterior | Anterolateral | Posterolateral | Posterior | Posteroseptal | Anteroseptal | |
|---|---|---|---|---|---|---|
| US | 0.15 | 0.04 | 0.17 | 0.40 | 0.38 | 0.32 |
| MRI | 0.12 | 0.04 | 0.20 | 0.34 | 0.32 | 0.27 |
US = ultrasound.
Finally, the trajectories of the 2D pixel blocks from the ultrasound image sequences were tracked over a complete cardiac cycle. The resulting trajectories were superimposed onto the original B-mode images to reveal the relationship between anatomy and regional function (Fig. 9). The maximum cumulative tracking error d/l (d and l as defined in the ‘Materials and Methods’ section) was 12% and the mean error was less than 5%.
Fig. 9.
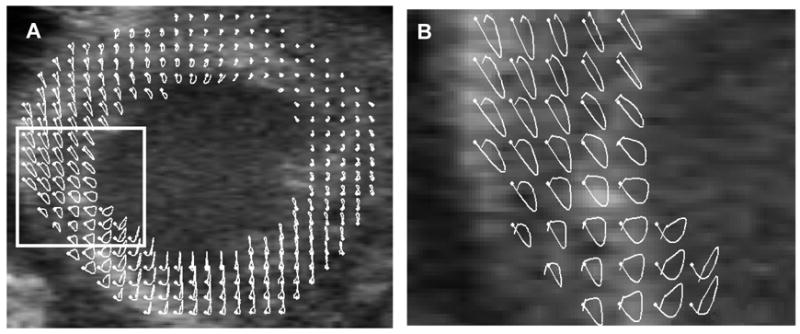
Trajectories of 2D pixel blocks through a complete cardiac cycle. Panel A shows a mid-ventricular, short-axis image of an infarcted mouse heart with superimposed trajectories in white. Panel B shows a magnified view of the region bounded by the rectangle in A. The white dots denote the starting position of the tracked tissue elements at ED.
Maximum systolic velocity (Vmax) and maximum systolic strain rate (SRmax) of myocardial tissue were measured in the mid-ventricular short-axis view from healthy mice, and from the infarcted and non-infarcted regions in post-MI mice. A Vmax of approximately 28.4 ± 5 mm/s was measured throughout healthy mouse hearts, 25.6 ± 5 mm/s was measured in the non-infarcted regions of post-MI mouse hearts, and 0–4 mm/s was measured in the infarcted regions. SRmax was approximately 24 ± 6 s−1 in healthy mouse hearts, 21 ± 7 s−1 in non-infarcted regions of the post-MI mouse hearts, and lower (0–5 s−1) in infarcted regions. These results are in a good agreement with previous measurements made using the tissue Doppler method (D'hooge 2004). In this study, the Vmax was 31±6 mm/s, and the SRmax was 27±7 s−1 for normal, wild-type mice in the posterior wall, where the motion is parallel to the ultrasound beam.
DISCUSSION
Automated displacement tracking in the LV facilitates the assessment of several important features of cardiac function, such as myocardial strain, local tissue velocity and regional strain rate. We have demonstrated the feasibility of a new approach to the quantification of regional myocardial displacement using 2D speckle tracking in high resolution B-Mode ultrasound images. This technique has advantages over tissue Doppler since it does not require a specialized imaging mode and is equally accurate throughout the imaged area of myocardium. Our initial implementation of the 2D speckle tracking method does not rely on RF data, which provides versatility since it can be applied on most B-Mode image sequences. However, the B-Mode data also possesses high SNR due in part to filtering and proprietary nonlinear processing algorithms, which are applied to the data prior to display. In the future, we plan to refine this method by directly accessing the high resolution RF data. We also plan to replace manual segmentation of the endocardial and epicardial boundaries using automated image processing-based techniques (Yu 2001).
Our initial results using ultrasound imaging demonstrate promising correlations with measurements obtained from cardiac MRI: R = 0.90 for the radial strain component and R = 0.85 for the circumferential strain component. Therefore, the proposed ultrasound-based approach may prove to be a viable alternative to MRI for the detection of abnormalities in strain and strain rate (either systolic or diastolic) in murine models of myocardial infarction and LV remodeling. In addition, the ultrasound-based approach has the merits of being quick and inexpensive, which improves its capability to support serial studies on large numbers of study groups in parallel. Moreover, it can provide displacement measurements of the LV at a multitude of cardiac phases, which enables it to detect subtle dynamic changes in strain rate that take place in the LV after MI.
Signal dropout and reverberations caused by the ribs (typical problems confronting transthoracic cardiac ultrasound imaging) impact the effectiveness of the tracking algorithm. Since the block matching algorithm searches for the proper offset by comparing the sum of absolute differences of pixel values of corresponding blocks in subsequent frames, it is subject to low SNR in areas with significant signal dropout. Similarly, at locations where rib reverberation causes high image intensity, tracking performance is adversely affected. One possible approach to avoiding rib reverberation is to scan the mouse heart through various acoustic windows and concatenate the images of different segments to compile images that completely encompass the heart. Alternatively, one might overcome the rib reverberation by using a model-based approach. For example, the facts that the endocardium and epicardium are approximately coaxial and circular in shape can be utilized and a regularization term can be used to constrain effects caused by signal dropout or other artifacts. Accumulated drift introduced by respiratory motion can also lead to motion tracking bias. However, this problem is addressed by the EKV option on the Vevo770, which automatically excludes those cardiac cycles affected by respiratory motion from the final, retrospectively-assembled image sequence.
In this study, we used a speckle tracking algorithm to determine regional Ecc and Err in selected 2D short-axis images of the mouse heart. This 2D analysis of mid-ventricular, short-axis image sets proved adequate to validate the experimental approach using cardiac MRI. However, more complete models of myocardial displacement and strain can be derived by performing this same analysis on contiguous, 1 mm-thick, short-axis images spanning the heart from apex to base.
In conclusion, this study presents a method to assess regional myocardial function in the mouse heart using high resolution ultrasound imaging followed by 2D image processing. Myocardial strains (both Ecc and Err) obtained by this method exhibited good correlation with respect to assessments made by MRI in both healthy mice and post-MI mice. Other metrics of regional cardiac function, such as regional strain-time curves, maximum systolic velocities, and maximum systolic strain rates, were also derived from the displacement analyses. This method tracks myocardial displacement on ultrasound B-mode image sequences, and thus possesses the potential to be applied to existing grayscale image sequences. In addition, the approach is compatible with mechanically scanned ultrasound systems, whereas color Doppler processing is often incompatible with mechanically scanned systems. By using SIMD commands to accelerate the MSAD algorithm, this approach provides the potential for near real-time processing in ultrasound systems. The method proposed in this paper provides a highly efficient and accurate approach to analyze myocardial strain and strain rate in small animals, and can be readily extended to human cardiac examination.
Acknowledgments
The purchase of VisualSonics Vevo770 was funded with NIH NCRR grant RR022582. This work was supported in part by NIH NIBIB grant EB001826 to JAH and NIH grant HL058582 to BAF. Ankit Tejani and R. Jack Roy assisted with data collection.
Footnotes
Publisher's Disclaimer: This is a PDF file of an unedited manuscript that has been accepted for publication. As a service to our customers we are providing this early version of the manuscript. The manuscript will undergo copyediting, typesetting, and review of the resulting proof before it is published in its final citable form. Please note that during the production process errors may be discovered which could affect the content, and all legal disclaimers that apply to the journal pertain.
References
- Aboagye EO. Positron emission tomography imaging of small animals in anticancer drug development. Mol Imaging Biol. 2005;7(1):53–8. doi: 10.1007/s11307-005-0886-2. [DOI] [PubMed] [Google Scholar]
- Acton PD, Kung HF. Small animal imaging with high resolution single photon emission tomography. Nucl Med Biol. 2003;30(8):889–95. doi: 10.1016/s0969-8051(03)00112-4. [DOI] [PubMed] [Google Scholar]
- Amundsen B, Helle-Valle T, Edvardsen T, et al. Noninvasive myocardial strain measurement by speckle tracking echocardiography: validation against sonomicrometry and tagged magnetic resonance imaging. J Am Coll Cardiol. 2006;47:789–93. doi: 10.1016/j.jacc.2005.10.040. [DOI] [PubMed] [Google Scholar]
- Anderson T, Denvir M, Sharif I, et al. High frequency linear array scanner for the imaging of small rodents. IEEE Ultrasonics Symposium. 2003;2:1935– 1937. [Google Scholar]
- Arai A, Gaither Cr, Epstein F, Balaban R, Wolff S. Myocardial velocity gradient imaging by phase contrast MRI with application to regional function in myocardial ischemia. Magn Reson Med. 1999;49(2):98–109. doi: 10.1002/(sici)1522-2594(199907)42:1<98::aid-mrm14>3.0.co;2-h. [DOI] [PubMed] [Google Scholar]
- Aristizabal O, Turnbull DH, Ketterling JA. Mouse embryo imaging with a 40-MHz annular array. IEEE Ultrasonics Symposium. 2005:361–364. [Google Scholar]
- Bax JJ, Ansalone G, Breithardt OA, et al. Echocardiographic evaluation of cardiac resynchronization therapy: ready for routine clinical use?: A critical appraisal. J Am Coll Cardiol. 2004;44(1):1–9. doi: 10.1016/j.jacc.2004.02.055. [DOI] [PubMed] [Google Scholar]
- Bland JM, Altman DG. Statistical methods for assessing agreement between two methods of clinical measurement. Lancet. 1986;1(8476):307–10. [PubMed] [Google Scholar]
- Breithardt O, Stellbrink C, Kramer A, et al. Echocardiographic quantification of left ventricular asynchrony predicts an acute hemodynamic benefit of cardiac resynchronization therapy. J Am Coll Cardiol. 2002;40(3):536–45. doi: 10.1016/s0735-1097(02)01987-3. [DOI] [PubMed] [Google Scholar]
- Cerqueira MD, Weissman NJ, Dilsizian V, et al. Standardized myocardial segmentation and nomenclature for tomographic imaging of the heart: a statement for healthcare professionals from the Cardiac Imaging Committee of the Council on Clinical Cardiology of the American Heart Association. Circulation. 2002;105:539–542. doi: 10.1161/hc0402.102975. [DOI] [PubMed] [Google Scholar]
- Cherin E, Williams R, Needles A, et al. Ultrahigh frame rate retrospective ultrasound microimaging and blood flow visualization in mice in vivo. Ultrasound Med Biol. 2006;32(5):683–91. doi: 10.1016/j.ultrasmedbio.2005.12.015. [DOI] [PubMed] [Google Scholar]
- D'hooge J, Heimdal A, Jamal F, Sutherland G. Regional strain and strain rate measurements by cardiac ultrasound: Principles, implementation and limitations. Eur J Echocardiog. 2000;1(3):154–170. doi: 10.1053/euje.2000.0031. [DOI] [PubMed] [Google Scholar]
- D'hooge J, Thijs D, Sipido K, et al. Ultrasonic strain and strain rate imaging for the assessment of regional myocardial function in mice. IEEE Ultrasonics Symposium. 2004:470–473. [Google Scholar]
- Dawson D, Lygate CA, Saunders J, et al. Quantitative 3-dimensional echocardiography for accurate and rapid cardiac phenotype characterization in mice. Circulation. 2004;110(12):1632–7. doi: 10.1161/01.CIR.0000142049.14227.AD. [DOI] [PubMed] [Google Scholar]
- Epstein FH, Yang Z, Gilson WD, et al. MR tagging early after myocardial infarction in mice demonstrates contractile dysfunction in adjacent and remote regions. Magn Reson Med. 2002;48(2):399–403. doi: 10.1002/mrm.10210. [DOI] [PubMed] [Google Scholar]
- Friemel BH, Bohs LN, Trahey GE. Relative performance of two-dimensional speckle-tracking techniques: normalized correlation, non-normalized correlation and sum absolute difference. IEEE Ultrasonics Symposium. 1995;2:1481–1484. [Google Scholar]
- Gilson WD, Yang Z, French BA, Epstein FH. Complementary displacement-encoded MRI for contrast-enhanced infarct detection and quantification of myocardial function in mice. Magn Reson Med. 2004;51:744–752. doi: 10.1002/mrm.20003. [DOI] [PubMed] [Google Scholar]
- Gilson WD, Yang Z, French BA, Epstein FH. Measurement of myocardial mechanics in mice before and after infarction using multislice displacement-encoded MRI with 3D motion encoding. Am J Physiol Heart Circ Physiol. 2005;288:H1491–H1497. doi: 10.1152/ajpheart.00632.2004. [DOI] [PubMed] [Google Scholar]
- Gleason S, Sari-Sarraf H, Paulus M, et al. Reconstruction of multi-energy X-Ray computer tomography images of laboratory mice. IEEE Trans Nucl Sci. 1999;46(4):1081–1086. [Google Scholar]
- Heimdal A, Stoylen A, Torp H, Skjaerpe T. Real-time strain rate imaging of the left ventricle by ultrasound. J Am Soc Echocardiogr. 1998;11(11):1013–1019. doi: 10.1016/s0894-7317(98)70151-8. [DOI] [PubMed] [Google Scholar]
- Kerry SM, Bland JM. Sample size in cluster randomisation. BMJ. 1998;316(7130):549. doi: 10.1136/bmj.316.7130.549. [DOI] [PMC free article] [PubMed] [Google Scholar]
- Killip S, Mahfoud Z, Pearce K. What is an intracluster correlation coefficient? Crucial concepts for primary care researchers. Ann Fam Med. 2004;2(3):204–8. doi: 10.1370/afm.141. [DOI] [PMC free article] [PubMed] [Google Scholar]
- Langeland S, D'hooge J, Wouters PF, et al. Experimental validation of a new ultrasound method for the simultaneous assessment of radial and longitudinal myocardial deformation independent of insonation angle. Circulation. 2005;112(14):2157–62. doi: 10.1161/CIRCULATIONAHA.105.554006. [DOI] [PubMed] [Google Scholar]
- Leitman M, Lysyansky P, Sidenko S, et al. Two-dimensional strain-a novel software for real-time quantitative echocardiographic assessment of myocardial function. J Am Soc Echocardiogr. 2004;17(10):1021–9. doi: 10.1016/j.echo.2004.06.019. [DOI] [PubMed] [Google Scholar]
- Liu JH, Jeng GS, Wu TK, Li PC. ECG triggering and gating for ultrasonic small animal imaging. IEEE Trans Ultrason Ferroelectr Freq Control. 2006;53(9):1590–6. doi: 10.1109/tuffc.2006.1678187. [DOI] [PubMed] [Google Scholar]
- Michael L, Entman M, Hartley C, et al. Myocardial ischemia and reperfusion: a murine model. Am J Physiol Heart Circ Physiol. 1995;269(6):H2147–H2154. doi: 10.1152/ajpheart.1995.269.6.H2147. [DOI] [PubMed] [Google Scholar]
- Moaveni S. Finite element analysis: theory and application with ANSYS. Upper Saddle River, NJ: Prentice Hall; 1999. [Google Scholar]
- Scherrer-Crosbie M, Steudel W, Hunziker R, et al. Three-dimensional echocardiographic assessment of left ventricular wall motion abnormalities in mouse myocardial infarction. Journal of American Society of Echocardiography. 1999;12(10):834–840. doi: 10.1016/s0894-7317(99)70188-4. [DOI] [PubMed] [Google Scholar]
- Sebag IA, Handschumacher MD, Ichinose F, et al. Quantitative assessment of regional myocardial function in mice by tissue Doppler imaging: comparison with hemodynamics and sonomicrometry. Circulation. 2005;111:2611–2616. doi: 10.1161/CIRCULATIONAHA.104.474411. [DOI] [PubMed] [Google Scholar]
- Shah D, Judd R, Kim R. Technology Insight: MRI of the myocardium. Nat Clin Pract Cardiovasc Med. 2005;2(11):597–605. doi: 10.1038/ncpcardio0352. [DOI] [PubMed] [Google Scholar]
- Streif J, Herold V, Szimtenings M, et al. In vivo time-resolved quantitative motion mapping of the murine myocardium with phase contrast MRI. Magn Reson Med. 2003;49(2):315–21. doi: 10.1002/mrm.10342. [DOI] [PubMed] [Google Scholar]
- Sutherland GR, Stewart MJ, Groundstroem KW, et al. Color Doppler myocardial imaging: a new technique for the assessment of myocardial function. J Am Soc Echocardiogr. 1994;7(5):441–458. doi: 10.1016/s0894-7317(14)80001-1. [DOI] [PubMed] [Google Scholar]
- Toyoda T, Baba H, Akasaka T, et al. Assessment of regional myocardial strain by a novel automated tracking system from digital image files. J Am Soc Echocardiogr. 2004;17(12):1234–8. doi: 10.1016/j.echo.2004.07.010. [DOI] [PubMed] [Google Scholar]
- Yang Z, Zingarelli B, Szabo C. The crucial role of endogenous interleukin-10 production in myocardial ischemia-reperfusion injury. Circulation. 2000;101:1019–1026. doi: 10.1161/01.cir.101.9.1019. [DOI] [PubMed] [Google Scholar]
- Yang Z, Zingarelli B, Szabo C. Effect of genetic disruption of poly (ADP-ribose) synthetase on delayed production of inflammatory mediators and delayed necrosis during myocardial ischemia-reperfusion injury. Shock. 2000;13:60–66. doi: 10.1097/00024382-200013010-00011. [DOI] [PubMed] [Google Scholar]
- Yu Y, Acton S. Segmentation of ultrasound imagery using anisotropic diffusion. Proc 35th Asilomar Conf on Signals, Systems and Computers. 2001;2:1151–5. [Google Scholar]
- Zerhouni E, Parish D, Rogers W, Yang A, Shapiro E. Human heart: tagging with MR imaging--a method for noninvasive assessment of myocardial motion. Radiology. 1988;169:59–63. doi: 10.1148/radiology.169.1.3420283. [DOI] [PubMed] [Google Scholar]