

Abstract
The genomes of double-stranded (ds)RNA viruses are never exposed to the cytoplasm but are confined to and replicated from a specialized protein-bound compartment—the viral capsid. We have used cryoelectron microscopy and three-dimensional image reconstruction to study this compartment in the case of L-A, a yeast virus whose capsid consists of 60 asymmetric dimers of Gag protein (76 kD). At 16-Å resolution, we distinguish multiple domains in the elongated Gag subunits, whose nonequivalent packing is reflected in subtly different morphologies of the two protomers. Small holes, 10–15 Å across, perforate the capsid wall, which functions as a molecular sieve, allowing the exit of transcripts and the influx of metabolites, while retaining dsRNA and excluding degradative enzymes. Scanning transmission electron microscope measurements of mass-per-unit length suggest that L-A RNA is an A-form duplex, and that RNA filaments emanating from disrupted virions often consist of two or more closely associated duplexes. Nuclease protection experiments confirm that the genome is entirely sequestered inside full capsids, but it is packed relatively loosely; in L-A, the center-to-center spacing between duplexes is 40–45 Å, compared with 25–30 Å in other double-stranded viruses. The looser packing of L-A RNA allows for maneuverability in the crowded capsid interior, in which the genome (in both replication and transcription) must be translocated sequentially past the polymerase immobilized on the inner capsid wall.
In eukaryotic and prokaryotic cells alike, the medium in which genetic information is stored is double-stranded (ds)1 DNA. From this repository, genes are copied in the same medium (replication) or into different media (transcription and translation). Viruses, more limited but less constrained genetic entities than cells, exhibit greater diversity in their replication cycles. All four alternative media, single-stranded (ss)RNA, ssDNA, dsDNA, and dsRNA, are used by different virus families to encode their genomes (for review see Roizman and Palese, 1996). Whereas dsDNA and ssRNA molecules are abundant cellular components, dsRNA and ssDNA molecules are not. In these circumstances, one might expect viruses of the latter kinds to have developed special strategies for interfacing with the metabolic resources of their host cells.
One such strategy that is widespread if not universal among dsRNA viruses is their use of capsids as specialized cytoplasmic compartments that genomes are confined to, and are replicated and expressed from (Dryden et al., 1993; Cheng et al., 1994). Such capsids are selectively porous protein shells that the genome and replicase reside within, nucleotides infuse into, and nascent strands (positive sense) are extruded from.
The present study addresses the capsid structure and the organization of encapsidated RNA in the L-A virus of yeast, an excellent model system because of its relative simplicity and well-known molecular biology. The L-A genome is a 4.6-kbp, single-segment molecule that encodes a major capsid protein (Gag; 680 residues, 76 kD) and a minor capsid protein. The latter molecule is a fusion of Gag with Pol, the RNA-dependent RNA polymerase (Pol; 868 residues, 100 kD) (Fujimura and Wickner, 1988a ; Icho and Wickner, 1989) that is generated by ribosomal frameshifting (Dinman et al., 1991; Tu et al., 1992). The L-A capsid is a spherical particle, ∼430 Å in diam, composed of 120 copies of Gag (Esteban and Wickner, 1986; Cheng et al., 1994), of which approximately two carry the Pol moiety (Dinman and Wickner, 1992; Ribas, J.C., and R.B. Wickner, unpublished results). Its surface lattice has the unusual property of being composed of 60 asymmetric dimers (Cheng et al., 1994), configured as an otherwise conventional icosahedron of triangulation class T = 1 (Caspar and Klug, 1962). Interestingly, 120-subunit capsids have been detected in several other dsRNA viruses, including bacteriophage φ6 (Mindich and Bamford, 1988), reovirus (Dryden et al., 1993), orbivirus (Burroughs et al., 1995), aquareovirus (Shaw et al., 1996), and rotavirus (Estes, 1996), but thus far, in no other kind of virus.
Motivated by the expanding generality of this unusual capsid stoichiometry and architecture and the prospect of gaining insight into the features that commend it as a compartment for the sequestration and replication of dsRNA, we have pursued further cryoelectron microscopic studies of the L-A capsid, extending the resolution to 16 Å. Using these data, we have also examined the structural organization of the viral genome, both in the encapsidated state and as released from virions. Complementary information was obtained by using dark-field scanning transmission electron microscopy (STEM) (Wall and Hainfeld, 1986; Thomas et al., 1994) to measure the mass per unit length of L-A chromosomes extruding directly from capsids, and after isolation.
Materials and Methods
Virus Particle Preparation
L-A virus was extracted from stationary phase cells of Saccharomyces cerevisiae strain TF229 [MATa His(3,4) Leu2 ski2-2 L-A-HN] grown in 1 liter of rich medium, and purified by CsCl equilibrium gradient centrifugation as described (Fujimura and Wickner, 1988b ), except that 12.5 ml CsCl gradients were run at 157,000 g (44,000 rpm in a Beckman NVT65 rotor; Beckman Instruments, Inc., Fullerton, CA) for 15 h at 4°C. The virus-containing fractions were dialyzed against buffer A (50 mM Tris HCl, 150 mM NaCl, 5 mM EDTA, 1 mM DTT, pH 7.8) for 6 h, and stored at ∼20 mg/ml at 4°C. All samples were used within 7 d of purification, as L-A virions tend to lose their dsRNA upon protracted storage.
Cryoelectron Microscopy
Virions to be examined by cryoelectron microscopy were dialyzed against buffer A for 8–12 h to remove CsCl. They were then diluted in buffer A until (when examined by negative staining) a uniform, dense but not continuous, distribution of particles was observed. 5-μl drops of virus at this concentration (typically, 2–5 mg/ml) were applied to holey carbon films on 400 mesh copper grids, and observed by cryoelectron microscopy, essentially as described (Booy et al., 1991; Booy, 1993). Micrographs were recorded under minimal exposure conditions at nominal magnifications of ×36,000 or ×46,000 (∼8 e−/Å2) on Kodak SO-163 films, using an electron microscope (EM400RT; Philips Technologies, Eindhoven, The Netherlands) equipped with modified Gatan anticontaminator blades and a Gatan 626 cryoholder (Gatan, Warrendale, PA). In some experiments, bacteriophage T4 was mixed with L-A, and the 40.5-Å axial spacing of its tail-sheath (Moody and Makowski, 1981) was used as an internal magnification standard. Micrographs were assessed for resolution and stigmation by optical diffraction of large areas, and their defocus values estimated from the positions of the first zero of the contrast transfer function (CTF). For the micrographs chosen for analysis, the first zero was in the range of (15 Å)−1–(27 Å)−1 (Table I). Underfocus values (Δ) were calculated according to Δ = 1/λk2 , where λ is the wavelength of the 100 keV electrons (0.037 Å), and k is the spatial frequency of the first zero (Lepault and Leonard, 1985).
Table I.
Analysis of L-A Core Images
| Micrographs | Defocus = position of first zero of CTF | Number of empty particles | Number of full particles | Resolution | Range of spacings | Average spacing | ||||||
|---|---|---|---|---|---|---|---|---|---|---|---|---|
| Å | Å | Å | Å | |||||||||
| 7126, 7164, 4538 | 15.5 | 81 | 83 | 16 | 31–43 | 35 | ||||||
| 7264 | 18.5 | 33 | 53 | 19 | 31–46 | 36 | ||||||
| 4561 | 21 | 37 | 32 | 22 | 39–46 | 41 | ||||||
| 7269 | 23 | 46 | 47 | 24 | 38–46 | 39 | ||||||
| 7261 | 27 | 50 | 53 | 29 | 38–47 | 41 |
This table summarizes pertinent data for a set of three-dimensional density maps of L-A virus particles calculated from cryoelectron micrographs recorded at different values of defocus (column 2). The micrographs' serial numbers are given in column 1. In each case, separate maps were calculated for empty and full particles. The numbers of particles used are given in columns 3 and 4. The resolutions attained are listed in column 5. The RNA spacings for the encapsidated genomes were calculated from difference image spectra, as shown in Fig. 5.
The upper and lower limits given for the range of spacings (column 6) represent the points on either side of the peak at which the spectral value falls to 90% of peak maximum.
The average spacing (column 7) is defined as the centroid of the spectrum within this range.
Image Analysis
Micrographs were digitized on a Perkin Elmer 1010MG microdensitometer (Norwalk, CT) at 12-μm intervals (×36,000 negatives) or 16-μm intervals (×46,000 negatives), corresponding to 3.13 or 3.30 Å per pixel, respectively. General image processing operations were carried out using the PIC Software system (Trus et al., 1996), running on Alpha workstations (Digital Equipment Co., Maynard, MA). Particles were extracted and preprocessed using the automated procedure of Conway et al. (1993). Particle orientations were determined by means of the Polar Fourier Transform algorithm, an iterative, model-based procedure (Baker and Cheng, 1996). As a starting model, we used our earlier 26Å resolution three-dimensional (3-D) map of empty L-A particles (Cheng et al., 1994). In all micrographs analyzed, reconstructions of empty and full particles were calculated separately, using Fourier-Bessel techniques (Crowther, 1971; Fuller, 1987; Baker et al., 1988). Complete icosahedral (532) symmetry was imposed on the final density map. The contour level imposed for surface rendering was based on 100% of expected volume, assuming a protein density of 1.3 g/cm3. Resolution of the three-dimensional maps was estimated in terms of a Fourier shell correlation procedure (Saxton and Baumeister, 1982; Conway et al., 1993), and was, in each case, very close to the first zero of the CTF. Data quality was also assessed by eigenvalue spectra (Fuller et al., 1996).
To obtain a distribution of particle orientations that uniformly cover the asymmetric unit (Baker et al., 1989), data from three micrographs were combined. All three micrographs were well stigmated and had first zeros at ∼(15 Å)−1. Three independent reconstructions were first calculated and mutually scaled to the same magnification and density by matching their spherically averaged radial density profiles (Booy et al., 1994). A composite reconstruction including >80 particles (Table I) was then calculated, the orientation and alignment parameters of each particle refined, and a final map calculated. The resolution was 16 Å by the above criterion.
To visualize the internal contents of full particles, we first calculated reconstructions from micrographs recorded at several different defocus values. The contribution of the capsid shell to each such image was obtained by reprojecting the three-dimensional map in the corresponding orientation, after setting the internal densities to background (solvent) level. Finally, the projected capsid shell was subtracted from the raw image (Baker et al., 1990; Booy et al., 1991), thus providing an unobstructed view of the encapsidated dsRNA. As a control, the same procedure was applied to images of empty particles. Diffraction patterns were calculated for all difference images in each data set. These were then added together with equal weighting (combining empty and full particles separately), and azimuthally averaged to obtain the respective one-dimensional powder patterns.
Scanning Transmission Electron Microscopy (STEM)
STEM was performed at the Brookhaven Biotechnology Resource (Upton, NY) (Wall, 1979; Wall and Hainfeld, 1986). Full particles, purified as described above and stored briefly at a concentration of ∼20 mg/ml, were diluted 40-fold in buffer A, and a 5-μl drop was applied to a thin carbon film. The grid was washed 10 times with 100 mM ammonium acetate, pH 6.5, frozen, and then dried (Wall, 1979). To visualize isolated dsRNA, material purified by phenol extraction (Wickner, 1994) at 2.4 mg/ml in diethyl pyrocarbonate–treated water was diluted 100 times with 100 mM ammonium acetate and applied to a polylysine-coated carbon film, washed with 20 mM ammonium acetate, and freeze-dried. Tobacco mosaic virus (TMV) at 50–100 μg/ml was included in all preparations as an internal mass standard. Digital micrographs (512 × 512 pixels) were recorded using sampling steps of 20 or 10 Å/pixel. Mass determinations were carried out as described (Newcomb et al., 1993; Thomas et al., 1994).
RNase III Assay
RNase protection assays were performed with three different samples: dsRNA purified from full viral particles; freshly prepared full particles; and viral particles disrupted by dilution to low ionic strength (25 mM NaCl) and incubated for 45 min at room temperature. RNase III has an exclusive specificity for dsRNA (Crouch, 1974), and under our conditions, is active only in the presence of 10 mM MgCl2. The reaction mixture (25 μl), containing 0.5 μg dsRNA and ∼1 μg of RNase III in 50 mM Tris HCl, pH 7.8, 150 mM NaCl, 1 mM EDTA, 0.1 mM DTT, and 0 or 10 mM of MgCl2, was incubated for 45 min at 37°C. The resulting products were phenol extracted, ethanol precipitated, separated on a 1.5% agarose gel, and then detected by ethidium bromide staining.
Results
Cryoelectron Microscopy of Full and Empty Capsids
Fields of purified L-A particles are shown in Fig. 1, in micrographs recorded at several different defocus values. As expected, the image contrast increases with defocus; however, L-A exhibits no conspicuous surface relief, even at quite high defocus (Fig. 1 d). Empty particles are clearly distinguished from full ones, and almost all capsids appear intact (see below). We observed a small percentage of a distinctive polymorphic variant, the “dimeric” capsid (e.g., Fig. 1 d, large arrowhead), it seems to be a fusion of two capsids, both lacking one icosahedral cap. Whether they arise from pairing of two partially dissociated capsids or are simply aberrant assembly products is not known. Filamentous material, presumably RNA released from virions, is usually visible (e.g., Fig. 1, small arrowheads). Some full particles exhibit “swirl” patterns of curved striations (e.g., Fig. 1 c, large arrowhead), we attribute this to the encapsidated RNA as they were never seen on empty capsids. The spacing between these striations is 35–40 Å. More often, full particles present punctate, nonsymmetric, motifs.
Figure 1.
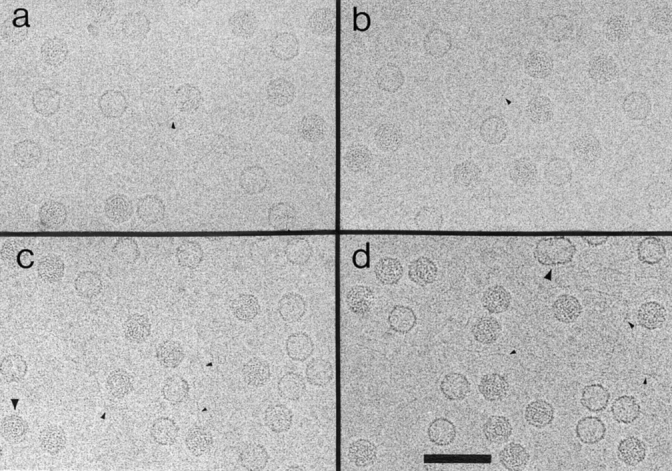
Cryoelectron micrographs of purified L-A virions at different defocus values. (a) ∼0.65 μm; (b) ∼0.9 μm; (c) ∼1.4 μm underfocus. One of the full particles exhibits a ringlike “swirl” pattern (c, large arrowhead). (d) At ∼2 μm underfocus; a “dimeric” capsid is shown (large arrowhead). Filamentous material, presumably RNA, is observed in all four micrographs (small arrowheads). Bar, 1,000 Å.
In this typical experiment, full and empty particles were observed in a ratio of ∼3:2. Since the sample was collected as a compact band about one-third of the way up the CsCl gradient, it originally contained only full particles. We infer that the empty particles were generated either during dialysis (see Materials and Methods) or grid preparation.
Three-dimensional Structures of Full and Empty Capsids at 16 Å Resolution
The presence of both kinds of particles in the same micrographs allowed us to calculate reconstructions that may be compared directly, without concern about extraneous factors such as differences in defocus, ice thickness, radiation damage, etc. The resolution achieved was 16 Å in both cases. The outer diameter and average thickness of the capsid shell were measured from spherically averaged radial density profiles (not shown) of maps whose magnification was carefully calibrated, as 430 and 46 Å, respectively. However, the reconstructions reveal local variations in shell thickness, which is maximally, ∼54 Å (compare with Fig. 2 b).
Figure 2.

Three-dimensional density maps of L-A capsids at 16 Å resolution. (a) Stereo views of the outer (upper panels) and inner (lower panels) surfaces of the full capsid, viewed along a fivefold axis of symmetry. The internal contents were computationally removed to expose the inner surface. (b) Transverse central sections taken from the maps of empty (left) and full (right) capsids, viewed along a twofold axis. Darker shades represent higher densities (corresponding to protein and/or RNA). Black arrowheads, fivefold symmetry axes; black lollipops, threefold axes; and white arrowheads, twofold axes. The two shells are virtually identical. In the full capsid (right), the closest contacts between the inner surface of the protein shell and the underlying RNA appear to take place around the lateral twofolds. The white rings just inside and outside the shell represent interference fringes arising from phase contrast. Since the holes in the capsid wall are too small to admit an A-form duplex (see Discussion), it seems likely that the empty capsids lost their RNA through a hole created by the dislodging of one or a few Gag subunits. With the averaging that takes place in calculating a density map, such a loss would not significantly affect the average density at that lattice site, and thus may be reconciled with the essentially identical structures visualized for full and empty capsids. Bar, 50 Å.
The molecular topography of the capsid is shown in stereo in Fig. 2 a, as viewed along a fivefold axis. The structure shown was calculated from images of full capsids and its internal contents were erased computationally to expose the inner surface (Fig. 2 a). The placement of subunits on this surface lattice is indexed in Fig. 3 b. The penton is constructed of an inner ring of five elongated subunits (A-subunits), surrounded by an outer ring of five similar, partially intercalated, B-subunits. The nonequivalent bonding environments of the A- and B-subunits are reflected in their subtly different morphologies (see below).
Figure 3.
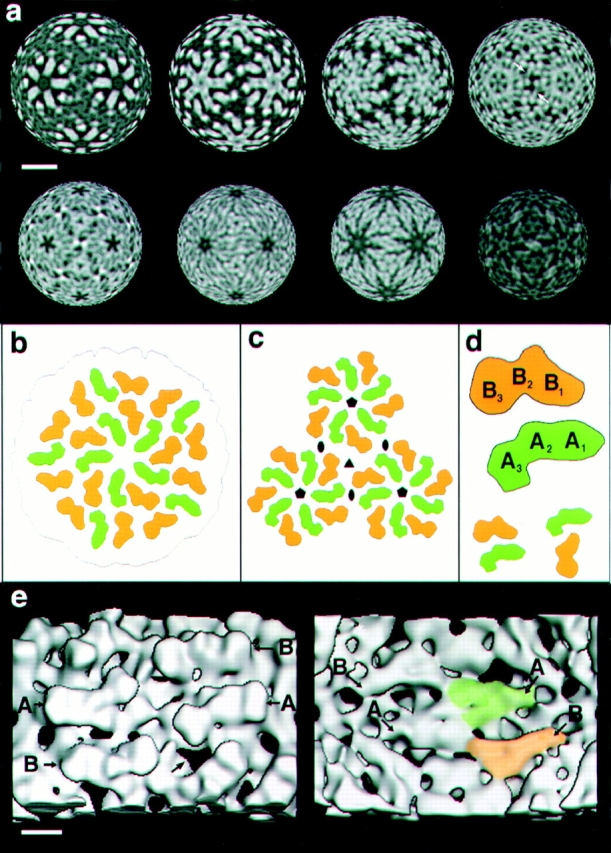
Structural organization of the two nonequivalent Gag monomers in the L-A capsid. (a) Spherical sections through the density map of the L-A capsid, as viewed along a twofold axis. These sections correspond to radii of 214, 207, 201, 194, 188, 181, 175, and 168 Å, respectively (left to right, and top to bottom). Here, white tones correspond to high density, denoting protein and/or RNA (i.e., the contrast has been reversed relative to Fig. 2 b). (b) Schematic diagram showing arrangement of Gag subunits in the L-A surface lattice, as viewed along a fivefold axis (compare with Fig. 2 a). The A-subunits are green, and the B-subunits orange. (c) Diagram showing three pentons (each a Gag decamer) clustered around a threefold axis. Five- and twofold axes are also marked. (d) The outer crests of both subunits may be subdivided into three domains: B1, B2, B3, and A1, A2, A3, respectively. Two possible modes of association of neighboring A- and B-subunits into dimers are shown in the lower part of the panel. The one on the left appears to have more extensive intersubunit contacts and therefore may be favored. (e) Closeup views down a twofold axis from outside (left) and inside (right). A- and B-subunits are marked in both cases (A and B, respectively). On the left panel, the largest of the five kinds of holes that traverse the capsid wall are marked (arrows). On the right panel, the Y-shaped motifs seen on the subunits' undersides are apparent. For one A-subunit, this motif is tinged with green and for a B-subunit, with orange. Bars: (a) 100 Å; (e) 25 Å.
The empty capsid has an essentially identical structure, particularly on the outer surface (data not shown). On the inner surface, the match between full and empty capsids is less perfect, but such differences are slight. Of these, the most prominent are thin arms of density near the twofold axes on the full capsid (Fig. 2 b, right, white arrows) that connect the protein to the underlying genome-associated density. These features imply that there is likely to be close contact between the RNA and the capsid wall at these sites, but (by comparison) not elsewhere.
Unlike the impression given at 26-Å resolution (Cheng et al., 1994), the capsid wall is seen to be quite porous, perforated with many small holes (Figs. 2, a and b, and 3 e). There are five classes of holes: those at the fivefold axes (area = ∼107 Å2); those surrounding the fivefold axes (∼165 Å2); those on the threefold axes (∼118 Å2); relatively large Y-shaped holes surrounding the threefold axes (∼244 Å2); and oblong holes between the A- and B-subunits (∼110 Å2).
In these maps, the capsids' interiors are icosahedrally symmetric; although there is no reason to suppose that the material in these regions actually conforms to this symmetry, which was imposed by the reconstruction procedure. In the empty capsid, internal density is (as expected) at the same level as the solvent outside. In the full capsid map, the internal density gives the impression of three concentric shells 35–40 Å apart (Fig. 2 b, right). We do not interpret this to mean that the viral RNA is strictly confined to three spherical shells. Rather, because the micrographs contain a strong signal at these spacings, arising from the distances between nearest-neighbor RNA filaments, the icosahedral density map calculated from them also contains strong features at the same spacings. The density of these shells diminishes progressively towards the center, which is probably a valid indication that proportionately more RNA resides at higher radii.
Structures and Interactions of the Nonequivalent A- and B-Subunits
The A- and B-subunits are very similar in morphology. On the outer capsid surface, each subunit is shaped like a boomerang and subdivides into three domains, called A1, A2, A3, and B1, B2, B3, respectively (Fig. 3 d). On the inner surface, the two kinds of subunit are less alike, although both present a Y-shaped motif (Fig. 3 e, right). This motif is clearly visible in the spherical sections at inner radii shown in Fig. 3 a (especially bottom row, third from left). In the middle of the capsid wall is a hollow cavity (Fig. 2 b) that separates the inner and outer surface domains. Within a given penton (Gag decamer), neighboring A- and B-subunits can be aligned by a rotation of ∼15° (see Fig. 3 e, left), whence we conclude that they are oriented in parallel. The view from the inside (Fig. 3 e, right) supports this conclusion.
The internal features of the Gag subunits are conveniently viewed in spherical sections through the density map (Fig. 3 a). The protomer should be a Gag dimer. In principle, there are three possible pairings of neighboring A- and B-subunits. The pairing in which subunits interact across the twofold axis (A3 to B3) involves only a small contact surface. Consequently, we favor the two more compact arrangements (Fig. 3 d, bottom), in which there are more extensive interactions to stabilize the dimer.
From the spherical sections (Fig. 3 a), we can discern likely boundaries between subunits, and the pattern of interactions that consolidates the surface lattice. A-subunits cluster around the fivefold axis via A1–A1 interactions. The corresponding region of the B-subunit (B1) makes contacts with A1 and A2, further out from the fivefold axis. Three B3 domains meet around the threefold axis, whereas across the twofold axis, the contacts are head- to-head between A3 and B3. Interactions between twofold and threefold axes take place deep in the lattice, from radii at ∼184 to 197 Å (whereas the protein shell extends from radii 171 to 217 Å) via arclike densities (Fig. 3 a, top, far right).
The thin arms of density linking the capsid with the underlying RNA (see above) are also visualized in the Fig. 3 a (bottom, far right) for the twofold axes, and they extend from A-subunits.
Packing of dsRNA Inside the L-A Capsid
The protein shell, accounting for ∼73% of the virion mass, tends to dominate images of full particles, in which it is coprojected with the RNA. To obtain unimpeded views of encapsidated genomes, we erased the shell contributions from virion images, computationally (Booy et al., 1991). The resulting difference images show punctate motifs and/ or swirls; some examples are shown in Fig. 4. To estimate the interstrand spacings, we measured the positions of diffraction peaks in powder patterns calculated from many such images (Fig. 5). Because phase-contrast imaging accentuates particular spatial frequencies, depending on the defocus, this analysis was performed for micrographs that cover a range of defocus values. All of these patterns exhibited broad peaks extending from ∼(31 Å)−1 to ∼(47 Å)−1. The position of the peak varied slightly with defocus but was invariably between (36 Å)−1 and (40 Å)−1. As a control, the same procedure was applied to empty capsids. The resulting profile (Fig. 5, dashes) has a small peak in this range, this probably reflects noise amplified by the phase-contrast at this defocus value. It is, however, much weaker than the corresponding peak of the full particle powder pattern, confirming that this peak primarily reflects scattering from the RNA.
Figure 4.
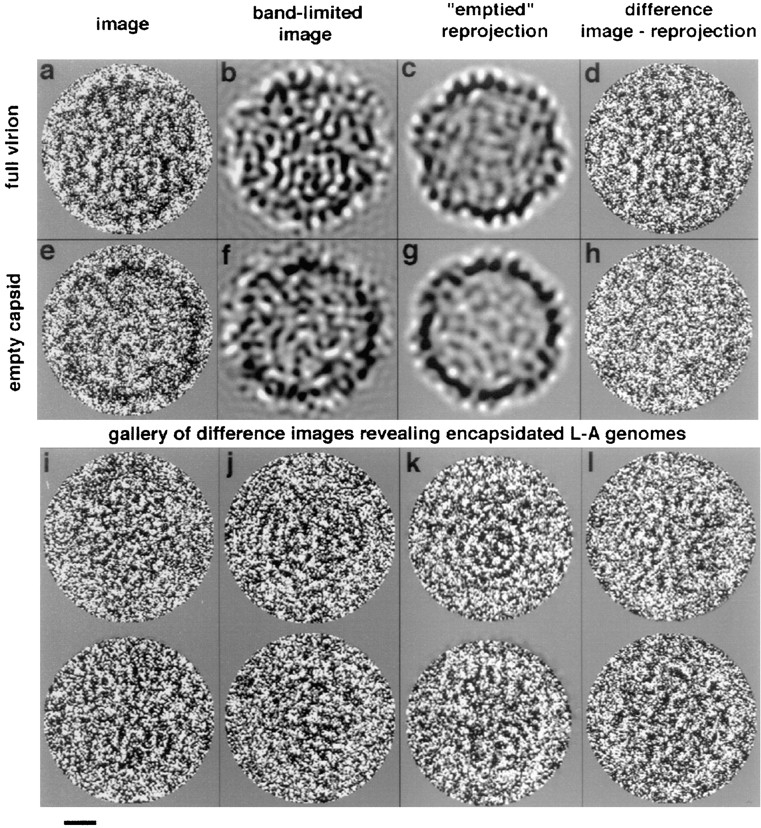
Computer-filtered images of encapsidated L-A genomes. Typical full and empty particles are shown in a and e, respectively. b and f show the same particles after low pass filtering at (28 Å)−1. c and g were obtained by reprojecting the corresponding density maps in the appropriate viewing orientations, and reproduce the micrographs well, particularly in terms of peripheral detail. d and h are “difference images” calculated by subtracting c from a after nullifying the internal density of the “full” map, and g from b, respectively. d reveals the encapsidated genome. The control h simply represents background noise, and confirms that the shell is cleanly removed in this procedure. The two particles shown are from the highest defocus micrograph analyzed (2-μm defocus; first CTF zero at [27 Å]−1). i–l show two more examples each of exposed genomes from four micrographs with different defocus values. Their first CTF zeros at spacings of 15.5, 18.5, 21, and 23 Å, respectively. In each case, the density map used to calculate the shell contribution to the virion image was calculated from the micrograph in question. These images illustrate the variable appearance of encapsidated genomes, and demonstrate that this variability does not arise from differences in defocus. Bar, 100 Å.
Figure 5.

Spectra calculated from powder patterns of genome-revealing difference images of L-A virions. The positions and spread of the peaks in these spectra give statistically representative estimates of the predominant spacings between RNA filaments packed in L-A virus capsids. Because the shape of a spectrum depends on the defocus of the micrographs from which it was calculated, this analysis was repeated for micrographs covering a range of defocus values. In each case, difference images were calculated as shown in Fig. 4, their diffraction patterns calculated and azimuthally averaged, and the powder pattern obtained by summing over many such particles. The various spectra are indexed according to the serial numbers of the micrographs used. The closest-to-focus spectrum is at top, and the furthest-from-focus one is at bottom (Table I). Each spectrum shows a broad peak in the range of (47 Å)−1 to (31 Å)−1 (gray vertical band). Also shown is the control spectrum calculated from empty particles in micrograph #7261. It shows a much weaker peak in the same frequency range indicative of the defocus value at which this micrograph was recorded, and confirms that the strong peak in the full particle spectrum reflects scattering from the viral RNA. For reference, a line is shown at (26 Å)−1, the average interduplex spacing for many other dsDNA and dsRNA viruses.
Resistance of Encapsidated RNA to RNase Digestion
The interstrand spacings measured above are considerably larger than the values obtained for other dsDNA and dsRNA viruses (Lepault et al., 1987; Booy et al., 1991, 1992; Dryden et al., 1993). Accordingly, one might wonder whether their RNA is partly extruded, with a concomitant loosening up of the portion remaining inside the capsid. The presence of empty capsids and free RNA in electron micrographs is consistent with such a hypothesis. To test it, we conducted accessibility experiments with RNase III, a nuclease specific for dsRNA. The genomes of freshly prepared virions proved entirely resistant to the enzyme (Fig. 6); whereas in a positive control, isolated L-A RNA was extensively digested (Fig. 6, lane 3). When virions were preincubated in a low salt buffer, (known to destabilize them) (Esteban and Wickner, 1986), their RNA partially degraded (Fig. 6, lane 8). These results imply that the dsRNA is entirely sequestered inside freshly prepared virions. This conclusion is consistent with earlier STEM mass measurements that yielded masses for full L-A virions consistent with their containing whole genomes (Cheng et al., 1994). RNA is gradually lost on storage, but release from any given particle, once started, appears to proceed quite rapidly. The conclusion that the L-A genome is indeed packed more loosely than in other viruses is supported by calculations of packing density (see Discussion).
Figure 6.

RNase III accessibility for L-A dsRNA. Purified RNA (lanes 1–3), dsRNA in intact full particles (lanes 4–6), and dsRNA from disrupted full particles (lanes 7 and 8) were treated with RNase III as described in Material and Methods, in the absence (lanes 2, 5, and 7) or presence (lanes 3, 6, and 8) of 10 mM MgCl2. Lanes 1 and 4 are controls for purified dsRNA and dsRNA from intact full particles without RNase III treatment, respectively. On the left, molecular weight markers. After RNase treatment, RNA was separated in a 1.5% agarose gel and detected by ethidium bromide staining. The digestion products are diffusely spread out in lane 8, whereas in the other lanes the genome band is either present at the appropriate position or absent, having been digested to small fragments.
STEM Analysis of L-A dsRNA
We used dark-field electron microscopy to measure the mass-per-unit length of L-A chromosomes, both after purification (e.g., Fig. 7 a) and as released from, but still connected to, disrupted capsids (e.g., Fig. 7 b). The data obtained for purified RNA molecules observe a quasi-Gaussian distribution with a mean of 2.8 ± 0.6 kD/nm (standard deviation). For RNA filaments emanating from capsids, the distribution (Fig. 7 b) is broader, displaced to higher values, and is suggestive of multiple components. The lower values (∼30–40% of the data) match those obtained for purified molecules. The other measurements are higher and appear to represent structures in which two or more duplexes associate laterally to form multistranded filaments. We think it unlikely that their higher density reflects coating of the RNA with protein since these preparations contain no protein other than Gag in detectable amounts. When a similar experiment was carried out with particles that had been stored for a few days at 4°C (L-A virions gradually lose their dsRNA upon storage, see above), most of the measurements matched those obtained for purified molecules.
Figure 7.

STEM dark-field images of unstained L-A RNA molecules. (a) Freeze-dried preparation of purified dsRNA, with a few tobacco mosaic virions (the rodlike particles), included as internal mass standards. At right is a histogram of mass-per-unit length measurements made from these micrographs (n = 53). (b) Purified L-A virions, with some free RNA; at right, the histogram of mass-per-unit length data (n = 275). These measurements were restricted to RNA segments visibly connected to capsids. The arrows indicate densities corresponding to integral numbers of strands per filament, assuming 2.8 kD/nm for an A-form RNA duplex (Results). Black arrows mark even numbers of strands, i.e., multiple duplexes. The precision of the measurements is insufficient to resolve the distribution into a set of well-defined peaks. In principle, these densities could be biased to higher values by residual salt deposits, as a consequence of insufficient grid washing. However, in this case, one would expect greater variability in the data, and the standard deviation of the measurements made on TMV particles to be considerably higher. In fact, the SDs were very similar, at 3.81% for the TMV in the experiments with purified RNA molecules, and 4.48% for those on capsid-connected RNA filaments. Bar, 1,000 Å.
Discussion
The replication cycles of all known dsRNA viruses follow the same pattern (Roizman and Palese, 1996). First, dsRNA is transcribed by a polymerase resident within the virion. Next, (+) strand transcripts are extruded to serve as (a) mRNA for the synthesis of viral proteins, (b) the species that becomes encapsidated in progeny virions, and (c) used as the template for synthesis of complementary (−) strands in replication. Both transcription and replication take place inside the nucleocapsid, which is the complete virion for fungal dsRNA viruses or an inner core for higher eukaryotic viruses like those of the Reoviridae family (e.g., reovirus [Harvey et al., 1981; Dryden et al., 1993]; rotavirus [Mansell and Patton, 1990; Labbé et al., 1991]; and orbivirus [Huismans et al., 1987]). This model also applies to the prokaryotic dsRNA virus, bacteriophage φ6 (Mindich and Bamford, 1988). What features do these various transcription-cum-replication chambers have in common?
120-subunit Capsids
As noted in the Introduction, stoichiometry data indicate that many dsRNA virus capsids contain 120 copies of at least one protein. So far, no other kind of virus capsid has this stoichiometry, which corresponds to the “forbidden” T-number of two (Caspar and Klug, 1962). It is of interest to know whether this commonality extends to more detailed aspects of capsid architecture. Here, fewer data are available, but we note a definite morphological similarity between L-A capsid and the core of Bluetongue virus (Hewat et al., 1992); this virus is also composed of 120 subunits (Burroughs et al., 1995). Aquareovirus cores also show 120 morphological subunits on their surface (Shaw et al., 1996). Although reovirus cores are more complex than the L-A capsid, the presence of Y-shaped domains on their inner surface (Dryden et al., 1993) is a shared feature. Birnaviruses, whose genomes consist of two segments of dsRNA, seem to be an exception since they are single-shelled T=13 particles with no internal core (Böttcher et al., 1997).
Capsid Structure and Control of Assembly
Our current three-dimensional map at 16-Å resolution depicts the 76-kD Gag monomer as an elongated molecule with multiple domains coiled around a central cavity. The structural differences seen between the nonequivalent A- and B-subunits are minor, but their bonding environments are entirely different (Fig. 3 c). As shown by expression studies (Fujimura et al., 1992), Gag can selfassemble into correctly sized capsids. This reaction should be controlled by some switching event that specifies the A and B conformations (Johnson, 1996). This switch may operate at the level of dimer formation, yielding protomers of which 60 equivalent copies would then self-assemble into a conventional T = 1 icosahedron. The plausibility of this model is supported indirectly by observations in other systems (e.g., the human growth hormone receptor [de Vos et al., 1992]), which attest that an asymmetric homodimer can be a stable state of assembly. Alternatively, A-subunits might associate into homo-pentamers, with the switch accompanying the accretion of B-subunits to convert them into decamers capable of forming the capsid pentons. The fact that Gag-Pol appears to nucleate assembly of L-A in vivo (Fujimura and Wickner, 1988b ), and there are only 1–2 copies of this protein per capsid, argues against the pentamer-based model.
Mass-per-unit-length Measurements Suggest that L-A dsRNA Is A-form
Our STEM data on the mass-per-unit length of purified L-A dsRNA yield a mean value of 2.8 kD/nm ( ± 0.6 SD; ± 0.08 SEM). Acknowledging the spread in these data, they suggest an A-type duplex—2.43 kD/nm, assuming 2.81 Å rise per base pair (Arnott et al., 1972) and 682 D/ bp—and are less consistent with a B-form duplex—2.00 kD/nm, from 3.38-Å rise per bp (Lewin, 1990). It has been previously demonstrated by spectroscopy that packaged φ6 dsRNA has an A-form structure (Bamford et al., 1993). However, x-ray diffraction studies of crystallized reovirus dsRNA (for review see Nibert et al., 1996) were indicative of a double helix with 10 or 11 bp per turn and a 3-Å pitch, this corresponds to a structure intermediate between A-form (2.81-Å rise per bp) and B-form (3.38-Å rise per bp).
The L-A Capsid as a Molecular Sieve
One striking feature revealed by our capsid model is its porosity; the capsid wall is perforated by many small holes. While their sizes may be revised somewhat when higher resolution data become available, current estimates suggest a strategically useful property. None of these holes is large enough to pass an A-form duplex (∼23-Å diam), but the largest holes (triangular, average distance from apex to base ∼15 Å; Fig. 3 e) should readily allow passage of an ssRNA molecule. Thus the capsid appears to be configured to function as a molecular sieve: duplex RNA is retained inside, but transcripts may exit. It would be expedient for freshly synthesized transcript to be fed directly into an exit port (Fig. 8), as this would forestall formation of secondary structure that might impede export. Since there are only one to two copies of Pol per capsid, presumably no more than two transcripts per capsid are being exported at any one time. However, the other holes should facilitate the infusion of nucleotides, of which a steady supply is required to sustain synthesis during transcription or replication. A further filtering property is that the holes are presumably small enough to exclude potentially degradative enzymes.
Figure 8.
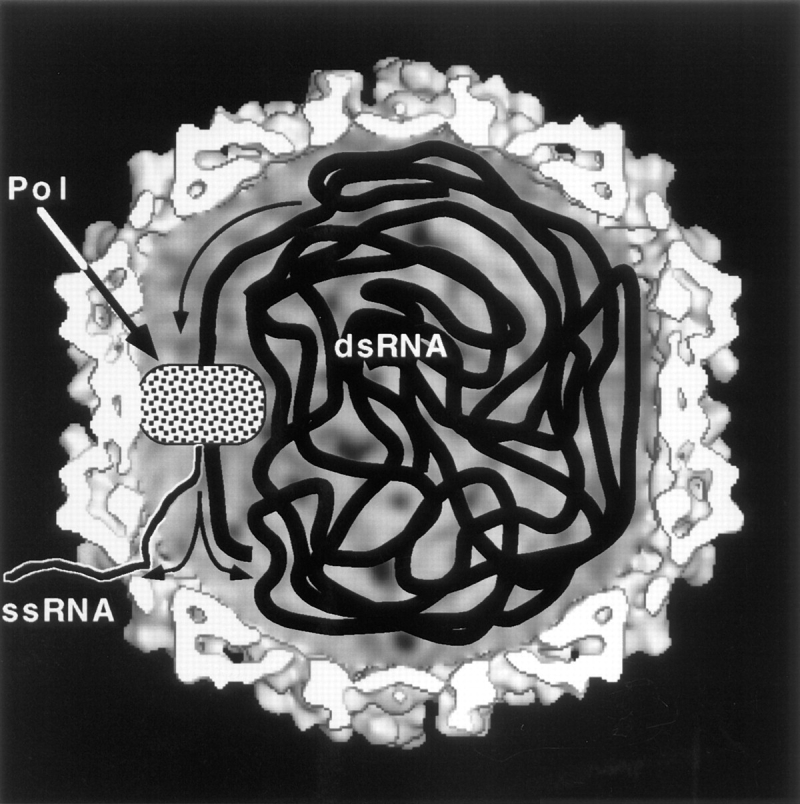
Hypothetical model of a transcriptionally active L-A virion. The polymerase (Pol) is covalently attached to a Gag subunit, which we assume to be integrated into the icosahedral surface lattice, thus immobilizing Pol (Icho and Wickner, 1989). Pol (and the COOH terminus of Gag) are assumed to reside on the inner surface of the shell, to facilitate access to the substrate dsRNA. The shape assigned to Pol in this diagram is arbitrary. In this scenario, it is necessary for the genome to be propelled sequentially past Pol as transcription proceeds. Transcripts are hypothesized to be extruded directly through the largest holes in the capsid shell (Discussion).
Unusually Low Density of dsRNA Packing in L-A
In projection, encapsidated L-A genomes exhibit punctate and/or swirl motifs (Fig. 4.). Presumably, these two classes of motifs represent distinct views, although it is not clear that the genome is packed in the same way in each particle. We infer that the genomes are loosely coiled, with variable spacing between adjacent filaments. The diffraction peaks (Fig. 5) have average Bragg spacings of 36–40 Å, corresponding to a center-to-center spacing of 41–46 Å between filaments. The L-A motifs differ from those of dsDNA viruses such as phages T4 and λ (Lepault et al., 1987), T7 (Booy et al., 1992) and herpes simplex virus (Booy et al., 1991), and other dsRNA viruses such as reovirus (Dryden et al., 1993); these are relatively highly ordered and tightly packed, with center-to-center spacings of 25–30 Å. In part, the larger spacing in L-A reflects the fact that A-form duplexes are wider than B-form duplexes. However, the average interduplex spacing may be calculated independently from the volume available (average internal capsid diam = 348 Å) and genome length (1.287 μm, given 4.579 kbp, and 2.81 Å axial rise per bp). Assuming quasi-hexagonal close packing to a uniform density, a spacing of ∼40 Å is obtained. There is some flexibility in this figure, arising from the center being less populated with RNA, the packing not being perfectly crystalline, and possibly also from some local compaction into multistranded filaments (see below). Nevertheless, this figure is in good agreement with the spacings measured directly from the powder patterns (Fig. 5). Its consistency supports our inferences that (a) the dsRNA genome is fully internalized, and (b) its packing is much looser than in other double-stranded viruses.
RNA extending from capsids often has a uniform mass-per-unit length that is significantly higher than for a single A-form duplex (Fig. 7), and appears to represent some sort of higher order filament formed by two or more duplexes. We have not observed these thicker filaments in preparations of isolated dsRNA, and see no obvious way in which they might arise as an artifact of specimen preparation. It may be that within the confines of the capsid, i.e., under conditions of high packing density, some piecewise condensation of duplexes into higher order filaments takes place. On isolation, i.e., at much lower density, the RNA gradually relaxes to single duplexes.
Headful Replication and the Churning Model of Transcription
L-A is also a helper virus for other dsRNA segments in Saccharomyces cerevisiae (Wickner, 1996a ). These satellite viruses (M1, M2, etc.) and deletion mutants of L-A itself (such as X) contain more dsRNA segments than L-A, but approximately the same number of base pairs per particle. This occurs by “headful replication,” whereby one viral (+) strand is packaged, and replicates inside the particle until it is full. Subsequently synthesized (+) strands are extruded from the particle (Esteban and Wickner, 1986; Fujimura et al., 1990). As noted above, much more room remains available in the packaged L-A capsid than in other double-stranded viruses. We can think of two explanations. In one, the Gag gene has evolved recently to provide a more capacious capsid, but the genome as a whole has not yet evolved to fully exploit this opportunity for expansion. The fact that the multisegmented satellites do not package RNA more densely than L-A appears to argue against this hypothesis.
In the second explanation, we speculate that the maximum viable packing density may be dictated by a requirement for long range mobility of the dsRNA in this transcriptionally active particle. The polymerase is thought to reside on the inner surface, anchored by integration of its Gag moiety into the surface lattice (Wickner, 1996a ,b). In transcription (Fig. 8), large tracts of dsRNA must be propelled sequentially past this fixed point. In so doing, the organization of the entire packaged genome must undergo constant revision, or “churning” motion. (In contrast, the tightly compressed genomes of dsDNA phages are thought to be in a static vegetative state.) RNA polymerases are known to be powerful translocases, capable of generating forces in the range of 14 piconewtons (Yin et al., 1995). The ability of L-A Pol to function in replication and transcription depends on its being capable of overcoming the frictional drag imposed by the packaged genome. We infer that this resistance increases with higher packing density, whence the observed packing density may represent the highest level of frictional resistance against which the enzyme can function effectively. This idea is testable by generating insertions in the L-A genome.
Is a similar mechanism operative in other dsRNA viruses? The consideration that dsRNA appears to be packed more densely in the cores of both reovirus (Dryden et al., 1993) and rotavirus (Prasad et al., 1996) than in L-A might suggest otherwise. However, these systems, in which transcriptionally active particles have been visualized (Yeager, M., S.G. Weiner, and K.M. Coombs. 1996. Biophys. J. 70:116a.; Lawton et al., 1997), are considerably more complex; more proteins and many more RNA segments are involved, and precisely calibrated spacings for their packaged genomes have yet to be reported. Transcription of reovirions is thought to require “activation” by proteases, and concomitant conformational changes (Powell et al., 1984; Dryden et al., 1993), which, we conjecture, may rearrange the core structure, so as to facilitate motion of the dsRNA during transcription. Nevertheless, the same overall requirements apply. It will be fascinating to learn more about possible solutions to this problem, and the properties of protein shells that are not only closed containers but also active metabolic compartments.
Acknowledgments
We thank M. Simon (Brookhaven, Upton, NY) for help with STEM, T.S. Baker (Purdue University, West Lafayette, IN) for reconstruction software, Dr. R.J. Crouch (National Institute of Child Health and Human Development) for a gift of RNase III, and D. Belnap, M.E. Cerritelli, J.F. Conway, A. Zlotnick (National Institute of Arthritis, Musculoskeletal, and Skin Diseases), and D.B. Furlong (Harvard, Cambridge, MA) for stimulating discussions and other helpful input.
Abbreviations used in this paper
- CTF
contrast transfer function
- ds
double-stranded
- ss
single-stranded
- STEM
scanning transmission electron microscopy
- TMV
tobacco mosaic virus
Footnotes
Please address all correspondence to A.C. Steven, Building 6, Room B2-34, 6 Center Drive MSC 2717, National Institutes of Health, Bethesda MD 20892-2717. Tel.: (301) 496-0132. Fax: (301) 480-7629. e-mail: Alasdair_ Steven@NIH.GOV
J.R. Castón's present address is Centro Nacional de Biotecnologia, Consejo Superior de Investigaciones Cientificas, Universidad Autonoma de Madrid, 28049 Madrid, Spain.
References
- Arnott S, Hukins DW, Dover SD. Optimised parameters for RNA double-helices. Biochem Biophys Res Commun. 1972;48:1392–1399. doi: 10.1016/0006-291x(72)90867-4. [DOI] [PubMed] [Google Scholar]
- Baker TS, Cheng RH. A model-based approach for determining orientations of biological macromolecules imaged by cryoelectron microscopy. J Struct Biol. 1996;116:120–130. doi: 10.1006/jsbi.1996.0020. [DOI] [PubMed] [Google Scholar]
- Baker TS, Drak J, Bina M. Reconstruction of the three-dimensional structure of simian virus 40 and visualization of the chromatin core. Proc Natl Acad Sci USA. 1988;85:422–426. doi: 10.1073/pnas.85.2.422. [DOI] [PMC free article] [PubMed] [Google Scholar]
- Baker TS, Drak J, Bina M. The capsid of small papovaviruses contains 72 pentameric capsomers: Direct evidence from cryo-electron-microscopy of simian virus 40. Biophys J. 1989;55:243–253. doi: 10.1016/S0006-3495(89)82799-7. [DOI] [PMC free article] [PubMed] [Google Scholar]
- Baker TS, Newcomb WW, Booy FP, Brown JC, Steven AC. Three-dimensional structures of maturable and abortive capsids of equine herpes virus 1 from cryoelectron microscopy. J Virol. 1990;64:563–573. doi: 10.1128/jvi.64.2.563-573.1990. [DOI] [PMC free article] [PubMed] [Google Scholar]
- Bamford JKH, Bamford DH, Li T, Thomas GJ., Jr Structural studies of the enveloped dsRNA bacteriophage φ6 of Pseudomonas syringaeby Raman spectroscopy. Nucleocapsid structure and thermostability of the virion, nucleocapsid and polymerase complex. J Mol Biol. 1993;230:473–482. doi: 10.1006/jmbi.1993.1164. [DOI] [PubMed] [Google Scholar]
- Booy, F.P. 1993. Cryoelectron microscopy. In Viral Fusion Mechanisms. J. Bentz, editor. CRC Press, Inc., Boca Raton, FL. 21–54.
- Booy FP, Newcomb WW, Trus BL, Brown JC, Baker TS, Steven AC. Liquid-crystalline, phage-like packing of encapsidated DNA in herpes simplex virus. Cell. 1991;64:1007–1015. doi: 10.1016/0092-8674(91)90324-r. [DOI] [PMC free article] [PubMed] [Google Scholar]
- Booy, F.P., B.L. Trus, W.W. Newcomb, J.C. Brown, P. Serwer, and A.C. Steven. 1992. Organization of dsDNA in icosahedral virus capsids. In Proc. 50th Ann. Mtg. Electron Microscopy Society of America, Boston, MA, Vol. 1. San Francisco Press, San Francisco. 452–453.
- Booy FP, Trus BL, Newcomb WW, Brown JC, Conway JF, Steven AC. Finding a needle in a haystack: detection of a small protein (the 12-kDa VP26) in a large complex (the 200-MDa capsid of herpes simplex virus) Proc Natl Acad Sci USA. 1994;91:5652–5656. doi: 10.1073/pnas.91.12.5652. [DOI] [PMC free article] [PubMed] [Google Scholar]
- Böttcher B, Kiselev NA, Stel'Mashchuk VY, Perevozchikova NA, Borisov AV, Crowther RA. Three-dimensional structure of infectious bursal disease virus determined by electron cryomicroscopy. J Virol. 1997;71:325–330. doi: 10.1128/jvi.71.1.325-330.1997. [DOI] [PMC free article] [PubMed] [Google Scholar]
- Burroughs JN, Grimes JM, Mertens PPC, Stuart DI. Crystallization and preliminary X-ray analysis of the core particle of Bluetongue virus. Virology. 1995;210:217–220. doi: 10.1006/viro.1995.1335. [DOI] [PubMed] [Google Scholar]
- Caspar DLD, Klug A. Physical principles in the construction of regular viruses. Cold Spring Harbor Symp Quant Biol. 1962;27:1–24. doi: 10.1101/sqb.1962.027.001.005. [DOI] [PubMed] [Google Scholar]
- Cheng RH, Castón JR, Wang G, Gu F, Smith TJ, Baker TS, Bozarth RF, Trus BL, Cheng N, Wickner RB, et al. Fungal virus capsids: cytoplasmic compartments for the replication of double-stranded RNA formed as icosahedral shells of asymmetric Gag dimers. J Mol Biol. 1994;244:255–258. doi: 10.1006/jmbi.1994.1726. [DOI] [PubMed] [Google Scholar]
- Conway JF, Trus BL, Booy FP, Newcomb WW, Brown JC, Steven AC. The effects of radiation damage of the structure of frozen hydrated HSV-1 capsids. J Struct Biol. 1993;111:222–233. doi: 10.1006/jsbi.1993.1052. [DOI] [PubMed] [Google Scholar]
- Crouch RJ. Ribonuclease III does not degrade deoxyribonucleic acid- ribonucleic acid hybrids. J Biol Chem. 1974;249:1314–1316. [PubMed] [Google Scholar]
- Crowther RA. Procedures for three-dimensional reconstruction of spherical viruses by Fourier synthesis from electron micrographs. Philos Trans R Soc Lond Ser B Biol Sci. 1971;261:221–230. doi: 10.1098/rstb.1971.0054. [DOI] [PubMed] [Google Scholar]
- de Vos A.M., Ultsch M., and Kossiakoff A.A. 1992. Human growth hormone and extracellular domain of its receptor: crystal structure of the complex. Science (Wash. DC). 255:306–312. [DOI] [PubMed]
- Dinman JD, Wickner RB. Ribosomal frameshifting efficiency and gag/gag-polratio are critical for yeast M1 double-stranded RNA virus propagation. J Virol. 1992;66:3669–3676. doi: 10.1128/jvi.66.6.3669-3676.1992. [DOI] [PMC free article] [PubMed] [Google Scholar]
- Dinman JD, Icho T, Wickner RB. A -1 ribosomal frameshift in a double-stranded RNA virus of yeast forms a gag-pol fusion protein. Proc Natl Acad Sci USA. 1991;88:174–178. doi: 10.1073/pnas.88.1.174. [DOI] [PMC free article] [PubMed] [Google Scholar]
- Dryden KA, Wang G, Yeager M, Nibert ML, Coombs KM, Furlong DB, Fields BN, Baker TS. Early steps in reovirus infection are associated with dramatic changes in supramolecular structure and protein conformation: analysis of virions and subviral particles by cryoelectron microscopy and image reconstruction. J Cell Biol. 1993;122:1023–1041. doi: 10.1083/jcb.122.5.1023. [DOI] [PMC free article] [PubMed] [Google Scholar]
- Esteban R, Wickner RB. Three different M1 RNA-containing virus like particle types in Saccharomyces cerevisiae: in vitro M1 double-stranded RNA synthesis. Mol Cell Biol. 1986;6:1552–1561. doi: 10.1128/mcb.6.5.1552. [DOI] [PMC free article] [PubMed] [Google Scholar]
- Estes, M.K. 1996. Rotavirus and their replication. In Virology, 3rd ed. B.N. Fields, D.M. Knipe, and P.M. Howley, editors. Lippincott-Raven Publishers, Philadelphia. 1625–1655.
- Fujimura T, Wickner RW. Replicase of L-A viruslike particles of Saccharomyces cerevisiae.In vitro conversion of exogenous L-A and M1 single-stranded RNAs to double-stranded form. J Biol Chem. 1988a;263:454–460. [PubMed] [Google Scholar]
- Fujimura T, Wickner RW. Gene overlap results in a viral protein having an RNA binding domain and a major coat protein domain. Cell. 1988b;55:663–671. doi: 10.1016/0092-8674(88)90225-5. [DOI] [PubMed] [Google Scholar]
- Fujimura T, Esteban R, Esteban LM, Wickner RB. Portable encapsidation signal of the L-A double-stranded RNA virus of Saccharomyces cerevisiae. . Cell. 1990;62:819–828. doi: 10.1016/0092-8674(90)90125-x. [DOI] [PubMed] [Google Scholar]
- Fujimura T, Ribas JC, Makhov AM, Wickner RB. Pol of gag-polfusion protein required for encapsidation of viral RNA of yeast L-A virus. Nature (Lond) 1992;359:746–749. doi: 10.1038/359746a0. [DOI] [PubMed] [Google Scholar]
- Fuller S. The T=4 envelope of Sindbis virus is organized by interactions with a complementary T=3 capsid. Cell. 1987;48:923–934. doi: 10.1016/0092-8674(87)90701-x. [DOI] [PubMed] [Google Scholar]
- Fuller SD, Butcher SJ, Cheng RH, Baker TS. Three-dimensional reconstruction of icosahedral particles—the uncommon line. J Struct Biol. 1996;116:48–55. doi: 10.1006/jsbi.1996.0009. [DOI] [PubMed] [Google Scholar]
- Harvey JD, Bellamy AR, Earnshaw WC, Schutt C. Biophysical studies of reovirus type 3. Virology. 1981;112:240–249. doi: 10.1016/0042-6822(81)90629-2. [DOI] [PubMed] [Google Scholar]
- Hewat EA, Booth TF, Loudon PT, Roy P. Three-dimensional reconstruction of baculovirus expressed Bluetongue Virus core-like particles by cryo-electron microscopy. Virology. 1992;189:10–20. doi: 10.1016/0042-6822(92)90676-g. [DOI] [PubMed] [Google Scholar]
- Huismans H, Van Dijk AA, Els HJ. Uncoating of parental bluetongue virus to core and subcore particles in infected L cells. Virology. 1987;157:180–188. doi: 10.1016/0042-6822(87)90327-8. [DOI] [PubMed] [Google Scholar]
- Icho T, Wickner RB. The double-stranded RNA genome of yeast virus L-A encodes its own putative RNA polymerase by fusing two open reading frames. J Biol Chem. 1989;264:6716–6723. [PubMed] [Google Scholar]
- Johnson JE. Functional implications of protein-protein interactions in icosahedral viruses. Proc Natl Acad Sci USA. 1996;93:27–33. doi: 10.1073/pnas.93.1.27. [DOI] [PMC free article] [PubMed] [Google Scholar]
- Labbé M, Charpilienne A, Crawford SE, Estes M, Cohen J. Expression of rotavirus VP2 produces empty core-like particles. J Virol. 1991;65:2946–2952. doi: 10.1128/jvi.65.6.2946-2952.1991. [DOI] [PMC free article] [PubMed] [Google Scholar]
- Lawton JA, Estes MK, Prasad BVV. Three-dimensional visualization of mRNA release from actively transcribing rotavirus particles. Nat Struct Biol. 1997;4:118–121. doi: 10.1038/nsb0297-118. [DOI] [PubMed] [Google Scholar]
- Lepault J, Leonard K. Three-dimensional structure of unstained, frozen-hydrated extended tails of bacteriophage T4. J Mol Biol. 1985;182:431–441. doi: 10.1016/0022-2836(85)90202-5. [DOI] [PubMed] [Google Scholar]
- Lepault J, Dubochet J, Baschong W, Kellenberger E. Organization of double-stranded DNA in bacteriophages: a study by cryo-electron microscopy of vitrified samples. EMBO (Eur Mol Biol Organ) J. 1987;6:1507–1512. doi: 10.1002/j.1460-2075.1987.tb02393.x. [DOI] [PMC free article] [PubMed] [Google Scholar]
- Lewin, B. 1990. Genes IV. Oxford University Press, Oxford. 75 pp.
- Mansell EA, Patton JT. Rotavirus RNA replication: VP2, but not VP6, is necessary for viral replicase activity. J Virol. 1990;64:4988–4996. doi: 10.1128/jvi.64.10.4988-4996.1990. [DOI] [PMC free article] [PubMed] [Google Scholar]
- Mindich, M., and D.H. Bamford. 1988. Lipid-containing bacteriophages. In The Bacteriophages. Vol. 2. R. Calendar, editor. Plenum Publishing Corp., New York. 475–520.
- Moody MF, Makowski L. X-ray diffraction study of tail-tubes from bacteriophage T21. J Mol Biol. 1981;150:217–244. doi: 10.1016/0022-2836(81)90450-2. [DOI] [PubMed] [Google Scholar]
- Newcomb WW, Trus BL, Booy FP, Steven AC, Wall JS, Brown JC. Structure of the herpes simplex virus capsid. Molecular composition of the pentons and the triplexes. J Mol Biol. 1993;232:499–511. doi: 10.1006/jmbi.1993.1406. [DOI] [PubMed] [Google Scholar]
- Nibert, M.L., L.A. Schiff, and B.N. Fields. 1996. Reovirus and their replication. In Virology. 3rd ed. B.N. Fields, D.M. Knipe, and P.M. Howley, editors. Lippincott-Raven Publishers, Philadelphia. 1557–1596.
- Powell KFH, Harvey JD, Bellamy AR. Reovirus RNA transcriptase: evidence for a conformational change during activation of the core particle. J Virol. 1984;137:1–8. doi: 10.1016/0042-6822(84)90002-3. [DOI] [PubMed] [Google Scholar]
- Prasad BVV, Rothnagel R, Zeng C Q-Y, Jakana J, Lawton JA, Chiu W, Estes MK. Visualization of ordered genomic RNA and localization of transcriptional complexes in rotavirus. Nature (Lond) 1996;382:471–473. doi: 10.1038/382471a0. [DOI] [PubMed] [Google Scholar]
- Roizman, B., and P. Palese 1996. Multiplication of viruses: an overview. In Virology, 3rd ed. B.N. Fields, D.M. Knipe, and P.M. Howley, editors. Lippincott-Raven Publishers, Philadelphia. 101–111.
- Saxton WO, Baumeister W. The correlation averaging of a regularly arranged bacterial envelope protein. J Microsc. 1982;127:127–138. doi: 10.1111/j.1365-2818.1982.tb00405.x. [DOI] [PubMed] [Google Scholar]
- Shaw AL, Samal SK, Subramanian K, Prasad BVV. The structure of aquareovirus shows how the different geometries of the two layers of the capsid are reconciled to provide symmetrical interactions and stabilization. Structure (Lond) 1996;4:957–967. doi: 10.1016/s0969-2126(96)00102-5. [DOI] [PubMed] [Google Scholar]
- Thomas D, Schultz P, Steven AC, Wall JS. Mass analysis of biological macromolecular complexes by STEM. Biol Cell. 1994;80:181–192. doi: 10.1111/j.1768-322x.1994.tb00929.x. [DOI] [PubMed] [Google Scholar]
- Trus BL, Kocsis E, Conway JF, Steven AC. Digital image processing of electron micrographs: the PIC system-III. J Struct Biol. 1996;116:61–67. doi: 10.1006/jsbi.1996.0011. [DOI] [PubMed] [Google Scholar]
- Tu C, Tzeng T-H, Bruenn JA. Ribosomal movement impeded at a pseudoknot required for ribosomal frameshifting. Proc Natl Acad Sci USA. 1992;89:8636–8640. doi: 10.1073/pnas.89.18.8636. [DOI] [PMC free article] [PubMed] [Google Scholar]
- Wall, J.S. 1979. Mass measurements with the electron microscope. In Introduction to Analytical Electron Microscopy. J.J. Hren, J.I. Goldstein, and D.C. Joy, editors. Plenum Publishing Corp., New York. 333–342.
- Wall JS, Hainfeld JF. Mass mapping with the scanning electron microscope. Annu Rev Biophys Biophys Chem. 1986;15:355–376. doi: 10.1146/annurev.bb.15.060186.002035. [DOI] [PubMed] [Google Scholar]
- Wickner, R.B. 1994. Yeast double-stranded RNA viruses: genetic, biochemical, and molecular methods. In Methods in Molecular Genetics. Vol 3. K.N. Adolph, editor. Academic Press, Orlando, FL. 141–155.
- Wickner RB. Double-stranded RNA viruses of Saccharomyces cerevisiae. . Microbiol Rev. 1996a;60:250–265. doi: 10.1128/mr.60.1.250-265.1996. [DOI] [PMC free article] [PubMed] [Google Scholar]
- Wickner, R.B. 1996b. Viruses of yeasts, fungi and parasitic microorganisms. In Virology. 3rd ed. B.N. Fields, D.M. Knipe, and P.M. Howley, editors. Lippincott-Raven Publishers, Philadelphia. 557–585.
- Yin H, Wang MD, Svoboda K, Landick R, Block SM, Gelles J. Transcription against an applied force. Science (Wash DC) 1995;270:1653–1657. doi: 10.1126/science.270.5242.1653. [DOI] [PubMed] [Google Scholar]