

Abstract
Substantial enhancement of recombinant tissue plasminogen activator (rt-PA) thrombolysis can be achieved with ultrasound, suggesting its use as an adjunctive treatment in thrombolytic therapy for stroke. A microscopic visualization method was used to measure the lysis of human whole-blood clots treated with human fresh frozen plasma (HFFP), rt-PA, and 120-kHz ultrasound for 30 min at T = 37 ° C. The clot–plasma interface was imaged using an inverted optical microscope and the thrombolytic front analyzed as a function of time. Ultrasound treatment significantly enhanced the mean lytic rate from 0.5 to 3.4 μm/min (a 580% change) compared with rt-PA treatment alone.
I. Introduction
A number of studies have reported substantial enhancement of recombinant tissue plasminogen activator (rt-PA) thrombolysis by ultrasound.1 These results suggest the use of ultrasound as an adjunct treatment in thrombolytic therapy for acute ischemic stroke. Possible mechanisms for this ultrasound enhancement include radiation pressure,2 which may force the rt-PA and plasminogen-rich plasma into the clots, and acoustic streaming,3 which may convect the fibrin degradation products away, allowing more clot surface area to be exposed to the rt-PA. Other possibilities include cavitation,4 heating,5 or biochemical2 effects. Microscopic visualization of ultrasound-enhanced thrombolysis can be a useful method to study the possible mechanisms. This report describes the microscopic imaging of the thrombolysis of human whole-blood clots treated with human fresh frozen plasma (HFFP), rt-PA, and 120-kHz pulsed ultrasound.
II. Experimental methods
A. Clot preparation
Whole human blood was used to make sample clots. Venous blood was obtained by sterile venipuncture from four healthy human volunteers, after local Institutional Review Board approval. Aliquots of 30 to 40 microliters were drawn into 1.7-mm-diameter glass micropipettes (micropipets, Fisher Scientific) through capillary action. The resulting clots were then incubated at 37 ° C for 3 h in a temperature-controlled water bath (model 73, Fisher Scientific). Clots were refrigerated at 5 ° C overnight prior to use to ensure maximal clot retraction.
A schematic of the experimental setup is illustrated in Fig. 1. The custom-made water tank (24 × 17.5 cm) with a microscope grade glass slide (7.5 × 5.0 cm) at the bottom of the tank was used for visualization purpose. The micropipette containing the clots was connected together with luer connectors and silicon tubing to form a U-shaped sample holder with the top ends above the water surface. The micropipette was positioned inside the water tank within the optical window. The water tank temperature was held constant at 37 ± 1 ° C and regulated with thermal insulation and a small heating rod (25 W, Hagen). A 120-kHz transducer (Sonic Concepts, Inc., Woodburn, WA) was calibrated with a PVDF hydrophone (TC4038, Reson) and aligned to produce a 0.35-MPa peak-to-peak pressure amplitude at the location of the sample clot. The − 6-dB beam width of the transducer was 1.0 cm and the focal length was 3.2 cm. A duty cycle (DC) of 80% with a pulse repetition frequency (PRF) of 1667 Hz was used for all ultrasound exposures. The transducer was tilted approximately 30° with respect to the bottom of the tank. A 13 × 13-cm sound absorber (rho-c rubber) was placed inside the water tank along the wall opposite the transducer to prevent standing wave formation. The entire apparatus was placed on top of a vibration isolation table (Newport, XL-G) in order to prevent mechanical interference.
Fig. 1.
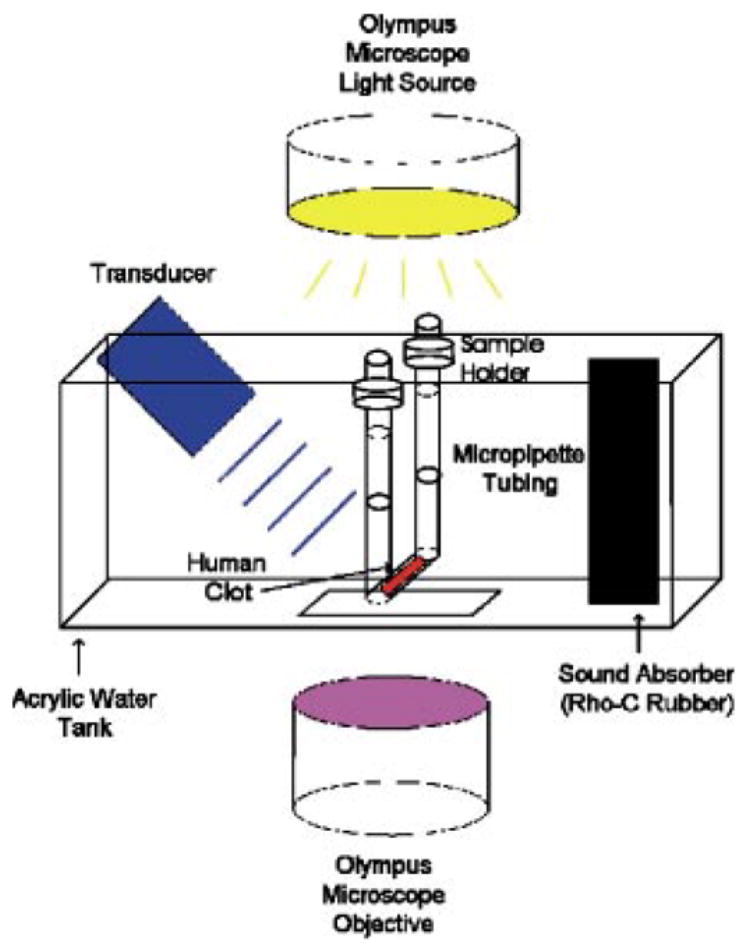
Schematic of the experimental setup. The transducer is tilted approximately 30° with respect to the bottom of the water tank.
The acoustic pressure attenuation of the 300-μm-thick micropipette tubing was measured with a 0.5-mm-diameter PVDF needle hydrophone (Precision Acoustics, model 889, Dorchester, UK) and was found to be < 1%. Also, the ultrasound exposure caused < 0.4 ° C temperature rise in the HFFP, as assessed with a type-K thermocouple (Omega). The clot–plasma interface was imaged using an inverting optical microscope (Olympus, IM). The images from the microscope were recorded with a CCD video camera (Hitachi, KP-M1A), and a frame grabber (Data Translation, DT3120) was used to transfer the images to a computer (Dell). The videos were recorded over 30 min with a frame rate of 6 frames per min. The image resolution was 0.5 μm and the full image had dimensions of 320 × 240 μm (width × height).
Clots were exposed to HFFP (control), HFFP and 120-kHz pulsed ultrasound (80% DC) (ultrasound-control), HFFP and rt-PA ([rt-PA]= 3.15 μg/ml) (sham), or HFFP, rt-PA, and 120-KHz pulsed ultrasound (80% DC) (ultrasound-treated) for 30 min at T= 37 ° C. The rt-PA concentration was chosen to lie within the therapeutic concentration range for humans.6,7 Approximately 1 ml of HFFP (for control and ultrasound control) or HFFP + rt-PA (for sham and ultrasound treated) was slowly injected into the U-shaped sample holder with a syringe. At t= 0, the solution is in full contact with the clot interface. The syringe was removed after the injection, leaving the ends of the sample holder exposed to atmospheric pressure. Thus, the clot surface was exposed to a static fluid column. Clots from four individual trials were averaged to yield the control and ultrasound-control data. Clots from eight individual trials were averaged to yield the sham and ultrasound-treated data.
B. Image analysis
Images of the clots were analyzed to quantify the overall amount of thrombolysis. At the start of each experiment, the average light intensity within a thin region of interest with dimensions 0.5 × 100 μm (width × height) over the clot edge was calculated. This average intensity, denoted Io, was used as a reference to define the clot edge for later times. Those areas of the image with an intensity, I, larger than Io were considered part of the plasma. As time progressed, lysis occurred (starting at the clot–plasma interface), and the amount of light transmitted through the edge of the clot increased over time. The clot–plasma interface was located by determining the positions where I(x,y)= Io orthogonal to the initial clot interface. The (x,y) values determined the position of the new clot–plasma interface. The lysis depth (LD) was determined by calculating the distance of the new clot–plasma interface from the initial interface at t= 0 in a direction normal to the initial clot edge. The lysis rate (LR) was calculated by fitting the LD as a function of time (t) for t ≤ 20 min using a least-square method (MATLAB 6.5 R13). For several runs, clot lysis was completed within the first 20 min. Hence, a lytic rate was calculated for this time window only. Student’s t-test was employed to compare lytic rates for control, ultrasound-control, sham, and ultrasound-treated clots. A p value less than 0.05 was considered a significant difference within the 95%-confidence limit.
III. Results
Videos 1, 2, and 3 exhibit the effects of HFFP (control), rt-PA (sham), and 120-kHz ultrasound and rt-PA (ultrasound-treated) on a human whole-blood clot, respectively. In video 1, there is no evident degradation of the clot or change in the surface morphology with time. This was also the case for the ultrasound-control treated clots (not shown). In contrast, there is visible destruction of the clot surface with rt-PA exposure evident in video 2, and debris from the clot in the HFFP is readily observed at later times. This lytic process is enhanced by the addition of ultrasound, as is qualitatively apparent in video 3. Clearly, at approximately t ~ 20 min into the video, there is almost complete dissolution of the initial clot edge within the field of view.
Video 1
Video of the HFFP (control) treatment of a sample human clot. The image size is 230 × 240 μm (width × height). The frame rate is 6 frames per min. The dark region represents the clot region and the light region represents the fluid medium. The optical resolution is 0.5 μm. There is no evident change in the clot surface morphology with time.
Video 2
Video of the HPPF + rt-PA (sham) treatment of a sample human clot. The image resolution is the same as for video 1.
Video 3
Video of the HPPF + rt-PA + ultrasound (ultrasound-treated) treatment of a sample human clot. The image resolution is the same as for video 1.
Figure 2 shows the mean lysis depth as a function of time for the control, ultrasound-control, sham, and ultrasound-treated groups, as determined by the image analysis method discussed in Sec. II B. No significant lysis was observed for the clots in the control group, and the lytic rate (LR) was 0.0 ± 0.002 μm/min (R2= 0.99), as determined by a least-squares fit to the data for t < 20 min. Similarly, the lysis for the ultrasound-control group was minimal, and the LR was 0.1 ± 0.006 μm/min (R2= 0.98). In contrast, substantial thrombolysis was observed for the sham group with the LR equal to 0.5 ± 0.008 μm/min (R2= 0.986). Finally, the LR for the ultrasound-treated group was 3.4 ± 0.056 μm/min (R2= 0.984). The difference between LR for ultrasound-treated and sham clots was 2.9 ± 0.057 μm/min (p < 0.01). Overall, the correspondence between the qualitative thrombolytic efficacy in the videos and the numerical data as obtained from the image analysis is good and provides credence to the overall model.
Fig. 2.
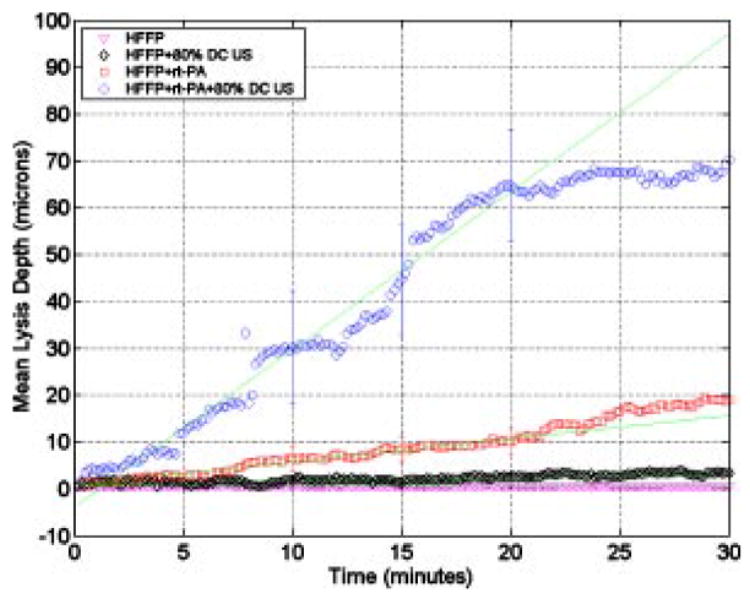
Lysis depth versus time for the control, ultrasound-control, sham, and ultrasound-treated clots. The y axis is the lysis depth (LD) in microns and the x axis time in minutes. The triangles, diamonds, squares, and circles represent data for HFFP (control), HFFP + ultrasound (ultrasound-control), HFFP + rt-PA (sham), and HFFP + rt-PA + ultrasound (ultrasound-treated), respectively. The error bars represent the standard deviation. The solid lines are least-squares fits to the data for t ≤ 20 min.
IV. Discussion
The results presented in this report demonstrated that 120-kHz pulsed ultrasound substantially enhanced the thrombolytic efficacy of rt-PA compared with rt-PA treatment alone in an in vitro human clot model. The LR for the ultrasound-treated group was 580% greater than LR for sham (rt-PA alone).
Although the LR for control and sham treatments suggested linear behavior within the first 30 min, the ultrasound-treated clots showed only a change in LR within the first 20 min of treatment. For t > 20 min, the LR continued at a different rate. This change may be due to lysis completion by that time, as well as a decrease in the activity of rt-PA over time. As observed in video 2, the ultrasound-treated clot was completely lysed after approximately 20 min. Thus, LR for all treatments was calculated for t ≤ 20 min.
The observed ultrasound enhancement is consistent with other studies,8,9 which quantified clot lysis due to ultrasound exposure by measuring clot mass loss in macroscopic clots. In addition, Collet et al. reported the lysis rate for fibrin clots treated with rt-PA alone.10 They found that the lytic rates for “loose’’ and “tight’’ fibrin clots, as measured by microscopically observing the progress of the “lytic front’’ using gold-labeled fibrin, were 3.5 and 0.58 (μm/min) per nmol of rt-PA, respectively. Using their data for the rt-PA concentration of 3.15 μg/ml used in this study, the lytic rates for loose and tight fibrin clots are 157.5 and 26.1 μm/min, respectively. These lytic rates for sham treatment are much faster than our sham lytic rate of 0.5 μm/min. The difference is likely due to our use of whole blood clots, instead of fibrin clots. The whole blood clots are much denser with smaller pores than the fibrin clots due to the presence of cellular elements such as red blood cells and platelets. The morphology of fully retracted whole blood clots has less space for the penetration of rt-PA and HFFP. In support of this explanation, a later work by Collet et al.11 studied the thrombolytic rate of rt-PA on plasma clots. They found that the lytic rate for “platelet-poor’’ and “platelet-rich’’ clots was 1.2 and 2.8 μm/min, respectively, using a rt-PA concentration of 5nM/L.
Francis et al.2 measured the penetration of rt-PA into fibrin clots as a function of 1-MHz ultrasound exposure at 4 W/cm2. The mean penetration depth of rt-PA was 1489 ± 81 μm and 2275 ± 203 μm for sham and 1-MHz treated clots, respectively, for 2 h of treatment time. Assuming linearity with time, the penetration rate for the rt-PA and ultrasound-treated clots was 12.41 and 18.96 μm/min, respectively. The presence of the ultrasound enhanced the penetration rate of the rt-PA by 53%. Significant differences in the clot model (fibrin vs whole blood) and ultrasound parameters no doubt contributed to the difference in enhancement noted quantitatively (53% vs 580%).
In conclusion, to the authors’ knowledge, this is the first report of microscopic imaging of human whole blood clots during ultrasound enhanced thrombolysis. The thrombolytic rate for human whole-blood clots was enhanced by 120-KHz ultrasound during rt-PA thrombolysis compared with rt-PA treatment alone. Further work is needed to determine the mechanisms responsible for this enhancement.
Supplementary Material
Acknowledgments
The authors would like to express their gratitude to Dr. Christopher J. Lindsell for his valuable assistance on statistical discussions. G.J.S. gratefully acknowledges the support of the Whitaker Foundation (Grant RG-0128-01).
Contributor Information
Jason Y. Cheng, Department of Emergency Medicine, University of Cincinnati, 231 Albert Sabin Way, Cincinnati, Ohio 45267-0769 jason.cheng@uc.edu
George J. Shaw, Department of Emergency Medicine and Department of Biomedical Engineering, University of Cincinnati, 231 Albert Sabin Way, Cincinnati, Ohio 45267-0769 shawge@ucmail.uc.edu
Christy K. Holland, Department of Biomedical Engineering, MSB 6167, University of Cincinnati, 231 Albert Sabin Way, Cincinnati, Ohio 45267-0586 christy.holland@uc.edu
References
- 1.Daffertshofer M, Hennerici M. Ultrasound in the treatment of ischaemic stroke. Lancet Neurol. 2003;2:283–290. doi: 10.1016/s1474-4422(03)00380-6. [DOI] [PubMed] [Google Scholar]
- 2.Francis CW, Blinc A, Lee S, Cox C. Ultrasound accelerates transport of recombinant tissue plasminogen activator into clots. Ultrasound Med Biol. 1995;21:419–424. doi: 10.1016/0301-5629(94)00119-x. [DOI] [PubMed] [Google Scholar]
- 3.Wu JH, Siddiqui K, Diamond SL. Transport phenomena and clot dissolving therapy: An experimental investigation of diffusion-controlled and permeation-enhanced fibrinolysis. Thromb Haemostasis. 1994;72:105–112. [PubMed] [Google Scholar]
- 4.Everbach EC, Francis CW. Cavitational mechanisms in ultrasound-accelerated thrombolysis at 1MHz. Ultrasound Med Biol. 2000;26:1153–1160. doi: 10.1016/s0301-5629(00)00250-7. [DOI] [PubMed] [Google Scholar]
- 5.Sakharov DV, Hekkenberg RT, Rijken DC. Acceleration of Fibrinolysis by high-frequency ultrasound: the contribution of acoustic streaming and temperature rise. Thromb Res. 2000;100:333–340. doi: 10.1016/s0049-3848(00)00319-4. [DOI] [PubMed] [Google Scholar]
- 6.Tanswell P, Seifried E, Stang E, Krause J. Pharmacokinetics and hepatic catabolism of tissue-type plasminogen activator. Arzneim-Forsch. 1991;12:1310–1319. [PubMed] [Google Scholar]
- 7.Seifried E, Tanswell P, Ellbruck D, Haerer W, Schmidt A. Pharmacokinetics and haemostatic status during consecutive infusion of recombinant tissue-type plasminogen in patients with acute myocardial infarction. Thromb Haemostasis. 1989;61:497–501. [PubMed] [Google Scholar]
- 8.Behrens S, Daffertshofer M, Spiegel D, Hennerici M. Low-frequency, low-intensity ultrasound accelerates thrombolysis through the skull. Ultrasound Med Biol. 1995;25:269–273. doi: 10.1016/s0301-5629(98)00158-6. [DOI] [PubMed] [Google Scholar]
- 9.Holland CK, Vaidya SS, Coussios CC, Shaw GJ. Thrombolytic effects of 120-kHz and 1-MHz ultrasound and tissue plasminogen activator on porcine whole blood clots. J Acoust Soc Am. 2002;112:2370. [Google Scholar]
- 10.Collet JP, Park D, Letsy C, Soria J, Soria C, Montalescot G, Weisel JW. Influence of fibrin network conformation and fibrin fiber diameter on fibrinolysis speed. Dynamic and structural approaches by confocal microscopy. Arterioscler, Thromb, Vasc Biol. 2000;20:1354–1361. doi: 10.1161/01.atv.20.5.1354. [DOI] [PubMed] [Google Scholar]
- 11.Ph Collet J, Montalescot G, Lesty C, Weisel JW. A structural and dynamic investigation of the facilitating effect of glycoprotein IIb/IIIa inhibitors in dissolving platelet rich clots. Circ Res. 2002;90(4):428. doi: 10.1161/hh0402.105095. [DOI] [PubMed] [Google Scholar]
Associated Data
This section collects any data citations, data availability statements, or supplementary materials included in this article.