

Abstract
Microtubule-associated protein 1B (MAP1B), one of the microtubule-associated proteins (MAPs), is a major component of the neuronal cytoskeleton. It is expressed at high levels in immature neurons during growth of their axons, which indicates that it plays a crucial role in neuronal morphogenesis and neurite extension. To better define the role of MAP1B in vivo, we have used gene targeting to disrupt the murine MAP1B gene. Heterozygotes of our MAP1B disruption exhibit no overt abnormalities in their development and behavior, while homozygotes showed a slightly decreased brain weight and delayed nervous system development. Our data indicate that while MAP1B is not essential for survival, it is essential for normal time course development of the murine nervous system. These conclusions are very different from those of a previous MAP1B gene–targeting study (Edelmann, W., M. Zervas, P. Costello, L. Roback, I. Fischer, A. Hammarback, N. Cowan, P. Davis, B. Wainer, and R. Kucherlapati. 1996. Proc. Natl. Acad. Sci. USA. 93: 1270–1275). In this previous effort, homozygotes died before reaching 8-d embryos, while heterozygotes showed severely abnormal phenotypes in their nervous systems. Because the gene targeting event in these mice produced a gene encoding a 571–amino acid truncated product of MAP1B, it seems likely that the phenotypes seen arise from the truncated MAP1B product acting in a dominant-negative fashion, rather than a loss of MAP1B function.
The neuron is a highly polarized cell from which characteristically long processes, the axons and dendrites, extend. In these processes, the neuronal cytoskeleton acts as a dynamic scaffold composed of longitudinally arranged neurofilaments (NFs)1 and microtubules (MTs). MTs tend to form fascicles in which various kinds of crossbridge structures have been observed (Hirokawa, 1982; Hirokawa et al., 1985).
Microtubule-associated proteins (MAPs), a group of filamentous proteins such as microtubule-associated protein 1B (MAP1B), MAP1A, MAP2, and tau, have been demonstrated to be components of these extensive crossbridge structures associated with MTs (Hirokawa et al., 1985, 1988a,b; Shiomura and Hirokawa, 1987a , b ; Sato-Yoshitake et al., 1989; Hirokawa, 1991). Considerable evidence supports the hypothesis that MAPs play a crucial role in neuronal morphogenesis. In fact, cDNA transfection studies have revealed that tau and MAP2 induce elongation of processes of nonneuronal cells, such as fibroblasts and Sf9 cells, and formation of MT bundles (Kanai et al., 1989, Lewis et al., 1989; Knops et al., 1991, Chen et al., 1992).
MAP1B, a major component of the neuronal cytoskeleton (Bloom et al., 1984, 1985), which is also known as MAP1.2 (Greene et al., 1983), MAP1x (Calvert and Anderton, 1985), and MAP5 (Riederer et al., 1986), forms long crossbridges between MTs (Hirokawa et al., 1985; Sato-Yoshitake et al., 1989). MAP1B is encoded by a single-copy gene (Garner et al., 1990), the product of which is proteolytically processed to a heavy chain and light chain 1 (LC1), which are assembled with LC2 and LC3 to form a complex MT-binding domain (Vallee and Davis, 1983; Hammarback et al., 1991). MAP1B is mainly expressed in neurons, though it exists in other cell types as well (Fischer et al., 1990; Vouyiouklis and Brophy, 1993; Ulloa et al., 1994). MAP1B is expressed at high levels in the immature nervous system, and its level of expression declines in parallel with neuronal differentiation (Bloom et al., 1985; Lewis et al., 1986, Riederer et al., 1986; Safaei and Fischer, 1989; Schoenfeld et al., 1989; Tucker et al., 1989; Garner et al., 1990). In the adult nervous system, MAP1B continues to be expressed in localized brain areas, for example in olfactory nerve axons (Viereck et al., 1989) and retinal photosensitive cells (Tucker and Matus, 1988) where axonal elongation continues. Phosphorylation of MAP1B is also under strong developmental control; that is, the level of mode I phosphorylation catalyzed by proline-directed protein kinases decreases during development, but that of mode II phosphorylation catalyzed by casein kinase II is maintained in the mature nervous system (Avila et al., 1994). Furthermore, several lines of in vitro evidence suggest that MAP1B plays a role in neurite extension. Depletion of casein kinase II, which is thought to catalyze phosphorylation of MAP1B (Díaz-Nido et al., 1988), blocked neuritogenesis of mouse neuroblastoma cells (Ulloa et al., 1993), and attenuation of MAP1B expression by antisense oligonucleotide treatment resulted in inhibition of neurite extension of NGF-treated PC12 cells (Brugg et al., 1993). However, the function of MAP1B in vivo is still largely unknown.
To define the function of MAP1B in vivo, we have disrupted the MAP1B gene by homologous recombination in embryonic stem (ES) cells and used these mutant cells to generate mutant mice with a disrupted MAP1B allele (R21). Mouse lines with mutations in the MAP1B gene have been previously described (Map1b571) (Edelmann et al., 1996), the phenotypes of which are very different from those of R21. Edelmann et al. (1996) reported that Map1b571 embryos homozygous for the mutated MAP1B gene died before reaching 8-d embryos, and Map1b571 heterozygotes showed severely abnormal phenotypes such as motor dysfunction, vast histological abnormalities, lack of visual acuity, and premature mortality. However, in our study, R21 heterozygotes exhibited no overt abnormalities in their development and behavior. The size of the adult R21 homozygous mutant brain was slightly reduced and EM analysis revealed delayed development of the R21 homozygous mutant nervous system, though histological abnormalities reported by Edelmann et al. (1996), such as abnormal morphology of the cerebellar Purkinje cells, were not observed. A long truncated peptide produced by Map1b571 mutants is considered to act in a dominant-negative fashion, resulting in their abnormally severe phenotypes, because the predicted truncated product of the genes as disrupted in the previous study is very long (571 amino acids), and Map1b571 heterozygotes whose level of MAP1B expression remained at about half of the level of controls have more severe neuronal abnormalities than R21 homozygotes. On the other hand, our findings suggest that MAP1B plays an important role in neuronal morphogenesis in cooperation with other neuronal MAPs, representing a MAP1B loss of function effect.
Materials and Methods
Construction of MAP1B Targeting Vector
For disruption of the endogenous MAP1B gene, a replacement-type targeting vector was constructed (Fig. 1 A). A SalI-SalI fragment (13.5 kb) containing the first coding exon of the MAP1B gene was obtained from the 129/Sv mouse genomic library and subcloned into pBluescript II. Part of the genomic sequence of the clone was confirmed to be identical to the sequence of MAP1B cDNA (Noble et al., 1989). The PGK-neo gene was ligated between the XhoI site introduced into the first coding exon by mutagenesis using PCR and a HindIII site downstream of the first coding exon. The PGK-tk gene was ligated into the upstream polylinker site.
Figure 1.

Targeted disruption of the MAP1B gene in ES cells and mice. (A) Targeting strategy: Wild-type allele containing the first coding exon of the MAP1B gene, replacement-type targeting vector, and targeted allele after homologous recombination are shown. P1, primer 1; P2, primer 2; P3, primer 3; B, BamHI; E, EcoRI; H, HindIII. Bar, 1 kb. (B) Genotype of F2 mice of R21 line. Tail DNA was isolated and analyzed by Southern blotting using the 5′-flanking probe (A, probe) after digestion with BamHI. Lane 1, MAP1B−/− mouse; lane 2, MAP1B+/− mouse; lane 3, MAP1B+/+ mouse. WT, wild-type band; HR, homologous recombinant band.
Targeting the MAP1B Gene in ES Cells
Linearized vector-1 was electroporated into cultured J1 cells, and transformants were selected using G418 and FIAU as described elsewhere (Harada et al., 1994). The G418- and FIAU-resistant colonies were expanded into cell lines, and genomic DNA was isolated for Southern blotting. Homologous recombination was detected using BamHI with a “probe,” a genomic region that was not included in the recombination constructs, and then confirmed using EcoRI digestion (Fig. 1 A) for detection of the presence of a mutated MAP1B gene. In addition, neo-probe was used for hybridization, and single bands that migrated to the expected positions were observed in lanes loaded with genomic DNA isolated from homologous recombinants.
Genotyping of Animals
Two separate allele-specific PCRs were performed for each animal. The following primers were synthesized and used for the PCRs: primer 1, 5′-ACACTTCTCTCAGGCTTGAGCAGAGCCG-3′; primer 2, 5′-ACGATCGGATCCCCAGCTCGATGTTG-3′; and primer 3, 5′-GCTAAAGCGCATGCTCCAGACTGCCTTG-3′. The product amplified using primers 1 and 2 was generated from the wild-type allele, whereas the product amplified using primers 1 and 3 was generated from the mutated allele (Fig. 1 A). DNA samples were prepared by incubating tails of animals in PCR buffer containing 50 mM KCl, 15 mM Tris-Cl, pH 8.3, 2.5 mM MgCl2, 0.5% Tween 20, and 100 μg/ml proteinase K at 55°C for 1 h, followed by inactivation of the proteinase K at 95°C for 10 min. PCR amplifications consisted of denaturation at 94°C (30 s), annealing at 65°C (30 s), and extension at 72°C (30 s) for 35 cycles, in a reaction buffer containing 10 mM Tris-Cl, pH 8.3, 50 mM KCl, 2.0 mM MgCl2, 200 μM each of dATP, dCTP, dGTP, and dTTP, 1 μM each of PCR primers, and 1 U of Taq DNA polymerase (Perkin-Elmer Corp., Norwalk, CT). An aliquot of each PCR mixture was analyzed by agarose gel electrophoresis.
Preparation of Crude Extracts and Immunoblotting
Crude extracts of whole brain were obtained as described previously (Takei et al., 1995). Equal amounts of crude extracts were separated by PAGE. Proteins were then electrophoretically transferred to nylon filters (Millipore Corp., Bedford, MA). The nylon filters with transferred proteins were blocked with 2% skim milk in TBS, incubated with mAbs or polyclonal antisera for 1 h, and then rinsed in TBS containing 0.05% Tween 20. In the case of the polyclonal antisera, mouse anti–rabbit IgG was reacted with primary Abs. Finally, the nylon filters were incubated with 125I-labeled protein A. Binding was detected and quantified by autoradiography using an imaging analyzer (model BAS-2000; Fuji Film, Tokyo, Japan). The signals were normalized for the signal obtained with an anti–NF-M Ab as an internal control. For the primary Abs, the following mAbs or polyclonal antisera were used: 3d2 and YXY (Noble et al., 1989; kindly provided by N.J. Cowan, New York University Medical Center) for MAP1B; tau-1 (Boehringer Mannheim Corp., Indianapolis, IN), anti–human tau, and 5E2 (kindly provided by Y. Ihara, University of Tokyo) for tau; HM2 (Sigma Chemical Co., St. Louis, MO) for MAP2; 1D1 (Shiomura and Hirokawa, 1987a ) for MAP1A; and NN18 (Sigma Chemical Co.) for NF-M.
Histological and Anatomical Analysis
Mice matched by age were anesthetized with ether and fixed in 4% paraformaldehyde. Fixed brain tissues were embedded in paraffin, sectioned, and stained with hematoxylin-eosin.
For immunocytochemical analysis, mice anesthetized with ether were perfused with 2% paraformaldehyde and 0.1% glutaraldehyde in phosphate buffer. Various parts of the brains (cerebellum, hippocampus, olfactory bulb, spinal cord, and retina) were dissected out and stored in the same fixative overnight at 4°C. The procedure for cryoprotection, freezing, and sectioning was previously described (Harada et al., 1990). After preincubation in PBS containing glycine to quench aldehydes, followed by 5% skim milk in PBS, the sections were allowed to react with the primary Abs followed by the secondary Abs (rhodamine-conjugated goat anti– mouse or anti–rabbit IgG).
Conventional Electron Microscopy and Morphometric Analysis
Mice matched by age were perfused with 2% paraformaldehyde and 2.5% glutaraldehyde in 0.1 M cacodylate buffer. Tissues were dissected out and fixed overnight, processed for the conventional EM, and viewed under an electron microscope (model 1200EX; JEOL U.S.A., Peabody, MA) at 100 kV. Matching areas of each tissue were examined and photographed, and then the numbers of axons with compacted myelin sheaths were directly counted from prints without preknowledge of genotypes. The diameters of both myelinated and unmyelinated axons were also measured. The numbers of myelinated axons were then converted to densities of myelinated axons by dividing the counts by areas excluding glial cells and blood vessels. In the same way, the MT numbers were counted and then converted to MT densities by dividing the MT count by the area of each axon.
Results
Generation of Mice with Disrupted MAP1B Gene
The analysis of G418-resistant ES clones revealed a targeting frequency of ∼1/250. ES cells carrying the mutated MAP1B gene were injected into C57BL/6 embryos at the blastocyst stage, and the embryos were then transferred into the uteri of pseudopregnant recipients. The embryos injected with R21 cell line developed into chimeric mice transmitting the ES cell genome through the germ line, as indicated by the agouti coat color of the offspring of matings of the chimeric mice with C57BL/6 females. Approximately 50% of these agouti pups were heterozygous for the mutant MAP1B allele as determined by PCR and Southern blot analysis (data not shown). These mice were indistinguishable from their wild-type littermates and displayed no discernible abnormalities. To investigate the phenotype of homozygous mutant mice, we interbred heterozygous mutant mice and genotyped the offspring (Fig. 1 B). The predicted 1:2:1 Mendelian distribution of wild-type (MAP1B+/+), heterozygous mutant (MAP1B+/−), and homozygous mutant (MAP1B−/−) animals was found.
A schematic direct comparison of our targeting strategy with that of Edelmann et al. (1996) is presented in Fig. 2. The predicted truncated product of the genes as disrupted by us is 11 amino acids long (Fig. 2 C), whereas that of the genes disrupted by Edelmann et al. (1996) is 571 amino acids long (Fig. 2 B).
Figure 2.

Comparison of our gene disruption strategy with that used by Edelmann et al. (1996). (A) MAP1B polyprotein. 3d2 and YXY, the regions to which two rabbit anti-MAP1B antisera bind, are shown. LCBS, light chain binding site; MTBD, microtubule-binding domain; CTIR, COOH-terminal imperfect repeats; LC1, light chain 1; AA, amino acids. (B) Predicted truncated product of the gene as disrupted by Edelmann et al. (1996). (C) Predicted truncated product of the gene as disrupted by us.
General Observations
MAP1B+/− mice grew with no apparent abnormalities in a normal cage environment. Their bodies and entire brains developed and reached normal weight (Tables I and II). Their behavior could not be distinguished from that of MAP1B+/+ littermates. On the other hand, the bodies and mature whole brains of the MAP1B−/− mice were significantly smaller than those of the MAP1B+/+ mice (Tables I and II). However, severe motor dysfunctions reported by Edelmann et al. (1996), such as gait ataxia, spastic tremor, and limb paralysis, were not observed in our MAP1B−/− mice. Their eyes often looked a little smaller than those of the wild-type mice, possibly because of slight drooping of their upper eyelids and retraction of their eyeballs (blepharoptosis-like symptom). We confirmed that the size of their eyeballs was within the normal range. More than half of the MAP1B−/− mice exhibited this symptom unilaterally or bilaterally (Table III). Since Edelmann et al. (1996) reported that mice heterozygous for a disrupted MAP1B gene lacked visual acuity, we subjected adult mutant mice to a Morris swimming navigation test with visible cues (Morris, 1981) to determine whether they had visual acuity. MAP1B−/− mice with the blepharoptosis-like symptom could find the platform using the visual cues, and their levels of performance did not differ from those of MAP1B+/+ mice (data not shown); therefore, we concluded that they are not blind. Only a small number of MAP1B−/− mice (<5% of the total number of MAP1B−/− mice) did not gain weight and died before reaching 3 wk of age. However, once the MAP1B−/− mice reached adulthood, they showed no evidence of premature mortality.
Table I.
Body Weight of Mutant Mice and Wild-Type Controls
| Age* | Sex | Mean weights ± SD (number of mice examined) | ||||||
|---|---|---|---|---|---|---|---|---|
| Wild-type | Heterozygote | Homozygote | ||||||
| g | ||||||||
| 8 d | 5.1 ± 0.8 (28) | 4.8 ± 0.9 (28) | 3.7 ± 0.7 (17)‡ | |||||
| 8 wk | male | 23.9 ± 2.7 (7) | 25.0 ± 2.8 (18) | 20.1 ± 2.6 (7)§ | ||||
| female | 19.2 ± 1.4 (13) | 19.4 ± 2.5 (21) | 16.0 ± 3.0 (7)§ | |||||
| 12 wk | male | 26.9 ± 3.2 (7) | 28.2 ± 3.8 (18) | 21.2 ± 2.2 (7)‖ | ||||
| female | 22.0 ± 1.8 (10) | 21.4 ± 2.9 (20) | 17.9 ± 2.7 (5)§ | |||||
Number of postnatal days or weeks at time of measurements.
Different from value for wild-type mice at P < 0.000001, at P < 0.05,
and at P < 0.005.
Student's t test was used to determine the significance of the difference.
Table II.
Brain Weight of Mutant Mice and Wild-Type Controls
| Genotype | Weight (n)* | Age‡ | ||
|---|---|---|---|---|
| g | ||||
| Wild-type | 0.48 ± 0.02 (6) | 137 ± 21 | ||
| Heterozygote | 0.47 ± 0.03 (12) | 136 ± 22 | ||
| Homozygote | 0.41 ± 0.02 (7)§ | 136 ± 21 |
Weight of whole brain (cerebrum + cerebellum). The means ± SD and n (the number of mice examined) are shown.
Number of postnatal days at time of sacrifice for experiments.
Different from value for wild-type mice at P < 0.001; Student's t test was used to determine the significance of the difference.
Table III.
Blepharoptosis-like Symptom in MAP1B−/− Mice
| Symptom | n * | |
|---|---|---|
| Bilateral | 3 | |
| Unilateral | 3 | |
| No symptom | 2 | |
| Total | 8 |
Number of mice examined
Expression of Cytoskeletal Proteins in MAP1B−/− Mutant Mice
For examination of the effect of the disruption of the MAP1B gene, crude extracts were prepared from whole brain (cerebrum and cerebellum) and examined by immunoblotting with anti-MAP1B antisera 3d2 and YXY (Noble et al., 1989; kindly provided by N.J. Cowan), and anti-MAP1B mAb 1B6 (Sato-Yoshitake et al., 1989). 3d2 and YXY recognize the entire MAP1B population, while 1B6 reacts only with phosphorylated MAP1B. 3d2 reacts with repeat motifs near the NH2 terminus, which is responsible for the interaction between MAP1B and MTs, and YXY reacts with COOH-terminal–imperfect repeats (Fig. 2 A). Abs stained very faintly a band of protein at a position slightly below that of MAP1B in MAP1B−/− crude brain extract blots (Fig. 3, A and B). We quantified this faint band using 3d2 and YXY. The amount of this faint immunoreactivity in MAP1B−/− brain is equivalent to 0–5% of that in MAP1B+/+ brain at postnatal days 4, 8, and 14 and postnatal week 15. This residual signal may be derived from a peptide different from the authentic MAP1B protein or a previously unknown alternatively spliced form.
Figure 3.

Immunoblot analysis of crude extracts of brain with the anti-MAP1B antiserum 3d2 (A), with the anti-MAP1B mAb 1B6 (B), with the anti-MAP2 mAb HM2 (C), with the anti-tau mAb tau-1 (D), and with the anti-MAP1A mAb 1D1 (E). (A and B) Lane 1, MAP1B+/+ brain at postnatal day 4; lane 2, MAP1B−/− mutant brain at postnatal day 4; lane 3, MAP1B+/+ brain at postnatal week 8; lane 4: MAP-1B−/− brain at postnatal week 8. NF-M, neurofilament M. (C–E) Lane 1, MAP1B+/+ brain at postnatal week 8; lane 2, MAP-1B−/− brain at postnatal week 8.
It has been suggested that a functional redundancy might exist among MAPs (Harada et al., 1994; DiTella et al., 1996). We measured the relative amounts of other MAPs in MAP1B−/− brains compared with those in MAP1B+/+ brains to investigate whether other MAPs are upregulated to compensate for the loss of functions of MAP1B. However, in postnatal day 4 and adult brains, the amounts of tau, MAP2 (a and b), and MAP1A did not differ between MAP1B−/− and +/+ mice (Fig. 3, C–E).
Brain Architecture in the Mutant Mice
It has been speculated that MAP1B plays important roles in neuronal morphogenesis, especially in neurite extension (Brugg et al., 1993; Ulloa et al., 1993; Avila et al., 1994). In fact, Map1b571 heterozygotes have histological abnormalities in the cerebellum, olfactory bulb, hippocampus, and retina (Edelmann et al., 1996). To assess possible structural defects in the nervous system of MAP1B mutants, we examined tissue sections by light microscopy. The general structure of the MAP1B−/− mutant brains appeared normal in hematoxylin-eosin sections except that the size of the entire brains was slightly reduced (Table II). To compare the localizations of cytoskeletal proteins in mutant and control mice, we stained frozen sections of cerebellum from postnatal day 8 and adult brains with Abs against cytoskeletal proteins. The staining intensity with the anti-MAP1B antiserum YXY was much weaker in mutant sections than in control sections, while we found no difference between mutant and control sections in the staining pattern and intensity with anti-MAP1A, anti-MAP2, or anti-tau. The dendritic arborization and the shape of the somata of cerebellar Purkinje cells were within the normal ranges (Fig. 4, A and B). We examined other brain structures, i.e., the hippocampus, retina (Fig. 4, C and D), olfactory bulb, and spinal cord, of postnatal day 8 and adult brains immunohistochemically but found no abnormalities in the structure of the MAP1B−/− nervous system.
Figure 4.
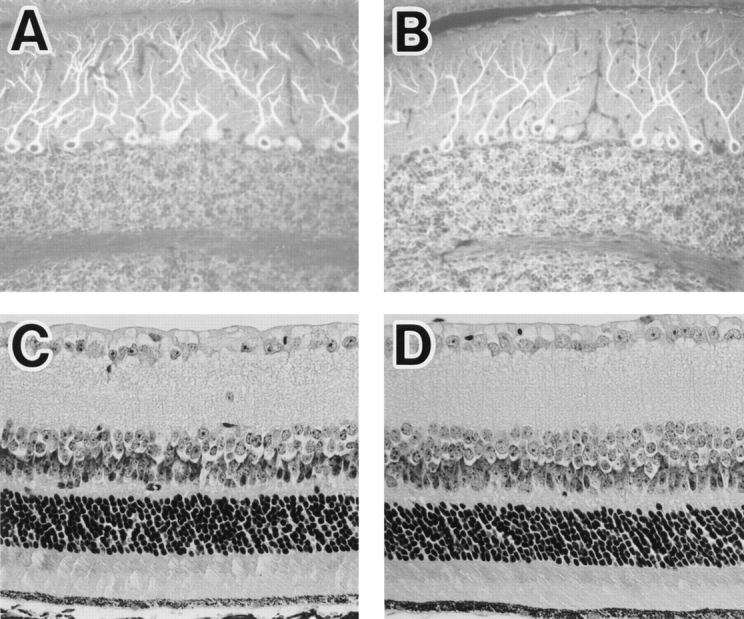
(A and B) Immunofluorescence micrographs of adult cerebellum. Sagittal cryosections of cerebellar vermis of MAP1B+/+ (A) and −/− (B) mice were stained with anti-MAP1A mAb 1D1. (C and D) Paraffin sections of retinae of MAP1B+/+ (C) and −/− (D) mice stained with hematoxylin-eosin are shown. There are no morphological differences between the MAP1B+/+ and −/− tissues.
Delayed Myelination of MAP1B−/− Nervous System
We focused on two representative structures in which MAP1B is expressed at high levels, the developing optic nerve and spinal cord (Tucker and Matus, 1987, 1988; Tucker et al., 1988; Bates et al., 1993; Oudega et al., 1995). We observed axons in optic nerves and anterior pyramidal tracts by EM and performed morphometric analyses. Since in the rodent optic nerve the ensheathment of axons occurs in a rostro-caudal gradient, that is, from eye to optic chiasm (Skoff et al., 1980), we set three levels (A, B, and C) along the optic-nerve axis (Fig. 5 A). At postnatal day 8, the densities of axons with compacted myelin sheaths were significantly decreased in sections of MAP1B−/− optic nerves (Figs. 5 B and 6, A and B) and spinal cords (Fig. 7 A). In the wild-type optic nerves, the level of myelination exhibited an overt rostro-caudal gradient as expected, but no such gradient was apparent in the MAP1B−/− optic nerves (Fig. 5 B). Next, we observed axons of adult MAP1B−/− mice. The densities of axons with compacted myelin sheaths did not differ between the adult MAP1B−/− and +/+ mice in optic nerve sections (Figs. 5, C and D and 8, A and B) and in spinal cord sections (Fig. 7 B). We concluded that the myelination of MAP1B−/− axons in optic nerves and anterior pyramidal tracts of spinal cords was significantly delayed at postnatal day 8, but caught up with wild-type myelination during development and was almost complete in the adult mice. We found no difference in the level of myelination between MAP1B−/− and +/+ trigeminal and sciatic nerves at postnatal day 8 (data not shown).
Figure 5.

(A and C) Schematic illustrations of optic nerve at postnatal day 8 (A) and postnatal week 8–14 (C), showing levels A, B, C, and D, at which ultrathin sections were taken for EM analysis. Each level was determined by the distance from the optic chiasm. (B and D) Quantitative comparison of the numbers of myelinated axons per unit area in juvenile (B) and adult (D) optic nerves of MAP1B+/+ and −/− mice. Solid bars represent each value (per 102 μm2) for the optic nerve of a MAP1B+/+ mouse. Open bars represent each value (per 102 μm2) for the optic nerve of a MAP1B−/− mouse. PD, postnatal days; PW, postnatal weeks.
Figure 6.
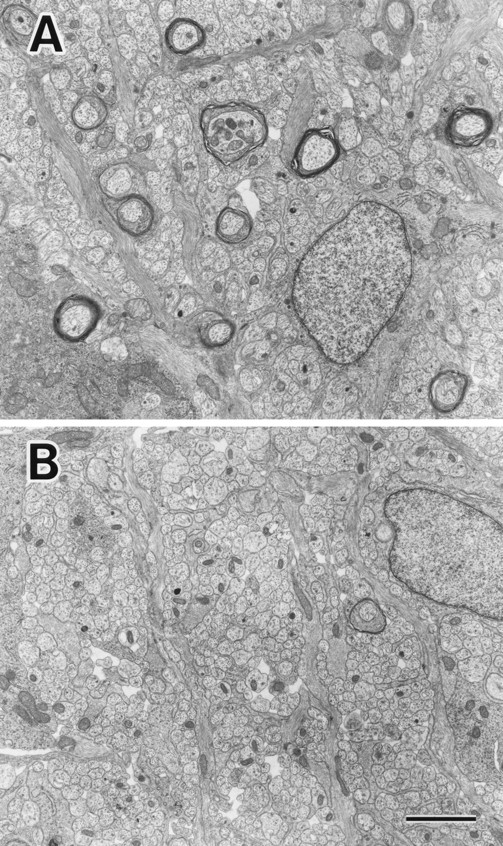
Electron micrographs showing representative areas of cross sections of optic nerves of MAP1B+/+ (A) and −/− (B) mice at postnatal day 8. Axons in the MAP1B−/− optic nerve (B) are less myelinated than those in the MAP1B+/+ optic nerve (A). Bar, 2 μm.
Figure 7.

Quantitative comparison of the numbers of myelinated axons (per 102 μm2) in juvenile (A) and adult (B) anterior pyramidal tract axons of MAP1B+/+ and −/− spinal cords. Solid bars represent each value (per 102 μm2) for the spinal cord of a MAP1B+/+ mouse. Open bars represent each value (per 102 μm2) for the spinal cord of a MAP1B−/− mouse. PD, postnatal days; PW, postnatal weeks.
Figure 8.
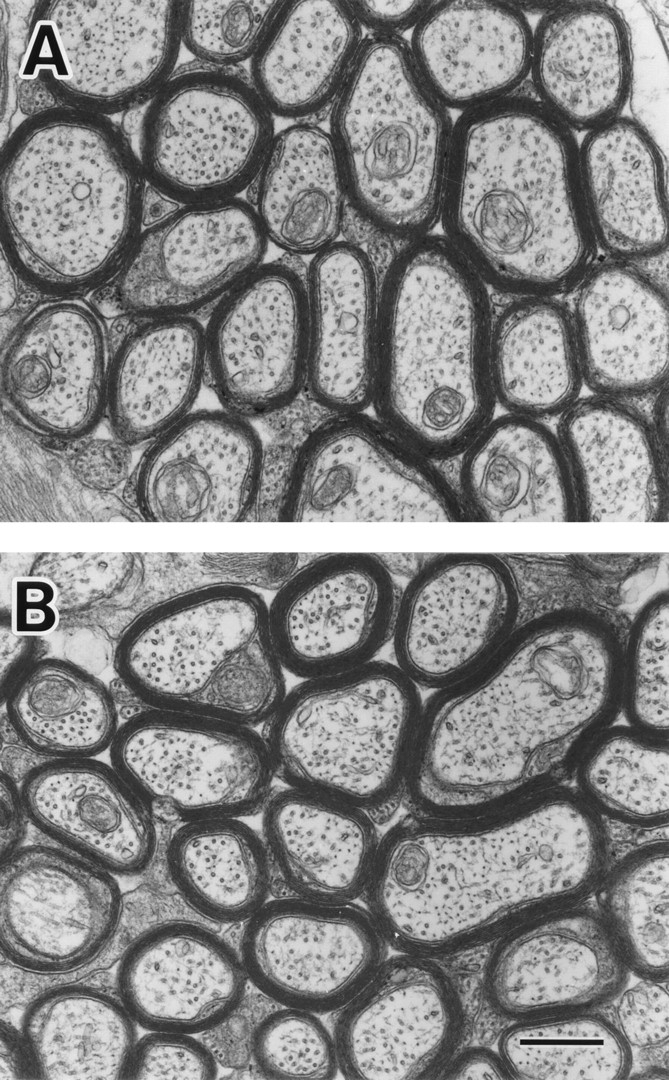
Electron micrographs showing representative areas of cross sections of optic nerves of MAP1B+/+ (A) and −/− (B) mice at postnatal week 14. There are no differences in the number of myelinated axons per unit area, diameter of axons, thickness of myelin sheaths, and density of MTs. Bar, 500 nm.
Axonal Diameters in MAP1B−/− Optic Nerve
To assess whether axonal maturation is delayed in MAP1B−/− neurons, we measured diameters of MAP1B−/− axons in sections of juvenile and adult optic nerves. At postnatal day 8, the diameters of axons were significantly decreased in MAP1B−/− sections (Fig. 9 A). However, the axonal diameter did not differ between MAP1B−/− and +/+ optic nerves at postnatal week 8 (Fig. 9 B, P >0.6; Student's t test). This indicates that axonal maturation was delayed in MAP1B−/− optic nerves, but caught up with that in wild-type optic nerves during development.
Figure 9.

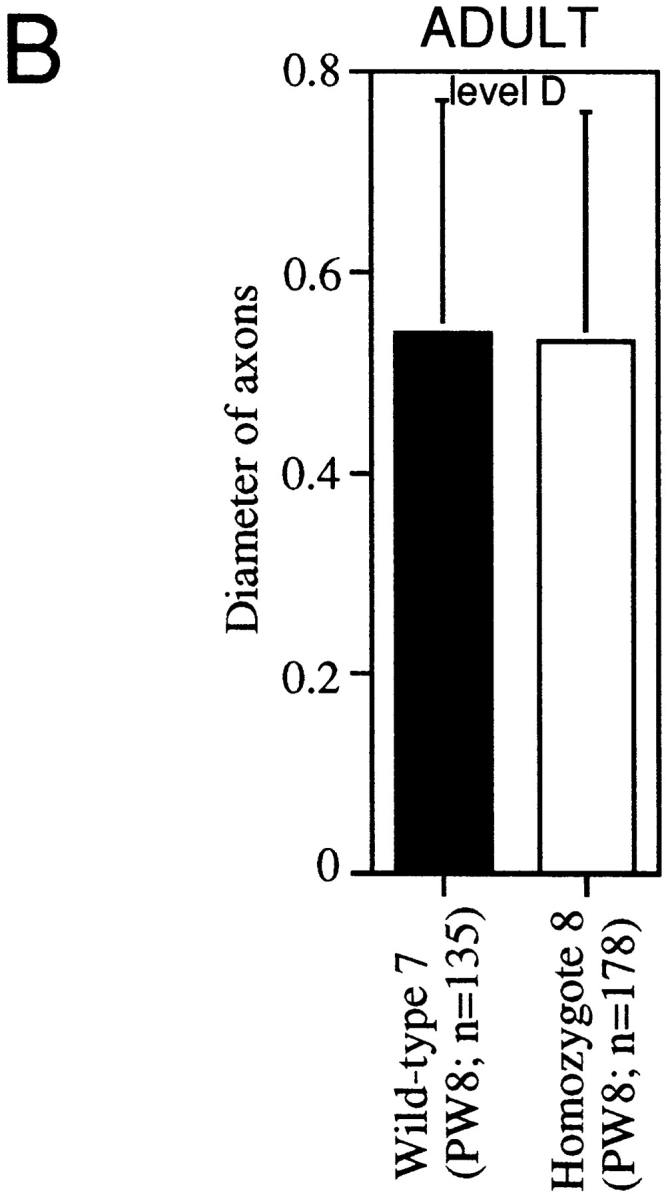
Quantitative comparison of the axonal diameters in juvenile (A) and adult (B) optic nerves of MAP1B+/+ and −/− mice. Solid bars represent mean values ± SD (μm) for axons in a MAP1B+/+ mouse. Open bars represent mean values ± SD (μm) for axons in a MAP1B −/− mouse. *Different from value for controls at P < 0.0005, ** at P < 10−8, and *** at P < 10−11. Student's t test was used to determine the significance of the differences. Levels A, B, C, and D are determined in the same way as described in Fig. 5 legend. PD, postnatal days; PW, postnatal weeks. n, the number of axons examined.
MT Density in MAP1B−/− Axons
MAP1B has been postulated to regulate MT dynamics via an MT-stabilizing effect in cooperation with MAP2, tau, and MAP1A (Takemura et al., 1992). In mice lacking tau, neurons exhibit neurite elongation but decreased densities of MTs in small-caliber axons (Harada et al., 1994). This decreased MT density has been attributed to the loss of an MT-stabilizing effect of tau, though neurons lacking tau show axon elongation, possibly because of compensation by other MAPs for the loss of tau functions.
To assess whether the disruption of the MAP1B gene affects MT stability, we performed morphometric analysis of three representative structures: olfactory sensory neurons, in which MAP1B is strongly expressed even in the adult nervous system (Tucker et al., 1989; Viereck et al., 1989), the optic nerve, and cerebellar parallel fibers. No significant reduction of MT number and density was observed in MAP1B−/− axons of each area (Table IV).
Table IV.
MT Density in MAP1B+/+ and −/− Axons
| Examined area | Number and genotype of samples | Age* | Area of examined axons | MT density‡ (n) | ||||
|---|---|---|---|---|---|---|---|---|
| 10−2 μm2 | ||||||||
| Cerebellar parallel fiber | Wild-type 8 | 24 | 0.020 ± 0.010 | 1.2 ± 0.5 (49) | ||||
| Homozygote 9 | 24 | 0.021 ± 0.006 | 1.2 ± 0.4 (31) | |||||
| Optic nerve | Wild-type 9 | 8 | 0.32 ± 0.12 | 0.6 ± 0.2 (26) | ||||
| Wild-type 10 | 8 | 0.30 ± 0.11 | 0.7 ± 0.2 (35) | |||||
| Homozygote 10 | 8 | 0.34 ± 0.11 | 0.7 ± 0.1 (30) | |||||
| Homozygote 11 | 8 | 0.31 ± 0.13 | 0.7 ± 0.2 (28) | |||||
| Olfactory sensory neuron | Wild-type 11 | 7 | 0.022 ± 0.006 | 1.3 ± 0.4 (27) | ||||
| (near the surface) | Homozygote 12 | 7 | 0.023 ± 0.005 | 1.3 ± 0.4 (22) | ||||
| Olfactory sensory neuron | Wild-type 12 | 7 | 0.033 ± 0.007 | 0.8 ± 0.3 (26) | ||||
| (near the glomerular | Wild-type 13 | 8 | 0.034 ± 0.007 | 1.2 ± 0.5 (10) | ||||
| layer) | Wild-type 14 | 8 | 0.035 ± 0.014 | 1.1 ± 0.4 (16) | ||||
| Homozygote 13 | 7 | 0.037 ± 0.006 | 0.8 ± 0.2 (25) | |||||
| Homozygote 14 | 8 | 0.036 ± 0.014 | 1.0 ± 0.4 (26) | |||||
| Homozygote 15 | 8 | 0.037 ± 0.006 | 1.2 ± 0.3 (20) |
The means ± SD and n (the number of axons examined) are shown. In each examined area, MT density did not differ significantly between MAP1B+/+ and −/− mice.
Number of postnatal weeks at time of sacrifice for experiments.
Number of MTs per 10−2 μm2.
Discussion
Delayed Development of MAP1B−/− Nervous System
MAP1B is one of the early MAPs expressed mainly in the nervous system (Tanaka et al., 1992; Avila et al., 1994). It had been postulated that MAP1B is involved in neuronal morphogenesis (Brugg et al., 1993; Ulloa et al., 1993; Avila et al., 1994). However, little is known about its physiological function. To define its role in vivo, we generated a mutant mouse line with a disrupted MAP1B gene. Though the weight of the MAP1B−/− brains was slightly reduced, their structures were not significantly different from those of MAP1B+/+ brains at the light microscopic level. EM analysis revealed that myelination and axon caliber expansion were delayed in developing MAP1B−/− optic nerves. However, we found no morphological differences between adult MAP1B+/+ and −/− optic nerve sections. These findings indicate that the development of the MAP1B−/− optic nerves was not completely inhibited by the disruption of the MAP1B gene, but delayed, and then caught up with that of the wild-type optic nerves. The same pattern of delayed myelination as found in MAP1B−/− optic nerve axons was observed in MAP1B−/− pyramidal tract axons.
What is the basis for this delay? The most plausible possibility is that MAP1B deficiency caused delayed axonal development, which would result in retardation of myelination because neurons associate specifically with oligodendrocytes and influence their development and differentiation via soluble factors (Collarini et al., 1991). This hypothesis is consistent with the aforementioned reports suggesting an important role of MAP1B in neuronal morphogenesis. Another possibility is that oligodendrocytes themselves did not develop normally because of a lack of MAP1B. A considerable amount of MAP1B is normally expressed in oligodendrocytes (Fischer et al., 1990; Vouyiouklis and Brophy, 1993; Ulloa et al., 1994). Furthermore, MAP1B expression is first detected in cultured glial progenitor cells immediately before they differentiate into complex process-bearing oligodendrocytes (Vouyiouklis and Brophy, 1993), suggesting that MAP1B might have a role in the formation of myelin-forming processes. Therefore, it is plausible that lack of MAP1B directly affects oligodendrocyte development, resulting in delayed myelination, which can disturb neuronal/axonal development. Since these two possibilities are compatible with each other, both mechanisms could be involved in the observed developmental delay of the MAP1B−/− nervous system.
On the other hand, why was the delayed myelination not observed in MAP1B−/− sciatic and trigeminal nerves at postnatal day 8? A possible explanation is that the myelination of the MAP1B−/− sciatic and trigeminal nerves had already caught up with that of the wild-type ones by the time of sacrifice of the mice. In rodents, myelination begins, peaks, and declines to a basal level at an earlier age in the peripheral nervous system than in the central nervous system (Stahl et al., 1990), which supports this hypothesis. A second possibility is that the degree of the effect of MAP1B gene disruption differs between oligodendrocytes and Schwann cells. However, no data supporting this hypothesis are available.
Density of MTs in MAP1B−/− Mice
In a previous study, we found a decreased number and density of MTs in cerebellar parallel fibers of tau-deficient mice, which could be attributed to loss of a MT-stabilizing effect of tau (Harada et al., 1994). The decrease in the density of MTs in the tau-deficient mice was specific to cerebellar small-caliber axons. Since in these axons tau accounts for a large proportion of the total MAPs, the loss of tau in these axons is considered to affect strongly the stability of MTs in these axons. However, disruption of the MAP1B gene resulted in no change in the density of MTs in the axons. Differences between MAP1B and other MAPs in regard to interactions with MTs might explain this difference in phenotypes between tau and MAP1B knock-out mice. First, in vitro assembly of MTs mediated by MAP1B is not as efficient as that mediated by other neuronal MAPs (Bloom et al., 1985). Second, the MTs in fibroblasts transfected with MAP1B cDNA are less stable to the effects of an MT-depolymerization reagent than those in fibroblasts transfected with MAP2c or tau cDNA, with no extensive reorganization of MTs such as bundle formation, which is seen in fibroblasts transfected with tau or MAP2c cDNA (Takemura et al., 1992). The fact that the MT density was unchanged in the MAP1B−/− axons might have been due to the weakness of the interaction of MAP1B with MTs. However, double knock-out mice generated by intercrossing tau and MAP1B knock-out mice exhibited decreased MT densities in the optic nerve and olfactory bulb (Inomata, S., unpublished observation). This suggests that disruption of the MAP1B gene enhances the effect of disruption of the tau locus to reduce the density of MTs. Taken together with a recent report that MAP1B and tau can be functionally substituted for each other in laminin-enhanced axonal growth of cultured cerebellar macroneurons (DiTella et al., 1996), it is plausible that MAP1B functions to stabilize neuronal MTs in cooperation with other MAPs.
Phenotypes of MAP1B−/− Mutants
The phenotypes of our MAP1B mutants (R21 mutant mice) are very different from those of Map1b571 mutant mice (Edelmann et al., 1996), mainly in the following points: (a) Map1b571 heterozygotes showed severe neuronal abnormalities, but R21 heterozygotes appeared healthy. (b) Map1b571 homozygous mutant embryos were nonviable, but R21 homozygotes reached adulthood. Generally, Map1b571 mutant mice exhibited more severe abnormalities than R21 mutant mice. This phenotypic variation cannot be attributed to differences in genetic background, as both R21 and Map1b571 mutant mice were analyzed in the same hybrid C57BL/129 backgrounds.
Our targeting scheme and that of Edelmann et al. (1996) differ most considerably in the design of the targeting vectors; we inserted a selection cassette into the first coding exon of the MAP1B gene, whereas Edelmann et al. (1996) inserted it into a SpeI site 5′ to the MT-binding domain of the MAP1B gene (Fig. 2). It is reasonable to consider that this difference in vector construction is at the basis of the phenotypic variation. The predicted truncated product of the gene as disrupted by Edelmann et al. (1996) is 571 amino acids long, whereas that of the gene as disrupted by us is 11 amino acids long (Fig. 2, B and C). The phenotypes of Map1b571 heterozygotes cannot be explained by a simple loss of function of the MAP1B gene because Map1b571 heterozygotes, in which the amount of MAP1B remained at about half the amount in the wild-type mice, have a more severe phenotype than do R21 homozygotes. Therefore, the most plausible possibility is that Map1b571 mutant mice produce a long truncated peptide acting in a dominant-negative fashion, resulting in their abnormally severe phenotypes. By immunoblotting using an Ab specific for the NH2-terminal 150 amino acids of MAP1B, Edelmann et al. (1996) have excluded the existence of this long truncated product in their mutant mice, and they speculated that this product is unstable. However, judging from the pattern of the blottings they presented, they used mature brain tissue for immunoblotting, not developing brain tissue, though they did not clearly state the ages of mice sacrificed for their experiments. Therefore, considering that MAP1B is strongly expressed in the developing murine nervous system, the existence of such a long truncated polypeptide in juvenile Map1b571 mutant brains cannot be excluded. Moreover, the phenotypes of Map1b571 mutant mice seem to be too severe, since mice lacking another major neuronal MAP, tau, resulted in only minimal neuronal phenotypes (Harada et al., 1994), and even double knock-out mice lacking both tau and MAP1B could reach adulthood (unpublished observation). From the above, we conclude that R21 mutant mice exhibit a true loss of function phenotype of the MAP1B gene, whereas the phenotypes of Map1b571 mutant mice are affected by a long truncated product acting in a dominant-negative fashion.
Another possibility is that “neighborhood phenotypic effects” (Olson et al., 1996) might contribute to the difference in phenotypes between R21 and Map1b571 mutant mice. This term refers to deletion of part of the target gene, or insertion of a selection cassette, affecting the expression of other genes located near the intended target, confounding the interpretation of phenotypes. Several cases of this effect mediating phenotypic variation due to mutations introduced by gene targeting have been described (Olson et al., 1996). In the case of myogenic regulatory factor 4, different laboratories have generated knock-outs with different phenotypes, ranging from death at birth to survival to adulthood (Olson et al., 1996). For determination of whether this is the case with MAP1B knock-outs, details of the structure of neighboring genes must be elucidated, and mice with subtle mutations in the MAP1B gene, such as an effectively positioned stop codon, must be generated.
From the above, we conclude that MAP1B plays an important role in neuronal development. However, the exact functions of MAP1B in vivo remain obscure. Future analysis of tau/MAP1B double mutant and primary neuronal cultures derived from various mutants will enrich our understanding of the functions of MAPs.
Acknowledgments
We thank Professor N.J. Cowan for providing anti-MAP1B antisera, Professor Y. Ihara for providing anti-tau Abs, J. Kuno (Cancer Institute, Tokyo) for helping us to culture ES cells, N. Nishiyama (University of Tokyo) for performing behavioral tests, H. Fukuda, Y. Kawasaki, and H. Sato for their technical and secretarial assistance, and T. Funakoshi, N. Homma, S. Nonaka, R. Sato, Y. Yonekawa, and other members of the Hirokawa lab for help and discussion.
This work was supported by a Special Grant-in-Aid for Scientific Research and a Grant for Center of Excellence from the Japan Ministry of Education, Science, and Culture and by a grant from the Institute of Physical and Chemical Research (RIKEN) to N. Hirokawa.
Footnotes
1. Abbreviations used in this paper: ES, embryonic stem; LC, light chain; MAP, microtubule-associated protein; MT, microtubule; NF, neurofilament.
Address all correspondence to N. Hirokawa, Department of Cell Biology and Anatomy, Faculty of Medicine, University of Tokyo, Hongo, Bunkyo-ku, Tokyo, 113, Japan. Tel.: 81-3-3812-2111 ext. 3326. Fax: 81-3-5689-4856.
References
- Avila J, Domínguez J, Díaz-Nido J. Regulation of microtubule dynamics by microtubule-associated protein expression and phosphorylation during neuronal development. Int J Dev Biol. 1994;38:13–25. [PubMed] [Google Scholar]
- Bates CA, Trinh N, Meyer RL. Distribution of microtubule-associated proteins (MAPs) in adult and embryonic mouse retinal explants: presence of the embryonic Map, MAP5/1B, in regenerating adult retinal axons. Dev Biol. 1993;155:533–544. doi: 10.1006/dbio.1993.1050. [DOI] [PubMed] [Google Scholar]
- Bloom GS, Schoenfeld TA, Vallee RB. Widespread distribution of the major polypeptide component of MAP1 (microtubule-associated protein 1) in the nervous system. J Cell Biol. 1984;98:320–330. doi: 10.1083/jcb.98.1.320. [DOI] [PMC free article] [PubMed] [Google Scholar]
- Bloom GS, Luca FC, Vallee RB. Microtubule-associated protein 1B: identification of a major component of the neuronal cytoskeleton. Proc Natl Acad Sci USA. 1985;82:5404–5408. doi: 10.1073/pnas.82.16.5404. [DOI] [PMC free article] [PubMed] [Google Scholar]
- Brugg B, Reddy D, Matus A. Attenuation of microtubule-associated protein 1B expression by antisense oligonucleotides inhibits initiation of neurite outgrowth. Neuroscience. 1993;52:489–496. doi: 10.1016/0306-4522(93)90401-z. [DOI] [PubMed] [Google Scholar]
- Calvert R, Anderton BH. A microtubule-associated protein (MAP1) which is expressed at elevated levels during development of the rat cerebellum. EMBO (Eur Mol Biol Organ) J. 1985;4:1171–1176. doi: 10.1002/j.1460-2075.1985.tb03756.x. [DOI] [PMC free article] [PubMed] [Google Scholar]
- Chen J, Kanai Y, Cowan NJ, Hirokawa N. Projection domains of MAP2 and tau determine spacings between microtubules in dendrites and axons. Nature (Lond) 1992;360:674–677. doi: 10.1038/360674a0. [DOI] [PubMed] [Google Scholar]
- Collarini, E.J., N. Pringle, H. Mudhar, G. Stevens, R. Kuhn, E.S. Monuki, and W.D. Richardson. 1991. Growth factors and transcription factors in oligodendrocyte development. J. Cell Sci. 15(Suppl.):117–123. [DOI] [PubMed]
- Díaz-Nido J, Mendez LS, Avila J. A casein kinase II–related activity is involved in phosphorylation of microtubule-associated protein MAP-1B during neuroblastoma cell differentiation. J Cell Biol. 1988;106:2057–2065. doi: 10.1083/jcb.106.6.2057. [DOI] [PMC free article] [PubMed] [Google Scholar]
- DiTella MC, Feiguin F, Carri N, Kosik KS, Cáceres A. MAP-1B/ TAU functional redundancy during laminin-enhanced axonal growth. J Cell Sci. 1996;109:467–477. doi: 10.1242/jcs.109.2.467. [DOI] [PubMed] [Google Scholar]
- Edelmann W, Zervas M, Costello P, Roback L, Fischer I, Hammarback A, Cowan N, Davis P, Wainer B, Kucherlapati R. Neuronal abnormalities in microtubule-associated protein 1B mutant mice. Proc Natl Acad Sci USA. 1996;93:1270–1275. doi: 10.1073/pnas.93.3.1270. [DOI] [PMC free article] [PubMed] [Google Scholar]
- Fischer I, Konola J, Cochary E. Microtubule associated protein (MAP1B) is present in cultured oligodendrocytes and co-localizes with tubulin. J Neurosci Res. 1990;27:112–124. doi: 10.1002/jnr.490270117. [DOI] [PubMed] [Google Scholar]
- Garner CC, Garner A, Huber G, Kozak C, Matus A. Molecular cloning of microtubule-associated protein 1 (MAP1A) and microtubule- associated protein 5 (MAP1B): identification of distinct genes and their differential expression in developing brain. J Neurochem. 1990;55:146–154. doi: 10.1111/j.1471-4159.1990.tb08832.x. [DOI] [PubMed] [Google Scholar]
- Greene LA, Liem RK, Shelansky ML. Regulation of a high– molecular weight microtubule-associated protein in PC12 cells by nerve growth factor. J Cell Biol. 1983;96:76–88. doi: 10.1083/jcb.96.1.76. [DOI] [PMC free article] [PubMed] [Google Scholar]
- Hammarback JA, Obar RA, Hughes SM, Vallee RB. MAP1B is encoded as a polyprotein that is processed to form a complex N-terminal microtubule-binding domain. Neuron. 1991;7:129–139. doi: 10.1016/0896-6273(91)90081-a. [DOI] [PubMed] [Google Scholar]
- Harada A, Sobue K, Hirokawa N. Developmental changes of synapsin I subcellular localization in rat cerebellar neurons. Cell Struct Funct. 1990;15:329–342. doi: 10.1247/csf.15.329. [DOI] [PubMed] [Google Scholar]
- Harada A, Oguchi K, Okabe S, Kuno J, Terada S, Ohshima T, Sato-Yoshitake R, Takei Y, Noda T, Hirokawa N. Altered microtubule organization in small-calibre axons of mice lacking tau protein. Nature (Lond) 1994;369:488–491. doi: 10.1038/369488a0. [DOI] [PubMed] [Google Scholar]
- Hirokawa N. The crosslinker system between neurofilaments, microtubules and membranous organelles in frog axons revealed by quick freeze, freeze fracture, deep etching method. J Cell Biol. 1982;94:425–443. doi: 10.1083/jcb.94.1.129. [DOI] [PMC free article] [PubMed] [Google Scholar]
- Hirokawa, N. 1991. Molecular architecture and dynamics of the neuronal cytoskeleton. In The Neuronal Cytoskeleton. R.D. Burgoyne, editor. Wiley-Liss, New York. 5–74.
- Hirokawa N, Bloom GS, Vallee RB. Cytoskeletal architecture and immunocytochemical localization of microtubule-associated proteins in regions of axons associated with rapid axonal transport: the IDPN-intoxicated axon as a model system. J Cell Biol. 1985;101:1858–1870. doi: 10.1083/jcb.101.1.227. [DOI] [PMC free article] [PubMed] [Google Scholar]
- Hirokawa N, Hisanaga S, Shiomura Y. MAP2 is a component of crossbridges between microtubules and neurofilaments in vivo and in vitro. Quick-freeze, deep etch immunoelectron microscopy and reconstruction studies. J Neurosci. 1988a;8:2769–2779. doi: 10.1523/JNEUROSCI.08-08-02769.1988. [DOI] [PMC free article] [PubMed] [Google Scholar]
- Hirokawa N, Shiomura Y, Okabe S. Tau proteins: the molecular structure and mode of binding on microtubules. J Cell Biol. 1988b;107:1449–1461. doi: 10.1083/jcb.107.4.1449. [DOI] [PMC free article] [PubMed] [Google Scholar]
- Kanai Y, Takemura R, Ohshima T, Mori H, Ihara Y, Yanagisawa M, Masaki T, Hirokawa N. Expression of multiple tau isoforms and microtubule bundle formation in fibroblasts transfected with a single tau cDNA. J Cell Biol. 1989;109:1173–1184. doi: 10.1083/jcb.109.3.1173. [DOI] [PMC free article] [PubMed] [Google Scholar]
- Knops J, Kosik KS, Lee G, Pardee JD, Cohen-Could L, McConlogue L. Overexpression of tau in a nonneuronal cell induces long cellular processes. J Cell Biol. 1991;114:725–733. doi: 10.1083/jcb.114.4.725. [DOI] [PMC free article] [PubMed] [Google Scholar]
- Lewis SA, Sherline P, Cowan NJ. A cloned cDNA encoding MAP1 detects a single copy gene in mouse and a brain-abundant RNA whose level decreases during development. J Cell Biol. 1986;102:2106–2114. doi: 10.1083/jcb.102.6.2106. [DOI] [PMC free article] [PubMed] [Google Scholar]
- Lewis SA, Ivanov IE, Lee G-H, Cowan NJ. Organization of microtubules in dendrites and axons is determined by a short hydrophobic zipper in microtubule-associated proteins MAP2 and tau. Nature (Lond) 1989;342:498–505. doi: 10.1038/342498a0. [DOI] [PubMed] [Google Scholar]
- Morris RGM. Spatial localization does not require the presence of local cues. Learn Motiv. 1981;12:239–260. [Google Scholar]
- Noble M, Lewis SA, Cowan NJ. The microtubule binding domain of microtubule-associated protein MAP1B contains a repeated sequence motif unrelated to that of MAP2 and tau. J Cell Biol. 1989;109:3367–3376. doi: 10.1083/jcb.109.6.3367. [DOI] [PMC free article] [PubMed] [Google Scholar]
- Olson EN, Arnold H-H, Rigby PWJ, Wold BJ. Know your neighbors: three phenotypes in null mutants of the myogenic bHLH gene MRF4. Cell. 1996;85:1–4. doi: 10.1016/s0092-8674(00)81073-9. [DOI] [PubMed] [Google Scholar]
- Oudega M, Touri F, Deenen MGM, Riederer BM, Marani E. Immunocytochemical localization of microtubule-associated protein 1b and 2 in the developing rat spinal cord. J Anat. 1995;187:723–737. [PMC free article] [PubMed] [Google Scholar]
- Riederer B, Cohen R, Matus A. MAP5: a novel brain microtubule-associated protein under strong developmental regulation. J Neurocytol. 1986;15:763–775. doi: 10.1007/BF01625193. [DOI] [PubMed] [Google Scholar]
- Safaei R, Fischer I. Cloning of a cDNA encoding MAP1B in rat brain: regulation of mRNA levels during development. J Neurochem. 1989;52:1871–1879. doi: 10.1111/j.1471-4159.1989.tb07270.x. [DOI] [PubMed] [Google Scholar]
- Sato-Yoshitake R, Shiomura Y, Miyasaka H, Hirokawa N. Microtubule-associated protein 1B: molecular structure, localization, and phosphorylation-dependent expression in developing neurons. Neuron. 1989;3:229–238. doi: 10.1016/0896-6273(89)90036-6. [DOI] [PubMed] [Google Scholar]
- Schoenfeld JA, McKerracher L, Obar R, Vallee RB. MAP1A and MAP1B are structurally related microtubule-associated proteins with distinct developmental patterns in the CNS. J Neurosci. 1989;9:1712–1730. doi: 10.1523/JNEUROSCI.09-05-01712.1989. [DOI] [PMC free article] [PubMed] [Google Scholar]
- Shiomura Y, Hirokawa N. The molecular structure of microtubule-associated protein 1A (MAP1A) in vivo and in vitro. An immunoelectron microscopy and quick-freeze, deep-etch study. J Neurosci. 1987a;7:1461–1469. doi: 10.1523/JNEUROSCI.07-05-01461.1987. [DOI] [PMC free article] [PubMed] [Google Scholar]
- Shiomura Y, Hirokawa N. Colocalization of MAP1 and MAP2 on the neuronal microtubule in situ revealed with double-labeling immunoelectron microscopy. J Cell Biol. 1987b;104:1575–1578. doi: 10.1083/jcb.104.6.1575. [DOI] [PMC free article] [PubMed] [Google Scholar]
- Skoff RP, Toland D, Nast E. Pattern of myelination and distribution of neuronal cells along the developing optic system of the rat and rabbit. J Comp Neurol. 1980;191:237–253. doi: 10.1002/cne.901910207. [DOI] [PubMed] [Google Scholar]
- Stahl N, Harry J, Popko B. Quantitative analysis of myelin protein gene expression during development in the rat sciatic nerve. Mol Brain Res. 1990;8:209–212. doi: 10.1016/0169-328x(90)90018-9. [DOI] [PubMed] [Google Scholar]
- Takei Y, Harada A, Takeda S, Kobayashi K, Terada S, Takahashi T, Noda T, Hirokawa N. Synapsin I deficiency results in the structural change in the presynaptic terminals in the murine nervous system. J Cell Biol. 1995;131:1789–1800. doi: 10.1083/jcb.131.6.1789. [DOI] [PMC free article] [PubMed] [Google Scholar]
- Takemura R, Okabe S, Umeyama T, Kanai Y, Cowan NJ, Hirokawa N. Increased microtubule stability and alpha tubulin acetylation in cells transfected with microtubule-associated proteins MAP1B, MAP2 or tau. J Cell Sci. 1992;103:953–964. doi: 10.1242/jcs.103.4.953. [DOI] [PubMed] [Google Scholar]
- Tanaka Y, Kawahata K, Nakata T, Hirokawa N. Chronological expression of microtubule-associated proteins (MAPs) in EC cell P19 after neuronal induction by retinoic acid. Brain Res. 1992;596:269–278. doi: 10.1016/0006-8993(92)91557-u. [DOI] [PubMed] [Google Scholar]
- Tucker RP, Matus AI. Developmental regulation of two microtubule-associated proteins (MAP2 and MAP5) in the embryonic avian retina. Development (Camb) 1987;101:535–546. doi: 10.1242/dev.101.3.535. [DOI] [PubMed] [Google Scholar]
- Tucker RP, Matus AI. Microtubule-associated proteins characteristic of embryonic brain are found in the adult mammalian retina. Dev Biol. 1988;130:423–434. doi: 10.1016/0012-1606(88)90338-7. [DOI] [PubMed] [Google Scholar]
- Tucker RP, Binder LI, Matus AI. Neuronal microtubule-associated proteins in the embryonic avian spinal cord. J Comp Neurol. 1988;191:237–253. doi: 10.1002/cne.902710106. [DOI] [PubMed] [Google Scholar]
- Tucker RP, Garner CC, Matus A. In situlocalization of microtubule-associated protein mRNA in the developing and adult rat brain. Neuron. 1989;2:1245–1256. doi: 10.1016/0896-6273(89)90309-7. [DOI] [PubMed] [Google Scholar]
- Ulloa L, Díaz-Nido J, Avila J. Depletion of casein kinase II by antisense oligonucleotide prevents neuritogenesis in neuroblastoma cells. EMBO (Eur Mol Biol Organ) J. 1993;12:1633–1640. doi: 10.1002/j.1460-2075.1993.tb05808.x. [DOI] [PMC free article] [PubMed] [Google Scholar]
- Ulloa L, Ibarrola N, Avila J, Díez-Guerra FJ. Microtubule-associated protein 1B (MAP1B) is present in glial cells phosphorylated different than in neurons. Glia. 1994;10:266–275. doi: 10.1002/glia.440100405. [DOI] [PubMed] [Google Scholar]
- Vallee RB, Davis SE. Low molecular weight microtubule associated proteins are light chains of microtubule-associated protein 1 (MAP1) Proc Natl Acad Sci USA. 1983;80:1342–1346. doi: 10.1073/pnas.80.5.1342. [DOI] [PMC free article] [PubMed] [Google Scholar]
- Viereck C, Tucker RP, Matus A. The adult rat olfactory system expresses microtubule-associated proteins found in the developing brain. J Neurosci. 1989;9:3547–3557. doi: 10.1523/JNEUROSCI.09-10-03547.1989. [DOI] [PMC free article] [PubMed] [Google Scholar]
- Vouyiouklis DA, Brophy PJ. Microtubule-associated protein 1B expression precedes the morphological differentiation of oligodendrocytes. J Neurosci Res. 1993;35:257–267. doi: 10.1002/jnr.490350305. [DOI] [PubMed] [Google Scholar]