Abstract
Bcl-xL and Bcl-2 inhibit both apoptosis and proliferation. In investigating the relationship between these two functions of Bcl-xL and Bcl-2, an analysis of 24 Bcl-xL and Bcl-2 mutant alleles, including substitutions at residue Y28 previously reported to selectively abolish the cell cycle activity, showed that cell cycle delay and anti-apoptosis co-segregated in all cases. In determining whether Bcl-2 and Bcl-xL act in G0 or G1, forward scatter and pyronin Y fluorescence measurements indicated that Bcl-2 and Bcl-xL cells arrested more effectively in G0 than controls, and were delayed in G0–G1 transition. The cell cycle effects of Bcl-2 and Bcl-xL were reversed by Bad, a molecule that counters the survival function of Bcl-2 and Bcl-xL. When control and Bcl-xL cells of equivalent size and pyronin Y fluorescence were compared, the kinetics of cell cycle entry were similar, demonstrating that the ability of Bcl-xL and Bcl-2 cells to enhance G0 arrest contributes significantly to cell cycle delay. Our data suggest that cell cycle effects and increased survival both result from intrinsic functions of Bcl-2 and Bcl-xL.
Keywords: apoptosis/BAD/Bcl-2/Bcl-xL/cell cycle
Introduction
The anti-apoptotic molecules Bcl-2 and Bcl-xL have anti-proliferative effects. Studies in mice and in cell culture have demonstrated that the most pronounced cell cycle effect of Bcl-2 and Bcl-xL is delay of progression to S phase from quiescence (Huang et al., 1997; Greider et al., 2002). T cells from lck-Bcl-2 transgenic mice exhibited delayed S phase entry following T cell activation, while gene deletion resulted in accelerated cell cycle entry (Linette et al., 1996). Bcl-2 transgene expression in the liver delays cell cycle entry during liver regeneration (Vail et al., 2002). In tissue culture models of cell cycle stimulation, Bcl-2 or Bcl-xL also delays progression to S phase (O’Reilly et al., 1996; Huang et al., 1997; Greider et al., 2002).
Originally cloned as the deregulated oncogene at the translocation breakpoint of t(14;18) follicular lymphomas, Bcl-2 enhances tumorigenesis by prolonging survival. In contrast, the anti-proliferative activity of Bcl-2 has been shown to inhibit tumor progression in a number of animal models and human cancers. In mammary tumor models, mitotic activity in the initial proliferative stage is inhibited by Bcl-2, but inhibition of proliferation is lost as tumors progress to hyperplasia and adenocarcinoma (Furth et al., 1999; Murphy et al., 1999). In human breast cancers, advanced adenocarcinomas have lost Bcl-2 expression, while high Bcl-2 expression has been associated with low proliferative potential and better prognosis. In liver models, Bcl-2 has a suppressive effect on both c-myc-induced tumorigenesis and TGFα-induced carcinogenesis, in which Bcl-2 inhibits the growth of early proliferative foci (de La Coste et al., 1999; Vail et al., 2001). Thus, Bcl-2 can both potentiate and suppress oncogenesis, which could explain the long latency in tumor formation resulting from Bcl-2 overexpression. Differential modulation of the anti-apoptosis and anti-proliferation functions of Bcl-2 can lead to molecules with enhanced oncogenic or tumor suppressing potential. Hence, elucidation of the relationship between the anti-apoptosis and anti-proliferation activities of Bcl-2 could have therapeutic implications. An important question in understanding the dual function of Bcl-2 is whether the cell cycle activity of Bcl-2 or Bcl-xL is distinct from the anti-apoptosis function, or whether the cell cycle effects are secondary consequences of enhanced survival.
The anti-apoptotic members of the Bcl-2 family contain four homology domains, BH1–4. The N-terminal BH4 domain has been shown to be important for anti-apoptosis, as deletion of BH4 converts Bcl-2 from a survival molecule to a pro-apoptotic molecule (Cheng et al., 1997; Huang et al., 1998). It was previously reported that mutation of the conserved residue tyrosine 28 (Y28) in the BH4 domain of Bcl-2 and the equivalent residue Y22 in Bcl-xL eliminated their ability to delay S phase entry without affecting their ability to inhibit apoptosis (Huang et al., 1997). This led to the conclusion that the anti-apoptosis function of Bcl-2 and Bcl-xL can be genetically separated from their cell cycle function. We sought to investigate further the mechanism of cell cycle delay using the same BH4 mutation.
The cell cycle delay effect of Bcl-2 and Bcl-xL has been measured as lengthened time to reach S phase from quiescence. This could be the result of Bcl-2 or Bcl-xL lengthening either G0 or G1, which is not clearly established by existing data. Bcl-2 hastened the withdrawal of HL60 cells to G0 upon DMSO induction of differentiation (Vairo et al., 1996), but Bcl-2 has also been shown to lengthen the G1 phase (Linette et al., 1996; Mazel et al., 1996). Knowledge of the precise biochemical step affected in cell cycle progression would shed light on the relationship between apoptosis regulation and cell cycle control. The cyclin-dependent kinase (cdk) inhibitor p27 is elevated in T cells and fibroblasts overexpressing Bcl-2, and Bcl-2 or Bcl-xL could not delay S phase entry in the absence of p27 (Linette et al., 1996; Vairo et al., 2000; Greider et al., 2002). Bcl-2 has also been shown to upregulate the pRB family member p130, which complexes with E2F-4 during G0 to inhibit E2F-1 expression (Lind et al., 1999; Vairo et al., 2000). These data are consistent with Bcl-2 acting in G0. In serum-induced and Myc-induced cell cycle entry of fibroblasts, cyclin D induction occurs normally in Bcl-2- or Bcl-xL-expressing cells, but cyclin D/cdk4 and cyclin E/cdk2 activities are markedly diminished in conjunction with significantly increased p27 in the cyclin E/cdk2 complexes (Greider et al., 2002). Similarly, in a liver regeneration model, Bcl-2 expression delayed S phase entry after the induction of cyclin D (Vail et al., 2002). These findings suggest that Bcl-2 prevents progression of events in G1.
Using Rat1 cells harboring the Myc–estrogen receptor fusion (MycER) and NIH 3T3 fibroblasts, we examined the ability of various Bcl-xL and Bcl-2 alleles, including Y28 mutants, to delay serum- or Myc-induced cell cycle entry in an effort to isolate the cell cycle effect from the anti-apoptosis function. Fibroblasts were chosen because serum deprivation and contact inhibition induce cell cycle arrest without significant apoptosis in these cells, allowing us to examine cell cycle regulation independent of survival selection. We also sought to distinguish whether prolonged G0 or lengthened G1 was responsible for the delay in reaching S phase in Bcl-2 or Bcl-xL cells by assaying RNA content and cell size.
Results
Y28F-Bcl-2 inhibited Myc-induced cell cycle entry and Myc-induced apoptosis
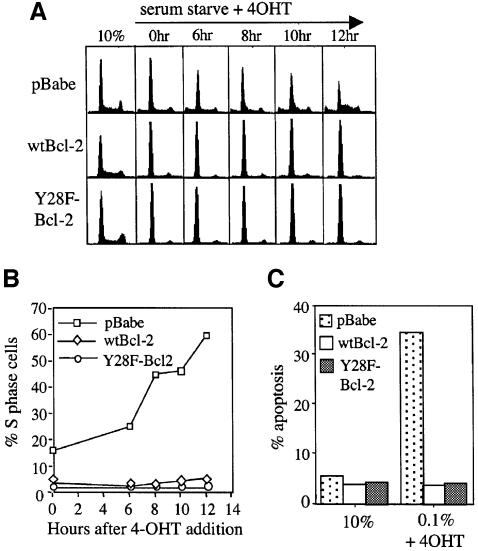
We tested the effects of Y28 mutations in Myc-induced cell cycle entry. Bcl-2 cDNAs encoding the wild-type or the Y28F allele were stably introduced into Rat1 cells harboring a 4-hydroxytamoxifen (4-OHT)-sensitive MycER fusion by retroviral infection. Bcl-2 protein expression levels in the pools were similar by western analysis (see Figure 3D). Rat1MycER cells containing pBabe vector, wild-type Bcl-2 (wtBcl-2), or Y28F-Bcl-2 were serum-starved for 3 days and then stimulated with the addition of 4-OHT. Following induction of MycER, pBabe control cells began to show a significant rise in S phase cells by 8 h. Cells expressing wtBcl-2 remained in G0/G1 even after 12 h, as reported previously (Greider et al., 2002). Surprisingly, cells expressing Y28F-Bcl-2 also exhibited no increase in S phase cells up to 12 h of MycER induction, exactly like wtBcl-2 cells (Figure 1A and B). Viability in 10% serum and in 0.05% serum plus 4-OHT showed that Y28F-Bcl-2 rescued Myc-induced apoptosis as efficiently as wtBcl-2, confirming that wtBcl-2 and Y28F-Bcl-2 proteins were functional in these cells (Figure 1C). In experiments using several different lines constructed on separate occasions, we found that the Y28F mutation did not diminish the ability of Bcl-2 to delay Myc-induced S phase entry.
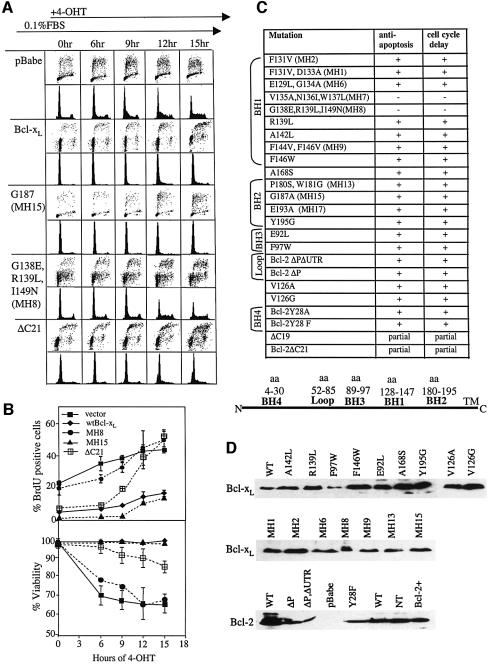
Fig. 3. Cell cycle delay co-segregated with anti-apoptosis in Bcl-xL and Bcl-2 mutants. Rat1MycER cells harboring retrovirally introduced Bcl-xL or Bcl-2 wild-type or mutant cDNAs were serum-starved and induced to enter the cell cycle by 4-OHT. (A) Cells were assayed by BrdU incorporation and/or PI/FACS analysis or after (0 h) serum starvation and at the indicated times after 4-OHT addition. BrdU/PI profiles for cells expressing pBabe vector alone, wtBcl-xL, and representative mutations that had no effect (G187A), significant effect (G138E,R139L,I149N) or partial effect (ΔC21) on the cell cycle delay activity of Bcl-xL are shown. (B) Percentages of BrdU-positive cells from (A) are plotted against duration of MycER induction (top). The percentages of cells with sub-G1 DNA content after MycER induction, normalized to 0 h, are plotted as apoptotic cells (bottom). (C) Results of all the mutants analyzed similarly are shown. ‘+’ denotes that the ability to inhibit MycER-induced apoptosis or MycER-induced cell cycle entry is similar to wt Bcl-xL or wt Bcl-2; ‘–’ denotes that the mutant construct is unable to rescue MycER-induced cell death or delay cell cycle entry. MH refers to mutations generated in Marie Hardwick’s laboratory (Cheng et al., 1996). (D) Western blotting was performed to compare expression of mutant proteins, using 100 µg of total protein and antibodies H5 (Santa Cruz) for Bcl-xL and 6C8 (PharMingen) for Bcl-2.
Fig. 1. Y28F-Bcl-2 inhibits Myc-induced cell cycle entry and Myc-induced apoptosis. Rat1MycER cells expressing pBabe/wtBcl-2, pBabe/Y28F-Bcl-2 or pBabe vector were cultured in αMEM media containing 0.05% FBS for 3 days, then 1 µM 4-OHT was added. (A) Cells were harvested before serum starvation (10%), after 3 days of serum starvation just prior to addition of 4-OHT (0 h) and at the indicated times after MycER induction, and cell cycle profiles were obtained by PI/FACS analysis. (B) Graph of the percentages of cells in S phase obtained from Modfit analysis of data points in (A). (C) Percentages of apoptotic cells as determined by PI exclusion assays are compared between asynchronously growing cells and cells that have been serum-starved and treated with 4-OHT. Data represent averages of two experiments. Similar results were obtained with Annexin V staining and measuring sub-G1 DNA content.
Y28F-Bcl-2 and Y28A-Bcl-2 delayed serum-induced cell cycle entry
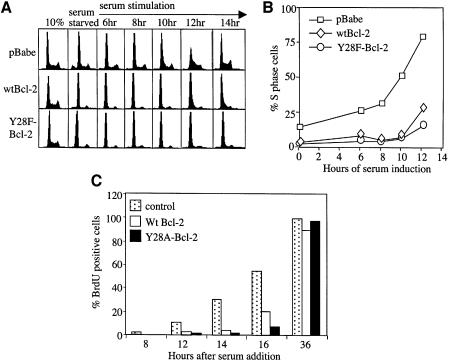
To confirm that S phase delay by Y28-Bcl-2 was a consistent effect and not a phenomenon peculiar to MycER induction, we arrested Rat1MycER cells expressing wtBcl-2 or Y28F-Bcl-2 by serum starvation, and stimulated cell cycle entry by the re-addition of 10% serum (Figure 2A and B). Control cells exhibited a synchronous increase in S phase cells beginning 8 h after serum addition, while cells expressing wtBcl-2 were blocked from S phase entry until 12 h, as expected. Cells expressing Y28F-Bcl-2 also did not begin to enter S phase until 12 h. The cell cycle profiles of Y28F-Bcl-2 cells were essentially identical to those of wtBcl-2 cells. Since NIH 3T3 was a cell line used in the original paper reporting the failure of Y28 mutations to delay cell cycle entry, we also expressed another allele of Y28, Y28A-Bcl-2, and wtBcl-2 cDNA in NIH 3T3 cells, and assayed serum-induced S phase entry by bromodeoxyuridine (BrdU) incorporation (Figure 2C). The ability of NIH 3T3 cells expressing Y28A-Bcl-2 to incorporate BrdU at sequential time points following serum stimulation was very similar to cells expressing wtBcl-2. In repeated experiments, we were unable to detect a difference in cell cycle kinetics between Bcl-2 mutated at Y28 and wtBcl-2.
Fig. 2. Y28F-Bcl-2 and Y28A-Bcl-2 delay serum-induced cell cycle entry. Rat1MycER cells were serum starved as in Figure 1, but were induced to re-enter the cell cycle by adding 10% FBS. (A) PI/FACS cell cycle profiles before serum starvation (10%), after serum starvation (0 h) and at the indicated times after serum addition are shown. (B) Graph of percentages of S phase cells by Modfit analysis of data from (A). (C) NIH 3T3 cells expressing wtBcl-2 or Y28A-Bcl-2 were serum-starved and released with 10% serum. The percentages of cells incorporating BrdU at the indicated times, normalized against control cells at 36 h, are shown. One of several representative experiments is shown.
The cell cycle delay activity of Bcl-xL co-segregated with anti-apoptotic activity
To investigate whether the cell cycle activity of Bcl-2 family members can be separated from their anti-apoptosis activity by mutation at other sites, we screened a number of existing Bcl-xL mutants (Figure 3). The mutants were obtained primarily from the laboratories of M.Hardwick (Cheng et al., 1996) and D.Hockenbery. The mutations tested spanned BH1, BH2, BH3, the ‘loop’ region and the C-terminus. Since it has already been shown that BH1 and BH2 mutations, which inactivated the anti-apoptosis activity of Bcl-2 and Bcl-xL, also abolished their cell cycle delay function (O’Reilly et al., 1996), we selected mutations that were more likely to preserve the anti-apoptosis activity. Some mutants were selected because they do not bind Bax or Bak but are still able to inhibit apoptosis (mutants F131V,D133A and G187A), while other mutants were designed on the basis of crystal structure. Each sequence-confirmed mutant cDNA was retrovirally introduced into Rat1MycER cells and selected as stable pools. Comparable expression of the alleles was confirmed by western blotting (Figure 3D). The individual cell lines were serum-starved and then treated with 4-OHT to induce MycER. At sequential time points, the percentage of S phase cells was assessed either by propidium iodide (PI) staining or by BrdU incorporation, or both; the percentage of apoptotic cells after MycER induction was assessed by Trypan Blue staining and sub-G1 DNA content (Figure 3A–C). Of nine BH1 mutants tested, the seven that were wild type for anti-apoptosis also delayed cell cycle entry. Of these, mutant F144V,F146V was reported to be defective in protection against Sindbis virus-induced apoptosis (Cheng et al., 1996), but it efficiently rescued MycER-induced cell death in our hands. Two BH1 mutants, V135A,N136I,W137L and G138E,R139L,I149N, which failed to rescue MycER-induced apoptosis and Sindbis virus-induced death (Cheng et al., 1996), also did not delay Myc-induced cell cycle entry. All four BH2 mutants and the nearby A168S allele inhibited both Myc-induced apoptosis and cell cycle entry, as did two BH3 mutants. Mutation in an interdomain region amino acid, V126G, but not V126A, disrupts binding to the BH3-only protein Bad (Kelekar et al., 1997). In our assays, the V126G and V126A mutants both protected against Myc-induced cell death and delayed Myc-induced cell cycle entry. C-terminal truncations of Bcl-xL (ΔC19) or Bcl-2 (ΔC21), which deleted the mitochondrial anchor domains, had slightly diminished inhibition of cell death and also a partial phenotype in cell cycle delay. BRK cells expressing Bcl-2 containing a deletion of amino acids between BH4 and BH1, termed the ‘loop’ region, exhibited continued proliferation following expression of p53, suggesting this region may negatively regulate cell growth (Uhlmann et al., 1996; Fang et al., 1998; Srivastava et al., 1999). We tested two Bcl-2 constructs with loop deletions constructed in Dr G.Chinnadurai’s laboratory, one contained a long 3′-untranslated region (Bcl-2ΔP) and the other did not (Bcl-2ΔPΔUTR) (Uhlmann et al., 1996). In both cases, Myc-induced apoptosis and Myc-induced cell cycle entry were inhibited. In summary, the cell cycle delay function could not be altered independently of the anti-apoptosis function in 24 mutants tested in our assays, including the previously reported Y28 BH4 mutation and the loop deletion.
Bcl-2 targeted to the endoplasmic reticulum and mitochondria delayed cell cycle entry
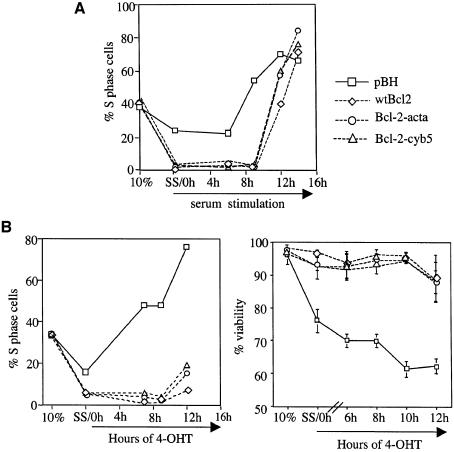
Bcl-2 protein is found in the mitochondrial outer membrane, endoplasmic reticulum (ER) and nuclear membrane. Extensive studies focus on the anti-apoptosis function of Bcl-2 at the mitochondria. Survival function of Bcl-2 targeted only to the mitochondrial outer membrane, by fusion with the targeting sequence from Listeria ActA protein (Bcl-2-acta), was not significantly affected (Zhu et al., 1996). However, when Bcl-2 was targeted only to the ER using the targeting sequence from cytochrome b5, selective protection against some apoptotic stimuli, but not others, was observed (Zhu et al., 1996; Lee et al., 1999). We tested ER- and mitochondrial-targeted Bcl-2 for cell cycle delay to ask whether this activity might be conferred by a particular subcellular localization of Bcl-2. Using Rat1MycER cell lines expressing wtBcl-2, Bcl-2-cyb5 (ER) or Bcl-2-acta, we assayed the rate of serum-stimulated and Myc-induced S phase entry (Figure 4). In both cases, ER- and mitochondrial-targeted Bcl-2 delayed progression to S phase similar to wtBcl-2. Cells expressing these constructs were also resistant to Myc-induced death, confirming that their anti-apoptosis activities were intact (Figure 4B). Thus far, subcellular targeting did not differentially affect the cell cycle and cell survival activities of Bcl-2.
Fig. 4. Bcl-2 targeted to the ER or the mitochondria outer membrane retains cell cycle delay activity. Rat1MycER cells expressing wtBcl-2, Bcl-2 fused with the ActA mitochondria targeting sequence (Bcl-2-acta), Bcl-2 fused with the ER-targeting sequence from cytochrome b5 (Bcl-2-cyb5) or pBH vector alone were cultured in 0.05% FBS for >48 h, then stimulated with (A) addition of 10% serum or (B) treatment with 1 µM 4-OHT. DNA content was measured by PI staining and FACS analysis. The percentages of S phase cells were obtained from Modfit program. Representative experiments are shown. Percent apoptosis was derived from PI exclusion assays. Standard deviations were obtained from three experiments. Similar results were obtained scoring Annexin V positivity and cells with sub-G1 DNA.
Bcl-2 and Bcl-xL prolonged G0 during induction of cell cycle entry
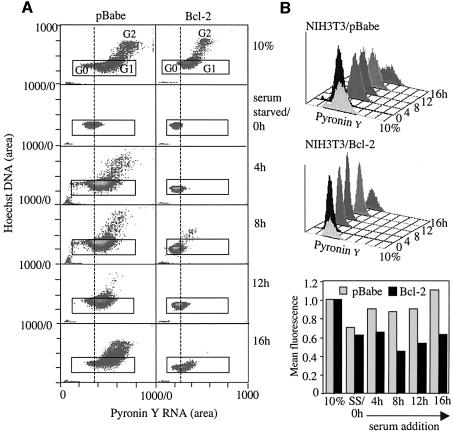
To determine whether the delay in reaching S phase was caused by inability to exit G0 or prolonged G1, we simultaneously stained control and Bcl-2 or Bcl-xL cells for RNA and DNA during arrest and release. Transition from G0 to G1 is accompanied by a significant increase in ribosomal RNA synthesis while DNA content remains the same (Polymenis and Schmidt, 1999; Stocker and Hafen, 2000). The fluorescent dye pyronin Y preferentially stains polyribosomal RNA, and an increase in pyronin Y fluorescence in cells with 2N DNA content indicates transition from G0 to G1 (Darzynkiewicz, 1994). NIH 3T3 expressing Bcl-2 or vector arrested by serum starvation and released by serum addition were stained with Hoechst for DNA content and with pyronin Y for RNA at 0, 4, 8, 12 and 16 h after serum stimulation, and analyzed by fluorescence activated cell sorting (FACS) (Figure 5). Pyronin Y fluorescence of cells gated on 2N DNA content was compared between samples. In both control and Bcl-2 cells, pyronin Y staining decreased significantly after serum starvation, consistent with arrest in G0. After serum stimulation, pyronin Y staining of control cells recovered by 4 h to almost baseline levels, indicating that transition from G0 to G1 had occurred. In contrast, Bcl-2 cells continued to have low pyronin Y staining at 4 and 8 h after serum addition, and only began to show a slight increase at 12 h. Low pyronin Y fluorescence reflects lack of initiation of rRNA synthesis, consistent with prolonged G0 phase in Bcl-2 cells. These results indicate that delayed S phase entry of Bcl-2 expressing cells during serum induction is associated with prolonged G0.
Fig. 5. Bcl-2 expression retains cells in G0 during serum-induced cell cycle entry. NIH 3T3 cells stably infected with pBabe (NIH 3T3/pBabe) or pBabeBcl-2 (NIH 3T3/Bcl-2) were arrested by culturing in media containing 0.5% serum for 72 h and released by adding 10% serum. Cells were collected at indicated times and stained with both Hoechst and pyronin Y for FACS analysis. (A) Dot-plot of Hoechst against pyronin Y fluorescence for cells before serum starvation (10%), after serum starvation (0 h) and at consecutive time points after serum re-addition. Populations of G0, G1 and G2 cells are indicated. The box gates on cells with 2N DNA content. (B) Histograms of pyronin Y fluorescence of Bcl-2 and controls cells gated for 2N DNA content from (A). (C) Comparison of mean pyronin Y fluorescence of Bcl-2 and control cells with 2N DNA content from (A).
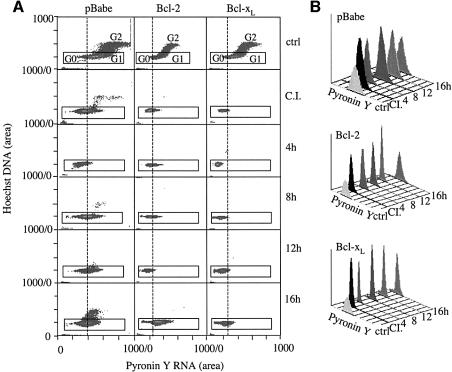
To assess G0 to G1 transition in another model of cell cycle entry, we allowed Bcl-2, Bcl-xL and vector control cells to reach confluence and contact inhibition, then re-plated them at low density to stimulate cell cycle progression (Figure 6). Decreased pyronin Y fluorescence indicated that all cells reached G0 after culturing in confluence for 3 days. Control cells regained RNA staining by 8 h after release. However, pyronin Y staining of Bcl-2 and Bcl-xL cells remained low, and distinct shifts in the pyronin Y fluorescence peaks did not occur until 16 h. These findings using RNA content as a marker for G0 versus G1 suggested that Bcl-2 and Bcl-xL expression retained cells in G0.
Fig. 6. Bcl-2 and Bcl-xL prolong G0 during induction of cell cycle entry after release from contact inhibition. Retrovirally infected NIH 3T3 cells stably expressing Bcl-2, Bcl-xL, or pBabe vector were arrested by contact inhibition and released by replating at low density. (A) Cells were stained with Hoechst and pyronin Y for FACS analysis in subconfluent cultures (ctrl), after contact inhibition (C.I.), and at the indicated times after replating in low density. (B) Histograms of pyronin Y fluorescence of cells gated for 2N DNA content from (A).
Effects of Bcl-xL on cell size and RNA content during cell cycle arrest and entry were reversed by Bad
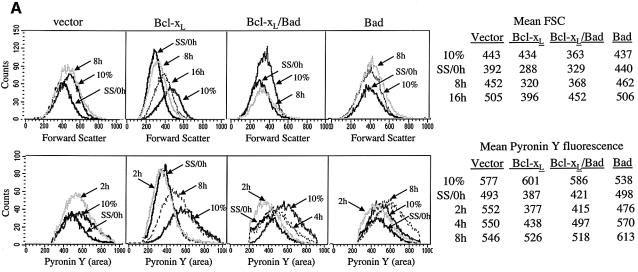
Forward scatter (FSC) of cells gated for 2N DNA content measures cell size of the G0 and G1 population. G0 cells are smaller than G1 cells, and an increase in FSC is an indication of cell growth that occurs in G0 to G1 transition. FSC and pyronin Y fluorescence of NIH 3T3 cells expressing Bcl-xL or vector were compared in serum-induced cell cycle entry (Figure 7A). FSC of both control and Bcl-xL cells decreased after serum starvation, but mean FSC for Bcl-xL cells decreased by 34% (from 434 to 288) while mean FSC for pBabe cells decreased only by 12% (from 443 to 392). By 8 h after serum stimulation, FSC for controls returned to the baseline (452), but FSC for Bcl-xL cells had only minimally increased at this time (from 288 to 320). FSC for Bcl-xL cells reached 90% of baseline (396 versus 434) at 16 h after serum stimulation. Therefore, serum-stimulated increase in cell size was delayed by at least 8 h in Bcl-xL cells (Figure 7A, top panel).
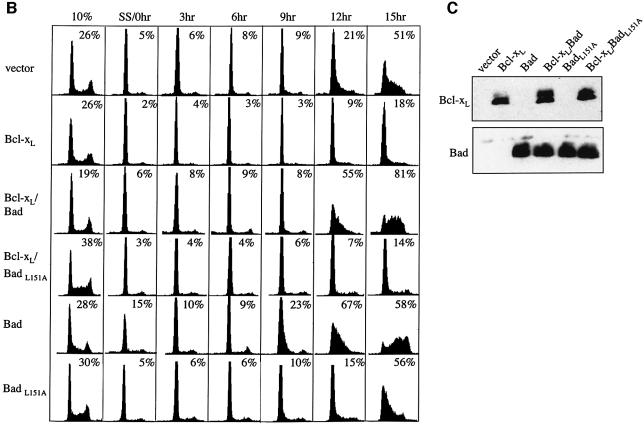
Fig. 7. Bad reverses the delay of cell size and RNA increases, and the delay of S phase progression by Bcl-xL. NIH 3T3 cells expressing Bcl-xL, Bad and Bcl-xL, BadL151A and Bcl-xL, Bad alone, BadL151A alone, or vector alone were arrested by serum starvation and released by serum addition. Cells were stained for Hoechst and pyronin Y as in Figures 5 and 6. [(A), top] FSC of cells gated for 2N DNA content at selected time points are compared. Mean FSC channel are compared between cell lines in tabular form. [(A), bottom] Mean pyronin Y fluorescence of cells gated for 2N DNA at selected time points are compared. (B) Cell cycle profiles of cells arrested by serum starvation and released by serum addition, and the percentage of S phase cells at each time point are shown. (C) Western blot Bcl-xL and Bad expression in the indicated cell lines, using 250 000 cells per lane, the antibodies 2A1 for Bcl-xL and 10929 for BAD.
Likewise, pyronin Y fluorescence in pBabe cells decreased by 15% following serum starvation (from 577 to 493), but by 36% in Bcl-xL cells (from 601 to 387). Strikingly, by 2 h after serum addition, pyronin Y fluorescence mostly recovered in control cells (552 versus 577), indicating initiation of RNA synthesis and transition to G1. Pyronin Y fluorescence did not change in Bcl-xL cells until 8 h after addition of serum, indicating a delay of at least 6 h (Figure 7A, bottom panel). Pyronin Y fluorescence increased before FSC increase, which is as expected, because RNA and protein synthesis must precede accumulation of cell mass. These data show that in serum starvation, Bcl-xL cells become smaller and have less RNA than controls, and take longer to increase cell size and RNA content during serum stimulation, consistent with delayed G0 to G1 transition.
The pro-apoptotic member of the Bcl-2 family, Bad, heterodimerizes with Bcl-xL and Bcl-2 through its BH3 domain and inactivates the pro-survival function of Bcl-2 and Bcl-xL (Yang et al., 1995; Kelekar et al., 1997). To further assess the relationship between the effect of Bcl-xL on G0 to G1 transition and its effect on cell death inhibition, we examined cell size and RNA content in cells expressing both Bcl-xL and Bad. Western analysis documented that expression of Bcl-xL was not noticeably affected by the presence of Bad (Figure 7C). In contrast to Bcl-xL cells, serum starvation of cells expressing both Bcl-xL and Bad resulted in a minimal decrease in FSC (from 363 to 329), which recovered completely by 8 h (368) (Figure 7A, top panel). The FSC pattern in serum starvation and release of Bcl-xL/Bad cells is identical to the pattern in control cells, indicating that the expression of Bad completely reversed the effect of Bcl-xL on cell size.
The pattern of pyronin Y staining in Bcl-xL/Bad cells was intermediate between that of controls and Bcl-xL cells (Figure 7A, bottom panel). Pyronin Y fluorescence in Bcl-xL/Bad cells decreased by 25% after serum starvation (from 586 to 421), compared with 15% in controls and 36% in Bcl-xL cells. Bcl-xL/Bad cells also had increased RNA content by 4 h, which is sooner than Bcl-xL cells but not as quickly as control cells. These data indicate that in addition to reversing the effect of Bcl-xL on cell size, Bad also negatively influences the ability of Bcl-xL to inhibit initiation of RNA synthesis during G0 to G1 transition. Cell cycle profiles (Figure 7B) and BrdU incorporation (data not shown) consistently showed that Bcl-xL/Bad cells reach S phase at the same rate or faster than controls, indicating reversal of Bcl-xL-mediated cell cycle delay by Bad. Moreover, expression of BADL151A, a BH3 mutant that does not bind Bcl-xL and Bcl-2 (Chattopadhyay et al., 2001), had no effect on the ability of Bcl-xL to delay the onset of S phase as assessed by PI staining (Figure 7B) or BrdU analysis. This demonstrates that modulation of the cell cycle function of Bcl-xL by Bad is dependent on interaction with Bcl-xL.
Since BAD expression counteracted the effects of Bcl-xL on G0 to G1 transition, we examined the effect of Bad alone. No change in FSC (437 versus 440) and minimal change (538 versus 498) in pyronin Y staining occurred in serum-starved cells expressing Bad (Figure 7A, top panel). This is consistent with our previous report that cells expressing Bad fail to arrest effectively in G0/G1 (Chattopadhyay et al., 2001). We noticed that pyronin Y fluorescence in Bad cells increased more quickly than control cells to a level higher than cultures grown in 10% serum (Figure 7A, bottom panel), suggesting that traverse to S phase was accelerated. This was confirmed by cell cycle profiles during serum induction showing that 67% of cells expressing BAD were in S phase by 12 h, while only 21% of pBabe control cells reached S phase at that time (Figure 7B). The shortened interval to S phase in BAD expressing cells can be explained by bypass of G0 to G1 transition or shortened G1. This effect was absent in cells expressing the BADL151A mutant, consistent with our previous report that the cell cycle effect of Bad requires interaction with Bcl-xL (Chattopadhyay et al., 2001). These experiments demonstrated that a molecule known to inhibit the anti-apoptotic function of Bcl-xL also inhibited the cell cycle activities of Bcl-xL, further supporting the hypothesis that the cell cycle effects are direct results of Bcl-xL expression.
Bcl-xL expression enhanced G0 arrest
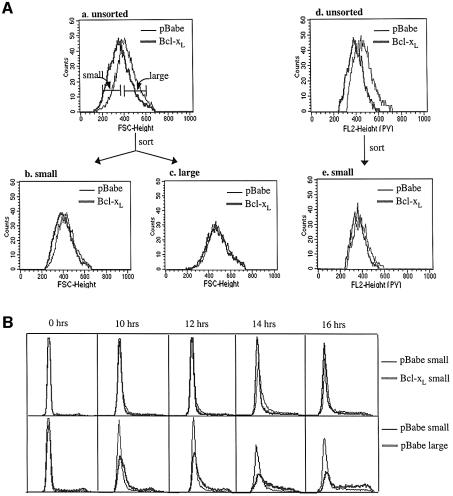
Cell size and RNA staining data showed that Bcl-2 or Bcl-xL expression either caused more cells to arrest in G0, or caused cells to arrest at a smaller size with less RNA. In order to compare cell cycle entry kinetics of cell populations that are comparable in states of arrest, we isolated contact inhibited control cells that were similar to Bcl-xL cells in size and measured their rates of S phase entry (Figure 8). Control and Bcl-xL cells were sorted by FSC into small and large populations (Figure 8A, a). Re-analysis of the sorted cells by FSC (Figure 8A, b) and Pyronin Y staining (Figure 8A, e), as well as PI staining (Figure 8B, 0 hr), confirmed that the sorting procedure successfully isolated small pBabe cells very similar to small Bcl-xL cells. They were not identical because the sorted small Bcl-xL population was skewed toward lower FSC and the sorted small pBabe population was skewed toward higher FSC. Sorted pBabe and Bcl-xL cells were released from cell cycle arrest and followed for entry into S phase. Overlays of the DNA profiles of small pBabe and small Bcl-xL cells showed similar progression to S phase (Figure 8B, top panel). However, there was a significant difference between small and large pBabe cells (Figure 8B, lower panel). The small control cells entered cell cycle slowly, more similar to Bcl-xL cells than large control cells. Furthermore, the delay in the total BCL-xL population was recapitulated in the overlays of the DNA profiles of small and large control cells, illustrating that the time to S phase correlated to the state of G0 of the starting population. A small but distinct difference in S phase entry was repeatedly observed between small pBabe and small Bcl-xL populations (Figure 8B, top), suggesting that, in addition to more effective G0 arrest, inhibition of G1 progression may also be a component of the cell cycle function of Bcl-xL. These experiments indicate that the ability of Bcl-2 and Bcl-xL to accentuate cell cycle exit constitutes a significant mechanism of cell cycle delay by Bcl-2 and Bcl-xL.
Fig. 8. Enhanced G0 arrest contributes significantly to cell cycle delay. (A) FSC profiles of contact inhibited NIH 3T3 cells expressing Bcl-xL or vector were compared (a) and cells were sorted by FSC into ‘small’ and ‘large’ populations. Markers indicate the FSC windows used for sorting. The result of sorting was checked by re-analyzing FSC and pyronin Y staining of the sorted cells. FSC of sorted small cells (b) and large cells (c), and pyronin Y fluorescence of sorted small cells (e) were overlayed to confirm that the sorted pBabe and Bcl-xL cells were comparable. Pyronin Y fluorescence of unsorted pBabe and Bcl-xL cells is also shown for comparison (d). (B) Sorted small and large cells were replated at low density, collected at the times indicated, and analyzed by PI/FACS. Small pBabe and small Bcl-xL cells were compared by overlaying DNA profiles (top panel). DNA profiles of small and large pBabe cells were compared with each other (lower panel). The profiles shown are from one representative experiment among several.
Discussion
We embarked on a mutation analysis to determine the relationship between cell cycle control and apoptosis regulation by Bcl-2 and Bcl-xL. Surprisingly, we were unable to detect a difference between Bcl-2 mutated at Y28 and wild-type Bcl-2 in survival or in cell cycle delay. Our finding differs from the published report that Y28 mutation abolished the cell cycle effect of Bcl-2 while preserving its anti-apoptosis function (Huang et al., 1997). We have tested two Y28 mutations, Y28F and Y28A, the cDNAs of which originated in the laboratory of the original report and have been confirmed by sequencing. Our results using tissue culture cells are corroborated by similar findings in transgenic mice expressing Y28A-Bcl-2, (N.Cheng and C.M.Knudson, manuscript submitted). When another group mutated the equivalent residue in Bcl-xL, Y22F, in conjunction with two other mutations, Q26N and R165K, the resultant molecule Bcl-xFNK was found to be a ‘super anti-apoptotic’ factor (Asoh et al., 2000), but its anti-proliferative activity was not assessed. Interestingly, the Y28-Bcl-2 mutants consistently performed better than wtBcl-2 in our survival and cell cycle assays, although the differences were too small to be readily quantifiable. Nonetheless, this argues that the differences between the previously reported results and those described here are not minor quantitative differences. Since the Y28 residue is the only site so far reported to separate the survival function from the cell cycle function, and none of the 22 additional mutations we screened here uncoupled the two activities, we conclude that evidence to date indicate that the anti-apoptosis and cell cycle delay functions of Bcl-2 and Bcl-xL can not be independently altered.
Because no mutations had been found that were defective in survival but competent in cell cycle delay, the conclusion was drawn that the cell cycle delay function was dependent on an intact anti-apoptosis function (Huang et al., 1997). Co-segregation of cell death inhibition and S phase delay in all mutants reported here is in agreement with that conclusion. However, we recently reported that Bcl-2 inhibited E2F-1-induced apoptosis but not E2F-1-induced cell cycle entry (Greider et al., 2002), illustrating that cell cycle delay is not an inevitable consequence of enhanced survival. Bcl-2 and Bcl-xL elevate p27 during G0 arrest and inhibit G1 cdks during cell cycle re-entry, thus delaying progression to S phase (Vairo et al., 2000; Greider et al., 2002). Because activation of E2F-1 is downstream of cdks, E2F-1-induced cell cycle entry would not be expected to be inhibitable by Bcl-2 or Bcl-xL. The fibroblast experiments reported here utilized conditions in which serum deprivation and contact inhibition led to cell cycle arrest but not significant apoptosis. Consistently, Vairo and colleagues found that Bcl-2 accelerated cell cycle arrest in HL60 cells at concentrations of DMSO that did not kill control cells, leading to their conclusion that the cell cycle function of Bcl-2 was not a result of its survival function (Vairo et al., 1996). In that study, Bcl-2 cells exited the cell cycle more quickly, but the final RNA content was not different from control cells. We found that cells expressing Bcl-xL reached a smaller size with less RNA content than controls during a defined time period of arrest. This is in agreement with the finding that T cells expressing transgenic Bcl-2 are smaller and contain less RNA than wild-type T cells (N.Cheng and C.M.Knudson, submitted). Our data suggest that in addition to promoting G0 through an age-dependent survival advantage, Bcl-2 and Bcl-xL also directly enhance G0 arrest. We favor the hypothesis that anti-apoptosis and cell cycle delay both result from the same biochemical function of Bcl-2 and Bcl-xL. Therefore, disrupting the intrinsic activity of Bcl-2 or Bcl-xL would abolish both the survival and cell cycle effects.
Our results from targeting constructs of Bcl-2 are consistent with this hypothesis. These studies revealed that targeting Bcl-2 or Bcl-xL to a subcellular membrane site preserved the cell cycle delay function, and that full activity of both anti-apoptosis and cell cycle delay required a membrane site. Whereas C-terminal deletions of Bcl-2 led to variable anti-apoptotic activity depending on the death stimulus (Borner et al., 1994; Nguyen et al., 1994), in our hands the Bcl-xLΔC19 and the Bcl-2ΔC21 constructs partially prevented Myc-induced cell death and intermediately delayed S phase entry. The requirement for subcellular membrane sites for cell cycle delay is consistent with the hypothesis that cell cycle delay is a result of the biochemical activity of Bcl-2 and Bcl-xL.
Using increases of cell size and RNA content as indicators of transition into G1 from G0, we were able to determine that the S phase delay in Bcl-2 or Bcl-xL cells was mainly due to prolonged G0, rather than G1. Prolongation of G0 is consistent with Bcl-2 and Bcl-xL cells exhibiting elevation of p27 (Linette et al., 1996; Vairo et al., 2000; Greider et al., 2002) and p130 (Lind et al., 1999; Vairo et al., 2000), both of which function in G0.
We found that the decreases in cell size and RNA content during cell cycle arrest were greater in Bcl-2 and Bcl-xL cells than controls. Using the criterion that the expression of Myc and cyclin D are both switched off in G0, we found that control cells as well as Bcl-2 or Bcl-xL cultures were arrested in G0 (Greider et al., 2002; data not shown). Our data suggest that the observed difference in G0–G1 transit reflects different states of G0 arrest between Bcl-2 or Bcl-xL cells and controls. Indeed, when comparable control and Bcl-xL cells isolated by FACS sorting were followed, the difference in cell cycle entry was greatly diminished, confirming that the delay to S phase was, in large part, due to the Bcl-xL population being arrested further into G0. The small but reproducible delay in the sorted small Bcl-xL cells compared with small control cells may be because the populations are not truly identical in their state of arrest even after sorting, but we cannot rule out the possibility of a direct inhibitory effect of Bcl-2 or Bcl-xL on G0 to G1 transition. The results of our sorting experiment suggest that a major mechanism for the observed delay in cell cycle entry by Bcl-2 or Bcl-xL is more effective G0 arrest.
The mechanism of enhanced G0 arrest in Bcl-xL and Bcl-2 cells is not clear. In growth factor withdrawal, Bcl-xL is able to support ADP/ATP exchange and maintain cellular ATP levels despite decreased metabolism, thus preventing cell death (Vander Heiden et al., 1999; Plas et al., 2001; Plas and Thompson, 2002). During cell cyle arrest, Bcl-xL expression may allow cells to reach a lower metabolic state by similar mechanisms.
Reversal of the cell cycle effects of Bcl-xL by Bad, which also counters the anti-apoptosis function of Bcl-xL by direct binding, is consistent with the hypothesis that both the cell cycle and survival functions are intrinsic to Bcl-xL. The finding that Bad expression alone resulted in even less effective G0 arrest and faster S phase entry than controls supports the notion that influences on cell cycle kinetics by members of the Bcl-2 family are not necessarily secondary to apoptosis, but can be parallel functions of this family of apoptosis regulators.
Timely induction of early genes Fos, Jun and Myc in Bcl-2 or Bcl-xL cells during stimulation of cell cycle entry have been shown (Linette et al., 1996). We have also reported normal induction of cyclin D but marked inhibition of G1 cdks, and elevation of p27 in MycER- and serum-induced Bcl-xL and Bcl-2 cells (Greider et al., 2002). Induction of Myc and induction of cyclin D have been used as markers of G0 exit and G1 entry, but high p27 indicates maintenance of G0. Thus, existing data would suggest that the cell cycle activity of Bcl-2 and Bcl-xL is in both G1 and G0. Results presented here focus the mechanism of Bcl-2 and Bcl-xL more in G0. A model encompassing existing observations would be that upon cell cycle stimulation, the early molecular signals for G0 to G1 transition are activated but the signals are not fully executed in cells driven into G0 by Bcl-xL or Bcl-2. Therefore, entry into G1, as measured by ribosomal biogenesis and increase in cell mass, is delayed. The delay in these cell growth processes may be related to the activity of Bcl-xL and Bcl-2 at the subcellular membrane sites. Our data thus far are consistent with the model that a common activity of Bcl-xL or Bcl-2 leads to three cellular phenotypes: increased survival, enhancd cell cycle arrest and delayed cell cycle entry.
Materials and methods
Cell culture and constructs
Rat1MycER cells harboring Bcl-xL or Bcl-2 alleles were grown in Dulbecco’s modified Eagle’s medium (DMEM) with 10% fetal calf serum supplemented with 2 mM glutamine and 100 U/ml penicillin/streptomycin. MycER was induced by the addition of 4-OHT (Calbiochem) to a final concentration of 1 µM. NIH 3T3 cells were cultured in DMEM with 10% calf serum.
Bcl-xL and Bcl-2 constructs in pBabe or pMSCV (Clontech) vectors were stably introduced into Rat1MycER and NIH 3T3 cells by retroviral infection and selection with puromycin (4 µg/ml). Nine Bcl-xL mutant cDNAs (MH) were obtained from Dr Marie Hardwick’s laboratory (Cheng et al., 1996). Seven Bcl-xL mutants were obtained from Dr David Hockenbery’s laboratory: R139L, F146W, A142L, A168S, Y195G, E92L and F97W. The ‘loop’ deletion Bcl-2 mutants were constructed in Dr G.Chinnadurai’s laboratory (Uhlmann et al., 1996). The V126G and V126A Bcl-xL mutants were from Dr A.Kelekar (Kelekar et al., 1997). The Y28F-Bcl-2 and Y28A-Bcl-2 cDNAs originated in Dr David Huang’s laboratory (Huang et al., 1997). All mutations were confirmed by sequencing.
ER- and mitochondria-targeted mutants were constructed as described previously (Zhu et al., 1996). cDNAs constructs were subcloned into the retroviral vector pMNiresGFP and packaged in Pheonix Eco cell line. Rat1MycERtm cells were infected with viral supernatants in the presence of 8 µg/ml polybrene (Sigma) and selected by FACS to collect cells expressing the GFP protein from the internal ribosomal entry sequence (ires) within the provirus of infected cells. All cell lines were maintained in Dulbecco’s H21 media with 10% calf serum. Similar protein expression levels and proper localization of the ectopic constructs were verified by immunoblotting and immunofluorescence.
Cell cycle analysis
Cells were seeded into six-well dishes. The next day, cells were washed three times with phosphate-buffered saline (PBS) and switched to media containing 0.05% fetal bovine serum (FBS) for Rat1MycER cells or 0.5% calf serum for NIH 3T3 cells. After 48–72 h, Rat1MycER cells were stimulated with either 4-OHT or 10% serum. At indicated times, cells were harvested and resuspended in Krishan’s reagent (0.1 mg/ml propidium iodide, 0.02 mg/ml RNase A, 0.3% NP-40 and 0.1% Na citrate) and analyzed on a FACSCalibur flow cytometer (Becton Dickinson).
For contact inhibition, cells were plated at 5 × 10⁶/10 cm plate and allowed to reach confluence for 4 days.
For BrdU incorporation, cells were seeded into 10 cm dishes. At indicated times, 20 µM BrdU was added to the media for 30 min. Cells were then harvested and fixed in ice-cold 70% ethanol, treated with 4 N HCl, neutralized by 0.1 M borax, washed with PBS containing 0.05% bovine serum albumin (BSA), and incubated sequentially with anti-BrdU antibody (Becton Dickinson) and FITC-conjugated anti-mouse secondary antibody (Sigma) in the presence of 0.5% BSA and 0.5% Tween-20. Cells were resuspended in PBS containing propidium iodide and RNase A and analyzed by FACS. Data were analyzed using Cell Quest and Modfit software.
Cell death assays
For PI exclusion, cultures were resuspended in 100 µg/ml propidium iodide and analyzed by FACS. Small PI-positive cells were scored as apoptotic cells, and large PI-negative cells were scored as live cells.
For Annexin V binding of apoptotic cells, cells were resuspended in binding buffer (10 mM HEPES/NaOH pH 7.4, 140 mM NaCl, 2.5 mM CaCl2), and phycoerythrin-conjugated Annexin V (R&D Systems) was added according to the manufacture’s directions.
Western blotting
Cell lysates were electrophoresed on 12.5% SDS–PAGE, transferred to PVDF membrane, and immunoblotted using 2A1 antibody for Bcl-xL (gift from Dr Lawrence Boise), polyclonal 10929 for Bad (gift from Dr Stanley Korsmeyer) and 6C8 for Bcl-2 (PharMingen).
Fluorescence labeling of DNA and RNA
Simultaneous Hoechst and pyronin Y staining was performed according to the protocol of Darzynkiewicz (1994). Cells were harvested and resuspended in one part cold saline GM (1.1 g/l glucose, 8 g/l NaCl, 0.4 g/l KCl, 0.39 g/l Na2HPO4, 0.15 g/l KH2PO4, 0.5 mM EDTA) and three parts 100% cold ethanol. After fixation, cells were first resuspended in 0.25 ml saline GM containing 1 µg/ml Hoechst (Polysicences, Inc.), then 0.25 ml saline GM containing 2 µg/ml pyronin Y (Polysciences, Inc.) was added to make ∼106 cells/ml. Samples were analyzed on a FACSTAR Plus flow sorter (Becton Dickinson). Hoechst was excited with the UV line of an Enterprise laser, and pyronin Y was excited with the 488 line of the same laser. Hoechst emission was collected with a 424/44 dichroic filter, and pyronin Y fluorescence was collected with a 575/26 dichroic filter.
For 7AAD and pyronin Y staining, 1.25 µg/ml of 7AAD (BD PharMingen) was added instead of Hoechst. Samples were analyzed on a FACSCalibur (Becton Dickinson). 7AAD fluorescence was collected in FL3, and pyronin Y staining was collected in FL2.
Cell sorting
Contact inhibited cells were collected in PBS at 5 × 10⁶ cells/ml and sorted based on forward scatter on a FACSTAR Plus flow sorter. The effectiveness of sorting was checked by re-analyzing the sorted cells for FSC and pyronin Y staining.
Acknowledgments
Acknowledgements
We are grateful to Ms Catherine Allen of the Vanderbilt VA Flow Cytometry Resource Center for her expert assistance with sorting experiments. We thank Drs Marie Hardwick, David Hockenbery and G.Chinnadurai for supplying Bcl-xL and Bcl-2 mutant cDNAs. We thank Dr David Hockenbery for discussions and critical reading of the manuscript. Y.M.J. is supported in part by NIH training grant T32GM08554. C.M.K. is a Charles E. Culpeper Medical Scholar and the work was supported in part by the Rockefeller Brothers Fund and Grant IN-122T from the American Cancer Society (to C.M.K.). This project was also supported by NIH grant 1RO1CA78443 (to E.Y.) and 1RO1CA88967 (to C.M.K.).
References
- Asoh S., Ohtsu,T. and Ohta,S. (2000) The super anti-apoptotic factor Bcl-xFNK constructed by disturbing intramolecular polar interactions in rat Bcl-xL. J. Biol. Chem., 275, 37240–37245. [DOI] [PubMed] [Google Scholar]
- Borner C., Martinou,I., Mattmann,C., Irmler,M., Schaerer,E., Martinou,J.C. and Tschopp,J. (1994) The protein bcl-2 alpha does not require membrane attachment, but two conserved domains to suppress apoptosis. J. Cell Biol., 126, 1059–1068. [DOI] [PMC free article] [PubMed] [Google Scholar]
- Brady H.J., Gil-Gomez,G., Kirberg,J. and Berns,A.J. (1996) Bax alpha perturbs T cell development and affects cell cycle entry of T cells. EMBO J., 15, 6991–7001. [PMC free article] [PubMed] [Google Scholar]
- Chattopadhyay A., Chiang,C.W. and Yang,E. (2001) BAD/BCL-XL heterodimerization leads to bypass of G0/G1 arrest. Oncogene, 20, 4507–4518. [DOI] [PubMed] [Google Scholar]
- Cheng E.H., Levine,B., Boise,L.H., Thompson,C.B. and Hardwick,J.M. (1996) Bax-independent inhibition of apoptosis by Bcl-XL. Nature, 379, 554–556. [DOI] [PubMed] [Google Scholar]
- Cheng E.H., Kirsch,D.G., Clem,R.J., Ravi,R., Kastan,M.B., Bedi,A., Ueno,K. and Hardwick,J.M. (1997) Conversion of Bcl-2 to a Bax-like death effector by caspases. Science, 278, 1966–1968. [DOI] [PubMed] [Google Scholar]
- Darzynkiewicz Z. (1994) Simultaneous analysis of cellular RNA and DNA content. Methods Cell Biol., 41, 401–420. [DOI] [PubMed] [Google Scholar]
- de La Coste A., Mignon,A., Fabre,M., Gilbert,E., Porteu,A., Van Dyke,T., Kahn,A. and Perret,C. (1999) Paradoxical inhibition of c-myc-induced carcinogenesis by Bcl-2 in transgenic mice. Cancer Res., 59, 5017–5022. [PubMed] [Google Scholar]
- Fang G., Chang,B.S., Kim,C.N., Perkins,C., Thompson,C.B. and Bhalla,K.N. (1998) “Loop” domain is necessary for taxol-induced mobility shift and phosphorylation of Bcl-2 as well as for inhibiting taxol-induced cytosolic accumulation of cytochrome c and apoptosis. Cancer Res., 58, 3202–3208. [PubMed] [Google Scholar]
- Furth P.A., Bar-Peled,U., Li,M., Lewis,A., Laucirica,R., Jager,R., Weiher,H. and Russell,R.G. (1999) Loss of anti-mitotic effects of Bcl-2 with retention of anti-apoptotic activity during tumor progression in a mouse model. Oncogene, 18, 6589–6596. [DOI] [PubMed] [Google Scholar]
- Greider C., Chattopadhyay,A., Parkhurst,C. and Yang,E. (2002) Bcl-xL and Bcl2 delay Myc-induced cell cycle entry through elevation of p27 and inhibition of G1 cyclin-dependent kinases. Oncogene, 21, 7765–7775. [DOI] [PubMed] [Google Scholar]
- Ho A. and Dowdy,S.F. (2002) Regulation of G1 cell-cycle progression by oncogenes and tumor suppressor genes. Curr. Opin. Genet. Dev., 12, 47–52. [DOI] [PubMed] [Google Scholar]
- Huang D.C., O’Reilly,L.A., Strasser,A. and Cory,S. (1997) The anti-apoptosis function of Bcl-2 can be genetically separated from its inhibitory effect on cell cycle entry. EMBO J., 16, 4628–4638. [DOI] [PMC free article] [PubMed] [Google Scholar]
- Huang D.C., Adams,J.M. and Cory,S. (1998) The conserved N-terminal BH4 domain of Bcl-2 homologues is essential for inhibition of apoptosis and interaction with CED-4. EMBO J., 17, 1029–1039. [DOI] [PMC free article] [PubMed] [Google Scholar]
- Kelekar A., Chang,B.S., Harlan,J.E., Fesik,S.W. and Thompson,C.B. (1997) Bad is a BH3 domain-containing protein that forms an inactivating dimer with Bcl-XL. Mol. Cell. Biol., 17, 7040–7046. [DOI] [PMC free article] [PubMed] [Google Scholar]
- Lee S.T., Hoeflich,K.P., Wasfy,G.W., Woodgett,J.R., Leber,B., Andrews,D.W., Hedley,D.W. and Penn,L.Z. (1999) Bcl-2 targeted to the endoplasmic reticulum can inhibit apoptosis induced by Myc but not etoposide in Rat-1 fibroblasts. Oncogene, 18, 3520–3528. [DOI] [PubMed] [Google Scholar]
- Lind E.F., Wayne,J., Wang,Q.Z., Staeva,T., Stolzer,A. and Petrie,H.T. (1999) Bcl-2-induced changes in E2F regulatory complexes reveal the potential for integrated cell cycle and cell death functions. J. Immunol., 162, 5374–5379. [PubMed] [Google Scholar]
- Linette G.P., Li,Y., Roth,K. and Korsmeyer,S.J. (1996) Cross talk between cell death and cell cycle progression: BCL-2 regulates NFAT-mediated activation. Proc. Natl Acad. Sci. USA, 93, 9545–9552. [DOI] [PMC free article] [PubMed] [Google Scholar]
- Mazel S., Burtrum,D. and Petrie,H.T. (1996) Regulation of cell division cycle progression by bcl-2 expression: a potential mechanism for inhibition of programmed cell death. J. Exp. Med., 183, 2219–2226. [DOI] [PMC free article] [PubMed] [Google Scholar]
- Murphy K.L., Kittrell,F.S., Gay,J.P., Jager,R., Medina,D. and Rosen,J.M. (1999) Bcl-2 expression delays mammary tumor development in dimethylbenz(a)anthracene-treated transgenic mice. Oncogene, 18, 6597–6604. [DOI] [PubMed] [Google Scholar]
- Nguyen M., Branton,P.E., Walton,P.A., Oltvai,Z.N., Korsmeyer,S.J. and Shore,G.C. (1994) Role of membrane anchor domain of Bcl-2 in suppression of apoptosis caused by E1B-defective adenovirus. J. Biol. Chem., 269, 16521–16524. [PubMed] [Google Scholar]
- O’Reilly L.A., Huang,D.C. and Strasser,A. (1996) The cell death inhibitor Bcl-2 and its homologues influence control of cell cycle entry. EMBO J., 15, 6979–6990. [PMC free article] [PubMed] [Google Scholar]
- Plas D.R. and Thompson,C.B. (2002) Cell metabolism in the regulation of programmed cell death. Trends Endocrinol. Metab., 13, 75–78. [DOI] [PubMed] [Google Scholar]
- Plas D.R., Talapatra,S., Edinger,A.L., Rathmell,J.C. and Thompson,C.B. (2001) Akt and Bcl-xL promote growth factor-independent survival through distinct effects on mitochondrial physiology. J. Biol. Chem., 276, 12041–12048. [DOI] [PubMed] [Google Scholar]
- Polymenis M. and Schmidt,E.V. (1999) Coordination of cell growth with cell division. Curr. Opin. Genet. Dev., 9, 76–80. [DOI] [PubMed] [Google Scholar]
- Srivastava R.K., Mi,Q.S., Hardwick,J.M. and Longo,D.L. (1999) Deletion of the loop region of Bcl-2 completely blocks paclitaxel-induced apoptosis. Proc. Natl Acad. Sci. USA, 96, 3775–3780. [DOI] [PMC free article] [PubMed] [Google Scholar]
- Stocker H. and Hafen,E. (2000) Genetic control of cell size. Curr. Opin. Genet. Dev., 10, 529–535. [DOI] [PubMed] [Google Scholar]
- Uhlmann E.J., D’Sa-Eipper,C., Subramanian,T., Wagner,A.J., Hay,N. and Chinnadurai,G. (1996) Deletion of a nonconserved region of Bcl-2 confers a novel gain of function: suppression of apoptosis with concomitant cell proliferation. Cancer Res., 56, 2506–2509. [PubMed] [Google Scholar]
- Vail M.E., Pierce,R.H. and Fausto,N. (2001) Bcl-2 delays and alters hepatic carcinogenesis induced by transforming growth factor alpha. Cancer Res., 61, 594–601. [PubMed] [Google Scholar]
- Vail M.E., Chaisson,M.L., Thompson,J. and Fausto,N. (2002) Bcl-2 expression delays hepatocyte cell cycle progression during liver regeneration. Oncogene, 21, 1548–1555. [DOI] [PubMed] [Google Scholar]
- Vairo G., Innes,K.M. and Adams,J.M. (1996) Bcl-2 has a cell cycle inhibitory function separable from its enhancement of cell survival. Oncogene, 13, 1511–1519. [PubMed] [Google Scholar]
- Vairo G., Soos,T.J., Upton,T.M., Zalvide,J., DeCaprio,J.A., Ewen,M.E., Koff,A. and Adams,J.M. (2000) Bcl-2 retards cell cycle entry through p27Kip1, pRB relative p130 and altered E2F regulation. Mol. Cell. Biol., 20, 4745–4753. [DOI] [PMC free article] [PubMed] [Google Scholar]
- Vander Heiden M.G., Chandel,N.S., Schumacker,P.T. and Thompson,C.B. (1999) Bcl-xL prevents cell death following growth factor withdrawal by facilitating mitochondrial ATP/ADP exchange. Mol. Cell, 3, 159–167. [DOI] [PubMed] [Google Scholar]
- Yang E., Zha,J., Jockel,J., Boise,L.H., Thompson,C.B. and Korsmeyer,S.J. (1995) Bad, a heterodimeric partner for Bcl-XL and Bcl-2, displaces Bax and promotes cell death. Cell, 80, 285–291. [DOI] [PubMed] [Google Scholar]
- Zhu W., Cowie,A., Wasfy,G.W., Penn,L.Z., Leber,B. and Andrews,D.W. (1996) Bcl-2 mutants with restricted subcellular location reveal spatially distinct pathways for apoptosis in different cell types. EMBO J., 15, 4130–4141. [PMC free article] [PubMed] [Google Scholar]


