

Abstract
Gelsolin and CapG are actin regulatory proteins that remodel the cytoskeleton in response to phosphatidylinositol 4,5-bisphosphate (PIP2) and Ca2+ during agonist stimulation. A physiologically relevant rise in Ca2+ increases their affinity for PIP2 and can promote significant interactions with PIP2 in activated cells. This may impact divergent PIP2- dependent signaling processes at the level of substrate availability. We found that CapG overexpression enhances PDGF-stimulated phospholipase Cγ (PLCγ) activity (Sun, H.-q., K. Kwiatkowska, D.C. Wooten, and H.L. Yin. 1995. J. Cell Biol. 129:147–156). In this paper, we examined the ability of gelsolin and CapG to compete with another PLC for PIP2 in live cells, in semiintact cells, and in vitro. We found that CapG and gelsolin overexpression profoundly inhibited bradykinin-stimulated PLCβ. Inhibition occurred at or after the G protein activation step because overexpression also reduced the response to direct G protein activation with NaF. Bradykinin responsiveness was restored after cytosolic proteins, including gelsolin, leaked out of the overexpressing cells. Conversely, exogenous gelsolin added to permeabilized cells inhibited response in a dose-dependent manner. The washout and addback experiments clearly establish that excess gelsolin is the primary cause of PLC inhibition in cells. In vitro experiments showed that gelsolin and CapG stimulated as well as inhibited PLCβ, and only gelsolin domains containing PIP2-binding sites were effective. Inhibition was mitigated by increasing PIP2 concentration in a manner consistent with competition between gelsolin and PLCβ for PIP2. Gelsolin and CapG also had biphasic effects on tyrosine kinase– phosphorylated PLCγ, although they inhibited PLCγ less than PLCβ. Our findings indicate that as PIP2 level and availability change during signaling, cross talk between PIP2-regulated proteins provides a selective mechanism for positive as well as negative regulation of the signal transduction cascade.
Gelsolin (33) and CapG (36) are members of an actin filament severing and capping protein family. They are activated by Ca2+ and inhibited by polyphosphoinositides, particularly phosphatidylinositol 4,5-bisphosphate (PIP2)1 (15, 33, 36). It is postulated that agonist-induced changes in Ca2+ and plasma membrane PIP2 levels alter the partitioning of gelsolin between the plasma membrane, cytosol, and actin filament ends (2, 3, 7, 8, 12, 19). These changes initiate actin filament severing and capping to remodel the cytoskeleton (14).
There is also emerging evidence to suggest that actin regulatory protein binding to PIP2 may have implications beyond a direct effect on the cytoskeleton. In vitro, gelsolin modulates the activity of several important signaling enzymes through an effect on their interactions with PIP2. It alters the activity of phosphoinositide-specific phospholipase C (PLC) (1), phospholipase D (30), and phosphoinositide 3-OH kinase (30; Lu, P., A. Hsu, D. Wong, H. Yun, H.L. Yin, and C. Chen, manuscript submitted for publication). Therefore, gelsolin and CapG may be components of a signaling complex that transduces external stimuli to the cytoskeleton. The possibility of cross talk between divergent PIP2-binding proteins through regulation of substrate availability is particularly relevant as more PIP2-binding proteins are identified. Many pleckstrin homology domain proteins with important signaling functions (27) bind PIP2 with affinity comparable to that of the gelsolin family (18). We recently demonstrated that gelsolin and CapG affinity for PIP2 is increased six- to eightfold by micromolar amounts of Ca2+ (18). They can therefore compete effectively for PIP2, particularly when cytosolic [Ca2+] increases and PIP2 level drops in agonist-stimulated cells. We reported that NIH3T3 clones expressing slightly more CapG than control clones have increased PDGF-stimulated PLCγ activity (31), supporting this possibility. However, we did not anticipate a stimulatory effect since previous in vitro studies indicate that gelsolin and profilin, another PIP2-regulated actin-binding protein, inhibit PLCγ (1, 10).
In this paper, we use a variety of approaches to determine how overexpression affects another PLC, PLCβ, and the basis for interaction in vivo. We also compared the effects of CapG and gelsolin overexpression. Gelsolin and CapG are present in similar concentration (∼0.7 μM) in NIH3T3 cells (9, 31). The gelsolin clones have a wider range of overexpression (9), and much more is known about gelsolin PIP2-binding sites (16, 34, 37). They have the same motility phenotype as CapG-overexpressing cells (9, 31), but their phosphoinositide metabolism has not been examined.
Materials and Methods
Cell Lines
NIH3T3 cell lines stably overexpressing human gelsolin were gifts of Drs. D.J. Kwiatkowski and C. Cunningham (Brigham and Women's Hospital, Boston, MA). They were obtained by transfection of a human cytoplasmic gelsolin expression vector and clonally selected with neomycin (9). Early passage cells that had been directly quantitated for gelsolin content were used, and their gelsolin expression was reconfirmed in our laboratory (see below). CapG overexpression cells were obtained as described in reference 31. Control (Ctrl) cells were transfected with the vector without a cDNA insert. Cells were maintained in DME with 10% FCS.
For inositol 1,4,5-trisphosphate (IP3) and intracellular Ca2+ measurements, cell monolayers were starved in DME/0.2% serum for 24 h. They were switched to a completely defined 1:1 DME/F12 medium supplemented with 20 mM Hepes, pH 7.4, 0.5 mg/ml BSA, 1 μg/ml insulin, and 1 μg/ml transferrin (Q-medium) for an additional 18 h before agonist application. In some cases, cells were treated with 100 ng/ml pertussis toxin (List Biological Lab., Inc., Campbell, CA) overnight. Bradykinin and PDGF (AB chains) were from Sigma Chemical Co. (St. Louis, MO) and Upstate Biotechnology, Inc. (Lake Placid, NY), respectively.
Streptolysin O Permeabilization
Cells were trypsinized and resuspended in Chelex 100–treated buffer containing 100 mM KCl, 20 mM NaCl, 20 mM Hepes, pH 7.4. 5 × 10⁶ cells were permeabilized in 0.4–0.6 U/ml streptolysin O (SLO) (Murex Diagnostics Limited, Dartford, England) with 1 mg/ml creatinine phosphate, 0.1 mg/ml creatinine phosphokinase, 5 mM MgCl2, and 3 mM ATP (21). Cells were usually permeabilized for 4 min at 37°C before agonist application.
Gelsolin PIP2-binding Domains
Gelsolin NH2-terminal half domains containing zero to three PIP2-binding sites were expressed in Escherichia coli and isolated as described (35, 37). The final products were >99% pure, based on Coomassie blue staining of protein bands in sodium dodecyl sulfate polyacrylamide gels. Protein concentrations were determined by the method of Bradford (5). P2, a 22-mer synthetic peptide encompassing gelsolin residues 150–169 (CKHVVPNEVVVQRLFQVKGRR, amino-terminal cysteine added) (16), was synthesized by solid phase methods. CapG and thymosin β4 were expressed in E. coli and purified as described previously (35, 38).
Ca2+ Measurements
Serum-deprived cells were washed and incubated with a buffer containing Fura 2 (2.5 μM), 1 mg/ml BSA, and 2 mg/ml glucose for 1 h at room temperature (31). Cells were trypsinized briefly and resuspended in a buffer containing BSA and glucose and warmed to 37°C. Fluorescence measurements were performed with 2 × 10⁶ cells in 1.5 ml with slow stirring at 37°C, at excitation and emission wavelengths of 340 and 500 nm, respectively. [Ca2+] was calibrated by adding 25 μg/ml digitonin and 0.25 mM MnCl2 to obtain Fmax and Fmin, respectively. A KdCa2+ of 224 nM was used for calculation.
IP3 Content
Cell monolayers starved in Q-medium were stimulated with 5 μM bradykinin for 7 or 15 s, and the reaction was stopped by adding an equal volume of a 5% perchloric acid solution containing 10 mM EDTA and 1 μM ATP. The soluble extract was neutralized with 1:1 freon/octylamine, and IP3 content was assayed by competition with exogenous [3H]IP3 to bind calf cerebellum microsomes (31). IP3 standards were extracted and assayed under identical conditions. The IP3 content of permeabilized cells was determined with cells in suspension under conditions identical to those used for Ca2+ measurements.
Immunoblotting
Cells were lysed in cold RIPA buffer containing a protease inhibitor cocktail as described previously (31). Lysate protein concentrations were determined by the micro-BCA method (Pierce Chemical Co., Rockford, IL). Proteins were electrophoresed on 5–10% polyacrylamide, discontinuous pH slab gels in the presence of SDS and transferred to nitrocellulose for Western blotting. Blots were probed with rabbit anti–mouse gelsolin, which recognizes the endogenous gelsolin (31), and/or a monoclonal anti– human gelsolin (clone 2C4), which recognizes human but not mouse gelsolin (6). Endogenous mouse and overexpressed human gelsolin were quantitated by comparing the intensity of gelsolin bands in cell lysates with that of purified mouse and human plasma gelsolins, respectively, as described in reference 9. In leak-out experiments, ctrl cells were permeabilized with streptolysin O at 37°C and centrifuged at 1,500 rpm in an Eppendorf microcentrifuge for 1 min at room temperature. Samples were blotted with rabbit anti–mouse gelsolin, rabbit anti-PLCβ3 (gift of P. Sternweis, University of Texas Southwestern Medical Center, Dallas, TX) (11), and monoclonal antiactin (clone C4; Boehringer Mannheim Corp., Indianapolis, IN).
PLC Assays
Recombinant PLCβ1 expressed in SF9 cells and purified to homogeneity was a gift of Dr. E. Ross (University of Texas Southwestern Medical Center) (4). Vesicles containing 100 μM phosphatidylethanolamine, 10 μM phosphatidylserine, 10 μM PIP2, and 0.028 μM [3H] PIP2 were made by sonicating in the PLC buffer (25 mM Hepes, 80 mM KCl, 3 mM EGTA, 0.5 mM DTT, pH 7.0). Vesicles were preincubated with gelsolin domains in the presence of 11 μM free [Ca2+] at 4°C for 10 min, and enzyme reaction was initiated by adding 4 ng (per 60 μl) PLCβ1 and warming to 37°C. Reactions were terminated after 1–4 min by adding TCA and 3 mg/ml BSA. Precipitated proteins were removed by centrifugation, and radioactive IP3 in the TCA-soluble supernatant was determined by scintillation counting. Triplicate samples were assayed per condition. PIP2 hydrolysis was linear for 15 min under the conditions used. In some experiments, PIP2, ranging from 5–200 μM, was presented as micelles.
Phospholipase Cγ1, purified from bovine brain (26), was a gift of Dr. S.G. Rhee (National Institute of Health, Bethesda, MD). A preparation enriched in EGF receptor tyrosine kinase was prepared from A431 plasma membrane by Triton X-100 extraction and passaged through a wheat germ agglutinin column with N-acetyl-d glucosamine (32). The eluted receptor preparation was dialyzed and used at 3 μg/ml to phosphorylate 0.6 μg/ml PLCγ1 , in the presence of 20 μM ATP and 3 μM EGF at 4°C for 1 h (22). Its activity was assessed by incubating PLCγ1 with [32P]ATP to detect EGF- dependent 32P incorporation. PLCγ1 activity was assayed by using 6–12.5 ng PLCγ1/60 μl reaction mixture, and with vesicles containing 10 μM PIP2/0.02 μM [3H]PIP2/100 μM PE. The buffer conditions were as described above. The reaction was linear for at least 15 min at 37°C. Unphosphorylated PLCγ1 control was incubated with the kinase preparation in the absence of ATP and EGF.
Results
Ca2+ Signaling in CapG Overexpressing Cells
We showed previously that CapG overexpression increased Ca2+ and IP3 response to PDGF (31). These results suggest that CapG enhanced PLCγ in vivo, although gelsolin (1) and CapG (see below) are predominantly inhibitory in vitro. We therefore examined the effect of overexpression on PLCβ, which is activated through the bradykinin/heterotrimeric G protein pathway. 5 μM bradykinin stimulated ctrl cells to increase cytosolic Ca2+ in a sharp peak (Fig. 1 A). CapG clones had a reduced Ca2+ response (Fig. 1 A and Table I). Likewise, the IP3 response was also attenuated. Bradykinin-stimulated ctrl cells generated IP3 to a maximal level at 7 s (Fig. 1 B). The CapG clones generated less IP3 at 7 and 15 s. Ca2+ signal and IP3 response were inhibited to a similar extent, suggesting that CapG inhibited PLCβ and Ca2+ signaling by a similar mechanism (see Fig. 3 B).
Figure 1.
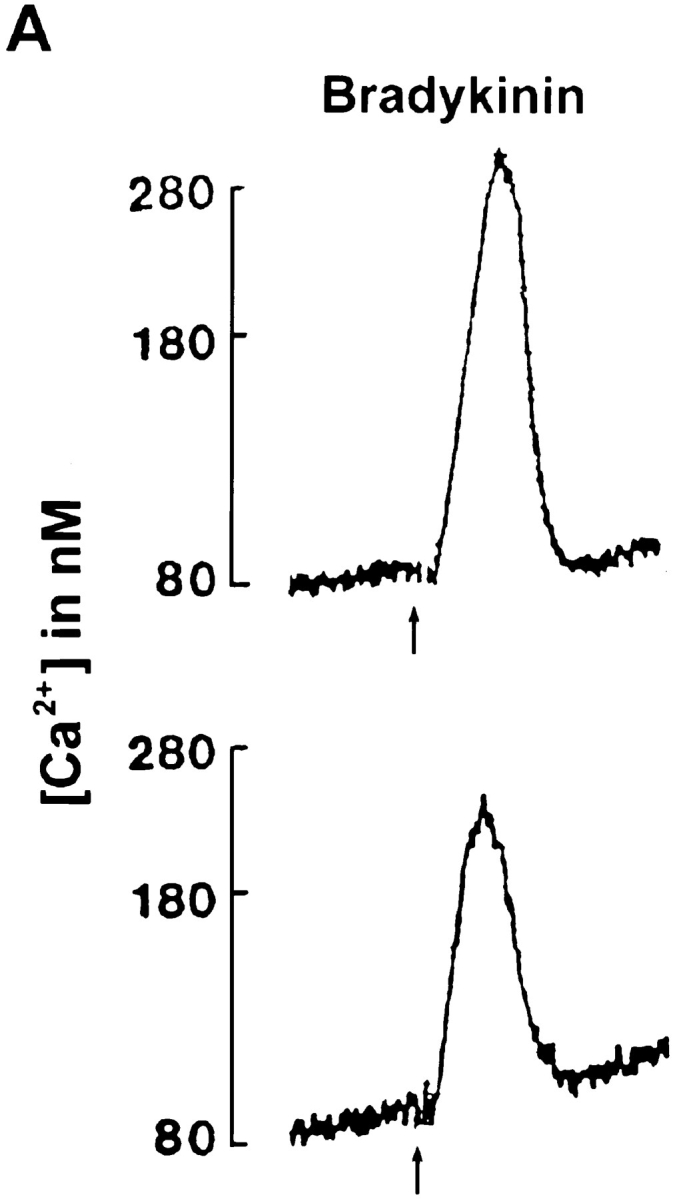

Effect of CapG overexpression on response to bradykinin. Serum- deprived fibroblasts were stimulated with 5 μM bradykinin. (A) Ca2+ tracings from a representative experiment were shown. Fura 2 was used as an indicator. Top, ctrl; bottom, gk15. Arrows indicate time of bradykinin addition. (B) IP3 generation as a function of time after stimulation. Cells were extracted with PCA, and IP3 level was determined by a receptor binding assay. Results shown were from a single representative experiment performed in triplicate. Values were mean ± SEM.
Table I.
Effects of Overexpression on Ca2+ Signals
| Clone | Fold overexpression* | Ca2+ (nM)‡ | ||||||
|---|---|---|---|---|---|---|---|---|
| PDGF | Bradykinin | |||||||
| Cap G | ctrl | 1 | 232 ± 30 | 659 ± 95 | ||||
| gK6 | 1.3 | — | 259 ± 58 | |||||
| gK8 | 1.4 | 323 ± 14 | 196 ± 21 | |||||
| gK15 | 1.5 | 339 ± 40 | 151 ± 57 | |||||
| Gelsolin | Ctrl | 1 | 289 ± 38 | 790 ± 146 | ||||
| C3 | 1.3 | 352 ± 20 | 1358 ± 251 | |||||
| C6 | 1.4 | 179 ± 25 | 270 ± 60 | |||||
| C1 | 1.7 | 125 ± 38 | 80 ± 18 | |||||
| C4 | 2.1 | 104 ± 10 | 30 ± 5 | |||||
| C5 | 2.4 | 125 ± 15 | 20 ± 2 | |||||
Gelsolin content was determined by scanning of Western blots, using mouse and human gelsolin as standards to quantitate overexpressed and endogenous gelsolins, respectively. Values were the means of three determinations. Cap G content was determined as described in reference 31.
Peak Ca2+ concentration after stimulation with 50 ng/ml PDGF or 5 μM bradykinin. Values were the means ± SEM of three to five determinations.
Figure 3.


Effect of gelsolin and CapG overexpression. (A) Ca2+ tracings. Cells were stimulated with 5 μM bradykinin or 20 mM NaF. Tracings were from a representative experiment. Arrows indicate time of agonist addition. Ctrl, mock-transfected cells; C1, gelsolin-overexpressing cells. (B) Comparing the effects of gelsolin and CapG overexpression. Cells were stimulated with 5 μM bradykinin or 20 mM NaF. Ca2+ spike and IP3 generation were measured. The peak response of overexpressing cells was expressed as a percent of ctrl cells exposed to the same stimulus. Results shown were the average of two experiments. Filled circles, Ca2+ signal after bradykinin stimulation; open circles, IP3 generated in response to bradykinin; triangles, Ca2+ signal after NaF treatment.
To explore the basis for the opposite effects of CapG overexpression on PDGF- vs. bradykinin-activated PLC, we felt that studying cells with a wider range of overexpression and comparing cells overexpressing related proteins would be important. In spite of repeated attempts, we were not able to isolate stable CapG clones with higher overexpression. We therefore directed our effort to gelsolin-overexpressing clones, which have a wider range of overexpression (9).
Effects of Gelsolin Overexpression on PIP2 Hydrolysis
Western blotting with human gelsolin–specific antibody, which recognizes the transfected human gelsolin but not endogenous mouse gelsolin, confirmed that the clones had a range of gelsolin overexpression (Fig. 2, bottom), as described previously (9). C2 was not positive, indicating that it had lost the expression vector, and was not studied further. Blotting with anti–mouse gelsolin, which cross-reacts poorly with human gelsolin, showed that the endogenous gelsolin level in overexpressing cells was comparable to that of the ctrl cells (Fig. 2, top). Therefore, there was no compensatory change in endogenous gelsolin expression. Total gelsolin level, determined by quantitative Western blotting using purified human and mouse gelsolin standards, confirmed that the levels of expression were similar to that shown previously (9) (Table I).
Figure 2.

Western blotting of gelsolin-overexpressing clones. (Top) Anti–mouse gelsolin (anti-mG), detecting endogenous gelsolin. (Bottom) Anti–human gelsolin (anti-hG), detecting the expression of human gelsolin in human gelsolin cDNA–transfected cells. ctrl, control-transfected NIH3T3 cells; C, gelsolin overexpressing clones.
Gelsolin overexpression modified the Ca2+ response to bradykinin. C3 that has 1.3 times as much gelsolin as ctrl was slightly more responsive to bradykinin and PDGF (Table I). In contrast, C6, C1, C4, and C5 that have higher overexpression had a striking decrease in bradykinin- induced Ca2+ signal (Fig. 3, Table I). The PDGF response was also reduced, but to a lesser extent (Table I). Since inhibition was observed with multiple independently isolated clones, the phenotype was attributed to gelsolin overexpression and was not an artifact of clonal selection. The stimulation we observed with the lowest overexpressing clone, C3, suggests that gelsolin may also increase signaling. However, because only one such clone was available, ruling out clonal variations unrelated to gelsolin was not possible.
The effect of gelsolin on PLCβ activity per se was confirmed by quantitating IP3. Ctrl and overexpressing clones had similar basal IP3 levels (∼10 pmol/mg cell protein). Gelsolin clones had reduced IP3 response (Fig. 3 B), and the extent of inhibition correlated with that of the Ca2+ response. Overall, our results are consistent with the hypothesis that the gelsolin- and CapG-induced change in Ca2+ signal was due to PLCβ inhibition.
Characterization of the Gelsolin Effect on the Bradykinin Response
Since the bradykinin response was strikingly inhibited, we will focus on this aspect in the rest of the paper. Bradykinin stimulation of Ca2+ release is a multistep process that involves bradykinin binding to receptors, activation of heterotrimeric G proteins, PLCβ hydrolysis of PIP2, and IP3-induced release of Ca2+ from intracellular stores. Ctrl cells responded to as low as 0.1 μM bradykinin, and Ca2+ release was maximally stimulated at 1 μM (data not shown). C5 had a very small Ca2+ peak, even at 50 μM bradykinin, suggesting that the problem was unlikely to be due to decreased receptor affinity. To identify the step compromised by gelsolin overexpression, NaF was used to activate G proteins directly, bypassing receptor involvement. NaF induced a slow Ca2+ rise (Fig. 3 A), which had a smaller amplitude than the bradykinin peak (320 ± 50 nM). Gelsolin overexpression reduced the NaF response, suggesting that it acted at or downstream of the heterotrimeric G protein activation step (Fig. 3 A). However, gelsolin did not inhibit the NaF response to as great an extent as the bradykinin response (Fig. 3 B). The Ca2+ peak for C4 was reduced to 1.8 and 47.8% of ctrl after bradykinin and NaF stimulation, respectively. The difference may be due to activation of different PLCs. NaF activates all heterotrimeric G proteins, while bradykinin activates the alpha subunit (Gαq/11) (11, 29). This was confirmed with pertussis toxin that inhibits Gi but not Gαq/11. In ctrl cells, pertussis toxin reduced the NaF response by 45.7% but had minimal effect on the bradykinin response (data not shown). Our result suggested that Gαq/11-activated PLCs were more sensitive to gelsolin inhibition than Gαi-activated enzymes.
Addition of Exogenous Gelsolin to Streptolysin O–permeabilized Ctrl Cells
To determine if the change in PLCβ activity is directly attributable to gelsolin, a gelsolin NH2-terminal half polypeptide (45 kD, spanning gelsolin residues 1–406 [GS1-406]) that contains at least two PIP2-binding sites (17, 35) was added to SLO-permeabilized ctrl cells. Under the permeabilizing conditions used, cells retained agonist responsiveness, as demonstrated previously for another type of cell (21). Fig. 4 showed the result of a representative experiment. The mean IP3 response in the presence of 4 and 32 μM GS1-406 were 46.5 ± 4.0% (n = 8) and 6.4 ± 1.1% (n = 3) of control, respectively. Thus, exogenous gelsolin added to permeabilized cells mimicked the inhibitory effects of gelsolin overexpression.
Figure 4.

Effects of exogenous gelsolin on the IP3 response of permeabilized ctrl cells. Ctrl cells were permeabilized with SLO for 4 min, incubated with gelsolin GS1-406 for 3 min, and stimulated with 10 μM bradykinin for 7 s. IP3 release was assayed. Data shown were from a representative experiment, and each point was performed in triplicate.
Exogenous CapG also inhibited IP3 rise, while thymosin β4, an actin-binding protein that does not interact with PIP2 (38), had no effect at 10 μM. (IP3 response was 91.7 and 101.8% of control after bradykinin stimulation in two experiments.) These results suggested that inhibition of IP3 generation in cells was linked to an increase in PIP2-binding proteins.
Regeneration of Bradykinin Response after Cytosol Leakage from Semiintact Cells
Our data showed that gelsolin, either overexpressed in intact cells or added to semiintact cells, reduced bradykinin responsiveness. Removal of gelsolin should restore the bradykinin response. Cells were permeabilized for progressively longer intervals before bradykinin stimulation to allow gelsolin and other cytosolic proteins to leak out. After 3 min, gelsolin and actin were detected in the medium (Fig. 5 A). More proteins leaked out with longer treatment. In contrast, PLCβ3, the predominant PLC in NIH3T3 cells, did not leak out to a significant extent, as would be consistent with its stable plasma membrane association. There was no difference in the leakage of PLCβ3 between ctrl and C5.
Figure 5.


Restoration of bradykinin response to gelsolin-overexpressing cells after SLO permeabilization. (A) Time course of leakage of cytosolic proteins. Ctrl cells in suspension were permeabilized at 37°C with SLO and centrifuged for 1 min at room temperature. Pellets and supernatants were electrophoresed on SDS–polyacrylamide gels and blotted with anti–mouse gelsolin, antiactin, or anti-PLCβ3. (B). IP3 generation after bradykinin stimulation. Ctrl cells and C5 were exposed to SLO for the amount of time indicated and then stimulated with bradykinin. The C5 Ca2+ peak was expressed as a percent of ctrl under identical conditions. Data shown were the means of two separate experiments.
The effect of cytosol leakage on IP3 generation was determined by stimulating cells permeabilized for different intervals with bradykinin (Fig. 5 B). Both intact and permeabilized ctrl cells increased IP3 after bradykinin stimulation. The semiintact cell's response was more robust, suggesting that soluble inhibitors had leaked out or that other clamping mechanisms were disrupted. As shown above, intact C5 had a much lower IP3 response than ctrl cells. At 2 min after SLO treatment, C5 was still inhibited relative to ctrl. Between 2 to 5 min, C5 response increased to a level comparable to that of ctrl. With longer permeabilization, both ctrl and C5 were less active, probably due to loss of membrane integrity and depletion of soluble cofactors such as GTP. The convergence of the IP3 response between ctrl and C5 was not due to differential leakout of PLCβ3 (Fig. 5 A). Recovery of bradykinin-stimulated PLC activity indicates that reduced bradykinin responsiveness in intact overexpressing cells is unlikely to be due to bradykinin receptor defects. A similar conclusion was reached using NaF to stimulate G proteins directly (Fig. 3 A). Therefore, we conclude that gelsolin depresses PLC activity in intact C5, and reducing gelsolin concentration relieves the inhibition.
Effects of Gelsolin on Phospholipase C In Vitro
It has been reported that gelsolin inhibits several PLC isozymes in vitro (1). In light of our in vivo results, we reexamined this issue to determine if gelsolin and CapG inhibit PLCβ and PLCγ differentially, and whether inhibition is due to PIP2 binding. Gelsolin GS1-406 that contains two identified PIP2-binding sites increased Ca2+-activated PLCβ at 1 μM and inhibited at higher concentrations (Fig. 6 A). A biphasic effect has been reported previously (1), although the stimulatory phase was ignored. CapG stimulated and inhibited with a comparable dose response, consistent with its similar affinity as gelsolin for PIP2 (18). Gelsolin also had a biphasic effect on PLCγ phosphorylated with EGF receptor kinase. In contrast, gelsolin did not increase the activity of nonphosphorylated PLCγ (Fig. 6 B) and inhibited it more strongly. The differential effects on phosphorylated and unphosphorylated PLCγ, including activation of the phosphorylated enzyme at low concentration, were similar to that reported previously for profilin (10). A direct comparison between gelsolin and profilin showed that gelsolin was a stronger inhibitor (data not shown), consistent with their different affinity for PIP2 (18, 20). Although gelsolin was reported to bind PLCγ (1), we were not able to detect such an interaction either with purified proteins or in cell lysates (data not shown). Therefore, gelsolin is not likely to act by binding PLC directly.
Figure 6.


Effect of gelsolin on PLC activity in vitro. (A) PLCβ1 was activated with 11 μM Ca2+, and IP3 release from PIP2/PE/PS vesicles after 1 min was determined. The specific activity was 5.48 μmol/mg/min. Enzyme activity without added gelsolin was expressed as 100%, after background subtraction. (Background was less than 10% without added Ca2+.) (B) PLCγ with and without EGF receptor (EGFR) tyrosine kinase activation. PLC was incubated with EGF receptor kinase in the presence and absence of ATP and EGF. The activity of the phosphorylated and unphosphorylated enzymes were assayed in the presence of increasing amounts of gelsolin. IP3 release from PIP2/PE/PS vesicles after 4 min was expressed as percent of control (in the absence of gelsolin). The specific activity after background subtraction was 3.74 μmol/mg/min. (C) Effect of increasing PIP2 micelle concentration on the ability of gelsolin to inhibit PLCβ. IP3 released into the supernatant after 15 min was plotted as a function of PIP2 concentration.
Gelsolin inhibited Ca2+-activated PLCβ more than phosphorylated PLCγ. 2 μM gelsolin stimulated phosphorylated PLCγ but was located on the inhibitory arm of the PLCβ dose-response curve (Fig. 6, A and B). Stimulation of phosphorylated PLCγ may contribute to the increased PDGF response in clones overexpressing low levels of CapG and in the single low-level gelsolin-overexpressing clone (C3). The higher sensitivity of PLCβ to inhibition may explain why PLCβ and PLCγ were affected in opposite directions in CapG clones and why the gelsolin clones showed more inhibition of PLCβ than PLCγ. Thus, the differential inhibitory effects of gelsolin on PLCβ and PLCγ in vitro recapitulated the in vivo effects of overexpression.
The inhibitory effect of GS1-406 was overcome by increasing PIP2 concentration. As expected, PLCβ generated more IP3 as the substrate concentration increased. 5 μM GS1-406 completely inhibited PLCβ activity at 5 and 10 μM PIP2 but was progressively less effective at higher PIP2 concentration (Fig. 6 C). No inhibition was observed at PIP2 concentrations above 120 μM. The simplest interpretation was that gelsolin inhibited PLCβ by substrate competition, as suggested for PLCγ in an earlier study (1).
Experiments using gelsolin domains with and without PIP2-binding sites confirmed that gelsolin altered PLC activity through PIP2 binding. GS1-406, encompassing gelsolin segments 1–3, contains at least two (and possibly three) PIP2-binding sites (Fig. 7 A). The S1 and S2 PIP2-binding sites have been mapped precisely by deletion analyses (37) and peptide analog studies (16, 37). The existence of a third site is inferred from previous experiments after deleting the S2 site and is predicted to be in S3 (37). GS1-406, which binds PIP2 with an estimated K d of 2.9 μM and a stoichiometry of ∼3 (18), had the most activating and inhibitory effects (Fig. 7 B). GS150-406 (S2-3), which binds with a similar K d but with a stoichiometry of ∼2, was slightly less effective. GS150-267 that contains a single PIP2-binding site was markedly less effective, while GS171-267 with no PIP2-binding site had no effect. These results showed that gelsolin altered PLC activity through PIP2 binding, and maximal effect was observed with the participation of two to three PIP2-binding sites. Binding to multiple PIP2 may form a more stable complex that is less likely to be displaced by PLC, and the larger polypeptides are likely to be more effective in sterically hindering PLC access to its substrate.
Figure 7.


Gelsolin-modulated PLCβ1 activity through PIP2 binding. (A) Gelsolin NH2-terminal domains (GS1-406) containing none or between one to three PIP2-binding sites. Gelsolin segments 1, 2 and 3 are as defined in reference 17. *PIP2-binding sites that have been localized. ?, suspected PIP2-binding site that has not yet been located precisely. (B) Effects of gelsolin domains on PLCβ1. (C) Effect of P2 on PLCβ1. In B and C, enzyme activity was assayed for 1 min and expressed as percent of control in the absence of exogenous protein.
P2, the PIP2-binding peptide derived from gelsolin S2 (16), had no effect at low concentration and stimulated PLCβ by more than threefold at 53 μM (Fig.7 C). We were not able to use more P2 to determine if higher concentrations were inhibitory. P2 may stimulate by organizing PIP2 in a more favorable conformation for PLC hydrolysis. It may be more stimulatory than the parent S2 domain because its positive effects are not neutralized by steric hindrance to block PLC access. However, in contrast to the marked stimulation in vitro, P2 had minimal effect on PLCβ activity in permeabilized cells. Semiintact cells treated with 100 μM P2 showed 72.5 ± 6.7% (n = 9) of the bradykinin-induced IP3 response of untreated cells. No stimulation was observed between 5–100 μM (data not shown). We cannot explain why P2 had divergent effects in vitro and in vivo.
Discussion
In this paper, we examined the ability of gelsolin and CapG to compete with PLC for PIP2 in live cells, in semiintact cells, and in vitro. The various approaches help to define the mechanism by which gelsolin and CapG modulate PLC activity in two independent signaling pathways. Our results suggest that these cytoskeletal proteins may participate in signaling by controlling the availability of PIP2 substrates.
The CapG and gelsolin overexpressing cell lines were isolated independently by two different laboratories, using the same parent NIH3T3 cell line and expression vector. Their remarkably similar effects on PLCβ strongly support the conclusion that gelsolin and CapG bind PIP2 in vivo to inhibit PLCβ. There are, however, differences with respect to PLCγ. At an apparently similar level of overexpression, CapG clone gK8 and gelsolin clone C6 had increased and decreased response to PDGF, respectively. The divergent effects of gelsolin and CapG may be due to multiple factors. CapG has one PIP2-binding site, while gelsolin has two (37). CapG is half the size of gelsolin (36). Thus, CapG may be more readily displaced by activated PLCγ and may not sterically block PLCγ access to PIP2 as effectively. CapG is phosphorylated (23), and phospho-CapG may have a different affinity for PIP2 (Lu, P., A. Hsu, D. Wong, H. Yan, H.L. Yin, and C. Chen, manuscript submitted for publication). Another possibility may be different intracellular localization. CapG is a nuclear and cytosolic protein, while gelsolin is excluded from the nucleus (24). There is emerging evidence for phosphoinositide signaling pathways in nuclei (Lu, P., A. Hsu, D. Wong, H. Yan, H.L. Yin, and C. Chen, manuscript submitted for publication), and CapG may therefore act in the nucleus.
Another feature that emerges from these studies is that there is a difference in the sensitivity of PLCβ and PLCγ towards gelsolin and CapG. This may be explained in several ways. Phosphorylated PLCγ may have a higher affinity for PIP2 than PLCβ and is therefore better able to compete with gelsolin for PIP2. Differential sensitivity may account for the paradoxical finding that CapG-overexpressing cells have increased PLCγ (31) but reduced PLCβ activity. Another possibility is that PLC isozymes may use different pools of PIP2, and gelsolin/CapG have differential access to these pools. PIP2 pools with distinct turnover characteristics have been identified (25), although their relation to the different PLC isozymes, gelsolin and CapG, has not been examined.
Inhibition of PLC is most likely due to competition of gelsolin and CapG with PLC for PIP2. Steric hindrance may also be a contributing factor. The mechanism by which PLC is enhanced by a small increase in CapG or gelsolin is not known. Since only gelsolin domains with PIP2-binding sites stimulate, this effect depends on PIP2 binding. The simplest hypothesis is that gelsolin and CapG improve the presentation of PIP2 to PLC by altering the phospholipid conformation. Among the gelsolin domains tested, P2, the small synthetic peptide containing a single PIP2-binding site, is most stimulatory in vitro. However, it does not have any effect on PLC in semiintact cells. This peptide has been used by others to examine the relation between gelsolin and PIP2 in cells (8, 13). P2 added to semiintact platelets blocks Rac1-induced uncapping of actin filament + ends, and this effect is overcome by adding PIP2 (13). Overexpression of P2 in a permanently transfected cell line reduces gelsolin association with the plasma membrane (8). Both experiments indicate that P2 competes with gelsolin for PIP2, although effects on other PIP2 -requiring processes have not been ruled out. Our result suggests that PLC was not affected by increasing P2 levels in cells. Additional experiments will be required to determine if other parameters are altered by P2.
In conclusion, we show that gelsolin and CapG interact with PIP2 in vivo, and a modest increase in concentration has profound effects on two PIP2 signaling pathways. Overexpression is used as a tool to probe intracellular function. Our overexpression results have physiological relevance. While total gelsolin and CapG content do not change per se, cytosolic concentration and membrane binding are expected to fluctuate during signaling. Gelsolin and CapG bind to and are released from filament ends and the membrane PIP2 content changes due to hydrolysis and resynthesis. Ca2+ increases gelsolin and CapG affinity for PIP2 (18), enhancing their ability to compete with other PIP2-binding proteins at a time when membrane PIP2 content decreases. CapG and gelsolin can provide positive and negative inputs on PLC signaling pathways, and these pathways are modulated selectively. The data presented here indicate that there is significant cross talk between components of the transmembrane signal machinery and actin cytoskeleton at multiple levels, including that of the generation of important second messengers.
Acknowledgments
We are grateful to David Kwiatkowksi and Casey Cunningham for the gelsolin overexpressing cell lines, Sue Goo Rhee for PLCγ1 and Paul Sternweis for anti-PLCβ3. We thank Elliot Ross and Gloria Biddlecome (University of Texas Southwestern Medical Center) for initiating the PLCβ1 assays and providing for recombinant PLCβ1.
This work was supported by the National Institutes of Health grant GM51112.
Abbreviations used in this paper
- C
gelsolin-overexpressing lines
- ctrl
control clones
- IP3
inositol 1,4,5-trisphosphate
- PIP2
phosphatidylinositol 4,5-bisphosphate
- PLC
phospholipase C
- SLO
streptolysin O
Footnotes
Address all correspondence to Helen L. Yin, University of Texas Southwestern Medical Center, 5323 Harry Hines Blvd., Dallas, TX 75235-9040. Tel.: (214) 648-7967. Fax: (214) 648-8685. e-mail: YIN01@UTSW. SWMED.EDU
References
- 1.Banno Y, Nakahima T, Kumada T, Ebisawa K, Nonomura Y, Nozawa Y. Effects of gelsolin on human platelet cytosolic phosphoinositide-phospholipase C isozymes. J Biol Chem. 1992;267:6488–6494. [PubMed] [Google Scholar]
- 2.Barkalow K, Witke W, Kwiatkowski DJ, Hartwig JH. Coordinated regulation of platelet actin filament barbed ends by gelsolin and capping protein. J Cell Biol. 1996;134:389–399. doi: 10.1083/jcb.134.2.389. [DOI] [PMC free article] [PubMed] [Google Scholar]
- 3.Barkalow K, Witke W, Kwiatkowski DJ, Hartwig JH. Coordinated regulation of platelet actin filament barbed ends by gelsolin and capping protein. J Cell Biol. 1996;134:389–399. doi: 10.1083/jcb.134.2.389. [DOI] [PMC free article] [PubMed] [Google Scholar]
- 4.Biddlecome GH, Berstein G, Ross EM. Regulation of phospholipase C-β1 by Gq and m1 muscarinic cholinergic receptor. J Biol Chem. 1996;271:7999–8007. doi: 10.1074/jbc.271.14.7999. [DOI] [PubMed] [Google Scholar]
- 5.Bradford MM. A rapid and sensitive method for the quantitation of microgram quantities of protein utilizing the principle of protein-dye binding. Annu Rev Biochem. 1976;72:248–254. doi: 10.1016/0003-2697(76)90527-3. [DOI] [PubMed] [Google Scholar]
- 6.Chaponnier C, Yin HL, Stossel TP. Reversibility of gelsolin/ actin interaction in macrophages. Evidence of Ca2+-independent pathways. J Exp Med. 1987;165:97–106. doi: 10.1084/jem.165.1.97. [DOI] [PMC free article] [PubMed] [Google Scholar]
- 7.Chaponnier C, Yin HL, Stossel TP. Reversibility of gelsolin/ actin interaction in macrophages. Evidence of Ca2+-dependent and Ca2+-independent pathways. J Exp Med. 1987;165:97–106. doi: 10.1084/jem.165.1.97. [DOI] [PMC free article] [PubMed] [Google Scholar]
- 8.Chen P, Murphy-Ullrich JE, Wells A. A role for gelsolin in actuating epidermal growth factor receptor–mediated cell motility. J Cell Biol. 1996;134:689–698. doi: 10.1083/jcb.134.3.689. [DOI] [PMC free article] [PubMed] [Google Scholar]
- 9.Cunningham CC, Stossel TP, Kwiatkowski DJ. Enhanced motility in NIH 3T3 fibroblasts that overexpress gelsolin. Science (Wash DC) 1991;251:1233–1236. doi: 10.1126/science.1848726. [DOI] [PubMed] [Google Scholar]
- 10.Goldschmidt-Clermont PJ, Kim JW, Machesky LM, Rhee SG, Pollard TD. Regulation of phospholipase C-y1 by profilin and tyrosine phosphorylation. Science (Wash DC) 1991;251:1231–1233. doi: 10.1126/science.1848725. [DOI] [PubMed] [Google Scholar]
- 11.Gutowski S, Smrcka A, Nowak L, Wu D, Simon M, Sternweiss PC. Antibodies to the αqsubfamily of guanine nucleotide-binding regulatory protein subunits attenuate activation of phosphatidylinositol 4,5-bisphosphate hydrolysis by hormones. J Biol Chem. 1991;266:20519–20524. [PubMed] [Google Scholar]
- 12.Hartwig JH, Chambers KA, Stossel TP. Association of gelsolin with actin filaments and cell membranes of macrophages and platelets. J Cell Biol. 1989;108:467–479. doi: 10.1083/jcb.108.2.467. [DOI] [PMC free article] [PubMed] [Google Scholar]
- 13.Hartwig JH, Bokoch GM, Carpenter CL, Janmey PA, Taylor LA, Toker A, Stossel TP. Thrombin receptor ligation and activated Rac uncap actin filament barbed ends through phosphoinositide synthesis in permeabilized human platelets. Cell. 1995;82:643–653. doi: 10.1016/0092-8674(95)90036-5. [DOI] [PubMed] [Google Scholar]
- 14.Janmey PA. Phosphoinositides and calcium as regulators of cellular actin assembly and disassembly. Annu Rev Physiol. 1994;56:169–191. doi: 10.1146/annurev.ph.56.030194.001125. [DOI] [PubMed] [Google Scholar]
- 15.Janmey PA, Stossel TP. Gelsolin-polyphosphoinositide interaction. J Biol Chem. 1989;264:4825–4831. [PubMed] [Google Scholar]
- 16.Janmey PA, Lamb J, Allen PG, Matsudaira PT. Phosphoinositide-binding peptides derived from the sequences of gelsolin and villin. J Biol Chem. 1992;267:11818–11823. [PubMed] [Google Scholar]
- 17.Kwiatkowski DP, Stossel TP, Orkin SH, Mole JE, Colten HR, Yin HL. Plasma and cytoplasmic gelsolins contain a duplicated actin-binding domain. Nature (Lond) 1986;323:455–458. doi: 10.1038/323455a0. [DOI] [PubMed] [Google Scholar]
- 18.Lin, K., E. Wenegieme, P. Lu, C. Chen, and H.L. Yin. 1997. Gelsolin binding to phosphatidylinositol 4,5 bisphosphate is modulated by calcium and pH. J. Biol Chem. In press. [DOI] [PubMed]
- 19.Lind SE, Janmey PA, Chaponnier C, Herbert T-J, Stossel TP. Reversible binding of actin to gelsolin and profilin in human platelet extracts. J Cell Biol. 1987;105:833–842. doi: 10.1083/jcb.105.2.833. [DOI] [PMC free article] [PubMed] [Google Scholar]
- 20.Lu P, Shieh W, Rhee SG, Yin HL, Chen C. Lipid products of phosphoinositide 3-kinase bind human profilin with high affinity. Biochemistry. 1996;35:14027–14034. doi: 10.1021/bi961878z. [DOI] [PubMed] [Google Scholar]
- 21.Muallem S, Kwiatkowska K, Xu X, Yin HL. Actin filament disassembly is a sufficient final trigger for exocytosis in nonexcitable cells. J Cell Biol. 1995;128:589–598. doi: 10.1083/jcb.128.4.589. [DOI] [PMC free article] [PubMed] [Google Scholar]
- 22.Nishibe S, Wahl MI, Hernandez-Sotomayor SMT, Tonks NK, Rhee SG, Carpenter G. Increase of the catalytic activity of phospholipase C-γ1 by tyrosine phosphorylation. Science (Wash DC) 1990;250:1253–1257. doi: 10.1126/science.1700866. [DOI] [PubMed] [Google Scholar]
- 23.Onoda K, Yin HL. gCap39 is phosphorylated. Stimulation by okadaic acid and preferential association with nuclei. J Biol Chem. 1993;268:4106–4112. [PubMed] [Google Scholar]
- 24.Onoda K, Yu F-X, Yin HL. gCap39 is a nuclear and cytoplasmic protein. Cell Motil Cytoskel. 1993;26:227–238. doi: 10.1002/cm.970260306. [DOI] [PubMed] [Google Scholar]
- 25.Pike LJ, Casey L. Localization and turnover of phosphatidylinositol 4,5-bisphosphate in caveolin-enriched membrane domains. J Biol Chem. 1996;271:26453–26456. doi: 10.1074/jbc.271.43.26453. [DOI] [PubMed] [Google Scholar]
- 26.Rhee SG, Ryu SH, Lee KY, Cho KS. Assays of phosphoinositide-specific phospholipase C and purification of isozymes from bovine brains. Methods Enzymol. 1991;197:502–511. doi: 10.1016/0076-6879(91)97176-y. [DOI] [PubMed] [Google Scholar]
- 27.Shaw G. The pleckstrin homology proteins: an intriguing multifunctional protein module. BioEssays. 1996;18:35–46. doi: 10.1002/bies.950180109. [DOI] [PubMed] [Google Scholar]
- 28.Singh SS, Chauhan A, Murakami N, Chauhan VP. Profilin and gelsolin stimulate phosphatidylinositol 3-kinase activity. Biochemistry. 1996;35:16544–16549. doi: 10.1021/bi9609634. [DOI] [PubMed] [Google Scholar]
- 29.Smrcka AV, Hepler JR, Brown KO, Sternweis PC. Regulation of polyphosphoinositide-specific phospholipase C activity by purified Gq. Science (Wash DC) 1991;251:804–807. doi: 10.1126/science.1846707. [DOI] [PubMed] [Google Scholar]
- 30.Steed PM, Nagar S, Wennogle LP. Phospholipase D regulation by a physical interaction with the actin-binding protein gelsolin. Biochemistry. 1996;35:5229–5237. doi: 10.1021/bi952370j. [DOI] [PubMed] [Google Scholar]
- 31.Sun H-Q, Kwiatkowska K, Wooten DC, Yin HL. Effects of CapG overexpression on agonist-induced motility and second messenger generation. J Cell Biol. 1995;129:147–156. doi: 10.1083/jcb.129.1.147. [DOI] [PMC free article] [PubMed] [Google Scholar]
- 32.Wahl MI, Jones GA, Nishibe S, Rhee SG, Carpenter G. Growth factor stimulation of phospholipase C-y1 activity. Comparative properties of control and activated enzymes. J Biol Chem. 1992;267:10447–10456. [PubMed] [Google Scholar]
- 33.Yin HL, Stossel TP. Control of cytoplasmic actin gel-sol transformation by gelsolin, a calcium-dependent protein. Nature (Lond) 1980;218:583–586. doi: 10.1038/281583a0. [DOI] [PubMed] [Google Scholar]
- 34.Yin HL, Iida K, Janmey PA. Identification of a polyphosphoinositide-modulated domain in gelsolin which binds to the side of actin filaments. J Cell Biol. 1988;106:805–812. doi: 10.1083/jcb.106.3.805. [DOI] [PMC free article] [PubMed] [Google Scholar]
- 35.Yu F, Zhou D, Yin HL. Chimeric and truncated gCap39 elucidate the requirements for actin filament severing and end capping by the gelsolin family of proteins. J Biol Chem. 1991;266:19269–19275. [PubMed] [Google Scholar]
- 36.Yu F-X, Johnston PA, Sudhof TC, Yin HL. gCap39, a calcium ion- and polyphosphoinositide-regulated actin capping protein. Science (Wash DC) 1990;250:1413–1415. doi: 10.1126/science.2255912. [DOI] [PubMed] [Google Scholar]
- 37.Yu F-X, Sun H-Q, Janmey PA, Yin HL. Identification of a polyphosphoinositide-binding sequence in an actin monomer-binding domain of gelsolin. J Biol Chem. 1992;267:14616–14621. [PubMed] [Google Scholar]
- 38.Yu F-X, Lin S-C, Morrison-Bogorad M, Atkinson MAL, Yin HL. Thymosin β10 and thymosin β4 are both actin monomer sequestering proteins. J Biol Chem. 1993;268:502–509. [PubMed] [Google Scholar]