

Abstract
The regulation of sphingolipid transport to the bile canalicular apical membrane in the well differentiated HepG2 hepatoma cells was studied. By employing fluorescent lipid analogs, trafficking in a transcytosis-dependent pathway and a transcytosis-independent (‘direct') route between the trans-Golgi network and the apical membrane were examined. The two lipid transport routes were shown to operate independently, and both were regulated by kinase activity. The kinase inhibitor staurosporine inhibited the direct lipid transport route but slightly stimulated the transcytosis-dependent route. The protein kinase C (PKC) activator phorbol-12 myristate-13 acetate (PMA) inhibited apical lipid transport via both transport routes, while a specific inhibitor of this kinase stimulated apical lipid transport. Activation of protein kinase A (PKA) had opposing effects, in that a stimulation of apical lipid transport via both transport routes was seen. Interestingly, the regulatory effects of either kinase activity in sphingolipid transport correlated with changes in cell polarity. Stimulation of PKC activity resulted in a disappearance of the bile canalicular structures, as evidenced by the redistribution of several apical markers upon PMA treatment, which was accompanied by an inhibition of apical sphingolipid transport. By contrast, activation of PKA resulted in an increase in the number and size of bile canaliculi and a concomitant enhancement of apical sphingolipid transport. Taken together, our data indicate that apical membrane-directed sphingolipid transport in HepG2 cells is regulated by kinases, which could play a role in the biogenesis of the apical plasma membrane domain.
Polarized cells have different membrane domains, i.e., an apical and a basolateral domain, each displaying a specific protein and lipid composition. The polarization is fundamental to the specialized functions of cells and newly synthesized lipid and proteins must therefore be delivered to the correct domain to maintain this cell polarity.
There are several mechanisms that cells can use for this purpose. In the direct pathway, newly synthesized membrane proteins are transported from the endoplasmic reticulum via the Golgi apparatus to the trans-Golgi network (TGN). After arrival in the TGN, proteins are packaged into distinct transport vesicles destined for the apical or basolateral domain. Alternatively, cells can use an indirect pathway for protein sorting, in which proteins are first transported from the TGN to the basolateral surface. They are then endocytosed and are subsequently either recycled to the basolateral surface, or are sorted from the basolateral proteins and delivered to the apical surface by transcytosis. Studies in several polarized cell types showed that the importance of each pathway depends on the cell type. MDCK epithelial cells use predominantly the direct pathway, while Caco-2 cells make use of both pathways (35).
Hepatocytes are polarized cells as well, with the apical or canalicular domain facing the bile canaliculus and the basolateral or sinusoidal domain facing the blood. In this cell type only the indirect pathway seems to be operational for the targeting of apical membrane proteins (5, 27, 38), although some evidence for direct protein transport between the Golgi and the apical plasma membrane also exists (1, 37).
Like proteins, lipids also have a polarized distribution. Using fluorescently labeled sphingolipid analogs, it has been demonstrated that in MDCK and Caco-2 cells, newly synthesized sphingolipids use a direct pathway and are sorted before they reach the plasma membrane, leading to an enrichment of glycosphingolipids in the outer leaflet of the apical plasma membrane (43, 46). No sorting of sphingolipids was observed during epithelial transcytosis (44). In hepatocytes, in which the direct route for sorting of apical membrane proteins seems to be absent, it has been suggested that lipids, destined for secretion into bile, are sorted in specific ER-derived vesicles that are transported via the Golgi to the canalicular membrane (34). For the bile salt lithocholate, a canalicular directed route that involved the Golgi apparatus has also been suggested (49).
Recently, molecular factors involved in the regulation of (polarized) membrane transport were identified. It has been shown that activation of the Gs class of heterotrimeric G proteins stimulates both transcytosis (8, 20) and transport from the TGN to the apical surface (31). The classical downstream target of Gs is adenylate cyclase. It has been demonstrated that an increase of intracellular cAMP and a subsequent activation of the cAMP-dependent protein kinase A (PKA),1 can stimulate transcytosis as well as TGN-to-apical transport (20, 32). Also for other kinases a role in apical transport was suggested. Activation of protein kinase C (PKC) by phorbol esters stimulates the apical transport of influenza hemagglutinin from TGN to the apical surface (32). Moreover, PKC was reported to stimulate basolateral-to-apical transcytosis (13).
In this study we have investigated the transport pathways by which the transfer of apically directed lipid is accomplished and whether, in analogy to protein transport, such transport pathways are regulated by kinase activity. Previously, we have identified a transcytosis-dependent and a transcytosis-independent (‘direct') lipid transport route, using fluorescent lipid analogs (50). In the current work we employed modulators of PKC and PKA activity to investigate the regulation of these membrane transport pathways. The results presented here show opposing effects of both kinases on apical sphingolipid transport. Moreover, reduced apical sphingolipid delivery, induced by the PKC activator PMA, correlated with the loss of the apical plasma membrane domain, whereas an elevation of intracellular cAMP induced a PKA-mediated enlargement of the apical domain. We therefore propose that both kinases have a function in the formation and maintenance of the apical membrane domain in HepG2 cells.
Materials and Methods
Materials
DME medium was obtained from GIBCO BRL Life Technologies (Paisley, Scotland); FCS was purchased from BioWhittaker (Verviers, Belgium). d-sphingosine, 1β-d-glucosylsphingosine, and sphingosylphosphorylcholine were from Matreya (Pleasent Gap, PA), and 6-[N-(7-nitrobenz-2-oxa-1,3 diazol-4-yl)amino]hexanoic acid (C6-NBD) was from Molecular Probes, Inc. (Eugene, OR). Forskolin and H89 (N-[2-(p-bromocinnamylamino) ethyl]-5-iso-quinolinesulfonamine) were from Calbiochem-Novabiochem Corporation (La Jolla, CA), and dibutyrylcAMP (dBcAMP) and bisindolylmaleimide (BIM) were purchased from Boehringer Mannheim GmbH (Mannheim, Germany). IBMX (3-isobutyl-1-methylxantine), TRITC- labeled phalloidin, staurosporine, phorbol-12-myristate-13-acetate (PMA) and Hoechst 33258 (bisbenzimide) were supplied by Sigma Chemical Co. (St. Louis, MO). Paraformaldehyde, HPTLC plates and organic solvents were from Merck (Darmstadt, Germany). The monoclonal antibodies against hepatic bile canaliculi (MAB 442) and villin were from Chemicon (Temecula, CA). The P-glycoprotein-specific mouse monoclonal antibody C219 was kindly provided by Han Roelofsen (University of Groningen, The Netherlands). FITC-conjugated antibodies were from Nordic Immunology Laboratories (Tilburg, The Netherlands).
Cell Culture
HepG2 cells were grown in DME medium containing 4.5 g/liter glucose, supplemented with 10% FCS, 2 mM l-glutamine, penicillin (100 IU/ml), and streptomycin (100 μg/ml), at 37°C in a humidified atmosphere of 5% CO2 in air. Experiments were performed 3 d after cell plating. We and others (14) found that at this time after plating, the ratio between bile canalicular structures and cells is maximal (see Table II). Cells were grown on 94-mm culture dishes for biochemical experiments and on glass coverslips for microscopy.
Table II.
dBcAMP Stimulates Formation of Bile canaliculi via PKA
| Ratio of bile canaliculi to total cells | ||
|---|---|---|
| Control | 1: 10.7 ± 0.5 | |
| dBcAMP | 1: 3.6 ± 0.4 | |
| H89 | 1: 10.2 ± 1.2 | |
| dBcAMP + H89 | 1: 7.2 ± 1 |
HepG2 cells were washed and incubated with 1 mM dBcAMP, 10 μM H89, or both in HBSS for 4 h at 37°C. When cells were incubated with both H89 and dBcAMP, the cells were preincubated with H89 for 30 min in HBSS, before the addition of dBcAMP. After the incubation, cells were washed and double stained for actin and nuclei, using TRITC–phalloidin and Hoechst 33258, respectively, as described in Materials and Methods. Cells were examined by fluorescence microscopy. For each condition, five random fields were scored for the total number of cells by counting nuclei, and the total number of bile canaliculi, stained with actin. Each field contained 200–300 cells. Data represent the mean ±SEM of four (control) or three (other conditions) individual experiments.
Synthesis of C6-NBD–sphingolipids
C6-NBD–ceramide (C6-NBD–Cer), C6-NBD–sphingomyelin (C6-NBD–SM), and C6-NBD–glucosylceramide (C6-NBD–GlcCer) were synthesized from C6-NBD and d-sphingosine, 1β-d-glucosylsphingosine and sphingosylphosphorylcholine, respectively (3, 23).
Cell Labeling and Lipid Transport Assays
Insertion and Back Exchange of Fluorescent Lipids.
Cells were washed three times with cold PBS. C6-NBD–lipids were added to cold HBSS by means of ethanolic injection. Lipids from a stock solution in chloroform/methanol (2:1 vol/vol) were dried under nitrogen and solubilized in absolute ethanol. The ethanolic solution was subsequently injected into HBSS under vigorous vortexing. The final concentration of ethanol did not exceed 0.5% (vol/vol).
When required, C6-NBD–lipids present in the outer leaflet of the plasma membrane were removed by a back exchange procedure. To this end the cells were incubated for 30 min at 4°C with 5% BSA in HBSS, followed by washing with cold HBSS. This procedure was repeated once.
Transcytosis of Lipids.
Transcytosis of sphingolipid was determined by labeling the plasma membrane of HepG2 cells with C6-NBD–GlcCer or -SM for 30 min at 4°C. The cells were then washed and subsequently incubated at 37°C for 15 min to allow internalization and transcytosis to the bile canalicular domain. The cells were then cooled to 4°C, and the lipid remaining in the outer leaflet of the plasma membrane was removed by a back exchange at 4°C. The apical labeling of the bile canalicular structures was determined semi-quantitatively by assessing the percentage of bile canaliculi that was NBD positive. The bile canaliculi, which are easily visualized under phase-contrast by their microvillar appearance, were classified as NBD positive or negative under epifluoresence illumination. In control cells, ∼70% of the total population of bile canaliculi was NBD positive after a 15-min incubation period at 37°C. Cells that were incubated with NBD lipids at 4°C only showed a background labeling of bile canaliculi of ∼10% of the total population.
Apical Delivery of De Novo Synthesized Lipids.
Cells were plated on coverslips and labeled with C6-NBD–Cer for 60 min at 4°C. To allow for synthesis of C6-NBD–GlcCer or -SM and their subsequent transport, an incubation was carried out at 37°C for 60 min in HBSS with or without 5% BSA. Cells that were incubated at 37°C in the absence of back-exchange medium (HBSS containing 5% BSA) were subjected to a back exchange afterwards, and the apical delivery of sphingolipids was determined as indicated above. In control cells, ∼50% of the total population of bile canaliculi was NBD positive after a 60-min incubation at 37°C. In cells that had been incubated at 4°C only, no NBD-positive bile canaliculi were observed (not shown).
Metabolism of C6-NBD–Cer and Basolateral Delivery of De Novo Synthesized Sphingolipids.
Cells were plated in 94-mm culture dishes and labeled with C6-NBD–Cer for 60 min at 4°C. The cells were then incubated for 60 min at 37°C in HBSS containing 5% BSA. Subsequently they were washed and scraped from the culture dish. Lipids from the incubation medium and cells were extracted and quantified as described below.
Total Endocytic Uptake of Sphingolipids.
The total endocytic uptake of sphingolipids was determined by labeling cells with C6-NBD–GlcCer or -SM for 30 min at 4°C. The cells were then washed and incubated at 37°C. At the end of the incubation the cells were cooled to 4°C, and the lipid remaining in the outer leaflet of the plasma membrane was removed by back exchange at 4°C. After washing, the cells were scraped from the culture dish. Lipids from the back-exchange medium and the cells were extracted and quantified. In the time span of our experiments (15 min at 37°C) no degradation of C6-NBD–GlcCer or -SM occurred, as revealed by thin layer chromatography.
Lipid Extraction and Quantification.
Lipids from cells and back-exchange media were extracted according to the method of Bligh and Dyer (7). NBD lipids were separated by thin layer chromatography and quantified fluorometrically as described previously (24).
Immunofluorescence and Other Staining Procedures
To stain F-actin, cells were washed with PBS and fixed for 10 s at −20°C in ethanol. F-Actin was then stained using 100 ng/ml TRITC-labeled phalloidin in PBS for 30 min at room temperature. To determine the ratio of bile canaliculi per number of cells, cells were fixed with ethanol and doublestained with 5 ng/ml of the nuclear stain Hoechst 33258 and 100 ng/ml TRITC–phalloidin, for 30 min in PBS at room temperature. For staining of the bile canalicular specific antigen with MAB442, cells were fixed with 3% paraformaldehyde in PBS for 30 min and permeabilized with 0.1% Triton X-100 in PBS for 10 min. Cells, stained for villin, were fixed and permeabilized for 5 min at −20°C in acetone. Cells were then washed in PBS, incubated for 30 min in PBS containing 2.5% FCS (PBS/FCS) to block nonspecific binding sites, and subsequently incubated with primary mouse monoclonal antibody, diluted in PBS/FCS (anti-villin 1:50, MAB 442 1:25). For staining P-glycoprotein, cells were fixed for 5 min at −20°C in acetone. The cells were incubated overnight with the P-glycoprotein– specific mouse monoclonal antibody C219 at 4°C. After several washings, the primary antibodies were revealed with FITC-conjugated goat anti– mouse antibodies. Before microscopic examination, the cells were embedded in glycerol containing 2.5% 1, 4-diazobicyclo[2.2.2]octane to prevent bleaching.
Microscopy
Cells were examined using an epifluorescence microscope (Provis AX70; Olympus Corp., New Hyde Park, NY). Photographs were taken using Illford HP-5 plus film.
Gel Electrophoresis and Western Blotting
Cells were treated with 100 nM PMA, 500 nM BIM, or both, for 1 or 4 h. Cells were then washed in PBS and scraped from the culture dish. The cells were spun down, solubilized in SDS sample buffer, and boiled for 5 min. Protein was determined according to Peterson's modification of Lowry et al. (30). Equal amounts of protein (20 μg) were separated on a 10% acrylamide gel using the system of Laemmli (26). Proteins were transferred to Immobilon-P PVDF membrane (Millipore Corporation, Bedford, MA) by Western blotting using the method of Towbin et al. (42). Membranes were rinsed with PBS and incubated for 2 h with 10% nonfat dry milk in PBS to reduce nonspecific binding. The membranes were washed in PBS containing 0.3% Tween 20 (PBS/Tween) and incubated overnight at room temperature with primary antibody in PBS/Tween containing 1% nonfat dry milk. The membranes were washed three times with PBS/Tween and were subsequently incubated with alkaline phosphatase-conjugated sheep anti–mouse conjugated IgG antibodies. The membranes were washed three times in PBS/Tween, and alkaline phosphatase was visualized using p-nitroblue tetrazolium and 5-bromo-4-chloro-3-idolyl phosphate.
Results
Sphingolipids Are Transported to Apical Membranes Via a Direct Route and Via Transcytosis
Previous work showed (50) that well differentiated human hepatoma HepG2 cells contain a bile canalicular or apical membrane domain to which fluorescent lipid analogs are targeted. Apical lipid transport occurs via both basolateral to apical transcytosis and a transcytosis-independent route, which involves transport of Golgi-derived, de novo synthesized sphingolipids. Throughout this work we refer to the latter pathway as the ‘direct' transport route since it does not involve flow of newly synthesized sphingolipids via the plasma membrane (see below), before their delivery to the apical plasma membrane. Neither transport route is specific for the HepG2 cell line, but were also demonstrated to operate in isolated human hepatocyte couplets (50). The present work was undertaken to study the mechanisms that may be involved in the regulation of transcytotic and direct apical lipid transport. Transport of de novo synthesized sphingolipid from the Golgi apparatus to the apical domain was studied by monitoring the flow of fluorescent C6-NBD–SM and -GlcCer, synthesized from the exogenously added short-chain sphingolipid precursor, C6-NBD–Cer (22). After accumulation in the Golgi, the lipid products are transported to the bile canaliculus (50) and to the basolateral plasma membrane. Lipid arriving at the basolateral plasma membrane was extracted from the outer leaflet by the presence of BSA in the incubation medium, thereby preventing lipid from re-entering the cells by means of endocytosis. It should be emphasized that labeling of the bile canalicular membrane domain was accomplished by vesicular transport of C6-NBD–SM and -GlcCer, rather than by labeling as a result of monomeric exchange of C6-NBD–Cer, which primarily resides in the Golgi lumen (see 29). Thus, in the presence of an inhibitor of sphingolipid biosynthesis, d,l-threo-1-phenyl-2-decanoyl amino-3-morpholino-1-propanol (PDMP), labeling of the bile canaliculi is not observed, in spite of the excess of C6-NBD–Cer, present under these conditions (not shown). Neither displays the significant labeling of the apical domain seen when lipid transport exiting from the Golgi is inhibited in the presence of 10 μM monensin (45). By exogenous addition of C6-NBD–SM and -GlcCer, basolateral endocytosis and subsequent transcytotic delivery of sphingolipids to the apical domain was studied (the ‘indirect pathway') and compared with the transport of the de novo formed sphingolipids.
In Fig. 1, typical labeling of bile canaliculi as accomplished via either pathway is shown. Note the remarkable, pathway-dependent differences in labeling pattern. Cells labeled with C6-NBD–SM (Fig. 1 a) showed brightly labeled bile canaliculi and, in addition, a punctate vesicular staining. The latter presumably originates from the presence of the lipid analog in endosomal compartments, in analogy with other studies (24, 25). When cells were labeled with C6-NBD–GlcCer, a similar labeling pattern was observed (data not shown). Interestingly, the vesicular labeling that we observed when NBD sphingolipids were added exogenously to the cells was conspicuously absent when de novo synthesized sphingolipids were transported to the bile canaliculi. When the cells were labeled with C6-NBD–Cer and subsequently incubated at 37°C to allow metabolism and transport of the sphingolipid products, only the Golgi apparatus and the bile canaliculi were prominently labeled. Both in the absence (Fig. 1 b) and presence (not shown) of BSA in the incubation medium, an identical labeling pattern was obtained, implying that apical transport of Golgi-derived sphingolipids did not involve prior delivery to the basolateral plasma membrane, followed by endocytic uptake.
Figure 1.
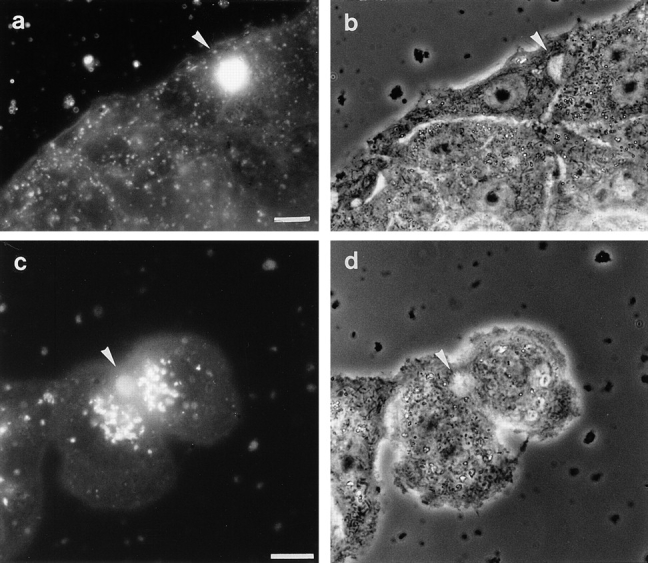
Transfer of fluorescent lipid analog to bile canaliculi via the direct pathway and via transcytosis. HepG2 cells were labeled at 4°C with 3 μM C6-NBD–Cer to reveal the direct pathway and C6-NBD–SM to visualize the transcytosis-dependent pathway, as described in Materials and Methods. Cells labeled with C6-NBD–SM were incubated at 37°C for 15 min to allow endocytic uptake of the lipid. To remove C6-NBD–SM remaining in the basolateral plasma membrane, the cells were back exchanged after the 37°C incubation. Cells labeled with C6-NBD–Cer were incubated at 37°C for 60 min to allow synthesis and subsequent transport of C6-NBD–lipid products in the absence of back exchange medium. After the 37°C incubation, the cells were back exchanged. (a) Cells labeled with C6-NBD– SM display a bright labeling of the bile canaliculus (arrowhead) and an additional, vesicular staining pattern. (c) Cells that were labeled with C6-NBD–Cer show an accumulation of NBD fluorescence, typical for localization at the Golgi apparatus and in the bile canaliculus (arrowhead). Note the absence of a vesicular staining pattern in cells that were labeled with C6-NBD–SM (a). (b and d are phase contrast images corresponding to a and c, respectively.) Bars, 10 μm.
Staurosporine Stimulates Transcytosis of Sphingolipids but Inhibits Apical Delivery of De Novo Synthesized Sphingolipid
Studies in polarized epithelial cells showed that kinase activity regulates protein transport from the TGN to the apical surface, while only minor effects on the basolateral delivery were found (10, 20, 32). To examine whether kinases play a role in the regulation of apical lipid transport, the effect of staurosporine, a potent kinase inhibitor, was determined. As shown in Fig. 2, in HepG2 cells, staurosporine inhibited direct sphingolipid transport to the bile canaliculi and had a small, but reproducible, stimulating effect on the transcytosis of basolaterally applied C6-NBD–GlcCer or -SM. The transport of de novo synthesized lipids was also inhibited by staurosporine when BSA was not present in incubation medium, confirming a transport pathway between Golgi and the apical membrane that is essentially endocytosis independent, and emphasizing that both transport routes are regulated differentially by kinase activity.
Figure 2.


Effect of staurosporine on apical lipid transport. HepG2 cells were preincubated with 100 nM staurosporine in HBSS at 37°C for 30 min. Cells were then cooled and, in the presence of staurosporine, labeled and incubated with 3 μM C6-NBD–Cer for determining lipid transport in the direct pathway (A) and 3 μM C6-NBD–SM or -GlcCer for that in the transcytosis-dependent pathway (B). Cells that were labeled with C6-NBD–Cer were incubated at 37°C both in the absence and presence of back-exchange medium. Apical transport of lipids was determined by assessing the percentage of labeled bile canaliculi as described in Materials and Methods. In each experiment a minimum of 50 bile canalicular structures was counted. Each column represents the mean of three to five independent experiments ±SEM. A shows the effect of staurosporine (SSP) on the direct pathway in cells incubated for 60 min in the presence of back-exchange medium, or 30 and 60 min in the absence of back- exchange medium. B shows the effect of staurosporine on the transcytosis of C6-NBD–GlcCer (white bars) and -SM (black bars).
Labeling of the bile canaliculi depends on the conversion of C6-NBD–Cer into its products C6-NBD–SM and -GlcCer (50), which implies a requirement of sphingolipid synthesis for the occurence of apical transport of these fluorescent analogs (see also above). As a control, we therefore examined whether staurosporine inhibits the metabolism of C6-NBD–Cer, which would also result in a reduced sphingolipid transport to the apical membrane. The metabolism of C6-NBD–Cer was analyzed under the same conditions as those used in the apical transport assay. Unexpectedly, staurosporine stimulates the conversion of C6-NBD–Cer to -SM and -GlcCer (Table I). However, the relative transport to the basolateral plasma membrane, as determined by the fraction of total lipid that can be back exchanged, is not influenced by staurosporine. Therefore, the absolute amounts of basolaterally transported C6-NBD–GlcCer and -SM are higher in staurosporine-treated cells. Nevertheless, the results are entirely consistent with the notion that staurosporine inhibits the direct, TGN- to-apical membrane transport pathway.
Table I.
Staurosporine Stimulates the Synthesis and Basolateral Transport of C6-NBD-SM and GlcCer
| Percentage of total NBD lipid | ||||||||||||
|---|---|---|---|---|---|---|---|---|---|---|---|---|
| Back-exchange medium | Intracellular | Total | ||||||||||
| GlcCer | SM | GlcCer | SM | GlcCer | SM | |||||||
| Control | 6.5 ± 1.6 | 17.8 ± 1.8 | 1.8 ± 0.7 | 6.3 ± 1.0 | 8.3 ± 2.3 | 24.2 ± 1.4 | ||||||
| (% of total) | (78%) | (74%) | ||||||||||
| + Staurosporine | 9.2 ± 0.8 | 24.2 ± 5.4 | 2.4 ± 0.8 | 8.5 ± 2.8 | 11.3 ± 1.5 | 31.6 ± 4.1 | ||||||
| (% of total) | (79%) | (74%) | ||||||||||
Cells were preincubated with 100 nM staurosporine in HBSS at 37°C for 30 min. Cells were then cooled and, in the presence of staurosporine, labeled and incubated with 3 μM C6-NBD–Cer as described in Materials and Methods. Subsequently the cells were incubated at 37°C for 60 min in back-exchange medium and, after washing, scraped from the culture dish. The lipids were extracted from the back-exchange medium, and the cells and the NBD lipids were quantified as described in Materials and Methods. The percentage of lipid transported to the plasma membrane is indicated in parentheses. Data represent mean values ±SEM (n = 4).
The staurosporine-induced enhancement of basolateral-to-apical transcytotic transport of C6-NBD–GlcCer and -SM could have relied upon an increase of total cellular uptake. The total uptake was determined after labeling cells with sphingolipid analogs for 30 min at 4°C. After washing, cells were incubated at 37°C for several time intervals, cooled, and back exchanged to remove lipid remaining in the basolateral plasma membrane. The intracellular lipid pool was subsequently quantified as described in Materials and Methods. No enhancement of the intracellular pools could be detected upon treatment by staurosporine over the time span of the transcytosis studies (Fig. 3). The increased labeling of the apical membrane by transcytosis therefore does not correlate with a stimulation of endocytosis of the sphingolipids by staurosporine. Rather, the data would support an enhanced efficiency of transcytotic trafficking from an internal pool.
Figure 3.

The effect of staurosporine on the total cellular uptake of C6-NBD–SM and -GlcCer. HepG2 cells were preincubated with 100 nM staurosporine in HBSS at 37°C for 30 min. Cells were then cooled and, in the presence of staurosporine, labeled and incubated with 3 μM C6-NBD–SM or -GlcCer at 4°C, as described in Materials and Methods. Cells were then washed and incubated at 37°C for the indicated time intervals. After the incubation, cells were washed with cold PBS, back exchanged, and scraped from the culture dish. Lipids from the cells were extracted and NBD lipids were quantified as described. The data are shown as the mean of three independent experiments ±SEM. Open symbols represent internalization of C6-NBD–GlcCer in control (○) and staurosporine-treated (▿) cells. Closed symbols reflect internalization of C6-NBD–SM in control (•) and staurosporine-treated (▾) cells.
Apical Sphingolipid Transport Is Inhibited by Protein Kinase C Activity
Since staurosporine is a nonspecific inhibitor of several kinases (36), a more detailed analysis of the kinases involved in the regulation of apical sphingolipid transport was required. As shown in Fig. 4, the phorbol ester phorbol 12-myristate 13-acetate (PMA), a compound that can substitute for the physiological activator of PKC, diacylglycerol, inhibits the apical transport of sphingolipids. In fact, both the direct pathway of de novo synthesized C6-NBD–GlcCer and -SM (Fig. 4 A), and transcytosis of basolaterally applied C6-NBD–GlcCer and -SM (Fig. 4 B) are inhibited. In case of transport of newly synthesized sphingolipid analogs from the Golgi to the apical membrane, the direct pathway, an inhibition of ∼20% was seen at concentrations as low as 5 nM. When raising the concentration to 20 nM, an inhibition of ∼30% was obtained (Fig. 4 A). The inhibitory effects of PMA were not caused by an alteration of the metabolism of C6-NBD–Cer (see above). Thus, 20 nM PMA affected neither the synthesis nor basolateral transport of de novo synthesized C6-NBD–GlcCer and -SM (data not shown). Furthermore, the inhibitory effect of PMA on sphingolipid transcytosis did not correlate with an inhibition of the total cellular internalization of lipids in treated cells. In fact, PMA slightly stimulated the internalization of C6-NBD–SM but did not affect -GlcCer internalization (see Fig. 11). Importantly, in both control and PMA-treated cells, no significant degradation (<5%) of NBD-labeled sphingolipid occurred over the time interval of these experiments.
Figure 4.

PKC activity inhibits apical transport of sphingolipids. A shows the effect of activator (PMA) or inhibitor (BIM) of PKC activity on direct transport of sphingolipids. In the presence of PMA and/or BIM, cells were labeled with 3 μM C6-NBD– Cer at 4°C, as described in Materials and Methods. Cells were then incubated at 37°C for 60 min in back-exchange medium, while PMA and/or BIM remained in the solution. Subsequently, cells were washed and apical transport was determined as described in Materials and Methods. B shows the inhibition of transcytosis of C6-NBD–SM and -GlcCer by PKC activity. Cells were incubated with 3 μM C6-NBD–GlcCer (white bars) or -SM (black bars) at 4°C in the presence of PMA and/or BIM. After a 15-min incubation at 37°C in the presence of PMA and/or BIM, the cells were washed, cooled, and back exchanged. Apical transport was determined as described in Materials and Methods. Note that in all experiments, the inhibitor BIM (100 nM) was preincubated with the cells at 37°C for 30 min.
Figure 11.

The effect of PMA, cAMP, and H89 on total cellular uptake of C6-NBD–SM and -GlcCer. HepG2 cells were preincubated with 20 nM PMA, 1 mM dBcAMP, or 10 μM H89 in HBSS at 37°C for 30 min. Cells were then cooled and, in the presence of the drugs, labeled and incubated with 3 μM C6-NBD–SM or -GlcCer at 4°C. Subsequent incubations were carried out at 37°C for the indicated time intervals. After the incubation, the cells were washed with cold PBS, back exchanged, and scraped from the culture dish. Lipids were extracted, and NBD lipids were quantified as described. Data points represent the mean of three independent experiments ±SEM. (A) Internalization of C6-NBD–GlcCer in control (○), PMA-treated (□), dBcAMP-treated (▵), and H89-treated (▿) cells. (B) Internalization of C6-NBD–SM in control (•), PMA-treated (▪), dBcAMP-treated (▴), and H89-treated (▾) cells.
To obtain further support for the specific involvement of PKC activity in regulating sphingolipid transport, we repeated the sphingolipid transport experiments in the presence of a specific inhibitor of PKC, bisindolylmaleimide (BIM). The cells were preincubated with BIM before labeling with sphingolipid, while during cell labeling and all subsequent incubations, both BIM and PMA were kept present. As shown in Fig. 4, the inhibitory effect of PMA on direct and transcytotic sphingolipid transport could be overcome upon addition of BIM. Consistent with this balanced effect of PMA (PKC activator) and BIM (PKC inhibitor) was the observation that treatment with BIM alone stimulated apical sphingolipid delivery. This stimulating effect of BIM was seen to occur in both transport routes (Fig. 4). In control experiments, analogous to those described above (Table I), it could be excluded that BIM affected de novo synthesis and basolateral transport of C6-NBD–GlcCer and -SM (data not shown).
Protein Kinase C Induces Depolarization of HepG2 Cells
The data presented above show that, in the concentration range of 5–20 nM, PMA inhibits sphingolipid transport to the apical domain in HepG2 cells. When raising the concentration of PMA to 100 nM, fluorescently labeled bile canaliculi were no longer detectable. Indeed, above concentrations of 100 nM and up to 2 μM, bile canalicular structures, readily identified by their microvillar appearance, as revealed by phase-contrast microscopy, could no longer be observed. In HepG2 cells, bile canaliculus formation is accompanied and correlated with the accumulation of actin filaments and the microvilli-associated protein villin at the bile canalicular membrane (40). To investigate, therefore, the seemingly inhibitory effect of PKC activity on the biogenesis or maintenance of the canalicular domain, the intracellular organization of actin filaments and villin was examined in control and PMA-treated cells, using TRITC-labeled phalloidin to detect actin and a monoclonal antibody against villin. As shown in Figs. 5 and 6, in control cells an intensive staining of actin around the bile canalicular structures (Fig. 6 a) and a specific staining of villin of the bile canalicular microvilli is observed (Fig. 5). MAB442, an antibody specific for the bile canalicular membrane in human hepatocytes, was found to have a bile canalicular localization in HepG2 cells as well (Fig. 7 a). Remarkably, after a 60-min treatment with 100 nM PMA, actin staining around bile canalicular membranes, as seen in untreated cells, was almost completely abolished; instead, actin had redistributed along the lateral membranes (Fig. 6 b). Moreover, when cells were treated for 4 h with PMA, the lateral staining was no longer observed, and actin filaments were scattered throughout the cell (Fig. 6 c). Treatment of HepG2 cells with 100 nM PMA for 60 min also had a dramatic effect on the bile canaliculi per se, as judged by the redistribution of the bile canalicular markers villin (not shown) and MAB442 (Fig. 7 b). The canalicular membrane labeling completely disappeared, leaving only some faint background labeling of the cells. To obtain further support for this notion, we examined whether PMA also induced the redistribution of integral canalicular membrane proteins. To this end, we stained control and PMA-treated cells for P-glycoprotein, using the P-glycoprotein–specific monoclonal antibody C219. As we found for the other canalicular markers, the bile canalicular-specific labeling observed in control cells was almost completely abolished in cells treated with 100 nM PMA. After 60 min, the total number of bile canaliculi had decreased by >80% (Fig. 8). After 4 h, ∼95% of the bile canaliculi had disappeared (data not shown).
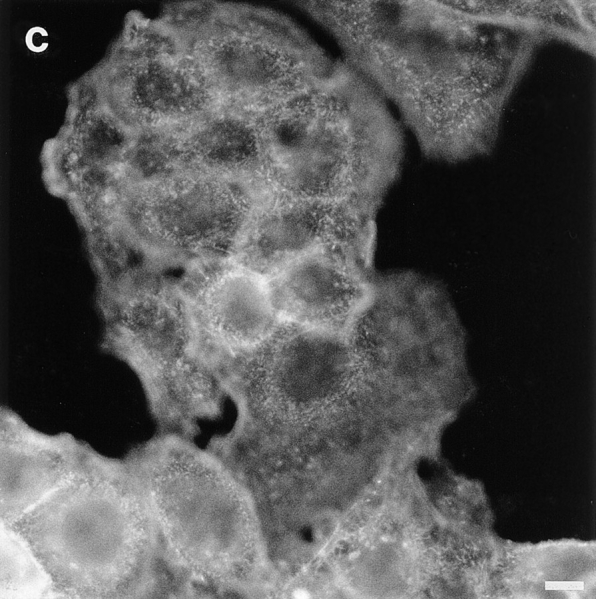
Figure 5.

Villin is specifically located in bile canaliculi in HepG2 cells. HepG2 cells were fixed and stained for villin using a monoclonal antibody. Note the specific location of villin in the bile canalicular microvilli. Bar, 10 μm.
Figure 6.

PMA causes a reorganization of actin filaments and depolarization of HepG2 cells. Cells were washed and incubated with 0.1% DMSO (control; a), or 100 nM PMA in HBSS at 37°C for 60 min (b) and 4 h (c). Cells were then fixed and stained for actin using TRITC-labeled phalloidin, as described. Note that actin filaments, located around bile canaliculi in control cells (a), redistribute upon PMA treatment (b and c). Bars, 10 μm.
Figure 7.

PKC activity causes the redistribution of a bile canalicular antigen. Cells were preincubated with 500 nM of the PKC inhibitor BIM in HBSS at 37°C for 30 min (c and d), followed by an incubation for 60 min in HBSS, containing 0.1% DMSO (control; a), 100 nM PMA (b), 500 nM BIM (c), or both (d). Finally, the cells were fixed and stained with MAB442 as described in Materials and Methods. Note that the bile canalicular antigen to which MAB442 is directed, redistributes upon PMA treatment, which is counter-acted by BIM. Bars, 10 μm.
Figure 8.
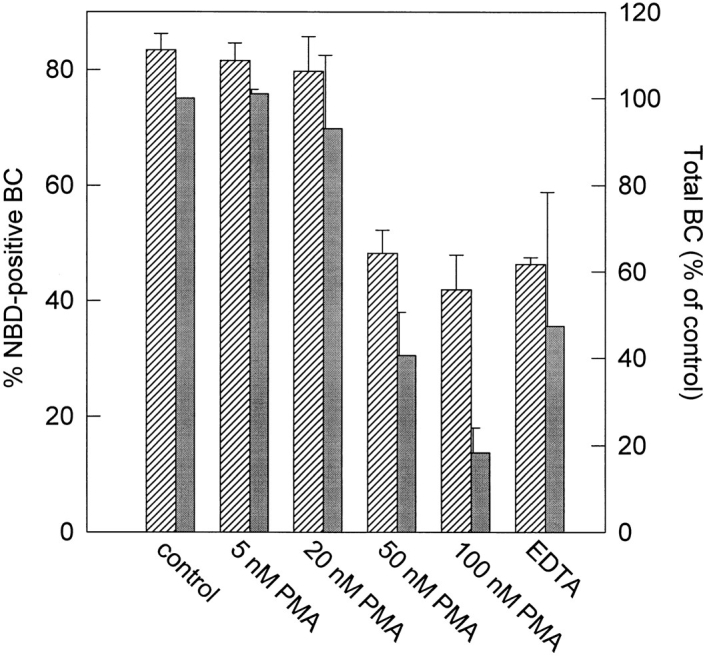
Opening of tight junctions and depolarization of HepG2 cells depends on the concentration of PMA. Cells were labeled with 3 μM C6-NBD–SM at 4°C, as described in Materials and Methods. The cells were then washed and allowed to accumulate the fluorescent lipid in the apical domain, as accomplished by an incubation in HBSS at 37°C for 30 min. Cells were then treated with increasing concentrations of PMA in HBSS at 37°C for 30 min. As a positive control, tight junctions were opened by treatment with 25 mM EDTA in HBSS without Ca2+, at 37°C for 15 min. After the incubations, the cells were washed, cooled, and back exchanged. Cells that were treated with EDTA were back exchanged in back-exchange medium without Ca2+. The percentage of NBD-positive bile canaliculi was determined (crosshatched bars). In a parallel experiment, the total number of bile canaliculi was determined by staining the cells with the P-glycoprotein–specific antibody C219. The total number of bile canaliculi in PMA-treated cells, and cells that were treated with EDTA, was expressed as a percentage of control values (grey bars). Data represent the mean ±SEM of three independent experiments.
To exclude potential artifacts and to determine whether the morphological effect of PMA was caused by a specific activation of PKC, the effect of the PKC inhibitor BIM on the structural rearrangements of actin filaments and the bile canalicular markers upon PMA addition, was determined. In Fig. 7 it is shown that cells pretreated with BIM did not display a redistribution of MAB442 after a subsequent PMA treatment (Fig. 7 c). Also in phase-contrast images, or after actin and villin staining, it could be demonstrated that the cells remained polarized upon a combined PMA/BIM treatment, showing bile canaliculi that could not be distinguished from those in untreated cells (data not shown). This suggests that the depolarization of HepG2 cells that occurred upon PMA treatment is mediated by activation of PKC. Finally, treatment of the cells with BIM alone did not give rise to any microscopically detectable perturbation of cellular morphology over a period of 60 min (Fig. 7 d).
To determine the fate of the bile canalicular markers villin and MAB442 upon PMA-induced cell depolarization, the levels of both proteins were determined after the various treatments. As shown in Fig. 9, the levels of villin in cells treated with either PMA, BIM, or a combination of PMA and BIM, remained virtually unaltered. Identical results were obtained for the levels of the protein to which MAB442 was raised (data not shown). Thus, these results indicate that the bile canalicular proteins are neither expelled from the cell nor rapidly degraded but rather redistributed intracellularly upon activation of PKC activity.
Figure 9.

PMA treatment does not change levels of villin in depolarized cells. Cells were washed and incubated with 0.1% DMSO (control; lane 1), 100 nM PMA (lane 2), 500 nM BIM (lane 3), or both (lane 4) at 37°C in HBSS for 4 h. Gel electrophoresis and Western blotting using a monoclonal antibody against villin were performed as described in Materials and Methods. Note that both PKC modulators do not affect the levels of villin. Bars show quantitation of the Western blot by laser densitometric scanning and represent the mean of two independent experiments.
PKC-mediated Cell Depolarization Involves an Inhibition of Apical Sphingolipid Transport and Is Related to the Mechanism Responsible for Cell Depolarization
As described above, we observed that at low concentrations (5–20 nM), PMA inhibits apical lipid transport, while higher concentrations (100 nM) cause a complete disappearance of the apical domain. Because the apical markers redistribute intracellularly during cell depolarization, it is possible that tight junctions open during depolarization, which could result in the observed redistribution. The inhibition of apical lipid transport by low PMA concentrations could therefore be the result of a partial opening of the tight junctions, allowing the apical lipid to reach the basolateral surface from where it might have been removed by back exchange in the lipid transport assay. To examine such a potential effect of PMA on the tight junctions, we allowed the cells to accumulate C6-NBD–SM in the apical domain by incubating them with this lipid at 37°C for 30 min. Cells were then treated with increasing concentrations of PMA or EDTA as a positive control. Subsequently the cells were back exchanged at 4°C to determine the percentage of bile canaliculi from which the lipid could be extracted. In a parallel experiment, the total number of bile canaliculi was determined, by staining them with the P-glycoprotein specific antibody C219. As shown in Fig. 8, the results of this experiment revealed that at low concentrations of PMA (5–20 nM), the tight junctions remain closed and that depolarization of the cells does not occur. Only after raising the PMA concentration up to 100 nM, apically located lipid becomes accesible for back exchange to a level that was also accomplished after treatment of the cells with EDTA. Hence, opening of the tight junctions closely correlates with the ultimate depolarization of the cells. We conclude therefore that the reduced labeling of bile canaliculi at low PMA concentration, shown in Fig. 4, is indeed due to PKC-regulated sphingolipid transport. In addition to a decrease in apically directed sphingolipid transport, at higher PMA concentrations, opening of the tight junctions further participates in a dissipation of the apical domain, including the labeled sphingolipids.
cAMP Stimulates Apical Sphingolipid Transport
As demonstrated above (Fig. 2), the kinase inhibitor staurosporine inhibited transport of de novo synthesized sphingolipids in HepG2 cells. This result suggests that a kinase other than PKC is positively regulating the direct lipid transport route. Indeed, several investigators have reported a stimulation of apical vesicular transport in both MDCK cells and hepatocytes by cAMP (6, 9, 12, 32), suggesting an involvement of protein kinase A (PKA) activity in this process (32). These results prompted us to investigate the role of cAMP on apical sphingolipid transport. We therefore modulated the intracellular levels of cAMP by using dibutyrylcAMP (dBcAMP) or forskolin, an activator of adenylate cyclase. In the latter case, IBMX, an inhibitor of phosphodiesterase, was included in some experiments to prevent degradation of the newly synthesized cAMP.
As demonstrated in Fig. 10, elevation of intracellular cAMP stimulates apical sphingolipid transport both via the direct route (Fig. 10 A) and via transcytosis (Fig. 10 B). The stimulation of transcytotic lipid delivery did not result from a dBcAMP-induced enhancement in cellular uptake of exogenously supplied sphingolipids (Fig. 11). Upon treatment of the cells with 1 mM dBcAMP, a stimulation of 42% was observed in the transport of newly synthesized fluorescent GlcCer and SM from Golgi to apical membrane, i.e., the direct route (Fig. 10 A). With 1 μM forskolin, the stimulation was less. However, when the concentration was raised to 50 μM while 1 mM IBMX was included, direct apical sphingolipid transport was stimulated to a similar extent as observed upon treatment with dBcAMP. The stimulation of the direct transport route was not due to an increased synthesis of Golgi-derived sphingolipids, as dBcAMP did not have any effect on the de novo synthesis of C6-NBD–SM and -GlcCer as such (data not shown). To investigate whether the effects of cAMP were mediated via PKA, the effect of a specific PKA inhibitor, H89, was subsequently examined. As shown in Fig. 10 A, this compound drastically inhibits the direct transport pathway of sphingolipids, suggesting that PKA is indeed positively regulating apical lipid transport. Control experiments showed that H89 had no effect on the de novo synthesis of C6-NBD–SM and -GlcCer (data not shown).
Figure 10.

PKA activity stimulates apical transport of sphingolipids. HepG2 cells were preincubated with various PKA modulators in HBSS at 37°C for 30 min. The compounds were kept present during further incubations. A shows the effect of PKA activity on direct transport. Cells were labeled with 3 μM C6-NBD–Cer at 4°C, as described in Materials and Methods. After an incubation at 37°C for 60 min in back-exchange medium, the cells were washed and apical transport was determined as described. Data represent the mean ±SEM of three to five independent experiments of cells treated with 0.1% DMSO (control), 1 μM forskolin (1 μM FSK), 50 μM forskolin combined with 1 mM IBMX (50 μM FSK/IBMX), 1 mM dBcAMP (dBcAMP), or 10 μM H89 (H 89). B shows the stimulation of transcytosis of exogeneously inserted C6-NBD–SM and -GlcCer by dBcAMP. Cells were labeled with 3 μM C6-NBD–GlcCer (white bars) or -SM (black bars) at 4°C. After warming at 37°C for 15 min in HBSS, the cells were subsequently washed, cooled, and back exchanged. Apical transport was determined as described in Materials and Methods. Data represent the mean of three independent experiments ±SEM.
cAMP Stimulates HepG2 Polarization Via Activation of Protein Kinase A
As shown above, PKC-induced inhibition of apical sphingolipid transport was accompanied by changes in the morphology of the cells and finally resulted in the disappearance of the apical domain (Figs. 6 and 7). It was of interest therefore, to investigate whether stimulation of apical sphingolipid transport (by cAMP) was analogously reflected by morphological effects on the bile canaliculi in HepG2 cells. To test this, the distribution of actin was determined in HepG2 cells that had been treated with dBcAMP or with forskolin and IBMX. To specifically relate such changes to PKA activation, actin distribution was also determined in cells that had been preincubated with the PKA inhibitor H89, before subsequent treatment with dBcAMP. As shown in Fig. 12 and Table II, an increase in bile canalicular structures, both in number and size, was seen after treatment of the cells with dBcAMP or forskolin/IBMX. Preincubation of the cells with H89, before the addition of dBcAMP, prevented the formation of the large bile canaliculi, seen in cells that had only been treated with dBcAMP (Fig. 12 d). To quantify the total amount of bile canalicular structures in untreated and dBcAMP-treated cells, the cells were double stained with the nuclear stain Hoechst 33258 and TRITC-labeled phalloidin, as a measure for total cells and bile canaliculi, respectively. From Table II it becomes apparent that after a 4-h treatment with dBcAMP, the amount of bile canaliculi per number of cells increased dramatically, showing almost three times more bile canalicular structures compared to the number of such structures in untreated cells. Preincubation with H89 inhibited the dBcAMP effect, indicating that the increase of the amount of bile canaliculi was mediated via PKA activation.
Figure 12.
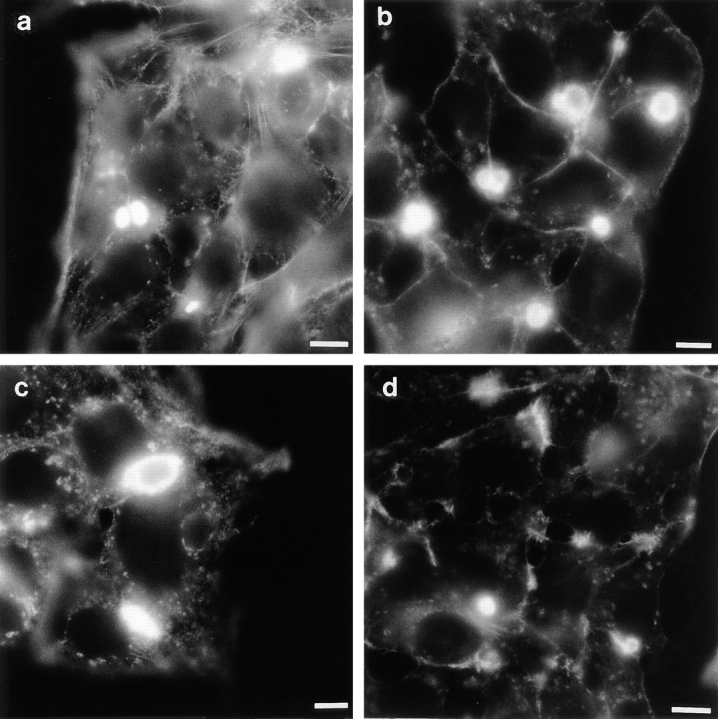
cAMP induces a PKA-dependent increase in number of and enlargement of bile canaliculi. HepG2 cells were incubated for 4 h at 37°C in HBSS (a) supplemented with either 1 mM dBcAMP (b), 50 μM forskolin and 1 mM IBMX (c), or 1 mM dBcAMP and 10 μM H89 (d). In the latter case cells had been preincubated with 10 μM H89 in HBSS at 37°C for 30 min before the addition of dBcAMP. After the incubation the cells were washed, fixed in ethanol, and bile canaliculi stained, using the actin stain TRITC–phalloidin, as described in Materials and Methods. Note the enlargement of bile canaliculi, when compared to control cells (a), in cells that have been treated with agents that induce an increase in intracellular cAMP concentration (b and c) but not in cells that were treated with both dBcAMP and the PKA inhibitor H89 (d). Bars, 10 μm.
Discussion
In this report we provide evidence that protein kinases are responsible for the generation of a polarized cell morphology in HepG2 cells. The inhibition of apical sphingolipid transport by PKC and stimulation of this transport by PKA are entirely consistent with the depolarizing and hyperpolarizing effect, respectively, of both kinases. Although the kinase-induced effects on lipid transport are not directly causing the depolarization or hyperpolarization, changes in both phenonema, as controlled by kinase activity, are directly reflected by adjustment in vesicular lipid transport, which is most likely an instrument in the biogenesis and maintenance of bile canalicular structures in this human hepatoma cell line.
As measured by monitoring the transport of fluorescently labeled SM and GlcCer, sphingolipid transport to the bile canalicular structures, located between adjacent cells, involves two different transport routes: (a) a transcytotic pathway of basolaterally located sphingolipids and (b) a transcytotic-independent (i.e., ‘direct') pathway of Golgi-derived, de novo synthesized sphingolipids. Based on several observations we conclude that there are no common compartments through which gross lipid transport along both pathways proceeds and that they can operate, at least in part, independently. First, the fluorescence distribution patterns obtained for either pathway are entirely different (Fig. 1). Furthermore, irrespective of the presence of BSA, no distinguishable differences were observed in the labeling pattern in the direct pathway. This observation implies that over the timespan of the experiment, substantial intermixing of the apical pool of lipids and that of lipids initially arriving basolaterally, does not occur. Second, the kinase inhibitor staurosporine displayed differential effects on both transport routes, causing a small stimulation of basolateral-to-apical transcytosis of exogenously added sphingolipids but a pronounced inhibition of the direct route, again irrespective of the presence of BSA.
Both the direct apical delivery of sphingolipid and the transcytotic sphingolipid transport pathway are regulated by kinase activity. The results presented show that activation of PKC activity by PMA results in an inhibition of apical sphingolipid transport while activation of PKA by dBcAMP stimulates sphingolipid transport to the apical domain. The inhibiting effect of PMA on apical sphingolipid transport was eliminated by simultaneous addition of BIM, a specific inhibitor of PKC activity, while BIM itself stimulated transport. Likewise, H89, a specific inhibitor of PKA activity, opposed the effects of dBcAMP and inhibited apical sphingolipid transport.
To the best of our knowledge, this is the first demonstration that stimulation or inhibition of apically directed transport is actually reflected by morphological alterations of cell polarity. Thus, the morphological changes of the apical domain, induced by PKC and PKA activation were consistent with the lipid transport data. When PKC was activated, the cells rapidly acquired a nonpolarized morphology, as judged by the redistribution of four apical protein markers. Concomitantly, lipid transport via either pathway decreased (Fig. 4). When the cells were exposed to an elevated concentration of intracellular cAMP, a PKA-dependent ‘hyperpolarization' of HepG2 cells was induced. Both direct apical and transcytotic lipid transport routes were enhanced (Fig. 7), and the total amount of bile canaliculi was increased threefold (Table II).
Effects of PKC agonists on apical transport of proteins have been described before. In MDCK cells, phorbol esters were reported to stimulate basolateral-to-apical transcytosis of the polymeric immunoglobulin receptor (13) as well as the direct transport of influenza hemagglutinin from the TGN to the apical surface (32). However, it has also been shown that after stimulation of PKC, bile secretion in perfused rat liver (15) and vesicular transport to the apical domain in rat hepatocytes (6) were inhibited. Our observations (Fig. 4) demonstrating that both the direct pathway and transcytosis of fluorescently tagged SM and GlcCer are inhibited, are entirely consistent with these studies. Clearly, PKC interferes with an intracellular transport step as both biosynthesis (‘direct pathway'; Table I), a prerequisite for transport to occur, and internalization (transcytosis) are affected in a manner that, consequently, would lead to a diminished transport. Hence, recruitment of apically destined sphingolipids from an intracellular pool is impeded upon activation of PKC.
Interestingly, activation of PKC inhibits the internalization of caveolea (39). In cells that do not possess caveolea, the internalization of clustered GPI-linked proteins and the glycosphingolipid GM1 is also inhibited upon activation of PKC. It was shown that this PKC-induced inhibition of internalization was dependent on the actin cytoskeleton (16). At present, the initial target of PKC, responsible for the ultimate depolarization of HepG2 cells, is unknown. However, along the lines of the foregoing discussion, a possible explanation for the inhibitory effect of PKC on apical lipid transport that we describe here, could be that PKC directly influences transport from the TGN (direct pathway) or from a sorting compartment in the transcytotic pathway (2, 4, 35). Thus, in HepG2 cells, PKC activity could interfere with vesicular budding from these compartments, analogous to its interference with budding in caveolae internalization or that of GPI/sphingolipid-enriched microdomains (16, 39). Alternatively, PKC activation might impede subsequent vesicular sphingolipid transport as a result of the reorganization of the (apical) actin cytoskeleton and PKC-induced actin filament rearrangements, prevent docking of vesicles. As hypothesized by Mays et al. (28), actin could be critical for the final delivery of vesicles at the apical surface, requiring an actin-based motor protein to traverse the apical terminal web and to dock eventually with the apical membrane. Indeed, as shown in Fig. 6, PKC activation caused a very rapid redistribution of actin filaments, and unpublished results indicate that apical transport of sphingolipids is inhibited when actin filaments are disrupted by cytochalasin D (Zegers, M.M.P., and D. Hoekstra, manuscript in preparation). Nevertheless, further work will be needed to determine whether the inhibition of apical lipid transport upon PKC activation arises from secondary effects of actin rearrangements, or from a direct effect of PKC activity on vesicular transport.
At present, the upstream effector of PKC responsible for cell depolarization is unknown. Generally, cell–cell contacts are important in the establishment of cell polarity. The cell adhesion molecule E-cadherin was reported to be required for the formation of extended bile canalicular membranes in hepatocytes (41). In this respect it is relevant to note that in HT29 cells, PMA downmodulates total cellular levels of E-cadherin (18), which is accompanied by a loss of the apical differentiation markers villin and dipeptidylpeptidase IV (19). We submit that these reported effects of PMA are likely related to the redistribution of the apical markers as we describe in this paper, although we have found no evidence supporting a downregulation of protein levels.
The effects of cAMP on cell polarization reported here may also be related to cell–cell contact-mediated signaling. Experimental conditions that abolish cell–cell contacts in MDCK cells trigger the formation of intracellular microvilli-lined storage compartments for apical membrane proteins, the vacuolar apical compartments (VACs; 47). They are believed to arise through fusion of Golgi-derived vesicles carrying newly synthesized proteins and lipids. VACs are rapidly exocytosed upon restoration of cell–cell contacts, and it has been suggested that this mechanism plays an important role in the establishment of epithelial cell polarity (48). Interestingly, the exocytosis of VACs correlated with variations of cellular cAMP concentrations in response to cell–cell contacts. In the absence of cell–cell contacts, the exocytosis of VACs could be induced by the addition of cAMP (11). Moreover, cAMP was reported to increase the amount of canalicular vacuoles, found in single hepatocytes that no longer maintain a polarized apical surface membrane (33). The above- described results are entirely consistent with the effects of cAMP presented here, involving a strong stimulation of apically directed lipid transport and a drastic increase in number and size of bile canalicular structures. The fact that cAMP or cAMP analogues were also reported to stimulate (vesicular) apical transport processes in epithelial cells (12, 17, 32) as well as in hepatocytes (6, 9, 21) suggests that this second messenger has a general function in the generation of cell polarity. The dBcAMP-induced stimulation of apical vesicle targeting in hepatocyte couplets is counter-acted by activation of PKC by phorbol ester (6), which is also in accordance with our results that indicate that PKA and PKC play opposing roles in apical lipid transport.
In conclusion, we have shown, for the first time, that kinase activity regulates apical lipid transport. The evidence indicates that PKC activity causes inhibition and PKA activation of the transport of two sphingolipids, GlcCer and SM, proceeding via the transcytotic and biosynthetic pathways. Moreover, morphological evidence demonstrates that apical lipid transport is closely related to the organization of the apical membrane, and thereby to the degree of cell polarity. The role of cell–cell contact-mediated signaling and the molecular targets of the various kinase activities as modulators of intracellular membrane flow, as reflected by lipid transport, are topics of current research in our laboratory.
Acknowledgments
This work was supported by the Netherlands Foundation for Chemical Research with financial aid from the Netherlands Foundation for Scientific Research (M. Zegers).
Footnotes
1. Abbreviations used in this paper: BIM, bisindolylmaleimide; PKA, protein kinase A; PKC, protein kinase C; PMA, phorbol 12-myristate 13-acetate; VAC, vacuolar apical compartment.
References
- 1.Ali N, Evans WH. Priority targeting of glycosyl-phosphatidylinositol–anchored proteins to the bile-canalicular (apical) plasma membrane of hepatocytes. Biochem J. 1990;271:193–199. doi: 10.1042/bj2710193. [DOI] [PMC free article] [PubMed] [Google Scholar]
- 2.Apodaca G, Katz LA, Mostov KE. Receptor-mediated endocytosis of IgA in MDCK cells via apical recycling endosomes. J Cell Biol. 1994;125:67–86. doi: 10.1083/jcb.125.1.67. [DOI] [PMC free article] [PubMed] [Google Scholar]
- 3.Babia, T., J.W. Kok, and D. Hoekstra. 1994. The use of fluorescent lipid analogues to study endocytosis of glycosphingolipids. In Receptor Research Methods. B. Greenstein, editor. Harwood Academic Publishing. London. 155–174.
- 4.Barroso M, Sztul ES. Basolateral to apical trancytosis in polarized cells is indirect and involves BFA and trimeric G protein sensitive passage through the apical endosome. J Cell Biol. 1994;124:83–100. doi: 10.1083/jcb.124.1.83. [DOI] [PMC free article] [PubMed] [Google Scholar]
- 5.Bartles JR, Feracci HM, Stieger B, Hubbard AL. Biogenesis of the rat hepatocyte plasma membrane in vivo: comparison of the pathways taken by apical and basolateral proteins using subcellular fractionation. J Cell Biol. 1987;105:1241–1251. doi: 10.1083/jcb.105.3.1241. [DOI] [PMC free article] [PubMed] [Google Scholar]
- 6.Benedetti A, Strazzabosco M, Ng OC, Boyer JL. Regulation of activity and apical targeting of the Cl−/HCO3 −exchanger in rat hepatocytes. Proc Natl Acad Sci USA. 1994;91:792–796. doi: 10.1073/pnas.91.2.792. [DOI] [PMC free article] [PubMed] [Google Scholar]
- 7.Bligh EG, Dyer WJ. A rapid method of total lipid extraction and purification. Can J Biochem Physiol. 1959;37:911–917. doi: 10.1139/o59-099. [DOI] [PubMed] [Google Scholar]
- 8.Bomsel M, Mostov KE. Possible role of both the α and the βγ subunits of the heterotrimeric G protein, Gs, in transcytosis of the polymeric immunoglobulin receptor. J Biol Chem. 1993;268:25824–25835. [PubMed] [Google Scholar]
- 9.Boyer JL, Soroka CJ. Vesicle targeting to the apical domain regulates bile excretory function in isolated rat hepatocyte couplets. Gastroenterology. 1995;109:1600–1611. doi: 10.1016/0016-5085(95)90649-5. [DOI] [PubMed] [Google Scholar]
- 10.Brewer CB, Roth MG. Polarized exocytosis in MDCK cells is regulated by phosphorylation. J Cell Sci. 1995;108:789–796. doi: 10.1242/jcs.108.2.789. [DOI] [PubMed] [Google Scholar]
- 11.Brignoni M, Podesta EJ, Mele P, Rodriguez ML, Vega-Salas DE, Salas PJI. Exocytosis of the Vacuolar Apical Compartment (VAC) in Madin-Darby canine kidney epithelial cells: cAMP is involved as second messenger. Exp Cell Res. 1994;205:171–178. doi: 10.1006/excr.1993.1072. [DOI] [PubMed] [Google Scholar]
- 12.Brignoni M, Pignatoro OP, Rodriguez ML, Alvarez A, Vega-Salas DE, Rodriquez-Boulan E, Salas PJI. Cyclic AMP modulates the rate of ‘constitutive' exocytosis of apical membrane proteins in Madin-Darby canine kidney cells. J Cell Sci. 1995;108:1931–1943. doi: 10.1242/jcs.108.5.1931. [DOI] [PubMed] [Google Scholar]
- 13.Cardone MH, Smith BL, Song W, Mochly-Rosen D, Mostov KE. Phorbol myristate acetate-mediated stimulation of transcytosis and apical recycling in MDCK cells. J Cell Biol. 1994;124:717–727. doi: 10.1083/jcb.124.5.717. [DOI] [PMC free article] [PubMed] [Google Scholar]
- 14.Chiu JH, Hu CP, Lui WY, Szencheng JL, Chang C. The formation of bile canaliculi in human hepatoma cell lines. Hepatology. 1990;11:834–842. doi: 10.1002/hep.1840110519. [DOI] [PubMed] [Google Scholar]
- 15.Corasanti JG, Smith ND, Gordon ER, Boyer JL. Protein kinase C agonists inhibit bile secretion independently of effects on the microcirculation in the isolated perfused rat liver. Hepatology. 1989;10:8–13. doi: 10.1002/hep.1840100103. [DOI] [PubMed] [Google Scholar]
- 16.Deckert M, Ticchioni M, Bernard A. Endocytosis of GPI- anchored proteins in human lymphocytes: role of glycolipid-based domains, actin cytoskeleton, and protein kinases. J Cell Biol. 1996;133:791–799. doi: 10.1083/jcb.133.4.791. [DOI] [PMC free article] [PubMed] [Google Scholar]
- 17.Eker P, Holm PK, van Deurs B, Sandvig K. Selective regulation of apical endocytosis in polarized Madin-Darby canine kidney cells by mastoporan and cAMP. J Biol Chem. 1994;269:18607–18615. [PubMed] [Google Scholar]
- 18.Fabre M, Garcia de Herreros A. Phorbol ester-induced scattering of HT-29 human intestinal cancer cells is associated with down-modulation of E-cadherin. J Cell Sci. 1993;106:513–522. doi: 10.1242/jcs.106.2.513. [DOI] [PubMed] [Google Scholar]
- 19.Garcia de Herreros A, Fabre M, Battle E, Balague C, Real FX. The tumor promoter 12-O-tetradecanoylphorbol-13-acetate blocks differentiation of HT-29 human colon cancer cells. J Cell Sci. 1993;106:1165–1172. doi: 10.1242/jcs.105.4.1165. [DOI] [PubMed] [Google Scholar]
- 20.Hansen SH, Casanova JE. Gsα stimulates transcytosis and apical secretion in MDCK cells through cAMP and protein kinase A. J Cell Biol. 1994;126:677–687. doi: 10.1083/jcb.126.3.677. [DOI] [PMC free article] [PubMed] [Google Scholar]
- 21.Hayakawa T, Bruck R, Ng OC, Boyer JL. DBcAMP stimulates vesicle transport and HRP excretion in isolated perfused rat liver. Am J Physiol. 1990;259:G727–G735. doi: 10.1152/ajpgi.1990.259.5.G727. [DOI] [PubMed] [Google Scholar]
- 22.Hoekstra D, Kok JW. Trafficking of glycosphingolipids in eukaryotic cells; sorting and recycling of lipids. Biochim Biophys Acta. 1992;1113:277–294. doi: 10.1016/0304-4157(92)90002-r. [DOI] [PubMed] [Google Scholar]
- 23.Kishimoto Y. A facile synthesis of ceramides. Chem Phys Lipids. 1975;15:33–36. doi: 10.1016/0009-3084(75)90029-8. [DOI] [PubMed] [Google Scholar]
- 24.Kok JW, Babia T, Hoekstra D. Sorting of sphingolipids in the endocytic pathway of HT29 cells. J Cell Biol. 1991;114:231–239. doi: 10.1083/jcb.114.2.231. [DOI] [PMC free article] [PubMed] [Google Scholar]
- 25.Koval M, Pagano RE. Lipid recycling between the plasma membrane and intracellular compartments: transport and metabolism of fluorescent sphingomyelin analogues in cultured fibroblasts. J Cell Biol. 1989;108:2169–2181. doi: 10.1083/jcb.108.6.2169. [DOI] [PMC free article] [PubMed] [Google Scholar]
- 26.Laemmli UK. Cleavage of structural proteins during the assembly of the head of bacteriophage T4. Nature (Lond) 1970;227:680–685. doi: 10.1038/227680a0. [DOI] [PubMed] [Google Scholar]
- 27.Maurice M, Schell MJ, Lardeux B, Hubbard AL. Biosynthesis and intracellular transport of a bile canalicular plasma membrane protein: studies in vivoand in the perfused rat liver. Hepatology. 1994;19:648–655. doi: 10.1002/hep.1840190316. [DOI] [PubMed] [Google Scholar]
- 28.Mays RW, Beck KA, Nelson WJ. Organization and function of the cytoskeleton in polarized epithelial cells: a component of the protein sorting machinery. Curr Opin Cell Biol. 1994;6:16–24. doi: 10.1016/0955-0674(94)90111-2. [DOI] [PubMed] [Google Scholar]
- 29.Pagano RE, Martin OC, Kang HC, Haugland RP. A novel fluorescent ceramide analog for studying membrane traffic in animal cells: accumulation at the Golgi apparatus results in altered spectral properties of the sphingolipid precursor. J Cell Biol. 1991;113:1267–1279. doi: 10.1083/jcb.113.6.1267. [DOI] [PMC free article] [PubMed] [Google Scholar]
- 30.Peterson GL. A simplification of the protein assay method of Lowry et al. which is more generally applicable. Anal Biochem. 1977;83:346–356. doi: 10.1016/0003-2697(77)90043-4. [DOI] [PubMed] [Google Scholar]
- 31.Pimplikar SW, Simons K. Regulation of apical transport in epithelial cells by a Gsclass of heterotrimeric G protein. Nature (Lond) 1993;362:456–458. doi: 10.1038/362456a0. [DOI] [PubMed] [Google Scholar]
- 32.Pimplikar SW, Simons K. Activators of protein kinase A stimulate apical but not basolateral transport in epithelial Madin-Darby canine kidney cells. J Biol Chem. 1994;269:19054–19059. [PubMed] [Google Scholar]
- 33.Remy L, Chalvet C, Ripert JP, Gerolami A. Intracellular lumina and bile canaliculi in rat hepatocytes in vitro—a cytochemical study. Acta Histochem. 1989;85:87–92. doi: 10.1016/S0065-1281(89)80103-5. [DOI] [PubMed] [Google Scholar]
- 34.Rigotti, A., R. Marzolo, and F. Nervi. 1994. Lipid transport from the hepatocyte into the bile. In Cell Lipids. D. Hoekstra, editor. Academic Press, San Diego, CA. 579–615.
- 35.Rodriquez-Boulan E, Powell SK. Polarity of epithelial and neuronal cells. Annu Rev Cell Biol. 1992;8:395–427. doi: 10.1146/annurev.cb.08.110192.002143. [DOI] [PubMed] [Google Scholar]
- 36.Ruegg UT, Burgess GM. Staurosporine, K-252 and UCN-01; potent but nonspecific inhibitors of protein kinases. Trends Pharmacol Sci. 1989;10:218–220. doi: 10.1016/0165-6147(89)90263-0. [DOI] [PubMed] [Google Scholar]
- 37.Saucan L, Palade GE. Differential colchicine effects on the transport of membrane and secretory proteins in rat hepatocytes in vivo: bipolar secretion of albumin. Hepatology. 1992;15:714–721. doi: 10.1002/hep.1840150427. [DOI] [PubMed] [Google Scholar]
- 38.Schell MJ, Maurice M, Stieger B, Hubbard AL. 5′ nucleotidase is sorted to the apical domain of hepatocytes via an indirect route. J Cell Biol. 1992;119:1173–1182. doi: 10.1083/jcb.119.5.1173. [DOI] [PMC free article] [PubMed] [Google Scholar]
- 39.Smart EJ, Foster DC, Ying YS, Kamen BA, Anderson RGW. Protein kinase C activators inhibit receptor-mediated potocytosis by preventing internalization of caveolea. J Cell Biol. 1994;124:307–313. doi: 10.1083/jcb.124.3.307. [DOI] [PMC free article] [PubMed] [Google Scholar]
- 40.Sormunen R, Eskelinen S, Lehto VP. Bile canaliculus formation in cultured HepG2 cells. Lab Invest. 1993;68:652–662. [PubMed] [Google Scholar]
- 41.Terry TL, Gallin WJ. Effects of fetal calf serum and disruption of cadherin function on the formation of bile canaliculi between hepatocytes. Exp Cell Res. 1994;214:642–653. doi: 10.1006/excr.1994.1302. [DOI] [PubMed] [Google Scholar]
- 42.Towbin H, Staehalin T, Gordon J. Electrophoretic transfer of proteins from polyacrylamide gels to nitrocellulose sheets: procedures and some applications. Proc Natl Acad Sci USA. 1979;76:4350–4354. doi: 10.1073/pnas.76.9.4350. [DOI] [PMC free article] [PubMed] [Google Scholar]
- 43.van't Hof W, van Meer G. Generation of lipid polarity in intestinal epithelial (Caco-2) cells: sphingolipid synthesis in the Golgi complex and sorting before vesicular traffic to the plasma membrane. J Cell Biol. 1990;111:977–986. doi: 10.1083/jcb.111.3.977. [DOI] [PMC free article] [PubMed] [Google Scholar]
- 44.van Genderen I, van Meer G. Differential targeting of glucosylceramide and galactosylceramide analogues after synthesis but not during transcytosis in Madin-Darby canine kidney cells. J Cell Biol. 1995;131:645–654. doi: 10.1083/jcb.131.3.645. [DOI] [PMC free article] [PubMed] [Google Scholar]
- 45.van IJzendoorn SCD, Zegers MMP, Kok JW, Hoekstra D. Segregation of glucosylceramide and sphingomyelin in the apical to basolateral transcytotic route in HepG2 cells. J Cell Biol. 1997;137:347–357. doi: 10.1083/jcb.137.2.347. [DOI] [PMC free article] [PubMed] [Google Scholar]
- 46.van Meer G, Steltzer EHK, Wijnaendts-van-Resandt RW, Simons K. Sorting of sphingolipids in epithelial (Madin-Darby canine kidney) cells. J Cell Biol. 1987;105:1623–1635. doi: 10.1083/jcb.105.4.1623. [DOI] [PMC free article] [PubMed] [Google Scholar]
- 47.Vega-Salas DE, Salas PJI, Rodriquez-Boulan E. Modulation of the expression of an apical plasma membrane protein of Madin-Darby canine kidney epithelial cells: cell–cell interactions control the appearance of a novel intracellular storage compartment. J Cell Biol. 1987;104:1249–1259. doi: 10.1083/jcb.104.5.1249. [DOI] [PMC free article] [PubMed] [Google Scholar]
- 48.Vega-Salas DE, Salas PJI, Rodriquez-Boulan E. Exocytosis of vacuolar apical compartment (VAC): a cell–cell contact controlled mechanism for the establishment of the apical plasma membrane domain in epithelial cells. J Cell Biol. 1988;107:1717–1728. doi: 10.1083/jcb.107.5.1717. [DOI] [PMC free article] [PubMed] [Google Scholar]
- 49.Wilton JC, Matthews GM, Burgoyne RD, Mills CO, Chipman JK, Coleman R. Fluorescent choleretic and cholestatic bile salts take different paths across the hepatocyte: transcytosis of glycolithocholate leads to an extensive redistribution of annexin II. J Cell Biol. 1994;127:401–410. doi: 10.1083/jcb.127.2.401. [DOI] [PMC free article] [PubMed] [Google Scholar]
- 50.Zaal KJM, Kok JW, Sormunen R, Eskelinen S, Hoekstra D. Intracellular sites involved in the biogenesis of bile canaliculi in hepatic cells. Eur J Cell Biol. 1993;63:10–19. [PubMed] [Google Scholar]