Abstract
Neural tube patterning in vertebrates is controlled in part by locally secreted factors that act in a paracrine manner on nearby cells to regulate proliferation and gene expression. We show here by in situ hybridization that genes for the neuropeptide pituitary adenylate cyclase-activating peptide (PACAP) and one of its high-affinity receptors (PAC1) are widely expressed in the mouse neural tube on embryonic day (E) 10.5. Transcripts for the ligand are present in differentiating neurons in much of the neural tube, whereas the receptor gene is expressed in the underlying ventricular zone, most prominently in the alar region and floor plate. PACAP potently increased cAMP levels more than 20-fold in cultured E10.5 hindbrain neuroepithelial cells, suggesting that PACAP activates protein kinase A (PKA) in the neural tube and might act in the process of patterning. Consistent with this possibility, PACAP down-regulated expression of the sonic hedgehog- and PKA-dependent target gene gli-1 in cultured neuroepithelial cells, concomitant with a decrease in DNA synthesis. PACAP is thus an early inducer of cAMP levels in the embryo and may act in the neural tube during patterning to control cell proliferation and gene expression.
Recent studies suggest that phenotypic determination in the developing nervous system results from interactions of patterning genes conserved through evolution (1). For example, sonic hedgehog (shh) is one of three mammalian homologs to the segment polarity gene hedgehog (hh). shh has been implicated as a notochord- and floor plate-secreted factor that controls dorsal/ventral patterning in the vertebrate neural tube (1–4). Abundant genetic and molecular evidence in flies (5), fish (6), and mice (7) indicates that hh and its homologs act by antagonizing cAMP-dependent protein kinase A (PKA) signaling. Although shh may act in the ventral tube by blocking constitutive PKA activity, it is possible that physiological activators of the cAMP/PKA pathway are important in patterning.
We considered that pituitary adenylate cyclase-activating peptide (PACAP) might be involved in patterning for several reasons. First, although PACAP originally was discovered as a hypothalamic factor that potently increased cAMP in the pituitary through G protein-coupled receptors (8), peptide expression later was localized to many central and peripheral neuronal populations as well as the developing embryo (9). Second, the 27-aa form of the peptide, PACAP-27, is conserved 100% in species ranging from fish to humans. Finally, our tissue culture studies indicated that PACAP and a closely related peptide vasoactive intestinal peptide stimulate cAMP production, regulating proliferation, differentiation, and/or survival of multiple neuronal precursors (10–14). The current studies indicate that a functional PACAP ligand/receptor cAMP signaling system is expressed in the neural tube at the onset of neurogenesis, raising the possibility that PACAP might be involved in neural tube patterning.
MATERIALS AND METHODS
In Situ Hybridization with Digoxigenin-Labeled Riboprobe.
Cryostat sections (10–14 μm) from embryonic day (E) 14.5 embryos (fresh-frozen in OCT on dry ice) were fixed onto Superfrost slides (Fisher Scientific), stored at −70°C, then assayed as described by Fuss et al. (15). In brief, slides were fixed for 15 min in 4% paraformaldehyde in PBS, treated with 0.1 M HCl, then 0.1 M triethanolamine (pH 8.0). Sections were then dehydrated in ascending concentrations of ethanol, prehybridized at 37°C, and hybridized at 55°C with an antisense riboprobe transcribed from the rat PAC1§ receptor cDNA (pCDL-SRα) (16) (supplied by Stephen Wank, Digestive Diseases Branch, National Institute of Diabetes and Digestive and Kidney Diseases, National Institutes of Health), hydrolyzed to an average probe length of 200 nt. After hybridization, sections were washed for 30 min in 0.2× SSC (1× SSC = 15 mM NaCl/1.5 mM sodium citrate, pH 7.0) at 55°C, then three times in 0.1× SSC/50% formamide for 45 min, then rinsed two times in 0.2× SSC for 10 min at room temperature. Slides were processed further with the alkaline phosphatase-coupled antidigoxigenin antibody procedure described (15), and detected with 4-nitroblue tetrazolium chloride and 5-bromo-4-chloro-3-indolyl phosphate.
In Situ Hybridization with 33P-Labeled Riboprobe.
E10.5 ND4 mouse embryos were immersion-fixed in 4% paraformaldehyde in PBS overnight at 4°C (17). After cryoprotection in 30% sucrose in PBS, embryos were frozen in OCT embedding compound (Tissuetek, Miles). Transverse sections (10–16 μm) were mounted on slides (Superfrost Plus, Fisher Scientific), then stored at −20°C. Slides were baked at 37°C for 1 hr, then washed in PBS (5 min × 3). To acetylate basic residues on the slide, thus reducing nonspecific hybridization, slides were treated 10 min with 0.25% (vol/vol) acetic anhydride in 0.1 M triethanolamine (pH 8.0) at room temperature (RT). After a brief rinse in PBS, sections were incubated for 1–2 hr at 60°C with a prehybridization solution 4× SET (1× SET = 150 mM NaCl/1 mM EDTA/20 mM Tris⋅HCI, pH 7.8), 1× Denhardt’s, 0.2% SDS, 100 mM DTT, 250 μg/ml tRNA, 25 μg/ml each of poly(A) and poly(C), and 50% formamide. The template used for production of the PAC1 receptor riboprobe was the same as described above. A mouse PACAP cDNA template was synthesized from mouse forebrain RNA by reverse transcription–PCR (RT-PCR) by using primers (GGGATAATAATGCATAGCAG and GATAAGTGAGTGGAAAATGG) based on the published PACAP cDNA sequence (18). The PCR product was cloned into PCR-2.1 (Invitrogen) and sequenced to confirm identity. 33P-labeled riboprobes were synthesized as described (17). Unlike digoxigenin-labeled probes, these were not subject to alkaline lysis. Hybridization buffer was the same as the prehybridization buffer, except formamide was 30% and dextran sulfate was added to 10%. To this, 1/10 volume of freshly labeled probe was added so that the final probe concentration was 50–100,000 cpm/μl. Twenty microliters of this was added to tissue sections, which then were sealed under a silanized glass coverslip and incubated overnight at 60°C in a humid chamber. Slides were immersed the next day briefly in 4× SSC/1 mM DTT to remove coverslips, then in 2× SSC/1 mM DTT for 1 hr at RT, then in wash buffer (500 mM NaCl/10 mM Tris, pH 7.6/1 mM EDTA) containing 0.8 μg/ml RNase A for 30 min at 37°C, then wash buffer containing 1 mM DTT for 15 min at 37°C, 2× SSC/10 mM DTT 30 min at 37°C, 0.1× SSC 20 min × 2 at 60°C, then 1× SSC 15 min at RT. Slides were dehydrated in ascending alcohols containing 300 mM ammonium acetate with a final dehydration in 100% ethanol. For autoradiography, slides were dipped in Kodak NTB-2 emulsion diluted 1:1 (vol/vol) with distilled water at 45°C. After developing, slides were counterstained with hematoxylin, dehydrated, and coverslipped.
Northern Blot Analysis.
Poly(A) RNA was isolated from embryos by using the Fast Track 2.0 kit (Invitrogen), quantified by UV absorbance and 10 μg run on 1.2% agarose gels, and Northern blot analysis was carried out as described (17). The PAC1 receptor probe used was an 860-bp NcoI/BanI fragment of PAC1 receptor cDNA (16). The PACAP probe was the PCR-amplified mouse sequence described above. The cDNA fragments were labeled with 32P by using a random primer synthesis kit (Bethesda Research Laboratories) to an activity of at least 2 × 10⁹ cpm/μg. The prehybridization and hybridization buffers used were as described (17). Hybridization was carried out by using 5 × 10⁶ cpm/ml overnight at 48°C (PAC1 receptor) or 45°C (PACAP). Blots were washed four times for 15 min in 0.2× SSC/0.1% SDS at 58° (PAC1 receptor) or 55°C (PACAP). Signals were detected with a PhosphorImager (Molecular Dynamics).
Nonsaturation RT-PCR.
Hindbrain portions of neural tube from E10.5 ND4 mouse embryos were isolated and cell suspensions were prepared as described (22, 23). For each experiment, 18–20 × 106 cells were isolated from 12–18 embryos and diluted into 20 ml culture medium consisting of DMEM/F12, 1% fetal bovine serum (FBS), 1× N2 supplement (Bethesda Research Laboratories), and 0.3 ng/ml recombinant FGF-2 (Collaborative Biomedical Products, Bedford, MA). This was divided and plated in two 85-mm nonadherent tissue culture dishes. On the following day, cells were removed, centrifuged, washed with PBS, then replated in adherent tissue culture plates in 10 ml fresh medium with or without PACAP 10−7 M (Sigma). Fifteen hours later, total RNA was isolated by the method of Chomczynski and Sacchi (20) and quantified by UV absorbance. Gli-1 mRNA was quantified by an adaptation of the RT-PCR method described by Kondo et al. (19) to quantify rare mRNA species. PCR primers for gli-1 were GGATACAACCCAAATGCAGG and CTGGTGGATCAGGATAGGAG, corresponding to nucleotides 1072–1091 and 1497–1516, respectively, of the mouse gli-1 mRNA (GenBank accession no. S65038). β-Actin primers, used as an external control, were CCATCTACGAGGGCTATGCT and CATCGTACTCCTGCTTGCTG, and corresponded to nucleotides 571–590 and 1151–1170 of the mouse β-actin mRNA (GenBank accession no. X03672), respectively. One microgram of RNA from control and PACAP-treated cultures was reverse-transcribed, divided into two aliquots, then subjected to separate amplification of gli-1 and actin cDNAs according to the RT-PCR kit instructions (Perkin–Elmer). Melting was at 94°C for 30 sec, annealing was at 54°C for 45 sec, and extension was at 72°C from 60 sec. Aliquots of the PCR mixture were removed every other cycle and run on agarose gels. To quantify the gli-1 and actin PCR products, the gels were transferred and blots were hybridized to 32P-labeled oligonucleotides corresponding to sequences internal to the PCR primers. The gli-1 hybridization probe was CTACCTCTGTCTATTCGCCAC, corresponding to nucleotides 1229–1248, and the actin probe was GCTGGAAAAGAGCCTCAGGG, corresponding to nucleotides 851–870. Hybridization was carried out at 30°C overnight in the Northern hybridization buffer described above. Blots were washed with 1× SSC/0.1% SDS at 42°C (3 × 20 min). Signals were detected as described above and quantified by using the imagequant program. Only signals in the nonsaturation range were considered in the analysis (cycles 26–32 for gli-1 and 12–18 for actin). Significant signals were not observed in control samples in which the reverse transcriptase was left out. The change in gli-1 mRNA concentration was calculated as the mean ratio of nonsaturation gli-1 signals in control vs. PACAP-treated cultures, corrected for the corresponding ratio of actin signals.
Binding Data.
Extracts from whole embryos were prepared and assayed as described (9). Assay tubes contained 15 μg extract in a final volume of 300 μl, 37 pM 125I-PACAP-27 (NEN, 2,200 Ci/mmol), and increasing concentrations of PACAP-27 (Peninsula). Data points are the average of three determinations and were fit to a single-site competition model by using nonlinear least-squares analysis, assuming a Kd value of 50 pM for binding of 125I-PACAP-27 to membranes (21).
cAMP Assay.
E10.5 hindbrain neuroepithelial cells were isolated as described above and plated in the same medium at 600,000 cells per well (24-well plates). On the following day, 3-isobutylmethylxanthine (Sigma) was added to 0.5 mM, and then PACAP38 (Peninsula) was added at the doses indicated. PACAP treatment was for 15 min. Cell lysates were made by adding ethanol to 65% final concentration. The contents of the wells were transferred and centrifuged, and the supernatant was dried down and assayed by using the RIA kit supplied by Amersham (nonacetylated protocol).
DNA Synthesis.
E10.5 mouse hindbrain neuroepithelial cells were isolated as described above, plated at 60,000 cells per well in 96-well tissue culture plates in the same medium containing 1 ng/ml FGF-2, and treated on the following day with PACAP38 (Peninsula) at concentrations from 10−12 to 10−7 M for the indicated time periods. [3H]thymidine was added along with fresh drug for the last 6 hr of treatment, and cells were extracted by using a cell harvester (Brandel, Bethesda, MD).
RESULTS
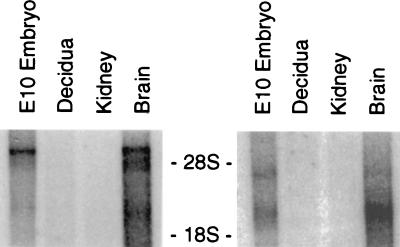
In initial experiments, we examined the expression of the PAC1 receptor gene in the E14.5 mouse brain with a digoxigenin-labeled riboprobe. PAC1 receptor gene expression was detected primarily in the ventricular zone (VZ) of the developing central nervous system, with highest levels appearing in the spinal cord, hindbrain, midbrain, and diencephalon (Fig. 1). Expression also was apparent in the mantle layer and in the dorsal root ganglia, albeit at lower levels and in discrete cells. The high concentration of PACAP receptor gene transcripts in the VZ suggested that PACAP or a related peptide might regulate proliferation and/or act as an early maturation/differentiation factor, consistent with our recent observations in cortical precursor cells (10). To determine whether the PACAP or PAC1 receptor genes are expressed during neural patterning, we prepared a Northern blot containing poly(A)-selected mRNA from whole E10.5 embryos (30–35 somites) and hybridized it with the corresponding cDNA probes. Major transcripts of the reported size were detected for both PACAP (2.7 kb) and the PAC1 receptor (7 kb) (Fig. 2).
Figure 1.
In situ hybridization of transverse sections of E14.5 mouse brain by using a digoxigenin-labeled PAC1 receptor antisense probe. VZ, ventricular zone; C, central canal; DRG, dorsal root ganglia; III and IV, third and fourth ventricle, respectively. No significant hybridization signals were seen with a sense probe.
Figure 2.
Northern blot showing PAC1 receptor (Left) and PACAP (Right) mRNA gene expression in E10.5 whole mouse embryos and adult mouse forebrain. Approximately 10 μg poly(A)-selected RNA (except for decidua, 1 μg) was loaded into each well. Adult kidney RNA was used as a negative control. Upper and lower bars indicate the positions of residual 28S and 18S ribosomal RNA (approximately 5 and 2 kb), respectively.
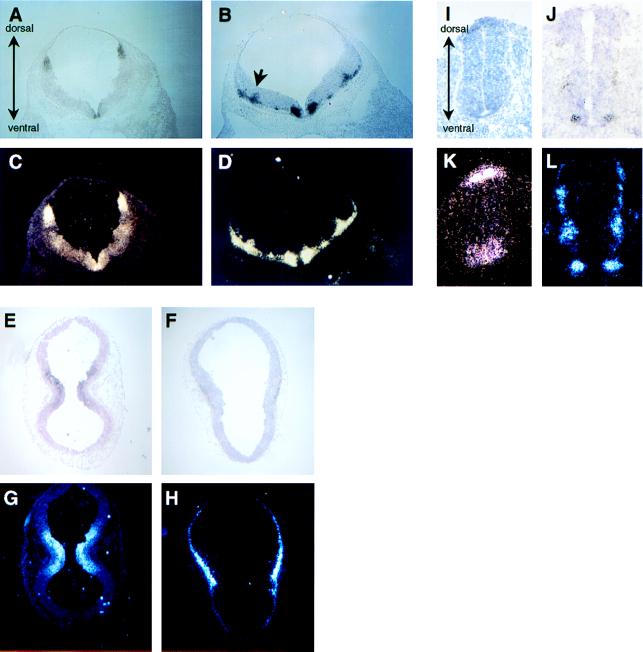
We then performed in situ hybridization on transverse cryostat sections of E10.5 mouse embryos. Localized expression of both the PACAP and the PAC1 receptor genes was detected at highest levels in the hindbrain (Fig. 3A–D). Expression of the receptor gene was prominent in dorsal (alar) and ventral regions throughout the rostral/causal extent of the hindbrain, although transcripts at lower levels also were detected in the lateral hindbrain regions (Fig. 3 A and C). Based on morphology, the ventral region exhibiting high signals corresponded to the floor plate, a major site of shh expression at E10.5 (2). A similar pattern of high expression in the dorsal region and floor plate region was observed in the spinal cord (Fig. 3 I and K). Transcripts in the ventral part of the neural tube extended rostrally to the midbrain (Fig. 3 E and G). Because of the curvature of the neural tube, transverse sections through the midbrain have a bilobed appearance, with the central part representing the ventral region. No detectable expression in the dorsal part of the neural tube was observed rostral to the hindbrain.
Figure 3.
In situ hybridization showing PAC1 receptor (A, C, E, G, I, and K) and PACAP (B, D, F, H, J, and L) gene expression in transverse sections of E10.5 (30–35 somite) mouse embryos. Sections shown are hindbrain (A–D), midbrain (E–H), and spinal cord (I–L). 33P-labeled antisense riboprobes were synthesized from rat (receptor) and mouse (ligand) cDNA templates. Upper are bright field (silver grains are black), and Lower are the same section in dark field (silver grains appear white). Arrow in B marks the approximate position of the alar/basal boundary. No significant hybridization signals were seen with sense probes.
In contrast to VZ expression of the receptor mRNA, transcripts for the ligand were observed just outside the VZ in much of the developing neural tube. In the hindbrain, PACAP gene transcripts appeared bilaterally in several distinct foci on the outer part of the neuroepithelium (Fig. 3 B and D). The most prominent site of PACAP gene expression was in the ventral part of the hindbrain surrounding the floor plate, a region probably corresponding to the major population of differentiating motor neurons (24, 25). Another prominent site of PACAP gene expression appeared to correspond to the alar/basal boundary (marked by the arrow in Fig. 3B). Similar to the hindbrain, PACAP gene transcripts were detected just outside the VZ in the spinal cord (Fig. 3 J and L) and midbrain (Fig. 3 F and H), in a pattern complementary to that of the receptor. PACAP gene transcripts also were detected just outside the VZ in the telencephalon and in several neural crest-derived populations, such as the trigeminal and facioacoustic ganglia (not shown). PACAP gene transcripts in the telencephalon may correspond to Cajal–Retzius cells, but this remains to be determined.
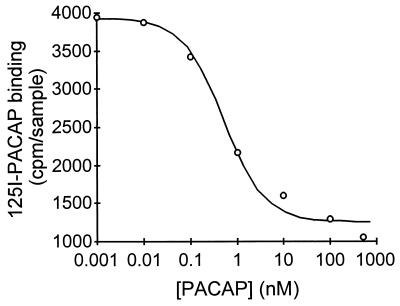
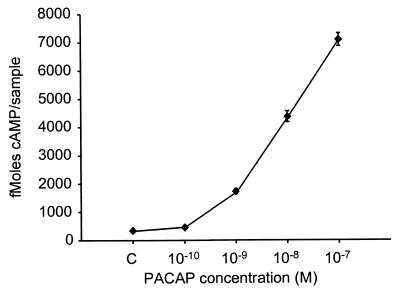
To confirm that a PAC1 receptor capable of binding PACAP was expressed, extracts were prepared from E10.5 whole embryos, and binding and displacement studies were performed by using 125I-PACAP-27 as a tracer. The results indicated that a high-affinity PACAP-binding site (Ki value = 0.5 nM) is expressed in mouse embryos (Fig. 4). The closely related neuropeptide vasoactive intestinal peptide had little ability to displace 125I-PACAP-27 (data not shown), indicating that a PACAP-preferring (PAC1) receptor was present. We then isolated and cultured cells from the hindbrain portion of neural tubes of E10.5 mice by using previously established methodology (22, 23) to examine the characteristics of this receptor further. To determine whether PACAP receptors in these cells were coupled to cAMP production, cultures were treated with increasing concentrations of PACAP in the presence of 0.5 mM phosphodiesterase inhibitor 3-isobutylmethylxanthine. PACAP stimulated cAMP production in a dose-dependent manner, increasing cAMP levels more than 20-fold at 10−7 M (Fig. 5). In contrast, PACAP did not cause an increase in intracellular calcium as measured by fura-2 in cell suspensions (26) (data not shown). The studies indicate that a high-affinity PACAP receptor coupled to cAMP production is present in the neuroepithelium.
Figure 4.
Displacement of 125I-PACAP binding to whole E10.5 mouse embryo membrane extracts with increasing concentrations of unlabeled PACAP. Nonspecific binding was approximately 1,000 cpm/sample. Data points are average of three to four determinations.
Figure 5.
Cyclic AMP induction by PACAP in isolated E10.5 mouse hindbrain neuroepithelial cells. Data points are average of three determinations.
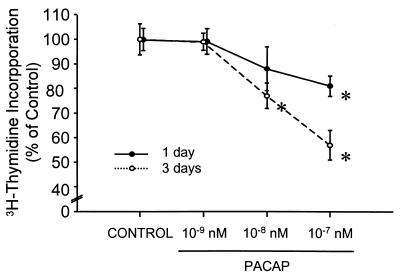
The presence of a functional PACAP ligand/receptor cAMP system in the embryo early during neurogenesis raised the possibility that PACAP might play a role in neural tube patterning. Evidence in vertebrates and invertebrates indicates that secreted signaling molecules affect patterning by simultaneously regulating gene expression and proliferation (27). In this way, secretory factors may influence the final number as well as phenotype of a population of cells. The effect of PACAP at concentrations of 10−11 to 10−7 M on hindbrain neuroepithelial cell proliferation was examined by measuring the incorporation of [3H]thymidine, a marker for DNA synthesis, into isolated E10.5 neural precursors. FGF-2 was included in the medium because it has been shown to be necessary for proliferation and survival of these cultures (23). PACAP inhibited incorporation up to 43% in a dose-dependent manner, with significant effects occurring at concentrations as low as 10 nM (Fig. 6). Likewise, the cAMP analog 8-bromo cAMP (0.2 mM) decreased incorporation by 51% (not shown). PACAP inhibition of DNA synthesis in neural precursors suggests that PACAP might participate in patterning in part by regulating proliferation or, alternatively, by activating a program of cell death in a population of proliferating precursors (28).
Figure 6.
PACAP inhibition of [3H]thymidine incorporation into cultured E10.5 mouse hindbrain neuroepithelial cells. Data points are average of four wells ± SEM. Data are representative of several experiments that had similar results. ∗, P ≤ .05 (multiple comparison t test).
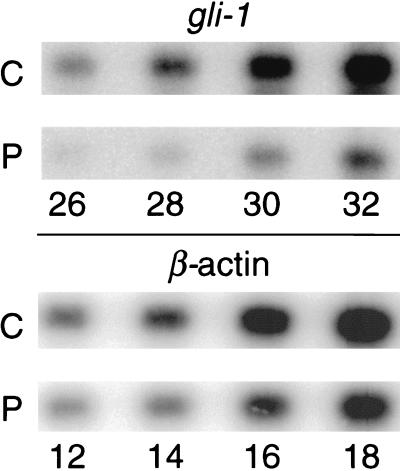
To determine whether PACAP potentially can regulate cell phenotype in the neural tube, we examined its action on the shh target gene, gli-1. Gli-1 was selected because its mRNA was induced in the dorsal neural tube of transgenic mice expressing a dominant-negative PKA inhibitor (7), suggesting that in normal mice, gli-1 might be inhibited by PACAP action. In two separate experiments, hindbrain neural tubes were dissected from 12–18 E10.5 embryos and dissociated, and cells were placed into culture. On the following day, cells were rinsed and then incubated for 15 hr with fresh medium containing either PACAP 10−7 M or vehicle. Gli-1 mRNA was quantified by nonsaturation RT-PCR (19), using amplification of actin mRNA as an external control. PACAP reduced the expression of gli-1 mRNA to 32 and 29% of control levels in these experiments (Fig. 7). Thus, along with its action on proliferation, PACAP may interact with patterning genes to control cell phenotype in the neural tube.
Figure 7.
PACAP inhibition of gli-1 gene expression in cultured E10.5 mouse hindbrain neuroepithelial cells, analyzed by nonsaturation RT-PCR (see Materials and Methods). Numbers below the lanes indicate the corresponding PCR cycle number. C, control; P, PACAP, 10−7 M. Signals were detected by using a PhosphorImager and quantified by using the imagequant program (Molecular Dynamics). Corrected for actin, PACAP reduced gli-1 mRNA to 32% of control values in the above experiment. In a similar experiment using cells from another group of embryos, PACAP reduced gli-1 mRNA to 29% of control values.
DISCUSSION
It is reported here that a functional PACAP ligand/receptor cAMP signaling system is present in the early embryonic mouse neural tube. Although transcripts for the receptor at E10.5 are present within the VZ, most prominently in the dorsal region and floor plate, transcripts for the ligand are present in the newly differentiating cells appearing just outside the VZ (Fig. 3). The localized and generally complementary expression of ligand and receptor mRNA at E10.5 raised the possibility that PACAP signaling is involved in early neurogenesis and/or patterning. This was supported by the finding that cultured hindbrain neuroepithelial cells respond to exogenous PACAP with a decrease in proliferation and decreased gli-1 gene expression. The gli-1 gene encodes a transcription factor that is believed to be critically involved in promoting the ventral phenotype (29, 30).
PACAP potently increased cAMP levels in E10.5 neuroepithelial cells (Fig. 5), suggesting that PACAP regulates PKA activity in the neural tube. The importance of PKA in dorsal/ventral patterning has been well documented. Ectopic transgenic expression of a dominant-negative mutant of PKA in the dorsal neural tube in mice resulted in up-regulation of gli-1 and ventralization, i.e., induction of early motor neuron markers (7). Thus, gli-1 expression and ventral phenotypes in the neural tube appear to be critically regulated by PKA activity. Considering both the high level of PACAP receptor gene expression in the dorsal hindbrain and spinal cord (Fig. 3 C and K), and the inhibitory action of PACAP on gli-l expression in neuroepithelial cells (Fig. 7), it can be postulated that PACAP acts in conjunction with other patterning molecules to inhibit ventral conversion or to stabilize dorsal phenotypes. In the more ventral portions of the tube, PACAP might function to counterbalance or delimit the action of factors such as shh that antagonize PKA. These and other hypotheses regarding PACAP action may be addressed by using in vivo approaches and/or suitable explant systems.
PACAP potentially interacts with other genes involved in neurogenesis and patterning. For example, in Drosophila, it was determined recently that a DNA sequence conforming to a cAMP-responsive consensus element (CRE) is necessary for combinatorial activation of midgut Ubx gene expression by wingless (wg) and decapentaplegic (dpp) (31, 32). Corresponding mammalian homologs (wnt gene products and bone morphogenic proteins, respectively), like shh, are thought to have important roles in early neural pattering (1). PACAP activation of a CRE-binding protein thus could affect signaling in these alternative pathways.
Finally, although the actions of PACAP on neural tube patterning remain to be determined, expression of a functional ligand receptor signaling system therein may have implications in human nervous system development. The human neural tube defect holoprosencephaly (HPE), type 3, is associated with specific mutations in the shh gene (HPE3) (33), whereas the human PACAP gene maps to chromosome 18p11.32 (34), a critical region for HPE, type 4 (35). Thus, it will be of interest to determine whether specific mutations in the PACAP gene contribute to this disease, supporting the proposed action of the PACAP/cAMP signaling system in patterning.
Acknowledgments
We thank Dr. Andrew McMahon for help in interpreting the expression data, for reading the manuscript, and for several helpful comments. We thank Dr. Joseph Pisegna for helping with binding assays, Drs. Xi Zhu and Andrew Charles for intracellular calcium measurements, and Dr. Karen Lyons for reading the manuscript and making suggestions. This work was supported in part by National Institutes of Health Grants HD06576, HD0461, HD34475, and NS32401, and the American Paralysis Association.
ABBREVIATIONS
- PKA
protein kinase A
- PACAP
pituitary adenylate cyclase-activating peptide
- shh, sonic hedgehog
VZ, ventricular zone
- RT-PCR
reverse transcription–PCR
- E
embryonic day
Footnotes
This paper was submitted directly (Track II) to the Proceedings Office.
Official nomenclature recently was established by the International Union of Pharmacology (36).
References
- 1.Tanabe Y, Jessell T M. Science. 1996;274:1115–1123. doi: 10.1126/science.274.5290.1115. [DOI] [PubMed] [Google Scholar]
- 2.Echelard Y. Cell. 1993;75:1417–1430. doi: 10.1016/0092-8674(93)90627-3. [DOI] [PubMed] [Google Scholar]
- 3.Lumsden A, Graham A. Curr Biol. 1995;5:1347–1350. doi: 10.1016/s0960-9822(95)00266-1. [DOI] [PubMed] [Google Scholar]
- 4.Ericson J, Morton S, Kawakami A, Roelink H, Jessell T M. Cell. 1996;87:661–673. doi: 10.1016/s0092-8674(00)81386-0. [DOI] [PubMed] [Google Scholar]
- 5.Blair S S. Nature (London) 1995;373:656–657. doi: 10.1038/373656a0. [DOI] [PubMed] [Google Scholar]
- 6.Hammerschmidt M, Bitgood M J, McMahon A P. Genes Dev. 1996;10:647–658. doi: 10.1101/gad.10.6.647. [DOI] [PubMed] [Google Scholar]
- 7.Epstein D J, Marti E, Scott M P, McMahon A P. Development. 1996;122:2885–2894. doi: 10.1242/dev.122.9.2885. [DOI] [PubMed] [Google Scholar]
- 8.Arimura A. Regul Pept. 1992;37:287–303. [PubMed] [Google Scholar]
- 9.Tatsuno I, Somogyvari-Vigh A, Arimura A. Peptides. 1994;15:55–60. doi: 10.1016/0196-9781(94)90170-8. [DOI] [PubMed] [Google Scholar]
- 10.Lu N, DiCicco-Bloom E. Proc Natl Acad Sci USA. 1997;94:3357–3362. doi: 10.1073/pnas.94.7.3357. [DOI] [PMC free article] [PubMed] [Google Scholar]
- 11.Pincus D W, DiCicco-Bloom E M, Black I B. Nature (London) 1990;343:564–567. doi: 10.1038/343564a0. [DOI] [PubMed] [Google Scholar]
- 12.Pincus D W, DiCicco-Bloom E M, Black I B. Brain Res. 1994;663:51–60. doi: 10.1016/0006-8993(94)90461-8. [DOI] [PubMed] [Google Scholar]
- 13.DiCicco-Bloom E, Deutsch P. Regul Pept. 1992;37:319. (abstr.). [Google Scholar]
- 14.DiCicco-Bloom E, Emsbo K, Black I B. Soc Neurosci. 1992;XVIII:418. (abstr.). [Google Scholar]
- 15.Fuss B, Wintergerst E S, Bartsch U, Schachner M. J Cell Biol. 1993;120:1237–1249. doi: 10.1083/jcb.120.5.1237. [DOI] [PMC free article] [PubMed] [Google Scholar]
- 16.Pisegna J R, Wank S A. Proc Natl Acad Sci USA. 1993;90:6345–6349. doi: 10.1073/pnas.90.13.6345. [DOI] [PMC free article] [PubMed] [Google Scholar]
- 17.Waschek J A, Ellison J, Bravo D T, Handley V. J Neurochem. 1996;66:1762–1765. doi: 10.1046/j.1471-4159.1996.66041762.x. [DOI] [PubMed] [Google Scholar]
- 18.Okazaki K, Itoh Y, Ogi K, Ohkubo S, Onda H. Peptides. 1995;16:1295–1299. doi: 10.1016/0196-9781(95)02018-r. [DOI] [PubMed] [Google Scholar]
- 19.Kondo S, Pastore S, Shivji G M, McKenzie R C, Sauder D N. Lymphokine Cytokine Res. 1994;13:367–375. [PubMed] [Google Scholar]
- 20.Chomczynski P, Sacchi N. Anal Biochem. 1995;162:156–159. doi: 10.1006/abio.1987.9999. [DOI] [PubMed] [Google Scholar]
- 21.Gottschall P E, Tatsuno I, Miyata A, Arimura A. Endocrinology. 1990;127:272–277. doi: 10.1210/endo-127-1-272. [DOI] [PubMed] [Google Scholar]
- 22.Drago J, Murphy M, Bailey K A, Bartlett P F. J Neurosci Methods. 1991;37:251–256. doi: 10.1016/0165-0270(91)90031-t. [DOI] [PubMed] [Google Scholar]
- 23.Murphy M, Drago J, Bartlett P F. J Neurosci Res. 1990;25:463–475. doi: 10.1002/jnr.490250404. [DOI] [PubMed] [Google Scholar]
- 24.Tsuchida T. Cell. 1994;79:957–970. doi: 10.1016/0092-8674(94)90027-2. [DOI] [PubMed] [Google Scholar]
- 25.Pfaff S L, Mendelsohn M, Stewart C L, Edlund T, Jessell T M. Cell. 1996;84:309–320. doi: 10.1016/s0092-8674(00)80985-x. [DOI] [PubMed] [Google Scholar]
- 26.Grynkiewicz G, Poenie M, Tsien R Y. J Biol Chem. 1985;260:3440–3450. [PubMed] [Google Scholar]
- 27.Edgar B A, Lehner C F. Science. 1996;274:1646–1652. doi: 10.1126/science.274.5293.1646. [DOI] [PubMed] [Google Scholar]
- 28.Graham A, Heyman I, Lumsden A. Development. 1993;119:233–245. doi: 10.1242/dev.119.1.233. [DOI] [PubMed] [Google Scholar]
- 29.Hynes M, Stone D M, Dowd M, Pitts-Meek S, Goddard A, Gurney A, Rosenthal A. Neuron. 1997;19:15–26. doi: 10.1016/s0896-6273(00)80344-x. [DOI] [PubMed] [Google Scholar]
- 30.Lee J, Platt K A, Censullo P, Ruiz I, Altaba A. Development. 1997;124:2537–2552. doi: 10.1242/dev.124.13.2537. [DOI] [PubMed] [Google Scholar]
- 31.Riese J. Cell. 1997;88:777–787. doi: 10.1016/s0092-8674(00)81924-8. [DOI] [PubMed] [Google Scholar]
- 32.Nusse R. Cell. 1997;89:321–323. doi: 10.1016/s0092-8674(00)80210-x. [DOI] [PubMed] [Google Scholar]
- 33.Roessler E. Nat Genet. 1996;14:357–360. doi: 10.1038/ng1196-357. [DOI] [PubMed] [Google Scholar]
- 34.Chang E, Welch S, Luna J, Giacalone J, Francke U. Genomics. 1993;17:393–402. doi: 10.1006/geno.1993.1338. [DOI] [PubMed] [Google Scholar]
- 35.Overhauser J. Am J Hum Genet. 1995;57:1080–1083. [PMC free article] [PubMed] [Google Scholar]
- 36.Harmar, A. J., Arimura, A., Gozes, I., Journot, L., Laburthe, M., Pisegna, J., Rawlings, S. R., Robberecht, R., Said, S., Sreedharan, S. P., Wank, S. A. & Waschek, J. A. (1998) Pharmacol Rev., in press. [PMC free article] [PubMed]


