Abstract
The existence of an intrinsic oscillator for pulsatile gonadotropin-releasing hormone (GnRH) secretion in normal and transformed GnRH neurons raises the question of whether the corresponding gene also is expressed in an episodic manner. To resolve this question, we used a modification of conventional luciferase technology, which enabled continuous monitoring of GnRH gene activity in single, living neurons. With this method, the relative rate of endogenous gene expression is estimated by quantification of photons emitted by individual neurons microinjected with a GnRH promoter-driven luciferase reporter construct. Immortalized GT1–1 neurons, which secrete the decapeptide GnRH in a pulsatile manner conceptually identical to that of their nontransformed counterparts in vivo, were chosen as the model for these studies. First, we injected individual cells with purified luciferase protein and established that the reporter half-life was sufficiently short (50 min) to enable detection of transient changes in gene expression. Next, we subjected transfected GT1–1 cells to continuous monitoring of reporter activity for 16 h and found that the majority of them exhibited spontaneous fluctuations of photonic activity over time. Finally, we established that photonic activity accurately reflected endogenous GnRH gene expression by treating transfected GT1–1 cells with phorbol 12-myristate 13 acetate (a consensus inhibitor of GnRH gene expression) and observing a dramatic suppression of photonic emissions from continuously monitored cells. Taken together, these results demonstrate the validity of our “real-time” strategy for dynamically monitoring GnRH gene activity in living neurons. Moreover, our findings indicate that GnRH gene expression as well as neuropeptide release can occur in an intermittent manner.
Reproduction in mammals is regulated by a delicate interplay of at least three primary endocrine organs: the hypothalamus, the anterior pituitary, and the gonads. This reproductive axis is driven when hypothalamic neurons terminating in the median eminence secrete regulatory agents that are transported via the hypophyseal portal blood to the gonadotropes of the anterior pituitary gland. Here, they act to control the release of gonadotropins, which, in turn, are transported through the systemic circulation to the gonads, where they serve to control the production and maturation of gametes as well as the secretion of steroid and peptide signals, which feedback on the aforementioned loci of the reproductive axis to effect temporal coordination of their activities (1). It is acknowledged generally that the zeitgeber or “timer” for reproductive homeostasis resides in the endocrine hypothalamus and takes the form of an exceedingly small group of neurons (only 1,000 to 3,000 in number; ref. 2) that secrete the decapeptide gonadotropin-releasing hormone (GnRH). In vivo, the activity of these neurons appears to be synchronized (3–7). This is evidenced by direct and indirect observations that GnRH is released into hypophyseal portal blood in discrete, periodic bursts (8). Moreover, changes of the endocrine milieu that eventuate in dramatic changes of gonadotropin secretion are attributable, at least in part, to modulation of the frequency and/or amplitude of GnRH secretory pulses. Numerous observations that hypothalamic fragments maintained in vitro and primary cultures of hypothalamic neurons also secrete GnRH in a pulsatile fashion have led to a consensus that pulsatility is an inherent characteristic of these neurons (9–12). The mechanisms underlying such pulsatility comprise one of the most tantalizing problems in contemporary neuroendocrinology.
The existence of an intrinsic oscillator for neuropeptide secretion in GnRH neurons raises the intriguing question of whether the corresponding gene also is expressed in an episodic manner. Resolution of this question requires an experimental system that combines the power of single cell analysis with a strategy for measuring the expression of a particular gene more than once in the same living cell. The first of these criteria is necessitated by the prospect that not all GnRH neurons in a particular culture will be synchronized with respect to gene expression; thus, the possible existence of asynchronous pulsatile gene expression by individual neurons would be obscured by measurements made at the population level. Inasmuch as the use of single, primary GnRH neurons as a model is precluded by their scarcity and diffuse distribution in the mammalian forebrain (13, 14), we decided instead to use GT1 neurons. This immortalized cell line, developed by Mellon and coworkers (15) through genetic targeting of oncogene expression in transgenic mice, secretes GnRH and exhibits a number of characteristics typical of GnRH neurons observed in situ. Included among these are (i) presentation of the neuronal morphologic phenotype (well defined perikarya, neurites, etc.; refs. 15–17); (ii) expression of neuronal markers (18); and (iii) development in vitro of ultrastructurally identifiable synaptic and junctional connections that are characteristic of the network for mammalian GnRH neurons in vivo (15–18). More relevant to our interests, cells within each of the three GT1 subclones are homogeneous in that they all stain for GnRH (15, 16). Most importantly, superfused cultures of GT1 cells release GnRH in a rhythmic pattern (11, 12, 19), and the frequency of the pulses elaborated is extremely similar to that reported for GnRH in vivo (one to three pulses per hour; ref. 20). Thus, these cells appear to comprise a valid model with which to explore the molecular dynamics of GnRH pulsatility in single cells.
A second technical requirement for addressing the question posed above is the capacity to make multiple measurements of GnRH gene expression from the same, clonal neuron. To acquire this capacity, we took an approach conceptually identical to that used (21, 22) to quantify prolactin promoter- and estrogen response element-driven gene expression in single mammotropes and breast cancer cells, respectively. This approach involved transfecting individual GT1 neurons with a luciferase reporter construct driven by the GnRH promoter and then subsequently quantifying photonic emissions from these cells on exposure to the enzymatic substrate luciferin. In this report, we present data demonstrating the development and validation of such a system that enables “real-time” measurements of GnRH gene expression. Moreover, we show the potential of this powerful tool for identifying and characterizing dynamic fluctuations of neuropeptide gene expression in living neurons.
MATERIALS AND METHODS
GT1–1 Cell Culture and Microinjection.
GT1–1 cells (generously provided by Richard I. Weiner, University of California at San Francisco) were maintained in DMEM (GIBCO) supplemented with 10% fetal bovine serum, 100 units/ml penicillin, 100 μg/ml streptomycin, and 0.25 μg/ml fungizone. Cells were plated at high density over Matrigel (Collaborative Biomedical Products, Bedford, MA) coated coverslips 3 to 5 days before transfection. The coverslips had been photoengraved previously with a numbered/lettered grid pattern (23) to enable cell reidentification and analysis of microinjected neurons. Individual GT1–1 cells were co-transfected transiently by nuclear microinjection with equal concentrations (2.5 μg/μl) of the plasmid PA3-LUC (generously provided by Margaret E. Wierman, University of Colorado Health Sciences Center), which contained 3 kbp of the GnRH gene promoter fused to the firefly luciferase structural sequence and a cytomegalovirus promoter-driven β-galactosidase construct (obtained from David Kurtz, Medical University of South Carolina). The latter was used to facilitate identification of injected cells and to estimate transfectional efficiencies. Selection of the transfection method was based on our preliminary findings that microinjection is at least 5- to 10-fold more efficient than other transfection methods. In addition, it allowed us to deliver a reasonably constant amount of reporter plasmid to each neuron, thereby facilitating comparisons of GnRH gene expression among cells. Cell microinjection was carried out essentially as described (21) by use of a semiautomated Eppendorf micromanipulator (5171) and injector (5242) system. A constant injection time (0.5 sec) and a narrow range of injection pressure (30–50 hPa) were applied to ensure reproducibility in the quantity of plasmids delivered to each individual cell. After microinjection, coverslips containing GT1–1 neurons were transferred to DMEM supplemented with 10% fetal bovine serum and 5% horse serum and were cultured for either 24 or 48 h before photon counting.
Quantitative Photon Counting.
Quantification of photonic emissions from individual cells was achieved as outlined elsewhere for pituitary cells (21). Coverslips containing GT1–1 neurons were mounted in Sykes–Moore chambers (24) and were filled with imaging medium composed of a mixture of Medium 199 and Nutrient mixture F-12 [1:1] (GIBCO) in which sodium bicarbonate had been replaced by Hepes buffer as well as 10% fetal bovine serum, 5% horse serum, and 0.1 mM luciferin. The assembled chamber then was placed on the heated (37°C) stage of a Zeiss Axioskop, and transfected cells were reidentified according to their position on the numbered/lettered grid. A bright field image of the microscopic field then was captured for reference purposes. Fifteen minutes after infusion with luciferin-containing medium, photonic emissions from individual cells were collected for a subsequent 15-min period, and the images obtained were stored for further analysis. The photon capture system was composed of a modified Zeiss Axioskop in series with a Hamamatsu VIM Photon Counting Camera/ARGUS-50 Image Processor (Hamamatsu Photonics, Hamamatsu City, Japan). The relative amount of light emitted by individual transfected cells was quantified by superimposing the image of activated pixels (corresponding to amplified photonic signals) on a frame demarcating the perimeter of the corresponding cell in the captured, bright-field image. The same frame then was superimposed randomly on at least three adjacent areas in the same field that were devoid of expressing cells. Counts acquired in this manner were averaged to obtain a background value that was subtracted from total counts to calculate specific photonic emissions.
Determination of Luciferase Stability.
Determination of the functional half-life of the luciferase protein in GT1–1 cells was accomplished as follows. GT1–1 neurons were microinjected with 1 μg/μl of purified firefly luciferase (Sigma) in accordance with the injection protocol described earlier. Immediately after microinjection, the coverslip bearing the cells was assembled into a Sykes–Moore chamber, which in turn was placed in our photon capture system and was perifused continuously (10 μl/min) with imaging medium containing luciferin (0.1 mM). Photonic emissions from individual cells then were imaged and accumulated into 10-min bins for a 2-h period. The functional half-life of luciferase in GT1–1 cells was calculated from the photonic decay curves obtained from 29 individual cells. The half-life value for each cell was arrived at by analyzing 2 to 3 pairs of points along different parts of the same decay curve. These 29 values then were averaged to arrive at the mean half-life value.
Continuous Monitoring of GnRH Gene Expression.
To ensure steady-state levels of intracellular substrate, we added luciferin (0.1 mM) to the medium bathing cells transfected 24 h previously. Two hours later, the cells were placed in a Sykes–Moore chamber and were perifused (10 μl/min) with luciferin-containing medium of the same composition. Photonic signals were accumulated continuously in 30-min bins for 16 h. Analysis and quantification of photonic emissions reflective of GnRH gene expression were performed as detailed above.
Statistical Analysis.
Comparisons between treatment groups were made by using unpaired Student’s t tests except for the data in Fig. 3, whose values were analyzed by a paired Student’s t test. Differences were considered significant at P < 0.05. GnRH gene expression profiles of 22 single cells shown in Fig. 4B and Fig. 5 were subjected to pulse analysis by using the program pc-pulsar created by Gitzen and Ramirez (25). This program is based on the pulsar algorithm developed by Merriam and Wachter (26). The G values used for all data series were G1 = 3.00, G2 = 1.50. G3 = 0.50, G4 = 0.50, and G5 = 0.50. These values were selected because they corresponded to those employed by Terasawa et al. (27) and Fox and Smith (28) for pulsar analysis of luteinizing hormone levels and by Carnes et al. (29) for acth pulse analysis.
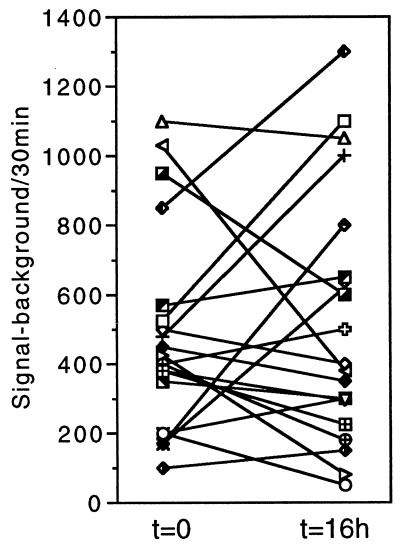
Figure 3.
The relative level of GnRH gene expression changes spontaneously over a 16-h period. Quantification of photonic emissions were performed on GT1–1 cells transfected 24 h earlier. Counts were accumulated in two 30-min windows separated by 16 h. Values for the same cell at 0 h and 16 h are connected by a line. Data are derived from 20 individual cells studied in 12 independent experiments.
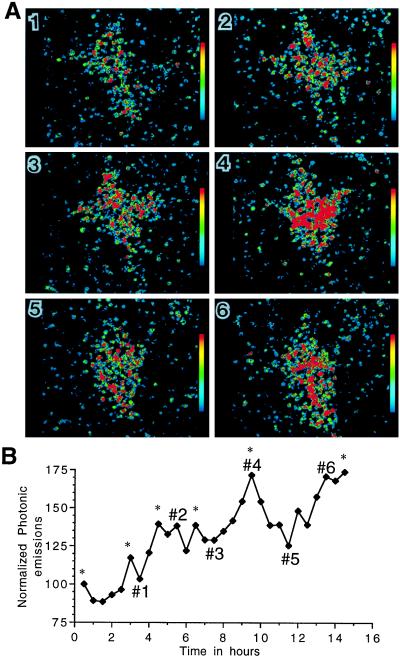
Figure 4.
Short-term variations of GnRH gene expression within a single neuron. (A) Computer-enhanced images of thresholded photonic events generated from the same GT1–1 cell (experimental conditions as in Fig. 5) (×800). (B) Normalized photonic emissions for the same cell. The numbers in this profile refer to the corresponding pseudocolor images in A. Details of this experiment are provided in the text of the Results and Discussion section. ∗, Pulses of GnRH gene expression detected by the pc-pulsar program.
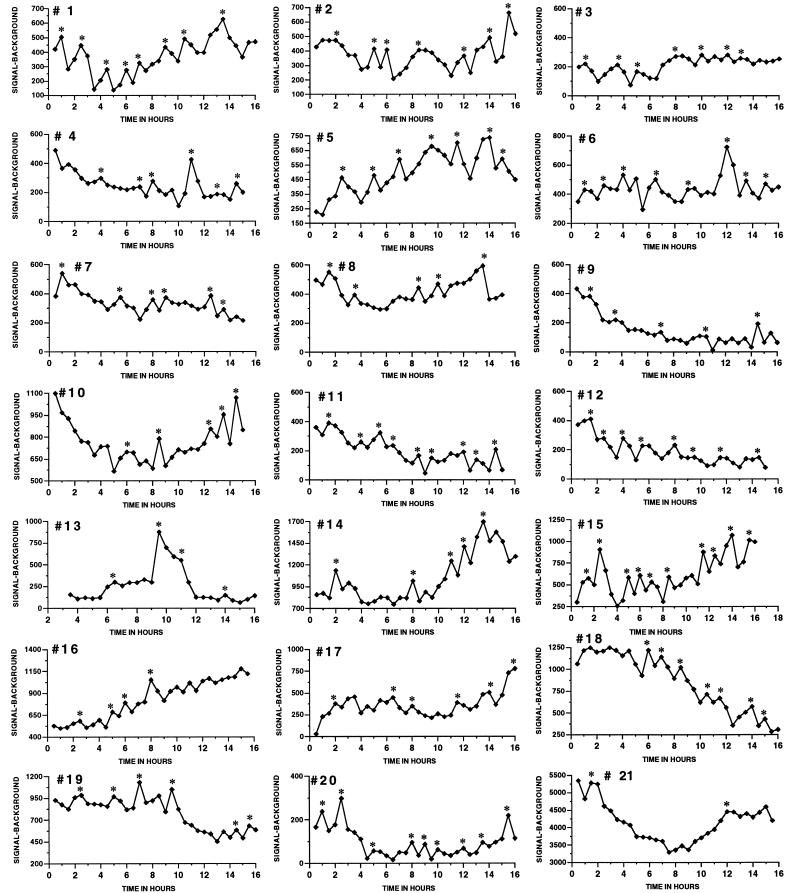
Figure 5.
Most GnRH neurons exhibit dynamic fluctuations of gene expression. Cells transfected 24 h earlier were monitored continuously in 30-min windows for 16 h. This figure shows profiles collected in 14 independent experiments. ∗, Pulses of GnRH gene expression detected by the pc-pulsar program.
RESULTS AND DISCUSSION
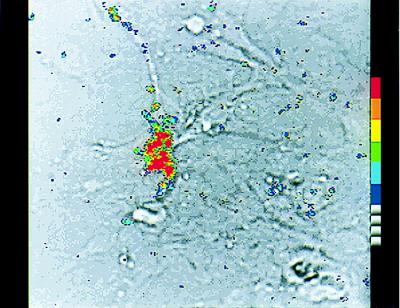
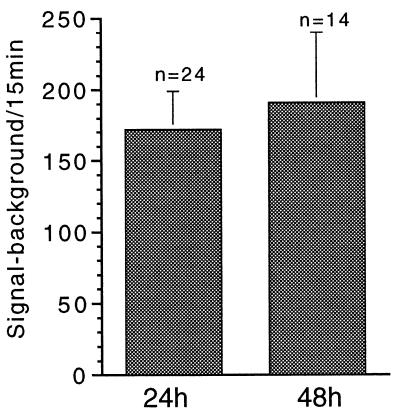
Single-cell analysis of GnRH gene expression in living neurons was achieved by transfecting (via nuclear microinjection) individual GT1–1 cells with a plasmid (PA3-LUC) containing three kbp of the 5′-flanking region of the GnRH gene promoter fused to the structural sequence of the firefly luciferase gene. To measure reporter activity, we exposed transfected cells to luciferin (24 to 48 h later), and photonic emissions reflective of GnRH gene promoter-driven reporter activity were monitored in real-time (Fig. 1) by a highly sensitive photon capture system. Quantification of these emissions revealed a rate of >10 specific photonic emissions per minute per cell, regardless of whether the cells were imaged 24 or 48 h after transfection (Fig. 2). This rate corresponds to a signal to background ratio of 3.0 ± 0.3 (mean ± SEM, n = 49 cells), a value that enables accurate and precise quantification of specific photonic emissions. These results demonstrate clearly the capacity of this methodology to quantify neuropeptide promoter-driven gene expression within single, living neurons.
Figure 1.
Real-Time analysis of photons emitted by individual, living GT1–1 cells transfected with a GnRH promoter-driven luciferase construct. A single GT1–1 neuron was transfected by microinjection with a plasmid containing the luciferase coding sequence under the control of the GnRH gene promoter. After 24 h, the culture subsequently was infused with luciferin, and photonic emissions reflective of gene expression were accumulated for a 15-min period. This photograph shows a computer-enhanced image of thresholded photonic events superimposed over the bright-field image of the same microscopic field (×400). The signal from a single photon is amplified and measured as a cloud of photoelectrons, each of which appears as an individual blue blotch in this image. Differences in color here indicate overlapping signals, the extent of which is depicted by the ascending pseudocolor scale shown on the right. The superimposed image shows that an area of concentrated light emissions corresponds to the individual transfected GT1–1 neuron.
Figure 2.
Average photonic emissions from GT1–1 cells remain relatively constant between 1 and 2 days after transfection. Individual GT1–1 neurons microinjected with the GnRH-promoter/luciferase plasmid 24 or 48 h earlier were subjected to photon counting for 15-min periods. Results are expressed as specific photonic emissions (signal minus background counts). Data are the mean + SEM of 24 and 14 individual cells studied (at 24 and 48 h, respectively) in 19 independent experiments. Values are not significantly different (P > 0.05).
This approach offers two major advantages over more traditional methodologies for studies of gene expression. First, it enables the imaging of gene activity within individual neurons as opposed to cell populations. This removes problems associated with the averaging of population responses and thereby allows investigation of molecular heterogeneity among neurons of a given type. Second, and perhaps more important, it provides a noninvasive paradigm for making multiple measurements of gene expression from the same neuron. Indeed, we exploited this dynamic potential by sampling the same cells twice over a 16-h period. As shown in Fig. 3, a particular cell’s level of promoter-driven reporter activity could change dramatically over time. This contrasted markedly with the averaged response, which remained fairly constant over the experimental period (481 ± 65 vs. 516 ± 82 specific photonic emissions per cell per 30 min at t = 0 h vs. t = 16 h, respectively, P > 0.05). Another interesting aspect of this data set (Fig. 3) is that neurons microinjected with roughly the same amount of reporter plasmid could differ >50-fold in their relative level of reporter activity. These findings indicate that individual GT1–1 neurons exhibit a high degree of molecular heterogeneity under basal conditions and that transcriptional activity of the GnRH gene could fluctuate greatly over time.
In an attempt to characterize further this dynamic instability of gene expression, we subjected transfected GT1–1 cells to continuous monitoring of photonic emissions over a period of 16 h, during which data were acquired in sequential, 30-min bins. Fig. 4 provides a representative example of the raw and processed data obtained with this protocol. Shown in Fig. 4A are pseudocolor images of photonic emissions that correspond to selected peaks and troughs of the continuous read-out provided in Fig. 4B. Note that the shape of the cell can change over time, as evidenced by the perimeter of the area in which photonic emissions were detected. However, analysis of this particular cell and many others did not reveal a correlation between cell shape and rate of photonic emissions. For example, images 3 and 5 of Fig. 4A show the same cell in different geometric configurations; yet, the rates of photonic emissions were very similar. In contrast, cell shape remains fairly constant in images 5 and 6 whereas the level of reporter activity varied considerably.
We have examined an additional 21 cells (from 14 independent experiments) in this manner, and their dynamic profiles of photonic emissions are presented as Fig. 5. Although a minority subset of these neurons exhibited a relatively constant or slowly changing profile of photonic emissions over time (e.g., cell 21), the vast majority showed distinct changes that could be somewhat abrupt. Of interest, many cells (≈15 of 22) in the latter category exhibited periods during which there were distinct waves of enhanced photonic activity, suggesting that gene expression occurs in an episodic or even periodic manner. Good examples in this regard are cells 1, 5, 12, and 19. However, it should be noted that all cells studied displayed excursions of photonic emissions that were identified as pulses by pulsar analysis, although a few of these positives are questionable on visual inspection.
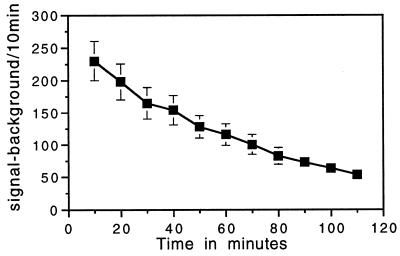
The validity of our paradigm for making continuous measurements of gene expression is predicated on the assumption that the half-life of our reporter protein is sufficiently rapid so that its background levels would not obscure short-term changes in the rate of gene expression (photonic emissions). To ensure that this was the case, we evaluated the functional half-life of our reporter system by microinjecting individual GT1–1 cells with a solution of purified firefly luciferase protein. This was done at a dose established in preliminary experiments (data not shown) to achieve a photonic signal within the range of that obtained 24 h after injecting the reporter plasmid. Immediately after microinjection, cells were exposed to luciferin-containing medium to monitor the decay of luciferase activity over time. As illustrated by representative example in Fig. 6, the level of specific photonic emissions decayed with a half-life of 51 ± 5 min (mean ± SEM, n = 29). Of interest, emission profiles from single cells microinjected with the reporter protein did not show the spontaneous fluctuations of reporter activity exhibited by cells transfected with the reporter plasmid (data not shown). Thus, these observations indicate that dynamic excursions of gene expression cannot be attributed to effects of transient changes in the cellular microenvironment on the functional activity of the luciferase protein. When viewed as a whole, these results demonstrate that the temporal resolution of our reporter system enables truly dynamic measurements of gene expression in individual neurons.
Figure 6.
The functional half-life of luciferase in GT1–1 cells is reasonably short. Individual GT1–1 neurons were microinjected with purified firefly luciferase protein (1 μg/μl) and were subjected immediately to successive photonic measurements in the presence of luciferin (0.1 mM). Photonic signals were accumulated in 10-min bins. Results illustrate averaged photonic emissions (mean ± SEM) of 18 cells in a single experiment that is representative of three others.
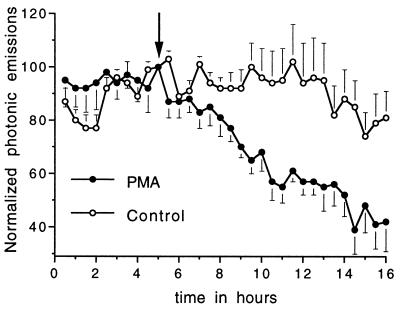
To assess whether GnRH promoter-driven reporter activity accurately reflects endogenous gene expression, we tried to suppress photonic activity with a known inhibitor of the GnRH gene. Our strategy here was to continuously monitor photonic activity from transfected GT1–1 neurons before and after exposure to the protein kinase C activator phorbol 12-myristate 13-acetate (PMA). This compound is reported to inhibit GnRH gene expression (measured by reporter activity, nuclear run-on assay, and RNase protection assay) within 8–16 h (30–32). Consistent with the results of others who used the aforementioned methods on entire populations of cells, we found (Fig. 7) that PMA caused a striking reduction of photonic signal reflective of GnRH promoter-driven gene expression from single, living GT1–1 cells. Taken together, the predictable response obtained after modulation with a known inhibitor of GnRH transcription demonstrates that our reporter activity accurately reflects endogenous gene activity.
Figure 7.
Attenuation of photonic emissions by a known inhibitor of GnRH gene expression. GT1–1 cells microinjected 24 h earlier were monitored continuously in 30-min windows. PMA (100 nM, •) or vehicle (control, ○) was infused after the first 5 h of the experiment (arrow). Shown are the averaged, normalized, photonic emissions (mean ± SEM) for 11 (PMA) and 5 (control) single cells. Photonic emissions for PMA-treated cells were significantly lower than control values (P < 0.05) beginning 4 h after addition of treatment.
The results presented herein demonstrate the feasibility of making dynamic measurements of gene expression from single, living neurons. Other investigators have used green fluorescent protein (33) and β-galactosidase (34) as markers of expression in individual neurons, and this strategy has proven invaluable for identifying when particular genes turn on during processes such as embryonic development. However, the relatively long half-lives of these reporter molecules (35) severely limit their potential as monitors of transcriptional dynamics; increases of gene expression would have to be huge and persistent to be detected above the high background of preexisting reporter whereas detection of decreased gene activity likewise would be delayed by decay considerations. In contrast, the fairly short half-life of luciferase should render it extremely useful as a dynamic monitor of gene activity. Indeed, we used a luciferase-based reporter paradigm for continuous monitoring of GnRH gene expression in single, living GT1–1 cells and found that most neurons did not express this gene in a continuous manner. Instead, our molecular “read-out” usually was manifested as discrete pulses of photonic emissions suggestive of waves in transcriptional activity. Such dynamic fluctuations of gene activity are reminiscent of the bursts of neuropeptide secretion reported to occur in transformed (GT1) as well as in normal GnRH neurons. Although these similarities invite speculation that a common intrinsic oscillator drives both phenomena, a couple of considerations warrant caution with this interpretation. First, it remains to be established whether pulses of gene expression occur in a periodic as opposed to a randomly episodic manner. An improved experimental protocol in which photonic emissions are accumulated in shorter temporal windows should facilitate resolution of this issue. Second, the reported frequency of GnRH secretory bursts (one to three bursts per hour) appears to be considerably greater than that for pulses of gene expression. The lack of stoichiometry between these parameters would argue against their being driven by a common timer. This does not preclude, however, the possibility that secretion somehow entrains gene expression or vice versa. Clearly, the possibility could be explored by making concurrent, real time measurements of both secretion and gene expression in the same living neuron. In fact, we presently are pursuing this problem by combining measurements of bioluminescence (gene expression) with those of uptake of the membrane fluorescent dye FM1–43 (secretion) in transfected GT1–1 cells. We recognize, however, that such an approach will require a reporter for gene expression that is more responsive to rapid changes than the conventional firefly luciferase (t1/2 of ≈50 min). Accordingly, we are also in the process of destabilizing both the luciferase protein and its mRNA.
As suggested above, the power of this technology for addressing compelling questions can be augmented greatly by combination with other methods for investigating intracellular processes at the single cell level. To give just another example in this regard, one could impose on the same, living neuron time-resolved measurements of both gene expression and intracellular free calcium concentration (36). Such a combined approach should help to elucidate how temporal (frequency/amplitude) and spatial (cytoplasmic vs. nuclear) changes of intracellular free calcium concentration are encoded and translated into changes in the rate of neuronal gene expression. Finally, photonic imaging of gene expression could be modified to pursue similar problems with normal, rather than immortalized, neurons of any type, including those that secrete GnRH. Thus, one could generate monolayer hypothalamic cultures from transgenic mice in which 5′ regulatory sequences of the GnRH gene fused to the luciferase reporter gene are used to ensure cell-specific targeting to GnRH neurons (37). The GnRH neurons then could be identified in mixed culture with a photon capture system and analyzed in situ with respect to gene expression. Once identified, the same neuron could be evaluated in terms of secretory or calcium dynamics without further enrichment. This approach, then, could serve to circumvent the “needle in a haystack” problem we now encounter when trying to isolate and study extremely rare neurons (such as GnRH) present in mammalian brains.
Acknowledgments
We are grateful to E.E. Glavé for technical assistance and Dr. J. K. Dias (Department of Biometry and Epidemiology, Medical University of South Carolina) for assistance in data analysis. This work was supported by National Institutes of Health Grants DK-38215 and DK-45216 (to L.S.F.). Financial support from a Postdoctoral Fellowship from the Ministry of Education and Culture of Spain (to L.N.) is gratefully acknowledged.
ABBREVIATIONS
- GnRH
gonadotropin-releasing hormone
- PMA
phorbol 12-myristate 13-acetate
Footnotes
This paper was submitted directly (Track II) to the Proceedings Office.
References
- 1.Knobil E. Recent Prog Horm Res. 1980;36:53–88. doi: 10.1016/b978-0-12-571136-4.50008-5. [DOI] [PubMed] [Google Scholar]
- 2.Silverman A J, Jhamandas J, Renaud L P. J Neurosci. 1987;7:2312–2319. [PMC free article] [PubMed] [Google Scholar]
- 3.Knobil E. Biol Reprod. 1981;24:44–49. doi: 10.1095/biolreprod24.1.44. [DOI] [PubMed] [Google Scholar]
- 4.Pohl C R, Knobil E. Annu Rev Physiol. 1982;44:583–593. doi: 10.1146/annurev.ph.44.030182.003055. [DOI] [PubMed] [Google Scholar]
- 5.Merchenthaler I, Görcs T, Sétáló G, Petrusz P, Flerkó B. Cell Tissue Res. 1984;237:15–29. doi: 10.1007/BF00229195. [DOI] [PubMed] [Google Scholar]
- 6.Moenter S M, Brand A, Midgley R, Karsh F J. Endocrinology. 1992;130:503–510. doi: 10.1210/endo.130.1.1727719. [DOI] [PubMed] [Google Scholar]
- 7.Levine J E, Chappel P, Besecke L M, Bauer-Dantoin A C, Wolfe A M, Porkka-Heiskanen T, Urban J H. Cell Mol Neurobiol. 1995;15:117–139. doi: 10.1007/BF02069562. [DOI] [PMC free article] [PubMed] [Google Scholar]
- 8.Moenter S M, Caraty A, Lehman M N, Karsh F J. Hum Reprod. 1993;8:51–56. doi: 10.1093/humrep/8.suppl_2.51. [DOI] [PubMed] [Google Scholar]
- 9.Bourguinon J P, Franchimont P. Neuroendocrinology. 1981;9:389–396. [Google Scholar]
- 10.Krsmanovíc L Z, Stojilkovíc S S, Merelli F, Dufour S M, Virmani M A, Catt K J. Proc Natl Acad Sci USA. 1992;89:8462–8466. doi: 10.1073/pnas.89.18.8462. [DOI] [PMC free article] [PubMed] [Google Scholar]
- 11.Mahachoklerwattana P, Sanchez J, Kaplan S L, Grumbach M M. Endocrinology. 1994;134:1023–1030. doi: 10.1210/endo.134.3.8119138. [DOI] [PubMed] [Google Scholar]
- 12.Wetsel W C. Cell Mol Neurobiol. 1995;15:43–77. doi: 10.1007/BF02069558. [DOI] [PMC free article] [PubMed] [Google Scholar]
- 13.Silverman A J. Endocrinology. 1987;99:30–41. doi: 10.1210/endo-99-1-30. [DOI] [PubMed] [Google Scholar]
- 14.Schwanzel-Fukuda M, Jorgenson K L, Bergen H T, Weesner G D, Pfaff D W. Endocr Rev. 1992;13:623–634. doi: 10.1210/edrv-13-4-623. [DOI] [PubMed] [Google Scholar]
- 15.Mellon P L, Windle J J, Goldsmith P C, Padula C A, Roberts J L, Weiner R. Neuron. 1990;5:1–10. doi: 10.1016/0896-6273(90)90028-e. [DOI] [PubMed] [Google Scholar]
- 16.Liposits Z, Merchenthaler I, Wetsel W C, Reid J J, Mellon P L, Weiner R I, Negro-Vilar A. Endocrinology. 1991;129:1575–1583. doi: 10.1210/endo-129-3-1575. [DOI] [PubMed] [Google Scholar]
- 17.Weiner R I, Wetsel W, Goldsmith P, Martinez de la Escalera G, Windle J, Padula C, Choi A L H, Negro-Vilar A, Mellon P. Front Neuroendocrinol. 1992;13:95–119. [PubMed] [Google Scholar]
- 18.Martinez de la Escalera G, Choi A L H, Weiner R I. Neuroendocrinology. 1995;61:310–317. doi: 10.1159/000126853. [DOI] [PubMed] [Google Scholar]
- 19.Martinez de la Escalera G, Choi A L H, Weiner R I. Proc Natl Acad Sci USA. 1992;89:1852–1855. doi: 10.1073/pnas.89.5.1852. [DOI] [PMC free article] [PubMed] [Google Scholar]
- 20.Kokoris G J, Lam N Y, Ferin M, Silverman A J, Gibson M J. Neuroendocrinology. 1988;48:45–52. doi: 10.1159/000124988. [DOI] [PubMed] [Google Scholar]
- 21.Castaño J P, Kineman R D, Frawley L S. Mol Endocrinol. 1996;10:599–605. doi: 10.1210/mend.10.5.8732690. [DOI] [PubMed] [Google Scholar]
- 22.Willard S T, Faught W J, Frawley L S. Cancer Res. 1997;57:4447–4450. [PubMed] [Google Scholar]
- 23.Lin P F, Ruddle R J. Exp Cell Res. 1981;134:485–488. doi: 10.1016/0014-4827(81)90452-3. [DOI] [PubMed] [Google Scholar]
- 24.Frawley L S, Neill J D. Endocrinology. 1984;114:659–663. doi: 10.1210/endo-114-2-659. [DOI] [PubMed] [Google Scholar]
- 25.Gitzen J, Ramirez V D. Life Sci. 1986;38:17III. [Google Scholar]
- 26.Merriam G R, Wachter K W. Am J Physiol. 1982;243:E310–E318. doi: 10.1152/ajpendo.1982.243.4.E310. [DOI] [PubMed] [Google Scholar]
- 27.Terasawa E, Krook C, Eman S, Watanabe G, Bridson W E, Stoll S A, Hei D L. Endocrinology. 1987;120:2265–2272. doi: 10.1210/endo-120-6-2265. [DOI] [PubMed] [Google Scholar]
- 28.Fox S R, Smith M S. Endocrinology. 1984;115:2045–2051. doi: 10.1210/endo-115-6-2045. [DOI] [PubMed] [Google Scholar]
- 29.Carnes M, Lent S J, Goodman B, Mueller C, Saydoff J, Erisman S. Endocrinology. 1990;126:1904–1913. doi: 10.1210/endo-126-4-1904. [DOI] [PubMed] [Google Scholar]
- 30.Wetsel W C, Eraly S A, Whyte D B, Mellon P L. Endocrinology. 1993;132:2360–2370. doi: 10.1210/endo.132.6.8504741. [DOI] [PubMed] [Google Scholar]
- 31.Bruder J M, Wierman M E. Mol Cell Endocrinol. 1994;99:177–182. doi: 10.1016/0303-7207(94)90006-x. [DOI] [PubMed] [Google Scholar]
- 32.Gore A C, Roberts J L. Front Neuroendocrinol. 1997;18:209–245. doi: 10.1006/frne.1996.0149. [DOI] [PubMed] [Google Scholar]
- 33.Moriyoshi K, Richards L J, Akazawa C, O’Leary D D, Nakanishi S. Neuron. 1996;16:255–260. doi: 10.1016/s0896-6273(00)80044-6. [DOI] [PubMed] [Google Scholar]
- 34.Luskin M B. FASEB J. 1994;8:722–730. doi: 10.1096/fasebj.8.10.8050671. [DOI] [PubMed] [Google Scholar]
- 35.Wood K V. Curr Opin Biotechnol. 1995;6:50–58. doi: 10.1016/0958-1669(95)80009-3. [DOI] [PubMed] [Google Scholar]
- 36.Villalobos C, Faught W J, Frawley L S. Mol Endocrinol. 1998;12:87–95. doi: 10.1210/mend.12.1.0055. [DOI] [PubMed] [Google Scholar]
- 37.Wolfe A M, Wray S, Westphal H, Radovick S. J Biol Chem. 1996;271:20018–20023. doi: 10.1074/jbc.271.33.20018. [DOI] [PubMed] [Google Scholar]


