

Abstract
In a previous publication (Rodriguez, M.L., M. Brignoni, and P.J.I. Salas. 1994. J. Cell Sci. 107: 3145–3151), we described the existence of a terminal web-like structure in nonbrush border cells, which comprises a specifically apical cytokeratin, presumably cytokeratin 19. In the present study we confirmed the apical distribution of cytokeratin 19 and expanded that observation to other epithelial cells in tissue culture and in vivo. In tissue culture, subconfluent cell stocks under continuous treatment with two different 21-mer phosphorothioate oligodeoxy nucleotides that targeted cytokeratin 19 mRNA enabled us to obtain confluent monolayers with a partial (40–70%) and transitory reduction in this protein. The expression of other cytoskeletal proteins was undisturbed. This downregulation of cytokeratin 19 resulted in (a) decrease in the number of microvilli; (b) disorganization of the apical (but not lateral or basal) filamentous actin and abnormal apical microtubules; and (c) depletion or redistribution of apical membrane proteins as determined by differential apical–basolateral biotinylation. In fact, a subset of detergent-insoluble proteins was not expressed on the cell surface in cells with lower levels of cytokeratin 19. Apical proteins purified in the detergent phase of Triton X-114 (typically integral membrane proteins) and those differentially extracted in Triton X-100 at 37°C or in n-octyl-β-d-glycoside at 4°C (representative of GPIanchored proteins), appeared partially redistributed to the basolateral domain. A transmembrane apical protein, sucrase isomaltase, was found mispolarized in a subpopulation of the cells treated with antisense oligonucleotides, while the basolateral polarity of Na+– K+ATPase was not affected. Both sucrase isomaltase and alkaline phosphatase (a GPI-anchored protein) appeared partially depolarized in A19 treated CACO-2 monolayers as determined by differential biotinylation, affinity purification, and immunoblot. These results suggest that an apical submembrane cytoskeleton of intermediate filaments is expressed in a number of epithelia, including those without a brush border, although it may not be universal. In addition, these data indicate that this structure is involved in the organization of the apical region of the cytoplasm and the apical membrane.
Cell polarity (asymmetry) is a broadly distributed and highly conserved feature of many different cell types, from prokaryotes to higher eukaryotes (Nelson, 1992). In multicellular organisms it is more conspicuous in, but not restricted to, neurons and epithelial cells. In the latter, the plasma membrane is organized in two different domains, apical and basolateral. This characteristic enables epithelia to accomplish their most specialized roles including absorption and secretion and, in general, to perform the functions of organs with an epithelial parenchyma such as the kidney, liver, intestine, stomach, exocrine glands, etc. (Simons and Fuller, 1985; Rodriguez-Boulan and Nelson, 1989).
The acquisition and maintenance of epithelial polarity is based on multiple interrelated mechanisms that may work in parallel. Although the origin of polarization depends on the sorting of apical and basolateral membrane proteins at the trans-Golgi network (Simons and Wandinger-Ness, 1990), the mechanisms involved in the transport of apical or basolateral carrier vesicles, the specific fusion of such vesicles to the appropriate domain, and the retention of membrane proteins in their correct positions are also important (Wollner and Nelson, 1992). Various components of the cytoskeleton seem to be especially involved in these mechanisms (Mays et al., 1994). Among them, the microtubules, characteristically oriented in the apical–basal axis with their minus ends facing toward the apical domain, appear in a strategic position to transport carrier vesicles (Bacallao et al., 1989). This orientation is largely expected because of the apical distribution of centrioles and microtubule organizing centers in epithelial cells (Buendia et al., 1990). The molecular interactions responsible for that localization, however, are unknown.
Actin is a widespread component of the membrane skeleton found under apical, lateral, and basal membranes in a nonpolarized fashion (Drenckhahn and Dermietzel, 1988; Vega-Salas et al., 1988). Actin bundling into microvillus cores in the presence of villin/fimbrin, on the other hand, is highly polarized to the apical domain (Ezzell et al., 1989; Louvard et al., 1992). In fact, different isoforms of plastins determine microvillus shape in a tissue-specific manner (Arpin et al., 1994b ). Why this arrangement is not found in other actin-rich regions of the cell is unclear (Louvard et al., 1992; Fath and Burgess, 1995).
Fodrin, the nonerythroid form of spectrin, underlies the basolateral domain (Nelson and Veshnock, 1987a ,b) and is known to participate in the anchoring/retention of basolateral proteins (Drenckhahn et al., 1985; Nelson and Hammerton, 1989). Although different groups have found specific cytoskeletal anchoring of apical membrane proteins at the “correct” domain (Ojakian and Schwimmer, 1988; Salas et al., 1988; Parry et al., 1990), no specific apical counterpart of the basolateral fodrin cytoskeleton is known. This is especially puzzling since we showed that MDCK cells can maintain apical polarity in the absence of tight junctions, an indication that intradomain retention mechanisms are operational for apical membrane proteins (Vega-Salas et al., 1987a ).
It is known that a network of intermediate filament (IF)1, the major component of the terminal web, bridges the desmosomes under the apical membrane in brush border cells (Franke et al., 1979; Hull and Staehelin, 1979; Mooseker, 1985), although no specific protein has been identified with this structure. The observation of a remarkable resistance to extractions of apical proteins anchored to cytoskeletal preparations (Salas et al., 1988) comparable to that of intermediate filaments, led us to the study of cytokeratins in polarized cells. We developed an antibody against a 53-kD intermediate filament protein in MDCK cells. This protein was found to be distributed exclusively to the apical domain and to form large (2,900 S) multi-protein complexes with apical plasma membrane proteins. Internal microsequencing of the 53-kD protein showed very high (95– 100%) homology with two polypeptides in the rod domain of cytokeratin 19 (CK19; Moll et al., 1982) a highly conserved and peculiar intermediate filament protein (Bader et al., 1986). A complete identification however, could not be achieved (Rodriguez et al., 1994). The present study was undertaken to establish that identity and to determine the possible functions of this apical membrane skeleton. Because cytokeratins have been poorly characterized in canine cells, and no cytokeratin sequences are available in this species, we decided to switch from MDCK cells to two human epithelial cell lines, CACO-2, an extensively studied model of epithelial polarization that differentiates in culture to form brush border containing cells (Pinto et al., 1983), and MCF-10A (Tait et al., 1990), a nontumorigenic cell line derived from normal mammary epithelia, as a model of nonbrush border cells.
To assess possible functions of cytokeratin 19, we chose to selectively reduce its synthesis using anti-sense phosphorothioate oligodeoxy nucleotides, an extensively used approach in recent years (e.g., Ferreira et al., 1992 ; Hubber et al., 1993; Takeuchi et al., 1994). Although we could not achieve a complete knock out, the steady-state levels of cytokeratin 19 were decreased to an extent that enabled us to detect significant changes in the phenotype of CACO-2 and MCF-10A cells.
Materials and Methods
Cells
MDCK cells were cultured as described before (Rodriguez et al., 1994). MCF-10A (CRL-10317), CACO-2 (HTB-37), and CACO-2 C2BBe1 (CRL2102) cells were obtained from American Type Culture Collection (Rockville, MD). MCF-10A were maintained in DME-F12 media supplemented with 5% horse serum (GIBCO BRL, Gaithersburg, MD), 100 ng/ml cholera toxin, 1 μg/ml insulin, 500 pg/ml EGF, and 200 ng/ml hydrocortisone. All these reagents were either γ-irradiated or cell culture tested. CACO-2 and CACO-2 C2BBe1 were maintained in DME-F12 supplemented with 10% fetal bovine serum (GIBCO BRL) and 1 mM sodium pyruvate. All cell lines were continuously incubated in 5% CO2 in a water-jacketed incubator at 37°C. The cell stocks were kept in 25- or 75-cm2 tissue culture flasks and harvested weekly by dissociation in 0.25% trypsin, 2 mM EDTA for 15 (CACO-2) or 30 min (MCF-10A) at 1:10 dilution. Cell stocks for continuous oligonucleotide treatment were maintained in 1 or 2 wells of a 24-well multidish or expanded to 1–2 wells of a 6-well multidish before biochemical experiments. For experiments, the cells were plated at high densities (∼5 × 10⁴ cells/cm2, to obtain confluency in 1–2 d) on 12mm round glass coverslips (German glass; Fisher Scientific, Pittsburgh, PA), on laminin-coated glass coverslips (MCF-10A cells) (Biocoat; Becton Dickinson Labware, Bedford, MA), on 6- or 24-mm TranswellClear™ filters (Corning Costar Corp., Cambridge, MA), or on 140-mm polycarbonate filters (Poretics Corp., Livermore, CA). In the case of filtergrown cells, monolayer integrity was checked by its trans-epithelial electrical resistance (TER), which was measured via Ag/AgCl electrodes with an Epithelial Volt-Ohmmeter (World Precision Instrs. Inc., Sarasota, FL). The final measure of TER was obtained after subtracting the resistance of the solution and the filter without cells.
Oligonucleotides
Synthetic phosphorothioate oligodeoxy nucleotides have been used by a large number of researchers to reduce the synthesis of specific proteins. The thioate substitution makes them more permeable and more stable both outside and inside the cell (Zhao et al., 1993). Four different 21-mer oligonucleotides, two with antisense sequences for CK19 mRNA (A19 and A19/2), and their corresponding randomized sequences (random and random/2; described in Fig. 1) were synthesized in a DNA synthesizer (model 394; Perkin Elmer Applied Biosystems, Foster City, CA) at the DNA Core Laboratory, University of Miami. The oligonucleotides were usually produced on a 1 μM scale with a 21–35% final yield and routinely purified by two consecutive cycles of ethanol precipitation and resuspension in 10 mM Tris-Cl, 1 mM EDTA, pH 8.0, followed by a 10× dilution in the same buffer and ultrafiltration in Centricon™ 3 concentrators (Amicon Inc., Beverly, MA) to concentrate the oligonucleotides to the original volume. Typically, the yield of this purification procedure was 70–80%. For experiments, the oligonucleotides were mixed to a final concentration with the standard tissue culture media supplemented as described above and filter sterilized through a 0.2-μm pore filter immediately before use. There is consensus that 21-mer phosphorothioate oligonucleotides are effective at concentrations ranging 1–10 μM. Because it is known that the half life of these oligonucleotides in tissue culture media containing sera is ∼24 h (Campbell et al., 1990), we re-fed the cells every 48 h (except weekends) with 10 μM A19, A19/2, random, or random/2 oligonucleotides, aiming to maintain a concentration always >1 μM. The uptake of oligonucleotides was found to be higher in subconfluent cells. Therefore, cell stocks were dissociated as soon as they reached confluency, usually once or twice a week. These stocks were continuously maintained under oligonucleotide treatment from a minimum of two passages and up to 4 mo. For experiments, the cells were kept under oligonucleotide treatment until fixed or extracted. In all cases, the antisense (A19 or A19/2) and the control (random or random/2) oligonucleotides were synthesized in tandem, using the same reagents, and applied in the same experiments. No toxic effects were observed with the 41 batches of oligonucleotides used in this study, except one case, in which the cells died almost immediately with two of the oligonucleotides. In preliminary experiments we could not detect any differences in the seeding efficiency of cells kept in oligonucleotides and those of untreated cells of the same line. Likewise, we found no noticeable differences in the morphology or polarity of cells kept in random oligonucleotide and nontreated cells. Database searches to check possible interactions of these oligonucleotides with other known sequences were performed using the Fasta algorithm (Genetics Computer Group, Madison, WI).
Figure 1.

Sequences of the 5′ end of the reading frame of CK19 cDNA (Y00503; Swissprot P08727; Stasiak and Lane, 1987; Eckert, 1988), antisense (A19 and A19/2), and the corresponding random deoxyoligonucleotides.
Antibodies and Reagents
The primary specific antibodies used in this study are described in Table I. All secondary antibodies were affinity purified and had no cross-reactivities with immunoglobulins of other species other than the specific target (Jackson ImmunoResearch Labs. Inc., West Grove, PA). Cross-reactivity, however, was routinely checked by Outcherlony agar diffusion assay before colocalization experiments. Peroxidase-coupled antibodies were obtained from Sigma Chemical Co. (St. Louis, MO) and used at the dilutions specified by the manufacturer. FITC–phalloidin (Molecular Probes Inc., Eugene, OR) was kept in a stock solution in methanol at −20°C. Before use it was dried with N2 and diluted 1:40 (vol/vol) in PBS.
Table I.
Specific Antibodies
| Antigen | Host | Type | Nomenclature | Source | ||||
|---|---|---|---|---|---|---|---|---|
| Cytokeratin 19 | mouse | mAb | A53-B/A2 | Sigma Chemical Co., St. Louis, MO | ||||
| Cytokeratin 19 | mouse | mAb | K4.62 | Sigma Chemical Co. | ||||
| Cytokeratin 19 (nonhuman) | mouse | mAb | MAB1675 | Chemicon Int. Inc., Temecula, CA | ||||
| Cytokeratin 19 | mouse | mAb | RCK108 | Accurate Chem. and Sci. Corp., Westbury, NY | ||||
| Cytokeratin 19 | mouse | mAb | 2F5/96 | Biogenesis, Inc., Sandown, NH | ||||
| Cytokeratin 19 | rabbit | polyclonal | anti-53 kD | (Rodriguez et al., 1994) | ||||
| Cytokeratin 8 | mouse | mAb | M20 | Sigma Chemical Co. | ||||
| Cytokeratin 18 | mouse | mAb | CK5 | Sigma Chemical Co. | ||||
| Pan-cytokeratin | mouse | mAb | PCK-26 | Sigma Chemical Co. | ||||
| Pan-cytokeratin | mouse | mAb | AE1/AE3 | Dako Corp., Carpinteria, CA | ||||
| Actin (all isoforms) | mouse | mAb | C4 | ICN Biomedicals, Inc., Costa Mesa, CA | ||||
| Alkaline phosphatase | rabbit | polyclonal | Z 271 | Dakopatt A/S, Glostrup, Denmark | ||||
| Na+–K+ATPase | rabbit | polyclonal | (Mays et al., 1995) | |||||
| Sucrase isomaltase | mouse | mAb | HBB2/614/88 | (Hauri et al., 1985) | ||||
| Tubulin (α, β) | rabbit | polyclonal | Polysciences, Inc., Warrington, PA | |||||
| Villin | mouse | mAb | MAB1671 | Chemicon Int., Inc. | ||||
| ZO-1 | rat | mAb | anti–ZO-1 | Chemicon Int., Inc. |
Immunofluorescence and In Situ Hybridization
The procedures for immunofluorescence were described before (VegaSalas et al., 1987a,b) and were used with the following modifications. For microtubule localization, the cells were permeabilized for 1 min before fixation in 0.1% saponin, 80 mM Pipes, pH 6.5, 5 mM EGTA, 2 mM MgCl2, 1 mM GTP, 0.1 mM AEBSF at 37°C, and then fixed in 3% formaldehyde (freshly prepared from paraformaldehyde), 0.1% glutaraldehyde, 1 mM MgCl2, 0.1 mM CaCl2 in PBS, also at 37°C. Next, standard washes in PBS and quenching of aldehyde groups in 50 mM NH4Cl were performed. We checked other procedures, such as the use of sodium borohydride, but did not find an improvement in morphology. In the case of CK19 localization, the fixation procedure depended on the mAb to be used. RCK108 and K4.62 gave excellent results with formaldehyde fixations. MAB1675 and A53-B/A2 were best when used on methanol-fixed or -unfixed tissues. The morphology of IF, however, was best preserved after aldehyde fixation. In all cases, 0.1% Triton X-100 was added to all the solutions during the processing. Localization of filamentous (F) actin with FITC–phalloidin was done on formaldehyde fixed cells and permeabilized with 0.1% Triton X-100. For in situ hybridization, oligonucleotide treated cells were fixed in 1% formaldehyde, permeabilized in 100% methanol at −20°C, washed in PBS, and quenched in 50 mM NH4Cl. The cells were then incubated for 2 h in 1 μM 21-mer biotinylated synthetic deoxyoligonucleotide with the sense sequence complementary of A19 or random. In a second step, these biotinylated probes were localized with streptavidin coupled to Texas red (Jackson ImmunoResearch Labs. Inc.).
Colocalization of villin and CK19 imposed a special difficulty since both antibodies available to us were monoclonal (mouse). In addition, the anti-villin antibody was found to react only in methanol fixed cells and not after aldehyde fixations, while the morphology of IF after methanol fixation using RCK108 was usually poor. To circumvent both problems, we biotinylated the anti-CK19 RCK108 mAb and performed the incubation of antibodies as follows. The cells were first fixed in methanol (−20°C) for 20 min, washed in PBS, incubated with 1% globulin-free BSA, 50 μg/ml preimmune goat IgG for 20 min, and with the anti-villin mAb for 20 min. The monolayers were then washed in PBS and post-fixed in 3% PFA. The rest of the steps were as described above. The order or the application of antibodies (with washes in PBS between each antibody and the following) was: FITC-coupled goat anti–mouse IgG (to detect the anti-villin antibody applied before the PFA fixation), 50 μg/ml preimmune mouse IgG (to quench any remaining binding sites in the anti–mouse antibody), biotinylated RCK108 anti-CK19 mAb, and Texas red coupled streptavidin.
Fluorescence on filter-grown cells was performed as described above with the following exceptions: (a) reagents (antibodies or streptavidin) were added from both sides of the filter; (b) cells were not permeabilized except for the anti-Na+–K+ATPase antibody; (c) incubations with antibodies were much longer than on coverslips, usually overnight; and (d) washes were also longer, usually 4 h, always with gentle agitation. The filters were mounted in 10% polyvinyl-alcohol, 30% glycerol, 1% n-propyl gallate, 1:100 (vol/ vol) SlowFade™ (Molecular Probes, Inc.) with the monolayer facing up, covered with a coverslip, and allowed to harden overnight pressed with a 50-g weight on the coverslip. Before using these prepartions for confocal microscopy, the coverslips were glued to the glass slides with nail polish.
Standard epifluorescence was performed with a Leitz DM RB microscope (Leica Instrs., GmbH, Wetzlar, Germany), equipped with a Leica Orthomat E microphotography system, using a 63× (1.4 NA) infinity-corrected objective. Kodak TMax 400 ASA film was used for photography.
Laser confocal microscopy was performed with an Odyssey XL (Noran Instruments, Inc., Middleton, WI) microscope, using an Omnichrome laser source. For colocalization experiments (FITC/Texas red), a second detection channel was used with a 580-nm secondary dichroic. To increase resolution in the z axis, a 15-μm slit was routinely used. The images were collected using Intervision software (Noran Instruments, Inc.). Each confocal section was obtained as the average of 64 frames. The sections were collected at 0.2 μm intervals in the z axis with 650 dots per inch resolution (nearly cubic voxels) through a 63× oil immersion objective. Usually, each field comprised 60–90 confocal sections. For three-dimensional reconstruction we used Intervision software. The stacks of sections were cut in 4 pixel thin volumes (in the x axis), reconstructed, and rotated 90° to obtain a view of the apical–basal axis. The images were converted to TIFF format and photographed with a 4,000 line resolution Personal LFR Plus laser camera (Lasergraphics, Irvine, CA) in 35-mm Kodak TMax 100 ASA film.
Transmission Immunoelectron Microscopy and Scanning Electron Microscopy
Immunoperoxidase for transmission electron microscopy was performed on cells grown on Transwell™ filters following the protocol of Brown and Farquhar (1984), slightly modified for tissue culture cells (Vega-Salas et al., 1987b ). For scanning electron microscopy, the cells were grown on glass coverslips, fixed in 3.5% glutaraldehyde and 2% OsO4, processed by critical-point drying, gold coated, and observed with a JSM-35 (Jeol Ltd., Tokyo, Japan) scanning microscope, using Polaroid 55 film (Polaroid, Cambridge, MA).
PAGE and Immunoblot
Cytoskeletal preparations were obtained from monolayers grown on filters by extracting them in PBS supplemented with 1% Triton X-100, 2 mM EGTA, 1.5 M KCl, 15 mM β-mercaptoethanol, 1 mM AEBSF, and 2 μg/ml aprotinin (both from Calbiochem, La Jolla CA; EB TX-100) at 4°C for 10 min. The monolayers were gently scraped from the filter with a rubber policeman, sonicated on ice for 30 s, and spun at 15,000 g for 5 min. The pellets were denatured in SDS sample buffer containing 8 M urea for 3 min at 95°C. Small aliquots from these extracts were acetone precipitated, resuspended in water, and TCA prepitated, and the protein was measured by Peterson's modification of the Lowry's micromethod (Peterson, 1977). The volume of the samples was then slightly adjusted to seed 4 μg protein per lane. These samples were run in SDS-PAGE (Laemmli, 1970) and blotted onto nitrocellulose sheets (Towbin et al., 1979). The signal of primary mAbs was revealed using a secondary affinity-purified goat anti– mouse IgG coupled to peroxidase and a chemiluminiscence system (Pierce, Rockford, IL) on preflashed X-ray film. The ratio of signals between specific bands was estimated by digitizing the image (Quantimet Q500 Image Analysis system; Leica) from X-ray film and comparing the ratio of the average of all pixel values in the area of one band and the average of pixel values in a similar area on the other band after subtracting the background measured from an irrelevant area (band OD from digitized images). When the areas of two bands were different, these values were further corrected by the number of pixels in each band (weighted OD = average pixel values × number of pixels in the band).
Reprobing of nitrocellulose sheets was done by stripping previously bound antibodies with 100 mM β-mercaptoethanol, 2% SDS, 62 mM TrisCl, pH 6.7, at 55°C for 30 min. The membranes were then extensively washed in PBS, 0.1% Tween-20 for 2 h (four washes), and reprocessed for immunoblot. This procedure resulted in slightly increased background levels, but could be applied for consecutive cycles to a single nitrocellulose sheet.
Plasma Membrane Polarity Assays
Biotinylation of apical or basolateral membrane proteins on filter-grown monolayers using the membrane impermeant biotin derivative sulfo-NHS– biotin (Pierce) has been described elsewhere (Rodriguez-Boulan et al., 1989). To separate different categories of membrane proteins, the cells were extracted twice consecutively, the first time in 2% Triton X-114 (purified by cycles at 30°/4°C; Bordier, 1981) in PBS, 2 mM EDTA, 10 mM NH4Cl, 1 mM AEBSF, 2 μg/ml aprotinin, and 10 μM E-64 (PBS-EDTA; Calbiochem), at 0°C for 15 min. The pellets were spun in the cold (15,000 g, 5 min) and the supernatants incubated at 30°C for 3 min to separate the detergent phase of Triton X-114, which was further acetone precipitated and resuspended in SDS sample buffer. The pellets from the first extraction were then sonicated for 30 s in 1% Triton X-100 in PBS-EDTA and warmed to 37°C for 15 min. These resuspended pellets were spun again at room temperature (15,000 g, 5 min) and immediately resuspended in SDS sample buffer. The supernatants from the second extraction in Triton X-100 were acetone precipitated and resuspended in SDS sample buffer. In some experiments, the extraction in Triton X-100 was replaced by an extraction in 60 mM n-octyl-β-d–glycoside (Anatrace Inc., Maumee, OH) in PBS– EDTA at 4°C. The total protein in each SDS extract was measured as described in the previous section. Samples with equal amounts of total protein for each extraction procedure were run in SDS-PAGE and blotted and biotinylated proteins detected with Extravidin-peroxidase™ (Sigma Chemical Co.) and chemiluniscence. In these cases, a second set of biotinylated molecular weight standards (Sigma Chemical Co.) was used in addition to the usual Coomasie blue–labeled standards.
For detection of specific proteins, the cells were grown on 140-mm polycarbonate filters overlayed with tissue culture medium supplemented with oligonucleotides as described above. The filters were then mounted on plastic frames glued with silicone grease to separate apical and basolateral compartments, and the monolayers were biotinylated as described above. The cells were subjected to two consecutive extractions as described, and the Triton X-100 supernatant was pooled with the Triton X-114 detergent phase. The biotinylated proteins were then affinity purified in batch with 50 μl gel/filter of streptavidin coupled to agarose beads (Pierce). After extensive washes in the Triton X-100 extraction buffer supplemented with 1% Triton X-100 and 600 mM KCl, the beads were eluted in 1 ml 1% SDS, 5 M urea, 50 mM β-mercaptoethanol in 2 mM Tris-Cl buffer for 2 h. The eluates were acetone precipitated, resuspended in SDS sample buffer, run in SDS-PAGE, and blotted onto nitrocellulose sheets. Specific proteins were detected by immunoblot with antibodies against sucrase isomaltase or alkaline phosphatase and a chemiluminiscence detection system. The signal intensity was measured as described above using the average pixel values in each band. Because in this case significant differences in the size of the bands were found, we also estimated a total signal value (weighted signal) as pixel average × number of pixels in the band.
Cryostat Sections of Organs
Samples of organs were obtained from biopsies (human) or from killed animals (rat, mouse), immediately embedded in TBS tissue freezing medium (Electron Microscopy Sciences, Ft. Washington, PA), and frozen. Cryostat (∼5 μm thin) sections were mounted on glass slides and stored at −20°C. Some sections were immersed in 100% methanol and then processed, while others were directly processed for immunofluorescence. We found no significant differences in the distribution of CK19 with or without fixation when the slides were observed immediately (up to 4 h) after the antibody incubations.
Results
A 21-mer Antisense Oligonucleotide Reduces the Steady-state Levels of Cytokeratin 19 in Epithelial Cells in Tissue Culture
Our previous observation of an apically distributed cytokeratin displaying significant peptide homologies with cytokeratin 19 was further confirmed by cross-reaction of antibodies. Most mAbs against CK19 did not cross-react with canine cells, including the mAb against nonhuman CK19 (MAB1675). One of them (K4.62) however, did recognize the same protein that our polyclonal antibody localized in the apical domain of MDCK cells (Rodriguez et al., 1994). Conversely, our polyclonal antibody against the apical cytokeratin in MDCK cells recognized the same band in immunoblots from human cells as all of the anti-CK19 mAbs (Table I). It consistently showed the same apical subcellular distribution (see Table III) in immunofluorescence as the anti-CK19 mAbs in tissue culture cell lines and epithelial tissues from biopsies (RCK108 and A53-B/A2, Fig. 2, g and h, and see Fig. 11). On the basis of these experiments we confirmed that human CK19 also exhibits an apical distribution in various epithelia. To assess whether these apical CK19 intermediate filaments play any role in the organization of the apical region, we attempted its knockout using a phosphorothioate deoxyoligonucleotide with the antisense sequence of the first 21 bases in the open reading frame of human CK19 mRNA (Eckert, 1988), hereafter referred to as A19 (Fig. 1). As a control, we used another 21-mer phosphorothioate deoxyoligonucleotide, with the same bases but in a randomized sequence (Fig. 1, random). In addition, another 21-mer antisense oligonucleotide, complementary to the last 11 bases in the 5′ UTR and the first 10 of the ORF of CK19 mRNA (A19/2) was also used in some experiments to further confirm the specificity of the effect and controlled with the corresponding randomized sequence oligonucleotide (Fig. 1, random/2). All the sequences were searched in the GenBank database. The 32 bases in the CK19 message (to which A19 and A19/2 were antisense sequences) showed high homologies with CK19 from other species but not with other known human mRNAs. The only other significant homologies found in vertebrates were proteins expressed in hippocampal neurons in rat (85% identity in 20 bases; these sequence data are available from GenBank/EMBL/DDBJ under accession no. L26525) and in T-cells in mice (89.5% identity in 19 bases; under accession no. M16122). Therefore, CK19 is likely to be the only protein targeted by A19 or A19/2 antisense oligonucleotides. In the case of the random oligonucleotides, no significant reverse/complemented homologies were found in higher eukaryote sequences. For all the experiments, the random oligonucleotides were synthesized at the same time with the same reagents and purified in parallel with the corresponding antisense oligonucleotides for CK19.
Table III.
Summary of the Distribution of CK19 in Epithelia in Culture and In Vivo
| Organ/Tissue | Species | Image | ||
|---|---|---|---|---|
| MDCK (kidney, distal, or collect. tub.) | Dog | Apical, continuous‡ | ||
| MCF-10A (normal mammary epith.) | Human | Apical, continuous* | ||
| CACO-2 (colon carcinoma, differentiates in tissue culture) | Human | Apical, continuous* | ||
| Stomach (surface and glandular epithelium) | Human | Apical, continuous* | ||
| Lung (bronchiolar epithelium) | Human | Apical, continuous* | ||
| Breast (duct epithelium) | Human | Apical, continuous* | ||
| Kidney (collecting tubule) | Rat | Apical, continuous* | ||
| Kidney (S-shaped body) | Human fetal | Apical, continuous§ | ||
| Small intestine (epithelium on villus) | Rat, newborn | Apical, continuous* | ||
| Small intestine (epithelium on villus) | Mouse, adult | Apical, continuous* | ||
| Thyroid | Human | Apical/lateral, heterogeneous‖ | ||
| Lung (intrapulmonary bronchus) | Human | Apical cytoplasm, discontinuous* | ||
| Small intestine (epithelium of villus) | Rat | Apical cytoplasm, discontinuous* | ||
| Small intestine (deep epith. of crypts) | Rat | Negative* | ||
| Liver (hepatocytes) | Rat/human | Negative* | ||
| Kidney (proximal tubule) | Rat/human | Negative* | ||
| Lung carcinoma | Human | Negative* | ||
| Stomach carcinoma | Human | Negative* | ||
| Breast carcinoma | Human | Negative* |
Antibodies used in these experiments: A53-B/A2 and RCK108 mAbs and anti-53-kD MDCK protein polyclonal antibody. “Discontinuous” refers to a broad distribution of CK19 in the apical cytoplasm, below the terminal web.
Figure 2.

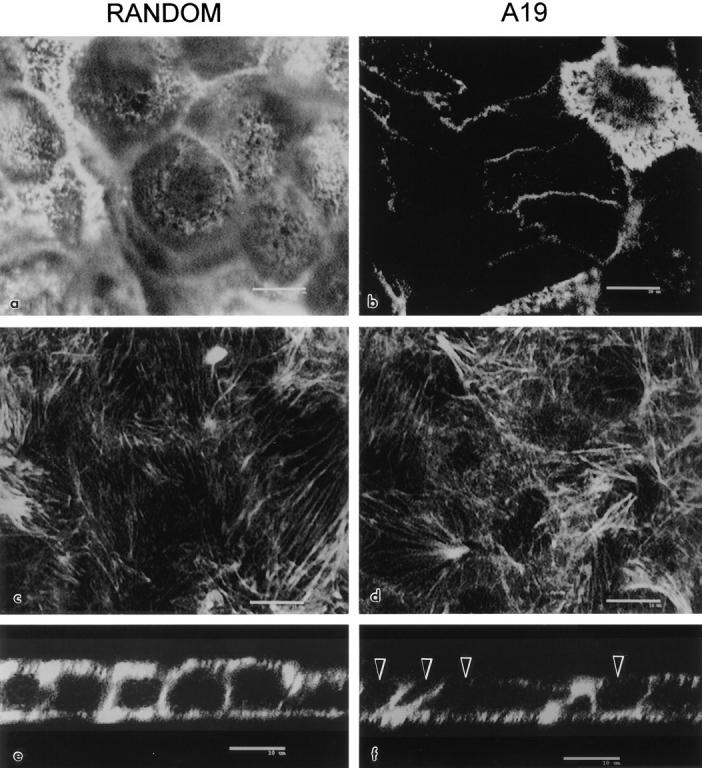
Uptake and effect of antisense (A19) oligonucleotide in MCF-10A and CACO-2 cells. MCF-10A (a and b) and CACO-2 cells (c–j) were cultured on glass coverslips. The cells were continuously grown in either random (a, c, e, g, i) or A19 (b, d, f, h, j) oligonucleotides. In some cases, the cells were fixed (PFA), permeabilized, and processed with a biotinylated sense oligonucleotide (complementary of A19, a–d; or complementary of random, e and f) followed by Texas red–conjugated streptavidin. Other monolayers were processed for indirect immunofluorescence with anti-CK19 mAb (RCK108; g–j). Some samples were observed under laser confocal microscopy as a series of confocal optical sections in the z axis (perpendicular to the plane of the monolayer), and then the transmonolayer section image was obtained as a three-dimensional reconstruction of 4 voxel thick volumes (g and h). Black arrowheads point to the apical CK19 network, and white arrowheads show the position of the basal domain. Other samples are shown desuper under standard epifluorescence microscopy (i and j). Bars: (a–f, i, j) 10 μm; (g and h) 20 μm.
Figure 11.

Effect of A19 oligonucleotide on the polarity of sucrase isomaltase and alkaline phosphatase in CACO-2 cells. Confluent monolayers were grown on polycarbonate filters in the presence of random (lanes A and B) or A19 (lanes C and D) oligonucleotides as described above. The cells were biotinylated from the apical (lanes A and C) or basolateral sides (lanes B and D) and consecutively extracted in Triton X-114 at 4°C and with Triton X-100 at 37°C. The Triton X-114 detergent phase and the Triton X-100 supernatant were pooled and affinity purified with streptavidin–agarose. The eluates or the affinity purification step were then analyzed by immunoblot with antibodies against either sucrase isomaltase or alkaline phosphatase and a chemiluminescence detection system. The average OD measures obtained from unfiltered digitized images after subracting background from the average pixel value over the band of each lane were as follows (scale 0-255): (Sucrase A) 58; (B) 14; (C) 55; (D) 29; (Alk. Phosphatase, A) 74; (B) 1; (C) 30; (D) 16. Weighted OD measures (average pixel value × number of pixels) were as follows (in thousands): (Sucrase, A) 141; (B) 10; (C) 169; (D) 35; (Alk. Phosphatase, A) 45; (B) 0.6; (C) 36; (D) 5.
Incubations of confluent monolayers in A19 for a few days did not show any effect on the CK19 content in immunoblot experiments. The reasons for these early failures are most likely to be found in the long turn-over time of cytokeratins (Denk et al., 1987). In brief, it was critical that the cultures had to be continuously kept (for at least two passages) in the presence of A19 at concentrations >1 μM to reduce CK19. We maintained small stocks of cells under continuous treatment to minimize the consumption of oligonucleotides. To keep the cellular mass continuously increasing, these stocks were never allowed to reach confluency. The uptake of oligonucleotides was assessed by in-situ hybridization with the biotinylated sense synthetic oligonucleotide. Two human cell lines, CACO-2 (colon carcinoma cells that differentiate and polarize 7–14 d after reaching confluency; Pinto et al., 1983) and MCF-10A (nontumorigenic mammary epithelium; Soule et al., 1990; Tait et al., 1990) treated as described above with A19, displayed a clear signal in intracellular vesicles, presumably the endosomal compartment, and in the cytoplasm (Fig. 2, b and d) as compared with controls grown in the random oligonucleotide (Fig. 2, a and c). The uptake of A19 was higher in subconfluent cells than in confluent monolayers. Likewise, the uptake of random oligonucleotide was controlled by in situ hybridization with a biotinylated complementary probe (Fig. 2, e and f). These results are in agreement with observations in other cells in culture (Loke et al., 1989; Noonberg et al., 1993) and demonstrated that CACO-2 and MCF-10 cells do uptake 21-mer phosphorothioate oligonucleotides, a phenomeonon that seems to be dependent on the cell type (Crooke et al., 1995).
The effect on the steady-state content of CK19 was determined by immunofluorescence, immunoperoxidase, and immunoblot. The overall proportion of success of antisense treatment was better observed by regular immunofluorescence. In control CACO-2 monolayers (incubated in random oligonucleotide, Fig. 2 i) the vast majority of the cells displayed a network of fluorescent filaments in a focal plane above the nucleus. The images in nontreated cells were identical (not shown). Treatment with A19, on the other hand, resulted in 20–30% of the cells totally negative for CK19. An additional 30–40% of the cells displayed a signal level clearly lower than in controls, but the remaining proportion of cells (30–40%) showed a level of CK19 comparable with the controls (Fig. 2 j). If the cells were kept in A19 for periods of confluency >9 d, this effect slowly vanished. The same was true if the cells were transferred back to media containing random oligonucleotide or no oligonucleotide at all (not shown), thus indicating that this downregulation was fully reversible. CACO-2 cells continuously incubated in A19 showed a decrease in the CK19 signal, but we could not detect loss of polarity of the remaining CK19 (Fig. 2 h). Monolayers of CACO-2 cells observed by laser confocal microscopy in the apicalbasal axis displayed the typical apical distribution of CK19 (Fig. 2, g and h, black arrowheads; white arrowheads point at the basal domain). Other cytokeratins (8 and 18; Moll et al., 1982) localized to both apical and basal submembrane cytoplasm in MCF-10A cells (not shown).
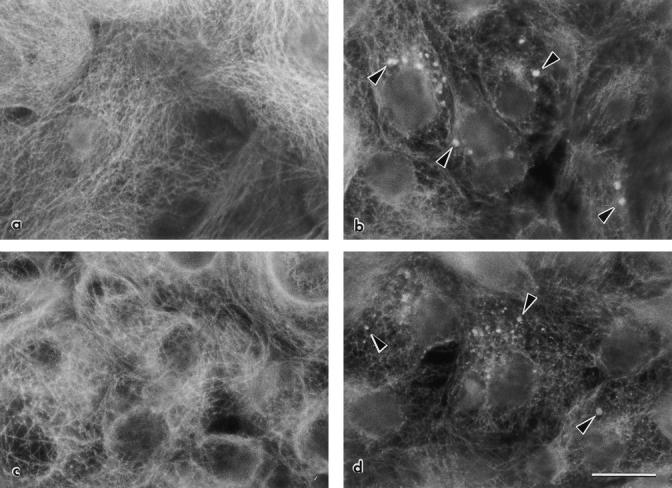
Because the fluorescence label was dim in MCF-10A cells, we repeated these experiments using immunoperoxidase at the EM level. Control monolayers incubated in random oligonucleotide showed bundles of CK19 filaments in the apical cytoplasm (Fig. 3 a, arrowheads), at variable distances from the apical membrane. The minimum distance from these filaments to the apical membrane was ∼50 nm and the maximum up to 3 μm (sections from 22 cells). In a few cases, some filaments were observed around and below the nucleus but never close to the basal membrane. These filaments were never observed inside microvilli. In some cases, CK19 positive filaments were viewed along the lateral membrane (Fig. 3 b, arrowheads) in close vicinity to the desmosomes. The majority of the sections of the lateral domain, though, were negative for CK19. The basal cytoplasm on the other hand was always negative (Fig. 3 d). Monolayers incubated in A19 displayed nearly 50% of the apical cytoplasm sections without or with very few filaments (Fig. 3 c). In these cases, the filaments observed were found farther away from the apical membrane, with a minimum recorded distance of 320 nm (sections from 18 cells), and more scattered throughout the cytoplasm (Fig. 3, c and e).
Figure 3.

Immunoelectron microscopy localization of CK19 in MCF-10A cells. The cells were continuously grown in either random (a, b, and d) or A19 (c and e) oligonucleotides on Transwell™ filters, fixed, and processed for indirect immunoperoxidase with anti-CK19 mAb (K4.62). (a and c) Apical cytoplasm; (d and e) basal cytoplasm; (b) lateral domain. The black arrowheads point at peroxidase positive intermediate filaments. (D) White arrowheads show desmosomes; Nu, nucleus; *, microvillus. Bar: (a and c–e) 0.52 μm; (b) 0.35 μm.
The effect of the antisense oligonucleotides was also determined by immunoblot. SDS extracts of cytoskeletal pellets from CACO-2 cells incubated in A19 showed a clear decrease in CK19 (Fig. 4, lane B, 37% of the signal in the band in lane A) as compared with controls kept in random oligonucleotide (Fig. 4, lane A). A similar effect was observed with A19/2 (Fig. 4, lanes K and L). When the same nitrocellulose sheet was stripped and reprobed with a mAb against other cytokeratins or a mAb against all actin isoforms, no differences were observed (Fig. 4, lanes C–F, M, and N), indicating that the effects of A19 and A19/2 were specific for CK19. Likewise, MCF-10A cells continuously grown in A19 displayed decreased levels of CK19 (Fig. 4, lane H) as compared with the controls in random oligonucleotide (Fig. 4, lane G), and a comparable effect of A19/2 (Fig. 4, O and P). Reprobing the same nitrocellulose sheet with the anti-pan cytokeratin mAb showed, again, no effect on other cytoskeletal proteins (Fig. 4, lanes I, J, Q, and R). These results were quantitatively determined by analysis of the digitized images from chemiluminescence detection (Fig. 4, legend). It must be pointed out that three to four bands were detected by RCK108 mAb in MCF10A cells, with apparent molecular weights ranging from 44 to 53 kD, in some preparations. Interestingly, the same pattern of bands was displayed by K4.62 mAb in some preparations from MDCK cells. Our polyclonal Ab consistently displayed affinity for the 53-kD band. We have no explanation for these multiple bands, although we speculate that different states of phosphorylation may be responsible for this type of pattern. On the other hand, it has been shown that mammary epithelia display a complex pattern of cytokeratins, including at least one that is induced by extracellular matrix (Hall and Bissell, 1986). Therefore, it is also possible that RCK108 may be recognizing an epitope in other cytokeratins from MCF-10A that are not present in CACO-2 cells. If that was the case, these other cytokeratins may also share a common 5′ sequence in the reading frame of their respective mRNAs, since they were also downregulated by A19.
Figure 4.

Immunoblot of cytoskeletal components in cells continuously kept in random (A, C, E, G, and I), A19 (B, D, F, H, and J), random/2 (K, M, O, and Q), or A19/2 (L, N, P, and R) oligonucleotides. CACO-2 (A–F and K–N) and MCF-10A (G–J and O–R) cells were grown on 24-mm Transwell™ filters and extracted/scrapped from the filter in EB-TX- 100. The pellets were further extracted in SDS sample buffer, and samples from equivalent numbers of cells were run in SDS-PAGE ( the protein in each sample was measured in a small aliquot and the sample volume adjusted to seed 4 μg of protein in all lanes; usually these adjustments represented variations in sample volumes that were <10% of the total volume) and immunoblotted onto nitrocellulose filters. The blots were processed for indirect chemiluminescence using an anti-CK19 mAb (RCK108; A, B, G, and H). The same nitrocellulose sheets used for A, B, G, H, K, L, O, and P were then stripped in SDS/2-mercaptoethanol and reprobed with antiPancytokeratin mAb (AE1/AE3; C, D, I–J, M, N, and O–R). The same filter from CACO-2 extract was stripped and reprobed one more time with anti-actin mAb (C4; E and F). Notice the decrease in CK19 bands in A19 treated cells (B and H) as compared with the control with random oligonucleotide (A and G), and that other cytokeratins and actin in the same samples were not changed (C–F, I, and J). The average OD measures obtained from unfiltered digitized images after subtracting background from the average pixel value over the main band of each lane were as follows (scale 0–255): (A) 82; (B) 12; (C) 77; (D) 100; (E) 91; (F) 81; (G) 30; (H) 6; (I) 28; (J) 21; (K) 150; (L) 27; (M) 171; (N) 172; (O) 49, (P) 5; (Q) 160; (R) 174. The apparent molecular weight of standards is expressed in kD.
Effect of Cytokeratin 19 Antisense Oligonucleotide on Microvilli and the Apical F-actin Cytoskeleton
An intriguing observation in the immunoperoxidase experiments was the decrease in the number of microvilli in those cells with reduced levels of CK19 filaments (Fig. 3, c versus a, *). To further explore this phenomenon, MCF10A (Fig. 5, a and b) and CACO-2 cells (Fig. 5, c and d) continuously grown in random or A19 oligonucleotides were observed by scanning electron microscopy. Control MCF-10A cells displayed a relatively modest amount of short apical microvilli (Fig. 5 a), which was significantly decreased in nearly 30% of the cells in monolayers treated with A19 (Fig. 5 b). Control CACO-2 cells at 9 d of confluency showed a fully developed apical domain with abundant long microvilli (Fig. 5 c). In treated cultures, 30–40% of cells were totally depleted in microvilli (Fig. 5 d) and a similar proportion of cells had a decreased number of microvilli, as compared with the control.
Figure 5.

Scanning electron microscopy of the apical surface of MCF-10A (a and b) and CACO-2 (c and d) cells continuously grown in random (a and c) or A19 (b and d) oligonucleotides. Specimens were tilted 60° for photography. Bar, 1 μm.
Because the microvillus core contains F-actin, these results prompted us to study the distribution of F-actin in oligonucleotide-treated cells. Confocal optical sections of FITC–phalloidin stained cells at the apical level, under control oligonucleotides, displayed a typical punctate pattern in all cells (Fig. 6 a). In this case, occasional “black” or darker apical domains always corresponded to taller or smaller cells that became fully positive by adjusting the focal plane. In A19 treated monolayers on the other hand, 50– 70% of the cells displayed negative or low signal on the apical domains, contrasting with the still positive fluorescent rings at the cell–cell contacts. As an internal positive control, one cell that escaped the effect of A19 is shown on the upper right corner of Fig. 6 b. These positive cells were used as landmarks to determine the appropriate location of the otherwise negative apical surfaces in the z axis. Neither the submembrane F-actin under the lateral domains (not shown in x–y sections) nor the basal network of stress fibers (Fig. 6, c and d) showed any noticeable changes under the A19 treatment. Three-dimensional reconstructions in the x–z plane (perpendicular to the plane of the monolayer) showed a summary of the effect of CK19 antisense oligonucleotide: only apical F-actin was affected (compare Fig. 6 f, black arrowheads with control; e, white arrowheads point at the basal side). It must be noted that the total cellular levels of actin did not change in A19 treated cells (Fig. 4, lanes E and F), suggesting that the differences were in the polymerization and organization, not in the expression of actin. The correlation between the decrease in the number of microvilli and the effect of A19 was further analyzed by colocalization of villin and CK19 in A19 treated monolayers. In this experiment we analyzed the appearence of the typical apical image of fluorescence for villin in cells with or without CK19. For counting purposes, cells with reduced amounts of CK19 but still showing a CK19 IF network were ranked as positive for CK19. Only one of every seven cells negative to CK19 (CK19−) showed villin signal (Table II). On the other hand, 41% of the cells positive to CK19 ( CK19+) were also positive for villin (Table II). This experiment, in general, showed a good correlation between the loss of CK19 IF and the absence of microvilli. We cannot explain the 33% of the cells that do express CK19 and still lack microvilli, although it may be speculated that these cells may be delayed in their differentiation process.
Figure 6.
Effect of antisense A19 oligonucleotide on the apical distribution of apical F-actin in CACO-2 cells. The cells were continuously grown in random (a, c, and e; control) or antisense A19 (b, d, and f) oligonucleotides. For this experiment, the cells were plated on glass coverslips and fixed in PFA after 9 d of confluency. The monolayers were detergent permeabilized and processed with FITC–phalloidin. The monolayers were observed under a laser confocal microscope. Confocal optical sections immediately underneath the apical membrane (a and b) or immediately above the basal membrane (c and d) were chosen from the stack of sections in the z axis. The sections in a and c correspond to the same field at different focal planes, and the same applies to the sections in b and d. In each field, a three-dimensional reconstruction section perpendicular to the plane of the monolayer is shown in e and f. Black arrowheads point at F-actin negative apical regions in A19 treated cells. Bars, 10 μm.
Table II.
Apical Expression of Villin in CACO-2 Cells Treated with A19 Oligonucleotide
| Cells with microvillum images of villin | Cells without apical image of villin | |||
|---|---|---|---|---|
| % | % | |||
| CK19+ | 23 | 33 | ||
| CK19− | 6 | 38 |
CACO-2 cells treated with A19 oligonucleotide as described before were sequentially processed for double immunofluorescence with anti-villin mAb and biotinylated antiCK19 mAb (RCK108; see Materials and Methods). CK19+ refers to cells with CK19. Cells with lower amounts of CK19 but still showing IF were counted in this category. CK19− cells were those with no detectable CK19.
Effect of Cytokeratin 19 Antisense Oligonucleotide on the Organization of Apical Microtubules
We next examined whether cytokeratin 19 antisense oligonucleotides were able to induce changes in the distribution of microtubules. Indirect immunofluorescence against tubulin in MCF-10A cells permeabilized with saponin before fixation showed a conspicuous pattern of microtubules many of which were in an apical–basal orientation, as observed by confocal microscopy (not shown). In general, this pattern resembles that previously described by Bacallao et al. (1989) in MDCK cells. Cells continuously grown in A19 (Fig. 7 b) or in A19/2 (Fig. 7 d) oligonucleotides showed thick tubulin clusters, not observed in the cells continuosly incubated in the corresponding randomized oligonucleotides (Fig. 7, a and c). This phenomenon was observed in 21 to 38% of the cells.
Figure 7.
Effect of antisense A19 oligonucleotides on the distribution of tubulin in MCF-10A cells. The cells were continuously grown in random (a; control), random/2 (c; control), antisense A19 (b), or A19/2 (d) oligonucleotides. For this experiment, the cells were plated on laminin-coated glass coverslips and fixed in 3% PFA, 0.1% glutaraldehyde after 5 d of confluency. The cells were permeabilized, fixed, and processed for indirect immunofluorescence with anti-tubulin polyclonal antibody and observed under a standard epifluorescence microscope. Black arrowheads in b and d point to abnormal spheric clusters of tubulin. Bar, 10 μm.
The distribution of microtubules was slightly different in CACO-2 cells. These cells usually display a longer apical– basal axis than the MCF-10A cells. Because the nucleus is located near the basal region, they show a thicker apical cytoplasm. To demarcate regions within the apical cytoplasm we colocalized ZO-1, a tight-junction marker (Stevenson et al., 1986) together with tubulin. Confocal optical sections were collected in the green channel for ZO-1 (Fig. 8, insets) and in the red channel for tubulin (Texas red; right hand side of each pair in Fig. 8, a–d). As in Fig. 7, the cells were briefly permeabilized before fixation to remove the signal from nonpolymerized tubulin. In control monolayers (treated with random oligonucleotide), microtubules were practically excluded from the apical-most region of the cytoplasm, and a thick (3–4 μm) network of microtubules was observed (Fig. 8 a). This network extended from the level of the tight junctions to the cytoplasm immediately above the nucleus. At the nuclear level, the microtubules were mostly oriented in the apical–basal axis. It must be noted that these apical–basal microbutules appear in confocal sections as small dots, giving an impression of poor preservation. Standard epifluorescence of these preparations showed images comparable with those in Fig. 7. Finally, the basal cytoplasm showed another network of microtubules, thinner than the apical one (Fig. 8 c). These results are coincidental with the observations of Gilbert et al. (1991) in these cells. The downregulation of CK19 with A19 had a striking effect on the apical microtubules. Microtubules were, again, mostly excluded from the apical-most cytoplasm as in the controls, but the apical network showed images of thick spherically shaped (caliper diameters 0.3– 1.2 μm) clusters of tubulin (Fig. 8 b, arrowheads). These images were not continuous in deeper sections, indicating that they were not thick bundles perpendicular to the plane of the monolayer. Some of these structures were also observed at the nuclear level, intercalated with normal microtubules. In the basal cytoplasm, the fine basal network of microtubules was indistinguishable from the control images (Fig. 8 d).
Figure 8.
Effect of antisense A19 oligonucleotide on the apical distribution of apical tubulin in CACO-2 cells. The cells were continuously grown in random (a and c; control) or antisense A19 (b and d) oligonucleotides on glass coverslips for 9 d, saponin permeabilized, and fixed. The tight junction component ZO-1 (insets) and tubulin were localized by indirect immunofluorescence using specific second antibodies coupled to fluorescein and Texas red, respectively. Laser confocal optical sections were taken simultaneously in the green (ZO-1; insets) and red at two different levels: through the apical cytoplasm at the deep side of the ZO-1 signal (a, b) and ∼1 μm above the basal membrane (c, d). The pairs a–c and b–d correspond respectively to the same fields at different focal planes. Arrowheads point at tubulin clusters. Bars, 10 μm (equivalent to 30.4 μm for the insets).
Effect of Downregulation of Cytokeratin 19 with Antisense on the Polarity of Plasma Membrane Proteins
The effects that the decrease of CK19 filaments had on the apical but not on the basal cytoskeleton suggested the need for a comprehensive analysis of the polarity of plasma membrane proteins. We first decided to assay groups of abundant proteins in each domain of the plasma membrane. The approach consisted of biotinylation of apical or basolateral proteins of CACO-2 C2BBe1 cell monolayers grown on Transwell™ filters with the membrane-impermeant biotin derivative sulfo-NHS–biotin in a standard fashion (Rodriguez-Boulan et al., 1989). We used this clone of CACO-2 cells because it has been characterized as better polarized than its parental cell line (Peterson and Mooseker, 1992) and also to ensure the homogeneity of the cell monolayer. Antisense treatment of C2BBe clone cells resulted in cytoskeletal disorganization identical to the results described in the previous sections for the parental CACO-2 cells. No significant effect of antisense treatment was observed on the TER (364 ± 192 ohm × cm2 in random vs. 394 ± 220 ohm × cm2 in A19), which were similar or even larger than the values reported for CACO-2 cells (Pinto et al., 1983), indicating that tight junctions were intact, a result also confirmed by ZO-1 staining (Fig. 8).
The cells were extracted at 0°C in Triton X-114, and the proteins were acetone precipitated from the 30°C detergent phase of the supernatant (Fig. 9, lanes I–L). These bands generally correspond to integral membrane proteins (Bordier, 1981). The pellets from the previous extraction were further extracted in Triton X-100 at 37°C. The proteins insoluble at 0–4°C but solubilized at a higher temperature typically correspond to (although perhaps are not exclusively) GPI-anchored membrane proteins (Brown and Rose, 1992; Fig. 9, lanes E–H). The results with this type of extraction were very similar to those obtained extracting the monolayers with 60 mM n-octyl-β-d-glycoside at 4°C after a Triton X-100 extraction at 0°C, another procedure to selectively extract GPI-anchored proteins (Hooper and Turner, 1988; Brown and Rose, 1992; and results not shown). Finally, the remaining membrane proteins in the pellet after both extractions are more likely to be truly associated with the submembrane cytoskeleton (Salas et al., 1988; Fig. 9, lanes A–D). Among the latter, the polarization was variable in control cells: at least five bands were distributed to both apical and basolateral domains, seven bands appeared mostly on the apical side, and 15–17 bands on the basolateral (Fig. 9, lanes A and B). A19 treated cells showed no detectable variations in the basolateral cytoskeletally associated membrane proteins (Fig. 9 D). The apical domain, on the other hand, displayed only three bands with levels of expression similar to the control (220, 194, and 72 kD). Two bands showed decreased levels (118 and 60 kD), while the rest were almost undetectable (Fig. 9 C). Coincidentally, the bands that were no longer expressed on the apical domain of A19 treated cells are in the same molecular weight range (40–86 kD) as those apical membrane proteins attached to CK19 multiprotein complexes in MDCK cells (Rodriguez et al., 1994). The bands extracted by Triton X-100 at 37°C after a previous extraction at 0°C showed a completely different pattern. As expected for GPI-anchored proteins (Lisanti et al., 1988), a vast majority of them localized to the apical domain in control cells (Fig. 9 E). In antisense treated cells, conversely, a number of bands appeared in the basolateral membrane (Fig. 9 H). Finally, the proteins extracted and purified in the detergent phase of Triton X-114 (integral membrane proteins; Bordier, 1981) showed a more complex pattern, with a number of bands polarized in either the apical or basolateral domains and at least four bands with the same molecular weights, presumably the same nonpolarized proteins, in both domains in control cells (Fig. 9, lanes I and J). Cells continuously grown in the presence of A19, however, showed five of the apical proteins redistributed to basolateral set (Fig. 9, marked by thin arrows between lanes K and L). Some proteins that remained nearly unchanged by the treatment with A19 have been marked with *. These examples, present in all lanes, rule out the possibility of variations in the efficiency of biotinylation.
Figure 9.

Effect of antisense A19 oligonucleotide on the polarity of plasma membrane proteins in CACO-2 cells C2BBe1. The cells were continuously grown in random (lanes A, B, E, F, I, and J; control) or antisense A19 (lanes C, D, G, H, K, and L) oligonucleotides. For these experiments, the cells were plated on 24-mm TranswellTM filters and cultured at confluency for 9 d. The monolayers were biotinylated from either the apical side (lanes A, C, E, G, I, K; Ap) or from the basolateral side (lanes B, D, F, H, J, L; Bl). Then, the filters were extracted in ice-cold PBS-EDTA supplemented with 2% Triton X-114. The supernatant of this extraction was warmed to 30°C for 3 min, and the detergent phase was acetone precipitated and run in SDS-PAGE (lanes I–L; TX-114). The pellets from the TX-114 extraction were then resuspended in PBS-EDTA, 1% Triton X-100 by sonication, and warmed up to 37°C for 15 min. The supernatants (lanes E–H; TX-100) and pellets (lanes A–D; Pellet) of this second extraction were also run in SDS-PAGE. In all cases the total amount of protein was measured to ensure that all lanes for a given extraction procedure were seeded with the same amounts of cellular material. All the lanes were blotted onto nitrocellulose sheets and probed with streptavidin–peroxidase and a chemiluminescence reaction. The small arrows between K and L point at apical bands now appearing also in the basolateral labeled set of proteins. The arrowheads indicate the position of molecular weight standards: (lanes A–D) 193, 112, 86, 70, 57, and 36 kD; (lanes E–L) 205, 116, 66, 45, and 29 kD. All the blots are from the same experiment, although, for technical reasons, they were run in separate gels with two different sets of molecular weight standards. Biotinylation control: CACO-2 C2BBe monolayers were grown on filters, incubated in A19, and biotinylated as described above. The cells were extensively washed, fixed in PFA, and processed with fluorescein-coupled streptavidin from both sides of the filter. Optical confocal sections were taken at the transnuclear plane (a) or at the apical membrane plane (b). Bars, 10 μm.
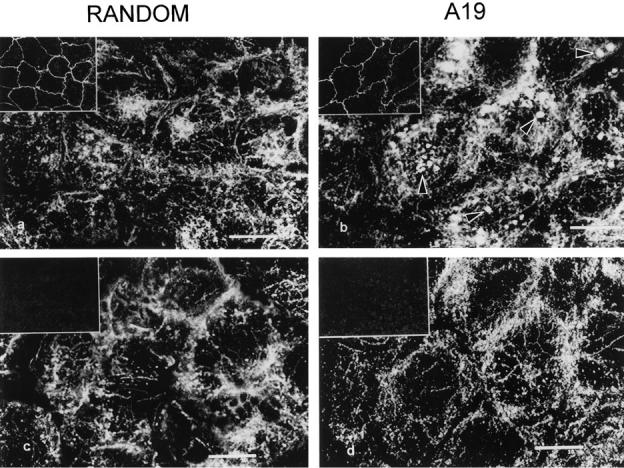
Despite the stability in TER, the possibility arose that the previous result might be explained by local disruption of the tight junctions, enabling the basolateral sulfo-NHS–biotin to permeate to the apical domain in A19 treated cells, thus biotinylating well polarized apical membrane proteins. Although it is known that normal tight junctions may enable the passage of molecules of the size of sulfo-NHS-biotin (Moreno and Diamond, 1975), two reasons make this possibility unlikely. (a) Biotinylations were always performed in the presence of DMEM with serum on the opposite chamber. The amino acids and proteins in the medium were in a large molar excess with respect to the biotinylating agent, thus quenching any sulfo-NHS-biotin that may permeate to the opposite side through the tight junctions. (b) If indeed such a permeation was significant, it should have been apparent for basolateral proteins as well. Basolateral proteins appeared polarized, even in A19 treated cells (Fig. 9, lanes D and L). To control the possibility of an increased leakage of biotin in A19 treated cells, we biotinylated CACO-2 C2BBe cells grown on filters in the presence of A19 from the basolateral side. The cells were fixed and processed with fluorescent streptavidin from both sides of the filter. Confocal optical sections at a level below the apical membrane showed basolateral biotinylation in these cells (Fig. 9 a). In the same fields, confocal images at the apical level showed no fluorescence, except for slight out of focus fluorescence from the lateral membrane (Fig. 9 b). This control confirms that the apical membrane proteins observed with basolateral biotinylations are, indeed, mispolarized in A19 treated cells. To further verify this result, CACO-2 C2BBe cells were grown in the presence of both antisense oligonucleotides and their corresponding randomized counterparts. Sucrase isomaltase, a well known transmembrane apical protein (Hauri et al., 1985) was localized with a monoclonal antibody. Direct observation of the antisense-treated monolayers with a standard epifluorescence microscope indicated the presence of lateral (“ring”) images in 29% of the cells. Using stacks of confocal sections, we obtained three-dimensional reconstructions of the monolayers viewed in their apical– basal axis. Control (random oligonucleotide) monolayers showed fluorescence only at the apical domain (Fig. 10, a and c). A number of cells in the antisense treated monolayers (Fig. 10 b; A19; Fig. 10 d; A19/2), on the other hand, showed basolateral localization of this apical enzyme. The same procedure was performed using A19 and random oligonucleotides but localizing Na+–K+ATPase. In those experiments, we could not detect any change in the basolateral localization of this marker (not shown). To assay the polarization of specific membrane proteins, cell monolayers grown on large polycarbonate filters were treated with A19 or random oligonucleotides and biotinylated from either the apical or basolateral side. The biotinylated proteins were extracted in nonionic detergents, affinity purified with streptavidin agarose, and immunoblotted with specific antibodies against sucrase isomaltase or alkaline phosphatase (an example of GPI-anchored polypeptides). In control monolayers (Fig. 11, lanes A and B), both proteins were highly polarized to the apical domain. An estimation of the total signal of the bands indicated apical/basolateral polarity ratios of 13 and 76, respectively (see Fig. 10 legend for average specific pixel values). In A19 treated cells, however, these values fell to 5. This decrease in polarization was mainly due to an increase in the basolateral signal rather than to a change in the values in the apical domain, which remained similar to those in control monolayers. The persistence of a moderate level of polarity in the entire monolayer under the effect of A19 is consistent with the results in Fig. 10 that indicate that only a fraction of the cells was depolarized. Altogether, these results show changes in the polarity of apical plasma membrane proteins. It must be pointed out, however, that some membrane proteins, especially integral membrane proteins and basolateral detergent-insoluble components remained highly polarized in cells depleted in CK19.
Figure 10.

Effect of antisense oligonucleotides on the polarity of sucrase isomaltase in CACO-2 cells. CACO- 2 C2BBe1 monolayers were grown and incubated with random (a), random/2 (c), A19 (b), or A19/2 (d) oligonucleotides as described before. The cells were fixed in 3% PFA and processed for indirect immunofluorescence with a mAb anti-sucrase isomaltase. The monolayers were analyzed under a confocal microscope, and three-dimensional reconstructions in a plane perpendicular to the monolayer were obtained from stacks of confocal optical sections. Bars, 10 μm.
Distribution of CK19 in Epithelial Cells In Vivo
The results shown in the previous sections suggest that CK19 intermediate filaments play a role in the organization of the apical domain in tissue culture cells. To weigh its potential biological importance, we localized CK19, using specific mAbs and a polyclonal Ab, in a variety of epithelial tissues in vivo, in addition to the three epithelial cell lines (MDCK, CACO-2, and MCF-10, derived from mesoderm, endoderm and ectoderm, respectively). Special attention was placed on the subcellular distribution of CK19 in tissues in vivo. Although immunoperoxidase has been commonly used for these types of studies, we preferred immunofluorescence, with the understanding that it may provide a more precise subcellular localization of the CK19 epitopes. Three major morphological patterns of localization were observed: (a) continuous apical submembrane localization, with or without extensions toward the lateral domain, as previously observed in tissue culture cells (Fig. 12, a and c, surface and glandular epithelia of human stomach). (b) Broad distribution of CK19 in the apical cytoplasm was observed, for example, in the adult rat small intestine (Fig. 12 e). In this case, the signal was always supranuclear but almost negative under the apical domain itself, in which the terminal web was in turn positive for the broad spectrum anti-cytokeratin antibody (AE1/AE3; not shown). In addition, it must be noted that the enterocytes at the base of the crypts were negative and that the expression of CK19 correlated with the pathway of differentiation, with an increasing expression level as the cells displaced toward the opening of the crypts and the tip of the villi. (c) Some epithelia were found to be negative to CK19. A summary of these observations (including two additional reports by other groups) is presented in Table III. These data indicate that CK19 is apically polarized in a variety of epithelia, although not universal.
Figure 12.

Distribution of CK19 in epithelial cells in vivo. Frozen sections of fresh, unfixed human stomach (a–d) and rat small intestine (e and f) were processed for indirect immunofluorescence with anti-CK19 mAb (A53-B/A2); (a and b) stomach, surface epithelium; (c and d) stomach, gland; (e and f) adult rat small intestine, epithelium of villi. Phase contrast images corresponding to a, c, and e, are shown in b, d, and f. Nu indicates the position of two nuclei taken as examples. Bars, 10 μm.
Discussion
Cytokeratin 19 Decreases After Continuous Culture in Antisense Oligonucleotide
Research tampering with cytokeratin expression has met with various degrees of success (for review see Singh and Gupta, 1994). In this study, antisense oligonucleotide reduction of CK19 levels was based on the combination of a higher oligonucleotide uptake in subconfluent cells with a continuous increase in cellular mass and, perhaps, an increase in turnover due to frequent cell dissociation. At the time the control cells had achieved polarization, some (∼30%) A19 treated cells had seemed to escape the effect of the antisense. Heterogeneity in the effect of antisense oligonucleotides has been reported in other cells as well (Noomberg et al., 1993). However, the proportion of cells with a decreased amount of cytokeratin 19 was high enough (∼70%) to observe the effects, using random oligonucleotide treated cells as a reference and control. We could not detect variations in the cellular levels of other cytokeratins or actin. Under these conditions, disorganization of apical microtubules and microfilaments and, to some extent, depolarization of the plasma membrane were observed in a proportion of cells compatible with the percent of cells displaying a significant decrease in CK19. In one case, we directly verified the correlation between depletion of CK19 and the effect of apical microvilli (Table II). Although these results highlight an important role of CK19 in CACO-2 and MCF-10A cells, the possibility exists that in other cells CK19 may be replaced by other cytokeratins. In fact, enterocytes in vivo showed CK19 located in the apical cytoplasm, but under the terminal web (Fig. 12 e). Polyvalent anti-cytokeratin antibodies showed, in these cells, a clear label in the terminal web (identical to the images shown by Franke et al., 1979) contrasting with a broader localization of CK19 (not shown). Given the diversity of cytokeratins, it is therefore likely that CK19 may play its role in certain cell types during certain stages of differentiation, being replaced by other cytokeratin(s) in other cases. This may provide a possible explanation for why some epithelial tissues in vivo are negative for CK19. Furthermore, a substantial difference between tissue culture epithelia and their counterparts in vivo is the fact that the former undergo a continuous cycle of depolarization and repolarization as they are dissociated on a weekly basis. Epithelia in vivo, on the other hand, normally acquire their polarity at some point during development and then remain polarized even during mitosis (Reinsch and Karsenti, 1994). It is also possible, therefore, that CK19 may be necessary during the acquisition of polarity but dispensable later. In this regard, the example of hepatocytes, in which CK19 disappears shortly after the formation of the apical domain in the embryo (Stosiek et al., 1990), is suggestive. In addition, Quaroni et al. (1990) have shown that CK19, together with cytokeratin 8, are the earliest cytokeratins to appear in rat intestine development. CK19 mRNA is confined to the crypts, where initial differentiation, and possibly early polarization steps, occur in the adult. Cytokeratin 21, the rat equivalent to human cytokeratin 20, on the other hand, is expressed only in the more differentiated cells on the villi (Calnek and Quaroni, 1993). During embryo development, the appearance of cytokeratin 21 is coincidental with the development of a fully differentiated brush border (Calnek and Quaroni, 1992), thus suggesting the possibility that it may be taking over roles that CK19 plays at earlier stages. Further investigations are required to clarify the relative roles of CK19 and other cytokeratins in the development of apical polarity.
The distribution of CK19 intermediate filaments bridging between desmosomes under the apical membrane is clearly advantageous for a role as a general organizer of the apical domain. However, it poses yet another problem: how do these IFs become organized in this fashion? Little is known about organizers for IFs (Eckert et al., 1982), if they exist at all. However, it has been proposed that desmosomes may be IF organizers (Bologna et al., 1986). If the organization was, indeed, localized to the cell–cell contacts, CK19 filaments would have the potential to convey the topographical information from cell–cell contacts into the position of the apical domain. Bader and Franke (1990) found that human CK19 overexpressed in transgenic mice is not polarized at all, suggesting the possibility that the endogenous organization sites are required and perhaps saturated by the endogenous CK19 in the transgenic model. Finally, rather than being a static structure, CK19 IF have been shown to respond to changes in cAMP, a condition that modulates exocytosis (Brignoni et al., 1995), with changes in phosphorylation and distribution (Baricault et al., 1994).
A Role for Cytokeratin 19 in the Organization of Apical Microfilaments and Microtubules
There is an extensive body of evidence showing the role of villin in the formation of microvillus cores. Transfection with villin of cells that do not express it naturally, induces the formation of microvilli (Friederich et al., 1993). Suppression of villin expression by antisense mRNA, conversely, impairs the formation of microvilli (Takeuchi et al., 1994; Costa de Beauregard et al., 1995). During embryo development, villin is initially nonpolarized within the cytoplasm of enterocytes but becomes recruited to the apical side as soon as the formation of the first microvilli begins (Shibayama et al., 1987; for a review see Louvard et al., 1992). Similar kinetics of assembly were observed in vitro using CACO-2 C2BBe cells (Peterson et al., 1993). On the other hand, cells of the enterocyte lineage that cannot form brush border display a cytosolic distribution of villin (Kerneis et al., 1996). We can envision two possible ways by which actin and villin, two proteins that are distributed throughout the cytoplasm, can be recruited to the apical domain: (a) the newly formed microvillus cores bind to the cytoplasmic domain of an already polarized apical membrane protein. It is known that the 110-kD protein that connects the cores to the membrane appears much later than the microvilli themselves during development (Shibayama et al., 1987). However, other proteins, such as members of the band 4.1 superfamily (Arpin et al., 1994a ) may be playing that role at early stages of development. In this case, one would predict that the machinery for transport and docking apically bound carrier vesicles must be fully operational before the microvilli develop to allow the polarization of membrane proteins responsible for the recruitment of microvillar cores. (b) The second possibility, that by no means excludes the first one, is that another component of the cytoskeleton, different from actin, assembles in the apical submembrane cytoplasm and provides an anchorage for binding or nucleation sites for actin/villin complexes. The IFs extending from the lateral domain and attaching to apical membrane proteins (Rodriguez et al., 1994) seem to be a candidate to fulfill that role. By modulating the expression of CK19 we have been able to decrease the number of microvilli. Therefore, we speculate that this function of a terminal web-like apical cytoskeleton may be important in tissue culture cells that need to reestablish their apical polarity on a weekly basis. Such a scenario may be equivalent to early stages of embryonic development. On the other hand, we must emphasize that 13% of the cells depleted in CK19 were still capable of developing microvilli, as indicated by villin immunofluorescence (Table II), indicating that alternative mechanisms of recruitment, such as that hypothesized in (a), may be also operational.
It has been shown that the pharmacological disruption of IFs does not result in a rearrangement of microtubules (Eckert, 1985; Kartha et al., 1992; Baricault et al., 1994). Anti-microtubular drugs, conversely, often cause extensive changes in the distribution of IFs (Knapp et al., 1983; Owaribe et al., 1986). Therefore, it was surprising that a downregulation of CK19 filaments resulted in abnormal images of the apical tubulin. Our interpretation of the images in Figs. 7 and 8 is that, in both cell lines, the microtubules had become loose in the apical cytoplasm rather than depolymerized. More importantly, the microtubules on the lateral or basal aspects of the cytoplasm showed normal images. Although antibodies against γ-tubulin were unavailable to us, we speculate that centrioles or microtubule organizing centers (Archer and Solomon, 1994) normally apical (Buendia et al., 1990; Rizzolo and Joshi, 1993) may have unfastened from the structure anchoring them to the apical domain in A19 treated cells. It is interesting to note that it has been known for some time that microtubules do not reach the apical membrane itself, but end below the level of the terminal web and the rootlets of microvilli (for review see Fath et al., 1993). These observations have been confirmed by confocal microscopy in this study as well and suggest that microtubule organizing centers must be located ∼1 μm below the apical membrane in CACO-2 cells, precisely in the region of the apical cytoplasm where CK19 intermediate filaments are found.
Disruption of Plasma Membrane Polarity: Consequence of a Multi-factor Disarrangement of the Cytoskeleton?
The biotinylation assay of polarity used in this work has drawbacks and advantages. We cannot discriminate if two bands with the same molecular weight appearing on different domains correspond to the same depolarized protein or to two different polarized polypeptides with the same electrophoretic mobility. Therefore, we cannot rule out that “redistributed” proteins may be actually newly expressed proteins with a molecular weight similar to a preexisting band in the opposite domain. This possibility, however, seems very unlikely. The advantage, on the other hand, is that a fair number of abundant proteins can be analyzed. Although some proteins are known to escape biotin labelling, this approach seems to yield a more statistical view of membrane polarity than the study of single proteins with specific antibodies.
The effects of a down-regulation of CK19 on the polarized distribution of plasma membrane proteins could be separated in two categories: (a) Proteins that remain insoluble after two consecutive detergent extractions (attached to the cytoskeleton). In this case we were able to detect the disappearance of a subset of apical components, without redistribution to the basal domain (Fig. 9, lanes A–D). Our preliminary interpretation is that retention may be critical for these proteins to stay in the apical membrane and that a reduction in the number of available attachment sites may result in their internalization or degradation. It must be pointed out that the available data indicate that the attachment of this subset of apical proteins to the apical intermediate filaments must be indirect. In other words, that intermediary proteins must exist between CK19 filaments and the plasma membrane (Rodriguez et al., 1994). The identity and function of this subset of apical proteins is currently unknown. One possibility is that they simply serve to fasten intermediate filaments to the apical plasma membrane. Besides, as apical microfilaments were disorganized, some of these proteins may also be anchored to actin. However, some of these proteins may also serve other functions. (b) Other membrane proteins, both soluble in the detergent phase of Triton X-114 and in a second step in Triton X-100 at 20°C (generally representing transmembrane and GPI-anchored proteins, respectively). These two groups of plasma membrane components seem to be partially depolarized in CK19 depleted cells (Fig. 9, lanes E–L). In other words, the data are compatible with a model in which the apical carrier vesicles are, to some extent, randomly delivered to both domains in A19-treated cells. A growing body of evidence suggests that such vesicles are transported by means of tubulin and actin based motors (Fath et al., 1993; Lafont et al., 1994; Hasson and Mooseker, 1995). The participation of the latter seems to be strongly suggested by the depolarization of apical proteins in cells depleted in villin (Costa de Beauregard et al., 1995). Therefore, given the disorganization of apical microfilaments and microtubules in CK19 depleted cells reported in this study, it is difficult to assign specific responsibilities for the depolarization of apical membrane proteins. In fact, it is likely to result from multiple causes. It seems worthy to note that A19 treatment did not result in a disruption of tight junctions, as noted by the integrity of ZO-1 signal (Fig. 8, c and g) and the stability of transmonolayer electrical resistances similar to control levels. In fact, basolateral proteins and some apical proteins remained fully polarized (Fig. 9, lanes E–L). This result fits the notion that apical polarity may result from multiple mechanisms, either working in parallel or compensating each other. For example, different apical proteins can reach their destination after two different pathways, with or without an intermediate step in the basolateral domain (Le Bivic et al., 1990; Matter et al., 1990). Likewise, remedial mechanisms retrieving mispolarized proteins by transcytosis (for review see Mostov, 1995) may be more effective for a subset of apical components. It is conceivable that some of these alternative pathways may remain undisturbed by the decrease in CK19 filaments. The results from the biotinylation assay were further confirmed by the localization of specific proteins. Na+–K+ATPase remained basolateral in A19 treated cells, while sucrase isomaltase and alkaline phosphatase appeared depolarized in a fraction of CACO-2 C2BBE cells treated with antisense oligonucleotides (Figs. 10 and 11). This phenomenon also correlated with the proportion of cells in which the effect of antisense oligonucleotides was complete. These results are also compatible with a model in which the acquisition of apical polarity is conceived as a multistep process. Tampering with the expression of CK19 may halt or delay later steps of the differentiation process. This type of interpretation fits in the result showing a significant number of cells with CK19 but still lacking microvilli (Table II).
Finally, intermediate filaments are known to participate in the generation of cell polarity in other systems as well. They may be partially responsible for the asymmetry of Xenopus oocytes and embryos (Klymkowsky et al., 1987), where they even participate in the asymmetric retention of maternal mRNAs (Forristall et al., 1995). Completing the homology with polarized epithelial cells, it has been also reported that γ-tubulin appears polarized to the vegetal pole, next to the submembrane intermediate filament network of stage VI Xenopus oocytes. These γ-tubulin foci are very likely microtubule organizing centers (Gard, 1994).
In summary, the results in this study point to an as yet unsuspected structural role of IFs in the organization of the apical domain and its associated membrane cytoskeleton, which may be common to epithelial cells with or without brush border. The molecular mechanisms involved are still unknown. The molecular relationships between CK19, apical microfilaments, microtubules, or apical plasma membrane may be highly indirect but nonetheless important. These data also suggest the need of further investigation to weigh the relative roles of different components of the cytoskeleton and membrane proteins during the acquisition of apical polarity.
Footnotes
1. Abbreviations used in this paper: CK, cytokeratin; F-actin, filamentous actin; IF, intermediate filament; TER, trans-epithelial electrical resistance.
The authors are indebted to Dr. W. James Nelson (Stanford University School of Medicine, Stanford, CA) for generously providing us with antiNa+–K+ATPase and anti-fodrin antibodies. We are also grateful to Dr. Rudolf Werner and Ms. Debbie Bradley, DNA Core Laboratory, Department of Biochemistry and Molecular Biology, for their assistance with the synthesis and purification of phosphorothioate and biotinylated deoxy oligonucleotides, to Dr. John N. Barret (Department of Physiology and Biophysics) for his advise in confocal microscopy, and to Dr. Kermit L. Carraway (University of Mami School of Medicine, Miami, FL) for critically reading the manuscript. It is a pleasure to thank Ms. JoAnne Anderson and Ms. Susan Decker for their proficient technical aid.
This paper is supported by grants 93GIA-949 from American Heart Association, Florida Affiliate, and K4HL03397A from National Institutes of Health.
Please address all correspondence to Pedro Salas, Department of Cell Biology and Anatomy, R-124, University of Miami School of Medicine, P.O. Box 016960, Miami, FL 33101. Tel.: (305) 243-6977; Fax: (305) 545-7166.
References
- Archer J, Solomon F. Deconstructing the microtubule-organizing center. Cell. 1994;76:589–591. doi: 10.1016/0092-8674(94)90496-0. [DOI] [PubMed] [Google Scholar]
- Arpin M, Algrain M, Louvard D. Membrane–actin microfilament connections: an increasing diversity of players related to band 4.1. Curr Opin Cell Biol. 1994a;6:136–141. doi: 10.1016/0955-0674(94)90127-9. [DOI] [PubMed] [Google Scholar]
- Arpin M, Friederich E, Algrain M, Vernel F, Louvard D. Functional differences betwen L- and T-plastin isoforms. J Cell Biol. 1994b;127:1995–2008. doi: 10.1083/jcb.127.6.1995. [DOI] [PMC free article] [PubMed] [Google Scholar]
- Bacallao R, Antony C, Dotti C, Karsenti E, Stelzer EHK, Simons K. The subcellular organization of Madin-Darby canine kidney cells during the formation of a polarized epithelium. J Cell Biol. 1989;109:2817–2832. doi: 10.1083/jcb.109.6.2817. [DOI] [PMC free article] [PubMed] [Google Scholar]
- Bader BL, Franke WW. Cell-type specific and efficient synthesis of human cytokeratin 19 in transgenic mice. Differentiation. 1990;45:109–118. doi: 10.1111/j.1432-0436.1990.tb00464.x. [DOI] [PubMed] [Google Scholar]
- Bader, B.L., T.M. Magin, H. Mechthild, and W.W. Franke. 1986. Amino acid sequence and gene organization of cytokeratin no. 19, an exceptional tailless intermediate filament protein. EMBO (Eur. Mol. Biol. Organ.) J. 5: 1865–1875. [DOI] [PMC free article] [PubMed]
- Baricault L, de Néchaud B, Sapin C, Codogno P, Denoulet P, Trugnan G. The network organization and the phosphorylation of cytokeratins are concomitantly modified by forskolin in the enterocyte-like differentiated CACO-2 cell line. J Cell Sci. 1994;107:2909–2918. doi: 10.1242/jcs.107.10.2909. [DOI] [PubMed] [Google Scholar]
- Bologna M, Allen R, Dulbecco R. Organization of cytokeratin bundles by desmosomes in rat mammary cells. J Cell Biol. 1986;102:560–567. doi: 10.1083/jcb.102.2.560. [DOI] [PMC free article] [PubMed] [Google Scholar]
- Bordier C. Phase separation of integral membrane proteins in Triton X-114 solution. J Biol Chem. 1981;256:1604–1607. [PubMed] [Google Scholar]
- Brignoni M, Pignataro OP, Rodriguez ML, Alvarez A, Vega-Salas DE, Rodriguez E, Boulan, Salas PJI. Cyclic AMP modulates the rate of “constitutive” exocytosis of apical membrane proteins in Madin-Darby canine kidney cells. J Cell Sci. 1995;108:1931–1943. doi: 10.1242/jcs.108.5.1931. [DOI] [PubMed] [Google Scholar]
- Brown WJ, Farquhar MG. The mannose-6-phosphate receptor for lysosomal enzymes is concentrated in CisGolgi cisternae. Cell. 1984;36:295–307. doi: 10.1016/0092-8674(84)90223-x. [DOI] [PubMed] [Google Scholar]
- Brown DA, Rose JK. Sorting of GPI-anchored proteins to glycolipid-enriched membrane subdomains during transport to the apical cell surface. Cell. 1992;68:533–544. doi: 10.1016/0092-8674(92)90189-j. [DOI] [PubMed] [Google Scholar]
- Buendia B, Bré MH, Griffiths G, Karsenti E. Cytoskeletal control of centrioles movement during the establishment of polarity in MDCK cells. J Cell Biol. 1990;110:1123–1135. doi: 10.1083/jcb.110.4.1123. [DOI] [PMC free article] [PubMed] [Google Scholar]
- Calnek D, Quaroni A. Changes in keratin expression during fetal and postnatal development of intestinal epithelial cells. Biochem J. 1992;285:939–946. doi: 10.1042/bj2850939. [DOI] [PMC free article] [PubMed] [Google Scholar]
- Calnek D, Quaroni A. Differential localization by in situ hybridization of distinct keratin mRNA species during intestinal epithelial cell development and differentiation. Differentiation. 1993;53:95–104. doi: 10.1111/j.1432-0436.1993.tb00649.x. [DOI] [PubMed] [Google Scholar]
- Campbell JM, Bacon TA, Wickstrom E. Oligodeoxynucleoside phosphorothioate stability in subcellular extracts, culture media, sera, and cerebrospinal fluid. J Biochem Biophys Methods. 1990;20:259–267. doi: 10.1016/0165-022x(90)90084-p. [DOI] [PubMed] [Google Scholar]
- Costa de Beauregard M-A, Pringault E, Robine S, Louvard D. Suppression of villin expression by antisense RNA impairs brush border assembly in polarized epithelial intestinal cells. EMBO (Eur Mol Biol Organ) J. 1995;14:405–421. doi: 10.1002/j.1460-2075.1995.tb07017.x. [DOI] [PMC free article] [PubMed] [Google Scholar]
- Crooke RM, Graham MJ, Cooke ME, Crooke ST. In vitro pharmacokinetics of phosphorothioated antisense oligonucleotides. J Pharmacol Exp Ther. 1995;275:462–473. [PubMed] [Google Scholar]
- Denk H, Lackinger E, Zatloukal K, Franke WW. Turnover of cytokeratin polypeptides in mouse hepatocytes. Exp Cell Res. 1987;173:137–143. doi: 10.1016/0014-4827(87)90339-9. [DOI] [PubMed] [Google Scholar]
- Dockhorn-Dworniczak B, Franke WW, Schröder S, Czernobilsky B, Gould VE, Böcker W. Patterns of expression of cytoskeletal proteins in human thyroid gland and thyroid carcinomas. Differentiation. 1987;35:53–71. doi: 10.1111/j.1432-0436.1987.tb00151.x. [DOI] [PubMed] [Google Scholar]
- Drenckhahn D, Dermietzel R. Organization of the actin filament cytoskeleton in the intestinal brush border: a quantitative and qualitative immunoelectron microscope study. J Cell Biol. 1988;107:1038–1048. doi: 10.1083/jcb.107.3.1037. [DOI] [PMC free article] [PubMed] [Google Scholar]
- Drenckhahn D, Schluter K, Allen DP, Bennett V. Colocalization of band 3 with ankyrin and spectrin at the basal membrane of intercalated cells in the rat kidney. Science (Wash DC) 1985;230:1287–1289. doi: 10.1126/science.2933809. [DOI] [PubMed] [Google Scholar]
- Eckert RL. Sequence of the human 40-kDa keratin reveals an unusual structure with very high sequence identity to the corresponding bovine keratin. Proc Natl Acad Sci USA. 1988;85:1114–1118. doi: 10.1073/pnas.85.4.1114. [DOI] [PMC free article] [PubMed] [Google Scholar]
- Eckert BS. Alteration of intermediate filament distribution in PtK1cells by acrylamide. Eur J Cell Biol. 1985;37:169–174. [PubMed] [Google Scholar]
- Eckert BS, Daley RA, Parysek LM. In vivo disruption of the cytokeratin cytoskeleton in cultured epithelial cells by microinjection of antikeratin: evidence for the presence of an intermediate-filament–organizing center. Cold Spring Harbor Symp Quant Biol. 1982;46:403–412. doi: 10.1101/sqb.1982.046.01.039. [DOI] [PubMed] [Google Scholar]
- Ezzell RM, Chafel MM, Matsudaira PT. Differential localization of villin and fimbrin during development of the mouse visceral endoderm and intestinal epithelium. Development. 1989;106:407–419. doi: 10.1242/dev.106.2.407. [DOI] [PubMed] [Google Scholar]
- Fath KR, Burgess DR. Microvillus assembly. Not actin alone. Curr Biol. 1995;5:591–593. doi: 10.1016/s0960-9822(95)00117-5. [DOI] [PubMed] [Google Scholar]
- Fath, K.R., S.N. Mamajiwalla, and D.R. Burgess. 1993. The cytoskeleton in development of epithelial cell polarity. J. Cell Sci. 17(Suppl.):65–73. [DOI] [PubMed]
- Ferreira A, Niclas J, Vale RD, Banker G, Kosik KS. Suppression of kinesin expression in cultured hippocampal neurons using antisense oligonucleotides. J Cell Biol. 1992;117:595–606. doi: 10.1083/jcb.117.3.595. [DOI] [PMC free article] [PubMed] [Google Scholar]
- Forristall C, Pondel M, Chen L, King ML. Pattern of localization and cytoskeletal association of two vegetally localized RNAs, Vg1 and Xcat-2. Development (Camb) 1995;121:201–208. doi: 10.1242/dev.121.1.201. [DOI] [PubMed] [Google Scholar]
- Franke WW, Appelhans B, Schmid E, Freudenstein C. The organization of cytokeratin filaments in the intestinal epithelium. Eur J Cell Biol. 1979;19:255–268. [PubMed] [Google Scholar]
- Friederich E, Kreis TE, Louvard D. Villin-induced growth of microvilli is reversibly inhibited by cytochalasin D. J Cell Sci. 1993;105:765–775. doi: 10.1242/jcs.105.3.765. [DOI] [PubMed] [Google Scholar]
- Gard DL. γ-Tubulin is asymmetrically distributed in the cortex of Xenopusoocytes. Dev Biol. 1994;161:131–140. doi: 10.1006/dbio.1994.1015. [DOI] [PubMed] [Google Scholar]
- Gilbert T, Le Bivic A, Quaroni A, Rodriguez-Boulan E. Microtubular organization and its involvement in the biogenetic pathways of plasma membrane proteins in Caco-2 intestinal epithelial cells. J Cell Biol. 1991;113:275–288. doi: 10.1083/jcb.113.2.275. [DOI] [PMC free article] [PubMed] [Google Scholar]
- Hall HG, Bissell MJ. Characterization of the intermediate filament proteins of murine mammary gland epithelial cells. Exp Cell Res. 1986;162:379–389. doi: 10.1016/0014-4827(86)90343-5. [DOI] [PubMed] [Google Scholar]
- Hasson T, Mooseker MS. Molecular motors, membrane movements and physiology: emerging roles for myosins. Curr Opin Cell Biol. 1995;7:587–594. doi: 10.1016/0955-0674(95)80017-4. [DOI] [PubMed] [Google Scholar]
- Hauri H-P, Sterchi EE, Bienz D, Fransen JAM, Marxer A. Expression and intracellular transport of microvillus membrane hydrolases in human intestinal epithelial cells. J Cell Biol. 1985;101:838–851. doi: 10.1083/jcb.101.3.838. [DOI] [PMC free article] [PubMed] [Google Scholar]
- Hooper NM, Turner AJ. Ectoenzymes of the kidney microvillar membrane. Differential solubilization by detergents can predict a glycosylphosphatidylinositol membrane anchor. Biochem J. 1988;250:865–869. doi: 10.1042/bj2500865. [DOI] [PMC free article] [PubMed] [Google Scholar]
- Huber LA, de Hoop MJ, Dupree P, Zerial M, Simons K, Dotti C. Protein transport to the dendritic plasma membrane of cultured neurons is regulated by rab8p. J Cell Biol. 1993;123:47–55. doi: 10.1083/jcb.123.1.47. [DOI] [PMC free article] [PubMed] [Google Scholar]
- Hull B, Staehelin LA. The terminal web. A reevaluation of its structure and function. J Cell Biol. 1979;81:67–82. doi: 10.1083/jcb.81.1.67. [DOI] [PMC free article] [PubMed] [Google Scholar]
- Kartha S, Atkin B, Martin TE, Toback FG. Cytokeratin reorganization induced by adenosine diphosphate in kidney epithelial cells. Exp Cell Res. 1992;200:219–226. doi: 10.1016/0014-4827(92)90167-7. [DOI] [PubMed] [Google Scholar]
- Kerneis S, Bogdanova A, Colucci-Guyon E, Kraehenbuhl J-P, Pringault E. Cytosolic distribution of villin in M cells from mouse Peyer's patches correlates with the absence of a brush border. Gastroenterology. 1996;110:515–521. doi: 10.1053/gast.1996.v110.pm8566599. [DOI] [PubMed] [Google Scholar]
- Klymkowsky MW, Maynell LA, Polson AG. Polar asymmetry in the organization of the cortical cytokeratin system of Xenopus laevisoocytes and embryos. Development. 1987;100:543–557. doi: 10.1242/dev.100.3.543. [DOI] [PubMed] [Google Scholar]
- Knapp LW, O'Guin WM, Sawyer RH. Drug-induced alterations of cytokeratin organization in cultured epithelial cells. Science (Wash DC) 1983;219:501–502. doi: 10.1126/science.6186022. [DOI] [PubMed] [Google Scholar]
- Laemmli UK. Cleavage of structural proteins during the assembly of bacteriophage T4. Nature (Lond) 1970;227:680–685. doi: 10.1038/227680a0. [DOI] [PubMed] [Google Scholar]
- Lafont F, Burkhardt JK, Simons K. Involvement of microtubule motors in basolateral and apical transport in kidney cells. Nature (Lond) 1994;372:801–803. doi: 10.1038/372801a0. [DOI] [PubMed] [Google Scholar]
- Le Bivic A, Quaroni A, Nichols B, Rodriguez-Boulan E. Biogenetic pathways of plasma membrane proteins in CACO-2, a human intestinal epithelial cell line. J Cell Biol. 1990;111:1351–1361. doi: 10.1083/jcb.111.4.1351. [DOI] [PMC free article] [PubMed] [Google Scholar]
- Lisanti MP, Sargiacomo M, Graeve L, Saltiel AR, Rodriguez-Boulan E. Polarized apical distribution of glycosyl-phosphatidylinositolanchored proteins in a renal epithelial cell line. Proc Natl Acad Sci USA. 1988;85:9557–9561. doi: 10.1073/pnas.85.24.9557. [DOI] [PMC free article] [PubMed] [Google Scholar]
- Loke SL, Stein CA, Zhang XH, Mori K, Nakanishi M, Subasinghe C, Cohen JS, Neckers LM. Characterization of oligonucleotide transport into living cells. Proc Natl Acad Sci USA. 1989;86:3474–3478. doi: 10.1073/pnas.86.10.3474. [DOI] [PMC free article] [PubMed] [Google Scholar]
- Louvard D, Kedinger M, Hauri HP. The differentiating intestinal epithelial cell: establishment and maintenance of functions through interactions between cellular structures. Annu Rev Cell Biol. 1992;8:157–195. doi: 10.1146/annurev.cb.08.110192.001105. [DOI] [PubMed] [Google Scholar]
- Matter K, Brauchbar M, Bucher K, Hauri H-P. Sorting of endogenous plasma membrane proteins occurs from two sites in cultured human intestinal epithelial cells (Caco-2) Cell. 1990;60:429–437. doi: 10.1016/0092-8674(90)90594-5. [DOI] [PubMed] [Google Scholar]
- Mays RW, Beck KA, Nelson WJ. Organization and function of the cytoskeleton in polarized epithelial cells: a component of the protein sorting machinery. Curr Opin Cell Biol. 1994;6:16–24. doi: 10.1016/0955-0674(94)90111-2. [DOI] [PubMed] [Google Scholar]
- Mays RW, Siemers KA, Fritz BA, Lowe AW, van Meer G, Nelson WJ. Hierarchy of mechanisms involved in generating Na/K-ATPase polarity in MDCK epithelial cells. J Cell Biol. 1995;130:1105–1115. doi: 10.1083/jcb.130.5.1105. [DOI] [PMC free article] [PubMed] [Google Scholar]
- Moll R, Franke WW, Schiller DL, Geiger B, Krepler R. The catalog of human cytokeratins: patterns of expression in normal epithelia, tumors, and cultured cells. Cell. 1982;31:11–24. doi: 10.1016/0092-8674(82)90400-7. [DOI] [PubMed] [Google Scholar]
- Mooseker MS. Organization, chemistry, and assembly of the cytoskeletal apparatus of the intestinal brush border. Annu Rev Cell Biol. 1985;1:209–241. doi: 10.1146/annurev.cb.01.110185.001233. [DOI] [PubMed] [Google Scholar]
- Moreno JH, Diamond J. Routes of non-electrolyte permeability in gallbladder. Effects of 2,4,6,-triaminopyrimidinium (TAP) J Gen Physiol. 1975;66:117–128. doi: 10.1085/jgp.66.1.117. [DOI] [PMC free article] [PubMed] [Google Scholar]
- Mostov KE. Regulation of protein traffic in polarized epithelial cells. Bioessays. 1995;17:129–138. doi: 10.1002/bies.950170208. [DOI] [PubMed] [Google Scholar]
- Nelson WJ. Regulation of cell surface polarity from bacteria to mammals. Science (Wash DC) 1992;258:948–955. doi: 10.1126/science.1439806. [DOI] [PubMed] [Google Scholar]
- Nelson WJ, Veshnock PJ. Modulation of fodrin (membrane skeleton) stability by cell–cell contact in Madin-Darby canine kidney epithelial cells. J Cell Biol. 1987a;104:1527–1537. doi: 10.1083/jcb.104.6.1527. [DOI] [PMC free article] [PubMed] [Google Scholar]
- Nelson WJ, Veshnock PJ. Ankyrin binding to (Na+-K+)ATPase and implications for the organization of membrane domains in polarized cells. Nature (Lond) 1987b;328:533–536. doi: 10.1038/328533a0. [DOI] [PubMed] [Google Scholar]
- Nelson WJ, Hammerton RW. A membrane–cytoskeletal complex containing (Na+-K+)ATPase, ankyrin, and fodrin in Madin-Darby canine kidney (MDCK) cells: implications for the biogenesis of epithelial cell polarity. J Cell Biol. 1989;108:893–902. doi: 10.1083/jcb.108.3.893. [DOI] [PMC free article] [PubMed] [Google Scholar]
- Noonberg SB, Garovoy MR, Hunt CA. Characteristics of oligonucleotide uptake in human kertinocyte cultures. J Investig Dermatol. 1993;101:727–731. doi: 10.1111/1523-1747.ep12371683. [DOI] [PubMed] [Google Scholar]
- Ojakian GK, Schwimmer R. The polarized distribution of an apical cell surface glycoprotein is maintained by interactions with the cytoskeleton of Madin-Darby canine kidney cells. J Cell Biol. 1988;107:2377–2387. doi: 10.1083/jcb.107.6.2377. [DOI] [PMC free article] [PubMed] [Google Scholar]
- Oosterwijk E, van Muijen GNP, Oosterwijk-Wakka JC, Warnaar SO. Expression of intermediate-sized filaments in developing and adult human kidney and in renal cell carcinoma. J Histochem Cytochem. 1990;38:385–392. doi: 10.1177/38.3.1689337. [DOI] [PubMed] [Google Scholar]
- Owaribe K, Sugino H, Masuda H. Characterization of intermediate filaments and their structural organization during epithelium formation in pigmented epithelial cells of the retina in vitro. Cell Tissue Res. 1986;244:87–93. doi: 10.1007/BF00218385. [DOI] [PubMed] [Google Scholar]
- Parry G, Beck JC, Moss L, Bartley J, Ojakian GK. Determination of apical membrane polarity in mammary epithelial cell cultures: the role of cell-cell, cell-substratum and membrane-cytoskeleton interactions. Exp Cell Res. 1990;188:302–311. doi: 10.1016/0014-4827(90)90174-9. [DOI] [PubMed] [Google Scholar]
- Peterson GL. A simplification of the protein assay method of Lowry et al., which is more generally applicable. Anal Biochem. 1977;83:346–356. doi: 10.1016/0003-2697(77)90043-4. [DOI] [PubMed] [Google Scholar]
- Peterson MD, Mooseker MS. Characterization of the enterocytelike brush border cytoskeleton of the C2BBe clones of the human intestinal cell line, Caco-2. J Cell Sci. 1992;102:581–600. doi: 10.1242/jcs.102.3.581. [DOI] [PubMed] [Google Scholar]
- Peterson MD, Bement WM, Mooseker MS. An in vitro model for the analysis of intestinal brush border assembly. II. Changes in expression and localization of brush border proteins during cell contact induced brush border assembly in Caco-2BBe cells. J Cell Sci. 1993;105:461–472. doi: 10.1242/jcs.105.2.461. [DOI] [PubMed] [Google Scholar]
- Pinto M, Robine-Leon S, Appay M-D, Kedinger M, Triadou N, Dussaulx E, Lacroix B, Simon-Assmann P, Haffen K, Fogh J, et al. Enterocyte-like differentiation and polarization of the human colon carcinoma cell line Caco-2 in culture. Biol Cell (Ivry Sur Seine) 1983;47:323–330. [Google Scholar]
- Quaroni A, Calnek E, Quaroni E, Chandler JS. Keratin expression in rat intestinal crypt and villus cells. Analysis with a panel of monoclonal antibodies. J Biol Chem. 1990;266:11923–11931. [PubMed] [Google Scholar]
- Reinsch S, Karsenti E. Orientation of spindle axis and distribution of plasma membrane proteins during cell division in polarized MDCKII cells. J Cell Biol. 1994;126:1509–1526. doi: 10.1083/jcb.126.6.1509. [DOI] [PMC free article] [PubMed] [Google Scholar]
- Rizzolo LJ, Joshi HC. Apical orientation of the microtubule organizing center and associated γ-tubulin during the polarization of the retinal pigment epithelium in vivo. Dev Biol. 1993;157:147–156. doi: 10.1006/dbio.1993.1119. [DOI] [PubMed] [Google Scholar]
- Rodriguez ML, Brignoni M, Salas PJI. A specifically apical submembrane intermediate filament cytoskeleton in non-brush-border epithelial cells. J Cell Sci. 1994;107:3145–3151. doi: 10.1242/jcs.107.11.3145. [DOI] [PubMed] [Google Scholar]
- Rodriguez-Boulan E, Nelson WJ. Morphogenesis of the polarized epithelial cell phenotype. Science (Wash DC) 1989;245:718–725. doi: 10.1126/science.2672330. [DOI] [PubMed] [Google Scholar]
- Rodriguez-Boulan E, Salas PJI. External and internal signals for epithelial cell surface polarization. Annu Rev Physiol. 1989;51:741–754. doi: 10.1146/annurev.ph.51.030189.003521. [DOI] [PubMed] [Google Scholar]
- Salas PJI, Vega-Salas DE, Hochman J, Rodriguez-Boulan E, Edidin M. Selective anchoring in the specific plasma membrane domain: a role in epithelial cell polarity. J Cell Biol. 1988;107:2363–2376. doi: 10.1083/jcb.107.6.2363. [DOI] [PMC free article] [PubMed] [Google Scholar]
- Rodriguez-Boulan E, Salas PJI, Sargiacomo M, Lisanti M, LeBivic A, Sambuy Y, Vega-Salas DE, Graeve L. Methods to estimate the polarized distribution of surface antigens in cultured epithelial cells. Methods Cell Biol. 1989;32:37–56. doi: 10.1016/s0091-679x(08)61166-8. [DOI] [PubMed] [Google Scholar]
- Shibayama T, Carboni JM, Mooseker MS. Assembly of the intestinal brush border: appearance and redistribution of microvillar core proteins in developing chick enterocytes. J Cell Biol. 1987;105:335–344. doi: 10.1083/jcb.105.1.335. [DOI] [PMC free article] [PubMed] [Google Scholar]
- Simons K, Wandinger-Ness A. Polarized sorting in epithelia. Cell. 1990;62:207–210. doi: 10.1016/0092-8674(90)90357-k. [DOI] [PubMed] [Google Scholar]
- Simons K, Fuller SD. Cell surface polarity in epithelia. Annu Rev Cell Biol. 1985;1:243–288. doi: 10.1146/annurev.cb.01.110185.001331. [DOI] [PubMed] [Google Scholar]
- Singh S, Gupta PD. Tampering with cytokeratin expression results in cell dysfunction. Epithelial Cell Biol. 1994;3:79–83. [PubMed] [Google Scholar]
- Soule HD, Maloney TM, Wolman SR, Peterson WD, Brenz R, McGrath CM, Russo J, Pauley RJ, Jones RF, Brooks SC. Isolation and characterization of a spontaneously immortalized human breast epithelial cell line, MCF–10. Cancer Res. 1990;50:6075–6086. [PubMed] [Google Scholar]
- Stasiak PC, Lane EB. Sequence of cDNA coding for human keratin 19. Nucleic Acids Res. 1987;15:10058–10059. doi: 10.1093/nar/15.23.10058. [DOI] [PMC free article] [PubMed] [Google Scholar]
- Stevenson BR, Siliciano JD, Mooseker MS, Goodenough DA. Identification of ZO-1: a high molecular weight polypeptide associated with the tight junction (zonnula occludens) in a variety of epithelia. J Cell Biol. 1986;103:755–766. doi: 10.1083/jcb.103.3.755. [DOI] [PMC free article] [PubMed] [Google Scholar]
- Stosiek P, Kasper M, Karsten U. Expression of cytokeratin 19 during human liver organogenesis. Liver. 1990;10:59–63. doi: 10.1111/j.1600-0676.1990.tb00436.x. [DOI] [PubMed] [Google Scholar]
- Tait L, Soule HD, Russo J. Ultrastructural and immunocytochemical characterization of an immortalized human breast epithelial cell line, MCF-10. Cancer Res. 1990;50:6087–6094. [PubMed] [Google Scholar]
- Takeuchi K, Sato N, Kasahara H, Funayama N, Nagafuchi A, Yonemura S, Tsukita S, Tsukita S. Perturbation of cell adhesion and microvilli formation by antisense oligonucleotides to ERM family members. J Cell Biol. 1994;125:1371–1384. doi: 10.1083/jcb.125.6.1371. [DOI] [PMC free article] [PubMed] [Google Scholar]
- Towbin H, Staehelin T, Gordon J. Electrophoretic transfer of proteins from polyacrylamide gels to nitrocellulose sheets: procedure and some applications. Proc Natl Acad Sci USA. 1979;76:4350–4354. doi: 10.1073/pnas.76.9.4350. [DOI] [PMC free article] [PubMed] [Google Scholar]
- Vega-Salas DE, Salas PJI, Gundersen D, Cereijido M, RodriguezBoulan E. Formation of the apical pole of epithelial (Madin-Darby canine kidney) cells: polarity of an apical protein is independent of tight junctions, while segregation of a basolateral marker requires cell–cell interactions. J Cell Biol. 1987a;104:905–916. doi: 10.1083/jcb.104.4.905. [DOI] [PMC free article] [PubMed] [Google Scholar]
- Vega-Salas DE, Salas PJI, Rodriguez-Boulan E. Modulation of the expression of an apical plasma membrane protein of Madin-Darby canine kidney epithelial cells. Cell–cell interactions control the appearance of a novel intracellular storage compartment. J Cell Biol. 1987b;104:1249–1259. doi: 10.1083/jcb.104.5.1249. [DOI] [PMC free article] [PubMed] [Google Scholar]
- Vega-Salas DE, Salas PJI, Rodriguez-Boulan E. Exocytosis of vacuolar apical compartment (VAC): a cell–cell contact controlled mechanism for the establishment of the apical plasma membrane domain in epithelial cells. J Cell Biol. 1988;107:1717–1728. doi: 10.1083/jcb.107.5.1717. [DOI] [PMC free article] [PubMed] [Google Scholar]
- Wollner DA, Nelson WJ. Establishing and maintaining epithelial cell polarity. Roles of protein sorting, delivery, and retention. J Cell Sci. 1992;102:185–190. doi: 10.1242/jcs.102.2.185. [DOI] [PubMed] [Google Scholar]
- Zhao Q, Matson S, Herrera CJ, Fisher E, Yu H, Krieg AM. Comparison of cellular binding and uptake of antisense phosphodiester, phosphorothioate, and mixed phosphorothioate and methylphosphorylated oligonucleotides. Antisense Res Dev. 1993;3:53–66. doi: 10.1089/ard.1993.3.53. [DOI] [PubMed] [Google Scholar]