

Abstract
Carcinoembryonic antigen (CEA) is a tumor marker that is overexpressed in many human cancers and functions in vitro as a homotypic intercellular adhesion molecule. We have investigated the possibility of synergy between CEA, v-Myc, and Bcl-2 in the transformation of cells with differentiation capacity. We find that v-Myc increases the cell division rate and maximum density of rat L6 myoblasts but also markedly stimulates both apoptosis and surprisingly, differentiation, thus preventing transformation. The superposition of Bcl-2 blocks the apoptotic stimulation of v-Myc and independently promotes further cell division at confluence, but still allows differentiation. The further expression of CEA has a dominant effect in blocking differentiation, regardless of the presence of the other activated oncogenes, generating cells that enter a reversible quiescent G0-like state in medium promoting differentiation. Transfectants expressing CEA with or without v-myc and bcl-2 allow the emergence of cells with the property of heritable, efficient, anchorageindependent growth in soft agar and the ability to markedly reduce the latency for tumor formation in nude mice. We propose that by prolonging cell survival in the presence of differentiation signals, CEA represents a novel class of dominant differentiation-blocking oncogene.
Malignant transformation is believed to require four critical events: acquisition of increased proliferative activity, abrogation of apoptosis, immortalization, and deletion of access to differentiation programs. Differentiation has generally been assumed to be attenuated by an increase in proliferative behavior, if only because these cellular programs are considered mutually inhibiting. A major focus of oncobiology, therefore, has been to identify and characterize genes that influence cellular proliferation and recently, genes that govern cell death. Prototypic members of these two classes of oncogenes are, respectively, c-myc (for reviews see Evan and Littlewood, 1993; Evan et al., 1994) and bcl-2 (for reviews see Korsmeyer, 1992; 1995).
c-myc is an early response gene implicated in emergence from quiescence and normal progression through the cell cycle, in the establishment and propagation of neoplasia and, paradoxically, in initiating apoptosis (for review see Evan and Littlewood, 1993; Packham and Cleveland, 1995). Cellular transformation induced by c-myc deregulation is, however, often incomplete and depends on the activation of another oncogene, such as ras (Land et al., 1983; Adams et al., 1985). In contrast, forced bcl-2 expression promotes cell survival both in vitro (Bissonnette et al., 1992; Fanidi et al., 1992) and in vivo (McDonnell et al., 1989; McDonnell and Korsmeyer, 1991) by preventing apoptosis. Cultured fibroblasts coexpressing myc and bcl-2 continue to proliferate at low mitogen concentrations and experience reduced cell death but are not morphologically transformed (Fanidi et al., 1992). Mice expressing both Eμ-myc and Eμ–bcl-2 transgenes (Strasser et al., 1990) accumulate cycling pre-B and differentiated B cells, display an increased frequency of monoclonal tumors, and die earlier than Eμ-myc mice (Adams et al., 1985), observations that are attributed to a tumorigenic cooperativity between Myc and Bcl-2. The latent period and monoclonal nature of the tumors suggest, however, that additional mutations are required. Thus, Myc and Bcl-2 together result in the expansion of a population of benign cells that retain, at least in part, the capacity for differentiation.
Our laboratory has used a well characterized in vitro differentiation system, the immortal rat L6 skeletal myoblast cell line (Yaffe, 1968), to investigate oncogene action in the context of aberrant expression of human carcinoembryonic antigen (CEA).1 First discovered to be overexpressed in human colon tumors (Gold and Freedman, 1965), CEA has since been widely used as a marker in the clinical management of many cancers, including carcinomas of the colon, breast, and lung (Averbach and Sugarbaker, 1995). CEA is a glycophosphatidylinositol-linked (Hefta et al., 1988; Takami et al., 1988) cell surface glycoprotein of the immunoglobulin gene superfamily that has been shown to mediate homotypic intercellular adhesion (Benchimol et al., 1989; Oikawa et al., 1989).
We have proposed a model in which overproduction of CEA plays an active role in carcinogenesis by disrupting the normal tissue architecture of colonic epithelium, leading to inhibition of differentiation and tissue dysplasia (Benchimol et al., 1989). We contend that overproduction and redistribution of CEA from apical to the lateral and basal surfaces of colonic crypt epithelial cells perturbs normal intercellular interactions leading to the adoption of a multilayered (“stratified”) epithelial configuration, perhaps mimicking the multilayered configuration seen in embryonic colonic epithelium. The predicted effect of this distortion in tissue architecture is the inhibition of normal colonocyte terminal differentiation, thus potentiating increased cell division. In support of this model we have recently shown that the cell surface levels of CEA determined by cytofluorometric analysis of highly purified epithelial colonocytes from freshly excised colon carcinomas and adjacent normal tissue are elevated in the tumor cells and at levels that are inversely correlated with the degree of differentiation of the tumors (Ilantzis et al., 1997).
To test the proposed differentiation-inhibiting effect of CEA directly in a well defined differentiation system, rat L6 myoblasts were used. In low serum, L6 cells withdraw irreversibly from the cell cycle, align, and form multinucleated myotubes while concomitantly upregulating musclespecific gene products (Nadal-Ginard, 1978). Myogenesis of L6 cells requires a complex series of cell–cell recognition and membrane fusion events that are mediated by a number of adhesion systems (Knudsen, 1990) and the upregulation of functional Myf5 and myogenin, members of the MyoD family of skeletal muscle transcriptional regulators (for review see Olson and Klein, 1994). Ectopic expression of cell surface CEA blocks biochemical and morphological myogenic differentiation in L6 myoblasts (Eidelman et al., 1993); since the CEA-imposed differentiation block can be released by peptides representing the two adhesion domains of CEA, the effect depends on CEA–CEA interactions (Eidelman et al., 1993; Zhou et al., 1993). We hypothesized that L6 cells stably expressing CEA, which retain their viability and proliferative potential while remaining in a quiescent nondifferentiated state for weeks in differentiation medium (Eidelman et al., 1993; Screaton, R.A., and C.P. Stanners, unpublished observations), should show increased susceptibilty to further malignant progression induced by oncogenic activation. To directly test this idea we have examined cellular phenotypes in single and multiple transfectants of the rat L6 and mouse C2 (Yaffe and Saxel, 1977) myoblast cell lines to examine possible synergism between Myc, Bcl-2, and CEA in transformation.
Extensive evidence has led to the prevailing view that activation of the cellular proliferative machinery results in the obligatory disruption of the myogenic differentiation program, which is normally accessed after arrest in the G1 phase of the cell cycle. Specifically, myogenesis can be prevented by maintaining cells in high concentrations of soluble growth factors such as PDGF and IGF-I (Screaton, R.A., and C.P. Stanners, unpublished) and by the forced expression of cellular or viral oncogenes (for review see Alema and Tato, 1994), including c-myc (Denis et al., 1987; La Rocca et al., 1994) and v-myc (La Rocca et al., 1989). The mechanism of disruption has been suggested to involve either the stimulation of proliferative behavior, which precludes cell cycle withdrawal, or the direct inactivation of Myf5 (Braun et al., 1992). We present data showing that v-myc expression in L6 cells increases the division rate and saturation density, promotes cell death by apoptosis in limiting serum, and contrary to previous reports, accelerates myogenic differentiation. Superimposed expression of bcl-2 relieves cell loss due to apoptosis and independently promotes further cell division at confluence but does not prevent differentiation. In low serum, CEA induces a reversible quiescent G0-like state that is incompatible with progression to terminal differentiation. We demonstrate that cells expressing CEA in addition to v-myc and bcl-2 proliferate faster, reach higher saturation densities, neither undergoes apoptosis nor differentiates in low serum, and furthermore, are capable of giving rise to large anchorage-independent colonies that form tumors in nude mice. CEA is the critical factor in allowing the emergence of these colonies and in reducing the latent period of tumor formation. These results suggest that CEA may contribute to malignancy in myoblasts by interfering exclusively with access to the differentiation program, inducing reversible quiescence in the presence of differentiation stimuli and increased susceptibility to proliferative oncogene activation.
Materials and Methods
Cell Culture
Rat L6 (Yaffe, 1968) and mouse C2 (Yaffe and Saxel, 1977) myoblasts were grown as monolayer cultures in DME containing 10 (L6) or 20% (C2) FBS growth medium (GM; GIBCO BRL, Gaithersburg, MD) supplemented with 100 U/ml penicillin and 100 μg/ml streptomycin (GIBCO BRL) and were incubated at 37°C in a humidified atmosphere with 5% CO2. v-myc and CEA coexpressing transfectant cells were maintained in medium containing 20% FBS to minimize cell death by apoptosis in medium depleted of growth factors. All cells were passaged while subconfluent to avoid selection of nonfusing variants.
Infections
L6 cells were incubated with replication-defective recombinant retrovirus containing either pBabe(avian v-myc)hygro (Facchini et al., 1994), pBabe(human bcl-2)puro (Zhu et al., 1996), or the vector alone controls (Morgenstern and Land, 1990) in 2.5 ml α-MEM plus 10% FBS supplemented with 8 μg/ml polybrene for 2 h at 37°C. Cells were then washed and incubated with GM overnight. The cultures were subcultured 1:5 to 1:20 and selection started 24 h later with GM containing hygromycin B (v-myc) or puromycin (bcl-2) at 100 μg/ml and 2 μg/ml, respectively. After 7 d of selection, selective drugs (hygromycin or puromycin) were removed, and total populations of resistant clones were pooled and cultured thereafter without selection. v-Myc and Bcl-2 expression was verified by immunoblotting. Total populations were used to avoid the possibility of clonal variation in cellular properties unrelated to the phenotypic effects of the gene being tested. Proof of the polyclonality of these populations was provided by the presence of multiple integration sites in genomic DNA from the appropriate cell populations as revealed by Southern analysis using cDNA-specific probes for v-myc and bcl-2 (not shown). Cultures used for experiments were obtained from frozen stocks incubated for relatively few doubling times. The observed effects on cellular phenotype were reproduced with distinct total populations generated by repeating the infections for v-myc and bcl-2. No loss of v-Myc and Bcl-2 was noted during the course of the experiments (not shown). A triple selection with G418 (for CEA, see below), hygromycin, and puromycin done in separate steps allowed for the isolation of a population of cells expressing CEA, v-myc, and bcl-2.
Transfections
L6 or C2 myoblasts were seeded at 2 × 10⁵ cells/100-mm dish and cotransfected 24 h later by calcium phosphate coprecipitation with 5 μg of p91023B expression vector (courtesy of Kaufman, R., Genetics Institute, Boston, MA) or PKJ expression vector containing full-length CEA cDNA (clone 17; Beauchemin et al., 1987) and 0.5 μg pSV2neo plasmid per dish. Neomycin (G418)-resistant total transfectant populations were selected with 400 μg/ml G418 for 10–14 d. G418-resistant clones were pooled and sorted for high surface CEA levels by FACS using polyclonal rabbit anti– human CEA antibody. To enrich for stable CEA-producing cells, sorted populations were cultured without G418 selection for ∼20 doubling times, resorted for residual high CEA producers, and subsequently maintained in GM containing G418. Proof of polyclonality was provided by Southern analysis of genomic DNA using a CEA cDNA probe: pooled, sorted, and stabilized populations showed numerous integration sites and distinct patterns when using both CEA and neo specific probes in three out of the five independent clones isolated from the final sorted L6C population (not shown). Transfectant clone L6(CEA-1) was generated previously and designated L6-17 (Eidelman et al., 1993). G418 was removed from growth media 24 h before the application of the various functional assays. No loss of surface expression of CEA was detected over the culture period required for the assays (not shown).
Differentiation Assays
To induce differentiation, L6 and C2 cells were seeded on day 0 at 7 × 10³ and 3.5 × 10³ cells/cm2, respectively, in 60-mm plastic tissue culture petri dishes in 4 ml DME plus 10% FBS. On day 3, when cells were nearly confluent, the medium was changed to DME containing 2% horse serum (differentiation medium [DM]). Cells were assessed for differentiation/fusion on day 7 unless otherwise noted. Fusion index was determined as described previously (Eidelman et al., 1993). To investigate proliferation and differentiation capabilities of cells in medium containing low serum, cells were seeded on day 0 directly in DM at concentrations listed above and after 4 d incubation, fixed with 2.5% glutaraldehyde in PBS, and stained with hematoxylin. As a further assay of differentiation, cells were seeded in GM at 200 cells/60-mm petri dish, incubated for 10 d without a change of medium, as described for the viability assay, and then stained as above. The percentage of colonies with fused cells in their nonproliferating centers was then determined. For anti-myosin immunofluorescent staining, cultures were induced to differentiate in multiwell chamber slides (Nunclon®; Nunc, Inc., Naperville, IL) and prepared as described (De Giovanni et al., 1993).
Cell Lysis and Immunoblotting
Cells at a concentration of 107/ml were boiled in SDS lysis buffer (100 mM Tris, pH 8.0, 10% glycerol, 2% SDS) for 5 min and clarified by centrifugation. Protein determinations were made using BCA reagent (Pierce, Rockford, IL). 50–100 μg total protein was resolved by SDS-PAGE and transferred electrophoretically to a 0.45 μm PVDF membrane (Millipore Corp., Bedford, MA). Membranes were incubated with polyclonal panMyc antibody (generously provided by Evan, G.I., Imperial Cancer Research Fund, London, UK) at a dilution of 1:1,000 or polyclonal anti–Bcl-2 antibody (kind gift of Andrews, D., McMaster University, ON, Canada) at a dilution of 1:5,000 for 1 h at 25°C in TBST/M (25 mM Tris, pH 8.0, 62.5 mM NaCl, 0.4% Tween, 10% milk). After extensive washing, membranes were developed with HRP-conjugated anti–rabbit antibody and visualized by ECL reagent (Amersham Life Science, Pittsburgh, PA), which was used according to manufacturer's instructions.
Growth Curves
2 × 10⁴ L6 cells were seeded in 60-mm dishes in GM. Triplicate cultures were rendered single cell suspensions by trypsinization every 24 h and their cell numbers individually determined using a particle counter (Coulter Electronics Inc., Hialeah, FL). Plates were not refed fresh medium during the course of the experiment. Cell size distributions were obtained using a channelyzer (Coulter Electronics Inc.), and their mean values were determined. All distributions were essentially symmetrical such that mean and mode values were equivalent.
Cell Viability Assay
200 cells (or nuclei equivalent, where cell fusion was appreciable) were seeded in GM in replicate 60-mm dishes and incubated at 37°C for 9–10 d. The resultant colonies were rinsed with PBS, fixed with 3.7% formaldehyde in PBS, and stained with 0.1% methylene blue. The number of colonies of >25 cells was determined by eye and expressed as a percentage of the number of cells seeded to give the plating efficiency.
Colony Formation in Soft Agar
103 cells were seeded in 60-mm dishes in 0.3% agar in 5 ml GM on a bottom layer of 0.5% agar in 3 ml GM and incubated at 37°C. Plates were not refed during the course of the experiment. Uniform, dense colonies of >100 or >500 cells were counted by microscopic observation 3–4 wk after seeding, as indicated.
Chromatin Staining and Apoptotic Frequency Determination
Cells were seeded for differentiation in 60-mm dishes in GM. The culture medium was changed to DM on day 2 and incubated for an additional 24 h, at which time the cultures were trypsinized and the resultant cell suspension pooled with nonadherent cells in the medium and centrifuged. Cell pellets were resuspended in 1 ml DME, and an equal volume of ice-cold fixative (3:1 ratio of 95% EtOH to glacial acetic acid) was added dropwise with intermittent vortexing. Cells were collected by centrifugation, resuspended in 1 ml of fixative, and incubated on ice for 10 min. Fixed cells were centrifuged, resuspended in 200 μl fixative, mounted on cold slides, and quick dried over a boiling water bath. Slides were immersed in a saturated solution of orcein in 50% glacial acetic acid for 30–60 min at 25°C. Damaged cells with condensed chromatin, confirmed by electron microscopy to be apoptotic, were easily distinguished; their numbers relative to undamaged cells were determined in six separate fields. A minimum of 300 cells was counted per field.
Transmission Electron Microscopy
Cells were incubated in DM for 24 h, as described above for chromatin staining, before fixation in 2.5% glutaraldehyde and processed for electron microscopy using standard procedures. Cells were viewed under an electron microscope (Philips Electronic Instruments, Inc., Mahwah, NJ).
FACS Analysis
Cultures were trypsinized and resuspended in ice cold PBS plus 2% FBS (PBSF). 2.5 × 10⁵ cells were incubated with polyclonal rabbit or goat antiCEA antibodies diluted 1:100 (rabbit) or 1:600 (goat) in a total volume of 0.5 ml PBSF for 30 min on ice. Cells were centrifuged, rinsed with 2 ml PBSF, and resuspended in 0.5 ml PBSF containing FITC-conjugated rabbit anti–goat or goat anti–rabbit antibody diluted 1:100. After 30 min incubation on ice, cells were rinsed and resuspended in 0.75 ml PBSF for cytofluorometric analysis (FACScan®; Becton Dickinson, Bedford, MA).
Tumorigenicity Assay
To assay for tumorigenicity, 8–9 wk old nude mice (Swiss nu/nu; Taconic Farms Inc., Germantown, NY) were injected intramuscularly in both hind legs with cells resuspended in 100 μl serum-free PBS. The average latent periods for tumor formation by 105 and 3 × 10⁵ injected cells (or 5 × 10⁵ cells in the case of M alone) were determined as the time of appearance of a visible mass (>0.5 cm in diameter) at the site of injection or, for cases in which tumors developed inside the leg, the time of visible swelling of the leg and/or an alteration in gait. Differences in tumor latency were evaluated using the Student's t test.
Tumor Resection and Dissociation
Freshly excised tumor tissue was rinsed well with cold PBS, finely minced, and incubated in a sterile-filtered solution containing 50 U/ml purified collagenase (CLSPA) and 0.13% CLS-2 collagenase (Worthington Biochem. Corp., Freehold, NJ) in PBS supplemented with 10 μg/ml DNAseI for 30– 45 min at 37°C. After washing with GM to stop the dissociation, cells were filtered through a 70-μm filter and collected by centrifugation. Cells were seeded in GM containing 50 μg/ml gentamycin. 24–36 h later, cultures were divided by trypsinization and introduced into selective media containing either G418 (CEA+ lines) or puromycin (Bcl-2+ lines). After 3 d growth under selection, these tumor lines (denoted t) were expanded and then reintroduced into soft agar and nude mice.
Results
The block in myogenic differentiation of L6 cells stably expressing CEA in DM (Eidelman et al., 1993) led to the hypothesis that ectopic CEA expression could contribute to transformation of myoblasts in conjunction with a proliferative stimulus provided by an activated oncogene. Avian v-Myc and its cellular homolog, c-Myc, are cell cycle activators that promote G0–G1 and G1–S transitions (Evan and Littlewood, 1993, and references therein). Pooled populations of L6 cells stably expressing v-Myc in a retroviral vector conferring hygromycin B resistance (M) or of L6 cells expressing the drug resistance gene of the vector alone (P, parental) were therefore generated; expression of the p110 gag–v-Myc viral protein was verified by immunoblot (Fig. 1 A).
Figure 1.

Immunoblot analysis of parental and total transfectant cell populations. Total protein lysates were separated by SDSPAGE and transferred to a membrane for immunodetection using (A) pan-myc and (B) Bcl-2 polyclonal antisera. Lane assignments are as follows: P, parental L6, M, v-Myc+ cells, B, Bcl-2+ cells. Migration of molecular weight (kD) markers is shown.
Ectopic Myc Expression Accelerates Proliferation and Induces Both Apoptosis and Differentiation in Myoblasts
To investigate the effects of v-Myc alone on the growth behavior of L6 myoblasts, M and P cells were seeded in replicate culture dishes in GM and their cell numbers determined daily without change of medium; the results for a single experiment typical of three separate experiments, which included transfectants expressing Bcl-2 and CEA (see below), are shown in Fig. 2. The population doubling times are revealed by the slopes of the curves and are reported along with initial (day 5) and final (day 15) saturation densities in the inset of Fig. 2. v-Myc expression increased both the proliferation rate and the maximum culture density (Fig. 2, inset, compare P and M). These relatively small differences were highly significant and reproducible in repeated experiments. Cells expressing v-Myc were reduced in size during the exponential growth phase (Fig. 3), which is consistent with the observed increase in proliferative rate (Murray and Hunt, 1993).
Figure 2.

Growth parameters of L6 transfectants. Growth curves are shown giving the proliferative rate, saturation density, and viability at saturation of L6 parental (P), v-Myc (M), Bcl-2 (B), and CEA (C) transfectants and double or triple transfectants. Cells were seeded in replicate 60-mm dishes as described in Materials and Methods. The data shown were obtained in one experiment and are representative of three separate experiments in which the rates, saturation densities, and viabilities were all reproducible. The standard error of the means of three independent determinations at each point was ⩽4% for all data points, i.e., smaller than the diameters of the symbols themselves. (Inset) Doubling times, initial and 15-d saturation densities, and viabilities of L6 cell transfectants were obtained from the data shown in Fig. 2. Culture viability (see Materials and Methods) is presented as an average of the viabilities on days 10 and 15 and is expressed as a percentage of the viability of exponentially growing cultures. The latter values varied from 76 to 93%. To normalize for the effects of differentiation and/ or apoptosis, the number of cells/plate on days 10 and 15 was taken to be equivalent to the maximum reached during the course of the growth curve.
Figure 3.

Cell sizes of L6 transfectants corresponding to the growth curve data of Fig. 2. Cell diameters, as determined by pulse height analysis of particle count data, are shown.
On day 5, cultures expressing ectopic Myc alone began to acidify the medium and display cell death. Coincident with this, marked cell elongation and alignment and the formation of multinucleated myotubes were also apparent. These changes are reflected in the complete loss of viability as measured by colony-forming ability after 15 d in culture (Fig. 2, inset) and in the increase in average size of M cells nearing saturation (Fig. 3). To investigate the effect of v-Myc on differentiation, P and M cells were tested in two different assays in which serum growth factors become limiting. First, we quantified the effect of growth factor depletion in the nonproliferating centers of cell colonies (Fig. 4). 75% of M colonies, obtained by plating viable M cells from the exponential growth phase, showed myotubes in their centers after 10 d of incubation in GM, whereas P colonies showed no myotubes under these conditions (Fig. 4), thus indicating a dramatic increase in the propensity for differentiation. Second, cells were seeded directly into DM and stained 4 d later. In spite of significant cell loss that reduced the cell density of M cultures, M cells formed myotubes; in this case P cells, as expected, readily differentiated (Fig. 5 A, compare M and P).
Figure 4.


Differentiation in the nonproliferating centers of cell colonies. (A) Photomicrographs of colonies arising from cells seeded at clonal density and grown for 10 d in GM. Representative parental (P) and v-Myc+ (M) colonies, showing the presence of myotubes in the centers of only v-Myc+ colonies. (B) Lower magnification of plates from (A). (C) The percentage of colonies showing myotubes. Colonies arising after 10-d incubations in GM were scored for the presence of myotubes. Average results for two, and for some lines three, experiments are shown. The plating efficiencies for colony formation varied from 50 to 92% between individual experiments and varied no more than 10% between cell lines in a given experiment. Bar: (A) 0.4 mm; (B) 1.7 mm.
Figure 5.


Effects of v-Myc, Bcl-2, and CEA on culture density and differentiation. (A) Photomicrographs of cultures seeded directly in DM and incubated for 4 d. (B) Photomicrographs of P, C, MB, and MC cultures incubated for 4 d in DM showing immunofluorescence with anti-myosin antibody and of corresponding fields by phase contrast. Bar: (A) 180 μm; (B) 36 μm.
The increased cell mortality in response to depletion of growth factors was suggestive of an apoptotic response, as seen with Rat-1 fibroblasts overexpressing c-myc (Evan et al., 1992). To maximize cell death and minimize myotube formation, cells were grown in GM until one day before confluence, when the medium was changed to DM. After 24 h of incubation in DM, 40% of subconfluent M cells compared to 6% of P cells displayed condensed chromatin and damaged nuclei, hallmarks of apoptotic cell death as confirmed by electron microscopy (Fig. 6) by the degradation of DNA into discrete bands visible as a “ladder” on electrophoretic gels (data not shown) and by the fact that coexpression of Bcl-2 abrogated the myc-induced increase. The remaining M cells were sparse but multinucleated, indicative of myogenic fusion (Fig. 5 A).
Figure 6.


Frequency of apoptosis of L6 transfectants in DM. (A) Electron micrograph showing chromatin condensation and compaction at the periphery of the nuclear membrane characteristic of apoptosis in L6 v-Myc+ cells incubated under low serum conditions. (B) The percentage of nuclei in L6 transfectant cultures demonstrating chromatin condensation when stained with orcein. Subconfluent cultures in GM were washed and incubated in DM for 24 h before fixation and staining with orcein. Results are representative of several independent experiments. Two cell suspensions and three fields per cell suspension were scored, and the results were averaged. Photomicrographs of subconfluent (C) parental L6 and (D) v-Myc+ cells stained with orcein showing condensation of chromatin and damaged nuclei (arrows) in v-Myc+ cells. Bar: (A) 4 μm; (C and D) 40 μm.
The transformation potential of M cells was determined in vitro using a soft agar assay to assess the loss of anchorage dependence of growth. M cells formed colonies in soft agar with an efficiency of 1%, whereas P cells were incapable of anchorage-independent growth (Table I). No macrocolonies of >500 cells were formed by either P or M cells. Thus, v-Myc alone does not induce a highly transformed phenotype, consistent with previous results of Falcone et al. (1985) with v-Myc transformed quail myoblasts. Moreover, v-myc expression had no effect on the latency of tumor formation in nude mice (see Fig. 9). We hypothesized that the failure of v-Myc to enhance transformation and tumorigenicity was due to the differentiation and death responses observed in v-myc–expressing myoblast monolayer cultures in depleted GM or in DM, which would compound the effect of decreasing local growth factor concentrations during colony growth. From these data we conclude that v-Myc stimulates the cell cycle “engine” of L6 cells, yet the concomitant increase in the potential to differentiate or die aborts full transformation.
Table I.
Anchorage Independent Growth of L6 Transfectants and Derived Macrocolony (m) and Tumor (t) Lines
| Plating efficiency | ||||
|---|---|---|---|---|
| (%) | ||||
| Cell line | >100 cells | >500 cells | ||
| P | 0.0 | 0.0 | ||
| M | 1.0 | 0.0 | ||
| B | 0.1 | 0.0 | ||
| C | 0.2 | 0.05 (1) | ||
| MB | 0.3 | 0.0 | ||
| BC | 0.3 | 0.10 (4) | ||
| MC | 1.1 | 0.03 (1) | ||
| MBC | 0.2 | 0.03 (11) | ||
| C-m | 7.5 | 3.3 | ||
| BC-m | 4.0 | 0.5 | ||
| MBC-m1 | 27 | 8.9 | ||
| MBC-m2 | 52 | 23 | ||
| MBC-m3 | 0.03 | 0.0 | ||
| MBC-m4 | 6.6 | 1.7 | ||
| MBC-mpool#1 | 35 | 12 | ||
| MBC-mpool#2 | 18 | 12 | ||
| P-t | 13 | 5.6 | ||
| C-t | 6.5 | 1.9 | ||
| B-t | 0.3 | 0.0 | ||
| BC-t | 18 | 8.7 | ||
| MB-t | 0.4 | 0.07 | ||
| MBC-t | 10 | 1.2 | ||
| MBC-m2-t | 51 | 22 | ||
| MBC-mpool#1-t | 39 | 9.3 | ||
Efficiencies for anchorage independent colony growth of L6 transfectants and derivative macrocolony (-m) and tumor (-t) cell lines. 103 cells were seeded in each of three replicate dishes in 0.3% agar in GM, and colonies of >100 and >500 cells (macrocolonies) were counted after incubation for 4 wk. Results for the first eight lines shown (from P to MBC) represent the average of two to six independent determinations; the bracketed figures represent the total number of macrocolonies seen in all experiments. MBC-mpool#1 was composed of an equal ratio of MBC-m1 through MBC-m4. MBC-mpool#2 was composed of three independent macrocolony cell lines, MBCm5, -m6, and -m7 (not shown). MBC-m3 failed to form colonies with increased efficiency. Tumor (-t) cell lines were obtained by explantation of tumor cell suspensions and selection for cells capable of growth in vitro in the presence of appropriate selective drugs.
Figure 9.

Tumorigenicity of L6 transfectants. The average latent period in weeks of the different transfectant cell lines for tumor formation is displayed as solid bars. Results represent the average of two separate experiments. MBC-m is a cell population generated by pooling four different MBC macrocolonies isolated from soft agar and is termed MBC-mpool#1 in Table I.
Bcl-2 Expression Blocks Myc-induced Apoptosis and Promotes Cell Overgrowth
In fibroblast cultures overexpressing c-myc, bcl-2 expression can delay cell death for several days (Bissonette et al., 1992; Fanidi et al., 1992; Wagner et al., 1993; Zhu et al., 1996). Therefore, to circumvent cell death and to consolidate the stimulation of proliferation induced by v-Myc in GM we introduced human bcl-2 into parental and v-myc– expressing lines and selected for total populations of cells stably expressing bcl-2 (B) and both v-myc and bcl-2 (MB). Bcl-2 expression was verified by immunoblot analysis (Fig. 1 B). In the L6 system, Bcl-2 did not alter the division rates of P or M cells (Fig. 2, inset, compare P and B, M and MB). However, a striking increase in cell saturation density and long term retention of colony forming ability was observed in all cell populations expressing bcl-2 (Fig. 2, inset, compare M and MB). This was presumably affected by blocking v-Myc–induced apoptosis and by a reduction in acidification of the medium (Table II). These more benign culture conditions promoted further cell proliferation beyond normal serum growth factor-limited saturation density resulting in a smaller cell size (Fig. 3). The percentage of subconfluent cells displaying chromatin condensation after 24 h in DM is shown in Fig. 6 B. MB cells demonstrated only 5.5% damaged nuclei (compared with M at 40%), indicating complete suppression of M cell death by coexpression of bcl-2. Since P and B cells show the same low level of apoptosis (Fig. 6 B, and data not shown), the effect of Bcl-2 in stimulating division at confluence (Fig. 2, compare P and B) is presumably not a consequence of attenuated cell loss. We conclude that Bcl-2 blocks apoptosis and independently allows further cell division of L6 cells in GM.
Table II.
Medium pH of L6 Transfectants
| Cell line | pH | ΔpH | ||
|---|---|---|---|---|
| Medium | 7.54 | — | ||
| P | 7.71 | +0.17 | ||
| M | 6.89 | −0.65 | ||
| MB | 7.50 | −0.04 |
Bcl-2 prevents v-Myc acidification of culture medium. pH values were determined for pooled medium (GM) from 10 individual plates after 9 d of the growth curve shown in Fig. 2.
To investigate the effects of Bcl-2 on differentiation, P, B, and MB cells were tested in the low serum assays. Bcl-2 alone did not disrupt myotube formation in monolayer culture (Fig. 5), but bcl-2 coexpression with v-myc reduced the increased fusion index of M in the clonal assay from 75 to 19% (Fig. 4). MB myotubes were smaller and more densely packed than parental myotubes, making them more difficult to identify (Fig. 5 A). The majority of MB cells expressed myosin, however (Fig. 5 B). bcl-2 expression can therefore abrogate apoptosis induced by v-Myc, but differentiation is allowed to proceed. In fact, the superposition of Bcl-2 did not increase the efficiency of colony formation of P or M cells in soft agar (Table I), and MB cells showed a reduction in latency for tumor formation of only a few weeks (see Fig. 9). We attribute this to the persistence of differentiation in B and MB cell populations. In fact, MB tumors contained many myosin-positive cells, indicating extensive differentiation (Ordonez, C., R.A. Screaton, and C.P. Stanners, unpublished observations).
CEA Blocks Differentiation and Maintains Proliferative Potential of L6 and C2 Myoblasts
To affect complete transformation of L6 myoblasts by Myc and Bcl-2, a gene product that could block myogenic differentiation was required. We previously reported that CEA could provide a complete block of both morphological and biochemical myogenic differentiation of L6 cells while leaving the cells with proliferative potential (Eidelman et al., 1993). We decided first to characterize the cell biology of CEA-expressing L6 cells, to check for the generality of the phenomenon in another myogenic cell line, and finally to superimpose CEA on MB cells to determine whether this combination of genes would result in full malignant transformation. To this end, L6 rat and C2 mouse myoblasts were transfected with expression vectors containing CEA cDNA (Beauchemin et al., 1987) by calcium phosphate precipitation. Stable transfectant L6 and C2 total cell populations were enriched for cell surface CEA by cytofluorometric sorting after labeling with anti–human CEA antibody. These total transfectant populations (L6C or C, C2C) and individual clones (L6C-1) were analyzed for CEA expression by FACS analysis (Fig. 7, A and C). The levels of cell surface expression of CEA were within the range seen by FACS analysis of purified colonocytes from freshly excised human colon carcinomas (Ilantzis et al., 1997).
Figure 7.

CEA transfectants of L6 and C2 myoblasts retain division potential in DM. FACS profiles (A) of parental rat L6 cells (P), CEA transfectant clone (C-1) and CEA total transfectant population (C), and (C) mouse C2 and CEA transfectant total population (C2C) labeled with rabbit anti–human CEA antibodies. In all cases, anti-CEA immunoreactivity was detected using goat anti–rabbit FITC-conjugated antibody, as described in Materials and Methods. (B) L6 and (D) C2 cells expressing CEA retain division potential in DM, as measured by their ability to form colonies in GM. Cells were seeded in GM on day −3, and the medium was changed to DM on day 0. To calculate percentage viability, colony numbers were normalized to values obtained on day 2 in GM (day −1 in DM). Fusion indices are shown by dotted lines.
The ability of L6C-1 and C2C myoblasts to differentiate terminally was evaluated by determining the percentage of nuclei present in myotubes with increasing time in DM (Fig. 7, B and D). On day 7 in DM, L6 cells demonstrated a maximum fusion index of 85%. C2 cells acidified DM more rapidly than L6 cells and by day 7 in DM were detaching from the plate. On day 5 in DM, however, C2 cells showed a fusion index of 57%. In contrast, cultures of both L6 and C2 cells stably expressing cell surface CEA showed dramatically reduced fusion indices; in fact, L6C and L6C-1 cells showed no myotube formation whatsoever (Figs. 5 and 7 B, and data not shown). L6C-1 (Fig. 7 B) and C2C (Fig. 7 D) myoblasts retained the ability to form colonies at high efficiency when seeded in GM, even after culture for several weeks in DM (data not shown). In DM, L6C-1 cells fail to express myogenin mRNA (Eidelman et al., 1993), and both L6C-1 and C2C cells did not express myosin (Rojas et al., 1996; Fig. 5 B, and data not shown). Thus myoblasts expressing CEA cannot access even the earliest stages of the parental differentiation program.
CEA Induces a Reversible G0 Arrest in DM
To determine the characteristics of the cell cycle arrest effected by CEA, cells from L6C-1 cultures incubated for increasing time in DM were harvested, stained with propidium iodide, and their nuclear DNA content analyzed by cytofluorometric analysis. Fig. 8 shows that the L6C-1 cells arrested exclusively with a postmitotic, preDNA synthetic G1 DNA content. Furthermore, upon addition of FBS (20%) or PDGF-BB (not shown) to these cells on day 9 in DM, DNA replication was reinitiated with a lag of 18 h (Fig. 8). The length of the 18 h lag period was unchanged after an additional 7 d (not shown), suggesting that L6C-1 cells reach a quiescent state after 9 d that does not deepen with increasing time in DM. The length of a normal G1 phase was calculated from FACS profiles of DNA content of exponentially growing L6C-1 cells, by determining the percentage of cells in either G1, S, or G2/M (Stanners and Till, 1960), giving a value of 9.6–10.0 h. A lag of 18 h therefore represents an 8 h prolongation of the normal G1 period and suggests that L6C-1 cells enter a G0-like quiescent state on or before day 9 in DM. Thus CEA expression appears to induce cells to enter a viable, reversible G0-like quiescent state that is incompatible with differentiation and permanent cell cycle withdrawal. Such a state should be susceptible to oncogenic activation.
Figure 8.
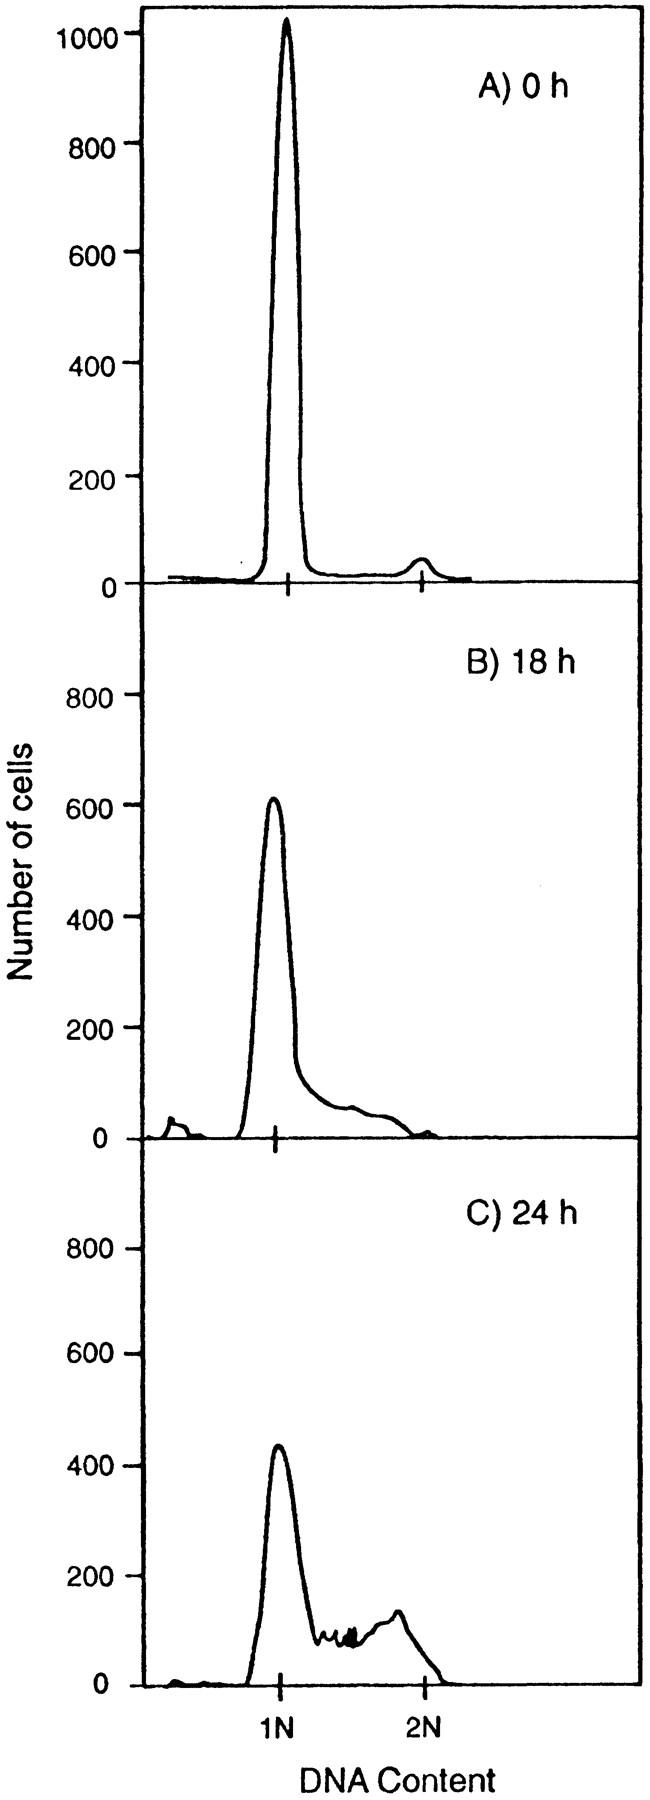
L6C-1 cells enter a viable quiescent state in DM. Flow cytofluorometric profiles of DNA content of L6 and L6C-1 nuclei stained with propidium iodide. (A) After 9 d in DM, cells were stimulated by the addition of 20% FBS and harvested (B) 18 h and (C) 24 h later. Cells were lysed with 0.1% Triton X-100 in 0.1% sodium citrate supplemented with 10 μg/ml RNase and stained with 50 μg/ml propidium iodide. DNA content of the nuclear suspensions was determined by FACS analysis.
CEA, in Concert with Myc and Bcl-2, Leads to Full Transformation
Effect on Growth Parameters.
We next tested the effect of CEA expression alone (C) and in combination with v-Myc and Bcl-2 (MC, BC, and MBC) on the growth behavior, transformation, and tumorigenicity of the transfectant cells. The presence of CEA, unlike v-Myc, increased the doubling time of L6 cells, i.e., slowed the cell cycle, increased the average cell size, and decreased initial saturation density (Figs. 2, inset, and 3). After prolonged culture, however, CEA caused a surprising slow rise in saturation density for C, BC, and MBC but not MC cultures (Fig. 2, inset). This effect was not due to a loss of cell surface CEA expression as CEA levels remained unchanged during the course of the growth cycle (data not shown). CEA did not alter the increase in proliferation rate or the stimulation of apoptosis induced by v-Myc (compare MC with M in Figs. 2 and 6 B) but did, however, override the stimulatory effect of v-Myc in stationary phase by reducing the initial culture saturation density (Fig. 2, compare MC with M).
When CEA expression was superimposed on MB cells (MBC), the doubling time was shorter and typical of M cells (Fig. 2, inset), confirming the overriding effect of v-Myc. The effect of Bcl-2 to annul the v-Myc–induced increase in apoptosis was also preserved (Fig. 6 B, compare MB and MBC), as was the ability of both Bcl-2 and CEA to increase saturation density (Fig. 2, inset). However, CEA profoundly modified the effects of v-Myc in confluent serum-limited conditions by blocking the enhanced differentiation phenotype (Fig. 5). In the growth (Fig. 2), colony (Fig. 4), and low serum (Fig. 5) assays, the presence of CEA in every population of transfectants, regardless of the presence of v-Myc and/or Bcl-2, completely prevented differentiation as measured by the appearance of multinucleated and/or myosin-positive cells. Thus the Myc, Bcl-2, and CEA combination seemed to endow L6 cells with the requisite attributes for full transformation. We tested this supposition directly using soft agar and tumorigenicity assays.
Effect on Transformation.
CEA expression neither conferred anchorage independence upon L6 cells when expressed alone nor interfered with the low-level soft agar colony formation induced by v-Myc (Table I). However, MBC cells produced rare macrocolonies (>500 cells) in soft agar which did not form in MB plates. These MBC macrocolonies (MBC-m), when rendered single cells and reintroduced into soft agar, bred true with an efficiency for colony formation ranging from 7 to 78% (Table I, and data not shown). It seemed possible that the macrocolonies could represent a minority of the MBC population with a particular set of heritable expression levels for the three transfected gene products that allowed rapid growth in soft agar and tumorigenicity in nude mice. Whereas this hypothesis is impossible to rule out completely, we consider it unlikely since, for CEA at least, nonheritable variation in expression levels in individual cells exceeds by far any heritable variability we have been able to reveal by cloning or FACS sorting. Furthermore, MBC-m and tumor-derived cell lines did not show an increase in the levels of expression of v-Myc and Bcl-2 by immunoblot analysis (data not shown). Thus we suggest that MBC-m cells represent members of the population with additional inherited changes endowing them with the ability to grow more efficiently when deprived of anchorage. Interestingly, very rare macrocolonies were also observed on plates seeded with cells other than MBC but only with C, BC, or MC cells, i.e., cells expressing CEA, regardless of the other genes expressed. These macrocolonies, when picked and replated, also bred true (Table I), indicating again the presence of further heritable transforming lesions. The expression of CEA thus greatly facilitates the emergence of cells bearing such lesions.
Effect on Tumorigenicity.
Tumorigenicity was assessed by injection of cells into the thigh muscles of nude mice (Fig. 9). Interestingly, shorter latent periods were seen for all cell types expressing CEA (Fig. 9, compare P with C, B with BC, and MB with MBC), indicating that the presence of CEA favors a more rapid emergence of malignant cells. In fact, the presence of CEA alone was capable of reducing the tumor latent period by 50%. This effect was highly statistically significant (P < 0.0005 for P vs. C, n = 6; P < 0.01 for B vs. BC, n = 6; P < 0.0005 for MB vs. MBC, n = 8) and agrees with the observation that soft agar macrocolonies were observed only for cell lines expressing CEA, as noted above. The tumors were examined for their gross morphology and microscopic histology. Cell lines capable of differentiation in vitro retained this property in the tumors they formed (Ordonez, C., R.A. Screaton, and C.P. Stanners, unpublished results). Tumors produced by C and BC cells appeared within 8 wk but grew slowly and were contained within the leg muscle (not shown); each consisted of an amorphous mass of nondifferentiated cells. MB, MBC, and MBC-m tumors migrated out of the site of injection to the muscle surface (not shown), indicating a more aggressive phenotype associated with v-Myc.
The question arose whether the tumors, especially those with extended latent periods, were composed of cells that possessed additional genetic lesions selected for during the growth period in vivo. To test for this, isolated tumors were rendered suspensions of single cells by collagenase treatment and evaluated for their resistance to the cytotoxic agent(s) used to isolate the original transfectants. A high percentage of the cells derived from tumors demonstrated resistance with the expected specificity. The drug resistant cells were subsequently tested for anchorage independence of growth. Nearly all, except for those produced by MBC-m cells, showed an increase in plating efficiency for colonies and macrocolonies in soft agar (Table I), implicating selection for preexisting or additional genetic changes during tumor growth. Finally, there is the question whether the MBC-m clones picked from soft agar themselves exhibited maximum tumorigenicity. Both drug resistant cells selected from excised MBC-m tumors and the original MBC-m cells used to produce them were reinjected intramuscularly into nude mice. A small but statistically insignificant decrease in latency was observed for the tumor-derived cells (not shown). When tested for growth characteristics in GM, a progressive increase in saturation density (MBC-m-t > MBC-m > MBC) was noted, indicating a step-wise evolution of the transformed phenotype (not shown).
Discussion
The prevailing view of tumorigenesis holds that conversion from a normal to a completely transformed phenotype involves a series of oncogenic events (Weinberg, 1989). Since overexpression of CEA represents a major phenotypic change in a wide variety of human cancers, its potential contribution to malignant progression represents a significant question. To directly test the contribution of CEA expression to tumor progression in vivo, L6 myoblasts were used as a model system, as they possess both proliferation and differentiation potential. The experiments described here provide evidence that CEA can be considered the prototypic member of a novel class of oncogene. Overexpression results in prolonged cell survival, in a manner distinct from bcl-2, by the dominant inhibition of terminal differentiation allowing for the outgrowth of variants bearing genetic alterations, conferring further growth advantage and subsequent transformation.
The Role of Myc
Deregulated expression of the c-myc gene has been implicated in many types of human cancer (Spencer and Groudine, 1991), and this, in addition to the observed mitogeninduced changes in c-myc expression (Kelly et al., 1983) and the requirement for c-myc for the G1–S transition, strongly supports the model that this transcriptional regulator is central to the control of cellular proliferation. When v-myc, whose phenotypic and molecular effects have been found to mimic c-myc (Penn et al., 1990), was expressed in proliferating L6 cells, a reproducible decrease in the cellular doubling time and a higher maximum cell density were noted. Although the observed decrease in doubling time was relatively small, it would quickly result in the elimination of P cells in an exponentially increasing mixed population of P and M cells. These effects could be due to a more efficient use of serum growth factors by v-myc–expressing cells than the parental cells, allowing for more rapid cell growth, further cell division beyond normal saturation, and the production of smaller cells (Figs. 2 and 3).
Two additional cellular responses were also greatly stimulated by v-myc: apoptosis and myogenic differentiation. These anti-transforming effects were apparent when growth factors became limiting and were presumably responsible for the failure of M cells to form colonies efficiently in soft agar or to reduce the latency of tumor formation. The commonly observed effect of c-myc triggering apoptosis (Bissonnette et al., 1992; Evan et al., 1992; Fanidi et al., 1992; Hermeking and Eick, 1994; Wagner et al., 1994) is thus duplicated with v-myc in this system. Inhibition of myogenic differentiation at the morphological (Falcone et al., 1985; Crescenzi et al., 1994; La Rocca et al., 1994) or biochemical (Falcone et al., 1985; Denis et al., 1987; La Rocca et al., 1994) level by Myc, however, has been reported by most observers under differentiation conditions. Thus, our observation of a dramatic stimulation of differentiation appears to be unique. We feel that these differences with our findings could be due to systemdependent differences in the balance between Myc-induced apoptosis and differentiation, which both require reduced growth factor concentrations for execution. Our results are not due to a coincidence of myotube formation in a subpopulation of M cells that escaped apoptosis, since the M population formed colonies with high efficiency in GM, and 75% of these showed differentiation. This represented a very significant stimulation of differentiation relative to the parental cells, which showed 0% differentiated colonies under the same conditions (Fig. 4).
The Role of Bcl-2
The superposition of bcl-2 expression on L6 cells producing v-Myc had no effect on the acceleration of cell division induced by v-Myc (Fig. 2, inset) but completely suppressed apoptosis (Fig. 6 C). This is consistent with results from other systems, as overexpression of c-myc in cultured fibroblasts can induce both accelerated proliferation and apoptosis (Evan et al., 1992), with the latter being delayed by coexpression of bcl-2 (Bissonnette et al., 1992; Fanidi et al., 1992; Wagner et al., 1993). Our results further indicate a transforming activity of Bcl-2 in addition to its ability to inhibit apoptosis. L6 cells expressing bcl-2 alone reach higher saturation densities than the parental line (Fig. 2, inset), independent of any effect on cell death (Fig. 6 B). In the colony assay, MB colonies on average were twice the size of M colonies (not shown). In addition, cultures of L6 cells expressing bcl-2, regardless of the other oncogenes present, remained viable for prolonged culture periods without medium change (Fig. 2). This evidence, together with the growth characteristics of these lines (Fig. 2), suggests that Bcl-2 lowers the serum requirement for further cell division at normal saturation and, in v-Myc+ cells, blocks apoptosis allowing for their overgrowth in increasingly limiting serum. Positive effects of bcl-2 expression on cell growth parameters have been previously reported for 3T3 fibroblasts (Reed et al., 1991) and pro-B cells (Miyazaki et al., 1995). Interestingly, the Bcl-2–mediated block of apoptosis coincided with a failure to rapidly acidify the culture medium (Table II). The role of medium acidification in v-Myc–induced apoptosis in L6 cells is currently under investigation.
B cell directed expression of c-myc and bcl-2 together in transgenic mice resulted in the formation of monoclonal tumors (Strasser et al., 1990). By contrast, L6 cells expressing both v-myc and bcl-2 were not fully transformed, as they were unable to form normal-sized colonies in soft agar and did not give rise to any larger macrocolonies (Table I). We attribute this failure to the persistence of differentiation, thus abrogating the emergence of variants with more transformed properties. When tested in vivo, a significant but relatively small reduction in tumor latent period by MB cells was noted relative to M or B cells, though MB tumors were found to contain many differentiated cells (Fig. 9, and Ordonez, C., R.A. Screaton, and C.P. Stanners, unpublished observations).
The Role of CEA
We have shown previously that ectopic cell surface CEA expression by L6 myoblasts blocks entry to the myogenic differentiation program at a very early stage, i.e., before the upregulation of the myogenic transcriptional regulator, myogenin (Eidelman et al., 1993). Cells expressing CEA alone were slowed in their division rate and reached lower initial saturation densities (Fig. 2). In cells producing both CEA and v-Myc, v-Myc was dominant in accelerating cell proliferation but succumbed to the effects of CEA at confluence. We suggest that these effects of CEA are due to an increase in the probability in DM of cells entering a G0-like state from the G1 period of the cell cycle (Figs. 7 and 8). Since the parental cells tend to differentiate under these conditions, it is difficult to determine whether this state is entirely novel or a state transiently traversed by the parental cells during their passage to differentiation. CEA was confirmed to block differentiation in this study and was dominant over the differentiation stimulating effect of v-Myc in MC cells, blocking differentiation completely.
Cells expressing v-myc, bcl-2, and CEA together possessed all of the properties expected to yield a fully transformed phenotype: a higher division rate, a higher saturation density, reduced apoptosis, no differentiation, and long term survival (Figs. 2 and 4–6) yet did not produce colonies in soft agar with high efficiency (Table I). MBC cell populations did, however, contain cells at low frequency capable of producing very large anchorage independent macrocolonies which, when picked and dispersed, bred true, forming macrocolonies with high efficiency (Table I). Interestingly, macrocolonies were found in all cell cultures in which CEA was expressed: MBC, MC, BC, and even C cell populations (Table I). These variants also seemed to be responsible for the formation of tumors, since the latent periods for tumor formation were lowest for cell lines containing them (Fig. 9), the cells selected for during tumor growth were highly enriched for them (Table I), and pure populations of variant cells showed the lowest tumor latency.
“Fertile Soil” Hypothesis
From these results, we suggest that CEA expression accelerates progression towards transformation and increased tumorigenicity by blocking terminal differentiation, thus providing a “fertile soil” for the emergence of cellular variants with increased proliferative potential. Indeed, after reaching an initial stationary phase, all cell lines expressing CEA tend to increase slowly in cell number (Fig. 2), indicating an increased sensitivity to proliferative stimuli. CEA-expressing cell lines also accumulate tumorigenic macrocolony-producing cells, as noted above. The nature of the heritable changes giving rise to macrocolonies is presently unknown. Bcl-2 has also been suggested to provide a cellular state conducive to the emergence of more autonomous variants, yet accomplishes this by a fundamentally different mechanism, i.e., by the suppression of apoptosis. In transgenic mice, ectopic bcl-2 expression alone does not directly result in tumors (McDonnell et al., 1989) yet generates a population of quiescent cells that possesses oncogenic potential, perhaps as a consequence of extended survival (McDonnell and Korsmeyer, 1991). In the L6 system, however, Bcl-2 was relatively ineffective in promoting the emergence of variants or decreasing tumor latency. Thus CEA seems to posess a novel oncogenic activity, with a distinct mechanism from Bcl-2 for the induction of a long term viable quiescence (Fig. 10).
Figure 10.

Model showing integrated effects of Myc, Bcl-2, and CEA. Postmitotic cells in the presence of serum growth factors (GF) pass through G1 and reenter S phase; at high GF levels, Myc drives cells into S, reducing the length of the G1 period. At low GF levels, Myc will activate both myogenic differentiation from G1/G0 and apoptosis (not restricted to G1); under these conditions Bcl-2 may promote further cycling. Coexpression of Bcl-2 with Myc blocks apoptosis. CEA prevents normal and Myc-induced differentiation and directs cells into a viable, reversible quiescent state that prolongs survival. Stimulation with growth factors or activation of an additional oncogene(s) thus can drive CEA-expressing cells back into cycle.
Relevance In Vivo
CEA is expressed at low levels in the proliferative zone of the colonic crypt epithelium in normal adult colonocytes (Ahnen et al., 1987; Jothy et al., 1993). As colonocytes differentiate, losing division potential, they migrate up the sides of the crypt towards the lumen of the gut. During this process, CEA is upregulated on the luminal (apical) surface of these cells (Ahnen et al., 1987; Jothy et al., 1993). Our present model outlining a possible role for CEA in colon tumorigenesis contends that overproduction of CEA over the entire surface of colonocytes that still possess division potential, i.e., out of the context of a normal cellular differentiation program, could result in such cells retaining inappropriate proliferative capacity. The intercellular adhesion activity of CEA could lead to the disruption of normal cell–cell and cell–substratum interactions that are presumably required both for the maintenance of tissue architecture and for faithful completion of colonocyte differentiation (Benchimol et al., 1989). By disrupting cell– cell interactions expected to be important for normal differentiation, CEA-positive cells would experience extended survival and remain open to further growth stimuli or oncogenic activation.
Perhaps the most relevant system for examining the effect of CEA is therefore the human colonic epithelium where CEA family members, CEA, nonspecific cross-reacting antigen, and biliary glycoprotein, undergo dramatic changes in expression during carcinogenesis (Cournoyer et al., 1988; Boucher et al., 1989; Hinoda et al., 1991; Neumaier et al., 1993). The technical complexity and poorly defined differentiation process of the colonic system, however, renders it less amenable to experimental investigation in vitro. The results presented in this work refer to a myoblast model system chosen for ease of experimentation and interpretation and with assumed relevance to systems where CEA is naturally expressed. The results, which support the above hypothesis, are not species or cell line specific in that the basic observation of the induction of a viable quiescent cellular state in which myogenic differentiation is blocked was extended to mouse C2 myoblasts (Fig. 7). We are currently investigating the effect of CEA expression on other differentiating systems.
The validity of the use of the myoblast system is supported by our recent observations that CEA and nonspecific cross-reacting antigen, both of which block myogenic differentiation (Eidelman et al., 1993; Rojas et al., 1996), are upregulated on the surface of purified colon carcinoma cells relative to normal colonocytes from the same patient and at levels inversely related to the degree of differentiation, while biliary glycoprotein, which has no effect on myogenic differentiation (Rojas et al., 1996), shows no increase in expression (Ilantzis et al., 1997). An upregulation of CEA was also observed in early dysplastic lesions of the colon (Ilantzis et al., 1997). Interestingly, both bcl-2 upregulation (Bedi et al., 1995; Bosari et al., 1995; Sinicrope et al., 1995) and myc overexpression (Guillem et al., 1995, and references therein) have been reported to be involved in a high proportion of human colon adenomas and carcinomas.
The effect of CEA on myogenesis is similar to that of oncogenic forms of H-ras and N-ras (Olson et al., 1987), as the block in differentiation is not dependent on aberrant proliferation. A major difference in the effects of CEA and ras, however, is the reduction in saturation density mediated by CEA (Fig. 2, inset), which precludes placing CEA and ras in the same category of oncogene. As the CEA effect is reversible by supplementing DM with peptides corresponding to the CEA adhesion domains (Eidelman et al., 1993), it is tempting to speculate that the CEA– CEA interaction may interfere directly with intracellular signaling events required for activation of the myogenic differentiation program. In fact, we have shown that CEA can signal through its GPI anchor to phosphorylate Src family kinases and other cellular proteins (Draber, P., unpublished observations) and that the GPI anchor is absolutely required for the inhibitory effect on myogenic differentiation (Screaton, R.A., and C.P. Stanners, unpublished observations).
CEA: A Dominant Differentiation-blocking Oncogene?
Can CEA be considered an oncogene? Often protooncogenes are found to comprise ubiquitous elements of the cell proliferation or differentiation machinery (Hunter, 1991; 1993). CEA does not have a known counterpart within the genomes of oncogenic viruses and does not possess overt transforming properties in cultured cells. Does CEA function as an inducer of quiescence in normal growth control of all cells? The restricted expression pattern of CEA makes this unlikely. However, CEA could be used as an explicit (as opposed to ligand controlled) differentiation block during embryonic development, in situations where cells are required to remain associated in undifferentiated collectives. We suggest that inappropriate expression of CEA in adult life in cells with both proliferation and differentiation capacity promotes survival in the presence of differentiation stimuli, thus facilitating the acquisition of progressive mutations. We therefore propose that CEA defines a new class of gene with dominant, differentiation-blocking oncogenic activity.
Acknowledgments
We thank Faizan Alawi for the isolation of C2 (CEA) transfectants, Kathy Hewitt for electron microscopy, Luisa DeMarte for technical assistance, and Anthony Sharpe for the preparation of tissue culture medium. We would also like to thank Dr. Jerry Pelletier and Dr. John Silvius for critical reading of the manuscript.
This work was supported by grants from the National Cancer Institute of Canada and the Medical Research Council of Canada to C.P. Stanners and from the Medical Research Council of Canada to L.Z. Penn. R.A. Screaton was supported by a Studentship from the Research Institute of the Royal Victoria Hospital, Montreal, Canada.
Footnotes
1. Abbreviations used in this paper: CEA, carcinoembryonic antigen; DM, differentiation medium; GM, growth medium.
Please address all correspondence to C.P. Stanners, McGill Cancer Centre, 3655 Drummond St., Montreal, Quebec, Canada H3G 1Y6. Tel.: 514398-3535; Fax: 514-398-6769.
References
- Adams JM, Harris AW, Pinkert CA, Corcoran LM, Alexander WS, Cory S, Palmitter RD, Brinster RL. The c-myconcogene driven by immunoglobulin enhancers induces lymphoid malignancy in transgenic mice. Nature (Lond) 1985;318:533–538. doi: 10.1038/318533a0. [DOI] [PubMed] [Google Scholar]
- Ahnen DJ, Kinoshita K, Nakane PK, Brown WR. Differential expression of carcinoembryonic antigen and secretory component during colonic epithelial cell differentiation and in colonic carcinomas. Gastroenterology. 1987;93:1330–1339. doi: 10.1016/0016-5085(87)90263-0. [DOI] [PubMed] [Google Scholar]
- Alema S, Tato F. Oncogenes and muscle differentiation: multiple mechanisms of interference. Semin Cancer Biol. 1994;5:147–156. [PubMed] [Google Scholar]
- Averbach, A.M., and P.H. Sugarbaker. 1995. Use of Tumor Markers and Radiologic Tests in Follow-up. In Cancer of the Colon, Rectum and Anus. A.M. Cohen and S.J. Winawer, editors. McGraw-Hill, New York. 725–751.
- Beauchemin N, Benchimol S, Cournoyer D, Fuks A, Stanners CP. Isolation and characterization of full-length functional cDNA clones for human carcinoembryonic antigen. Mol Cell Biol. 1987;7:3221–3230. doi: 10.1128/mcb.7.9.3221. [DOI] [PMC free article] [PubMed] [Google Scholar]
- Bedi A, Pasricha P, Akhtar AJ, Barber JP, Bedi GC, Giardiello FM, Zehnbauer BA, Hamilton SR, Jones RJ. Inhibition of apoptosis during development of colorectal cancer. Cancer Res. 1995;55:1811–1816. [PubMed] [Google Scholar]
- Benchimol S, Fuks A, Jothy S, Beauchemin N, Shirota K, Stanners CP. Carcinoembryonic antigen, a human tumor marker, functions as an intercellular adhesion molecule. Cell. 1989;57:327–334. doi: 10.1016/0092-8674(89)90970-7. [DOI] [PubMed] [Google Scholar]
- Bissonnette RP, Echeverri F, Mahboubi A, Green DR. Apoptotic cell death induced by c-myc is inhibited by Bcl2. Nature (Lond) 1992;359:552–554. doi: 10.1038/359552a0. [DOI] [PubMed] [Google Scholar]
- Bosari S, Moneghini L, Graziani D, Lee AKC, Murray JJ, Coggi G, Viale G. bcl-2 oncoprotein in colorectal hyperplastic polyps, adenomas, and adenocarcinomas. Hum Pathol. 1995;26:534–540. doi: 10.1016/0046-8177(95)90250-3. [DOI] [PubMed] [Google Scholar]
- Boucher D, Cournoyer D, Stanners CP, Fuks A. Studies on the control of gene expression of the carcinoembryonic antigen family in human tissue. Cancer Res. 1989;49:847–852. [PubMed] [Google Scholar]
- Braun T, Bober E, Arnold HH. Inhibition of muscle differentiation by the adenovirus E1a protein: repression of the transcriptional activating function of the HLH protein Myf-5. Genes Dev. 1992;5:888–902. doi: 10.1101/gad.6.5.888. [DOI] [PubMed] [Google Scholar]
- Cournoyer D, Beauchemin N, Boucher D, Benchimol S, Fuks A, Stanners CP. Transcription of the genes of the carcinoembryonic antigen family in malignant and nonmalignant tissues. Cancer Res. 1988;48:3153–3157. [PubMed] [Google Scholar]
- Crescenzi M, Crouch DH, Tato F. Transformation by myc prevents fusion but not biochemical differentiation of C2C12 myoblasts: mechanisms of phenotypic correction in mixed culture with normal cells. J Cell Biol. 1994;125:1137–1145. doi: 10.1083/jcb.125.5.1137. [DOI] [PMC free article] [PubMed] [Google Scholar]
- De Giovanni C, Lollini PL, Dolcetti R, Landuzzi L, Nicoletti G, D'Andrea E, Scotland K, Nanni P. Uncoupling of growth inhibition and differentiation in dexamethasone-treated human rhabdomyosarcoma cells. Br J Cancer. 1993;67:674–679. doi: 10.1038/bjc.1993.125. [DOI] [PMC free article] [PubMed] [Google Scholar]
- Denis N, Blanc S, Leibotvitch MP, Nicolaiew N, Dautry F, Raymondjean M, Kruh J, Kitzis A. c-myc oncogene expression inhibits the initiation of myogenic differentiation. Exp Cell Res. 1987;172:212–217. doi: 10.1016/0014-4827(87)90107-8. [DOI] [PubMed] [Google Scholar]
- Eidelman F, Fuks A, DeMarte L, Taheri M, Stanners CP. Human carcinoembryonic antigen, an intercellular adhesion molecule, blocks fusion and differentiation of rat myoblasts. J Cell Biol. 1993;123:467–475. doi: 10.1083/jcb.123.2.467. [DOI] [PMC free article] [PubMed] [Google Scholar]
- Evan GI, Littlewood TD. The role of c-myc in cell growth. Curr Opin Genet Dev. 1993;3:44–49. doi: 10.1016/s0959-437x(05)80339-9. [DOI] [PubMed] [Google Scholar]
- Evan GI, Wyllie AH, Gilbert CS, Littlewood TD, Land H, Brooks M, Waters CM, Penn LZ, Hancock DC. Induction of apoptosis in fibroblasts by c-myc protein. Cell. 1992;69:119–128. doi: 10.1016/0092-8674(92)90123-t. [DOI] [PubMed] [Google Scholar]
- Evan G, Harrington E, Fanidi A, Land H, Amati B, Bennett M. Integrated control of cell proliferation and cell death by the c-myc oncogene. Philos Trans R Soc Lond B Biol Sci. 1994;345:269–275. doi: 10.1098/rstb.1994.0105. [DOI] [PubMed] [Google Scholar]
- Facchini LM, Chen S, Penn LJZ. Dysfunction of the Mycinduced apoptosis mechanism accompanies c-mycactivation in the tumorigenic L929 cell line. Cell Growth Differ. 1994;5:637–646. [PubMed] [Google Scholar]
- Falcone G, Tato F, Alema S. Distinctive effects of the viral oncogenes myc, erb, fps, and src on the differentiation program of quail myogenic cells. Proc Natl Acad Sci USA. 1985;82:426–430. doi: 10.1073/pnas.82.2.426. [DOI] [PMC free article] [PubMed] [Google Scholar]
- Fanidi A, Harrington E, Evan GI. Cooperative interaction between c-myc and bcl-2 proto-oncogenes. Nature (Lond) 1992;359:554–556. doi: 10.1038/359554a0. [DOI] [PubMed] [Google Scholar]
- Gold P, Freedman SO. Demonstration of tumor-specific antigens in human colonic carcinomata by immunological tolerance and absorption techniques. J Exp Med. 1965;121:439–462. doi: 10.1084/jem.121.3.439. [DOI] [PMC free article] [PubMed] [Google Scholar]
- Guillem, J.G., P.B. Paty, and N. Rosen. 1995. Molecular Biology of Colorectal Cancer. In Cancer of the Colon, Rectum and Anus. A.M. Cohen and S.J. Winawer, editors. McGraw-Hill, New York. 149–156.
- Hefta SA, Hefta LJF, Lee TD, Paxton RJ, Shively JE. Carcinoembryonic antigen is anchored to the membrane by covalent attachment to a glycophosphatidylinositol moiety: identification of the ethanolamine linkage site. Proc Natl Acad Sci USA. 1988;85:4648–4652. doi: 10.1073/pnas.85.13.4648. [DOI] [PMC free article] [PubMed] [Google Scholar]
- Hermeking H, Eick D. Mediation of c-Myc apoptosis by p53. Science (Wash DC) 1994;265:2091–2093. doi: 10.1126/science.8091232. [DOI] [PubMed] [Google Scholar]
- Hinoda Y, Takahashi H, Higashide T, Nakano T, Arimura Y, Yoshimoto M, Tsujisaki M, Imai K, Yachi A. Correlated expression of mRNAs of carcinoembryonic antigen and non-specific cross-reacting antigen genes in malignant and nonmalignant tissues of the colon. Jpn J Clin Oncol. 1991;21:75–81. doi: 10.1093/oxfordjournals.jjco.a039449. [DOI] [PubMed] [Google Scholar]
- Hunter T. Cooperation between oncogenes. Cell. 1991;64:249–270. doi: 10.1016/0092-8674(91)90637-e. [DOI] [PubMed] [Google Scholar]
- Hunter T. Oncogenes and cell proliferation. Curr Opin Genet Dev. 1993;3:1–4. doi: 10.1016/s0959-437x(05)80353-3. [DOI] [PubMed] [Google Scholar]
- Ilantzis, C., S. Jothy, L.C. Alpert, P. Draber, and C.P. Stanners. 1997. Cell-surface levels of human carcinoembryonic antigen are inversely correlated with colonocyte differentiation in colon carcinogenesis. Lab. Invest. In press. [PubMed]
- Jothy S, Yuan S-Y, Shirota K. Transcription of carcinoembryonic antigen in normal colon and colon carcinoma. Am J Pathol. 1993;143:250–257. [PMC free article] [PubMed] [Google Scholar]
- Kelly K, Cochran BH, Stiles CD, Leder P. Cell specific regulation of the c-mycgene by lymphocyte mitogens and platelet-derived growth factor. Cell. 1983;35:603–610. doi: 10.1016/0092-8674(83)90092-2. [DOI] [PubMed] [Google Scholar]
- Knudsen KA. Cell adhesion molecules in myogenesis. Curr Opin Cell Biol. 1990;2:902–906. doi: 10.1016/0955-0674(90)90090-2. [DOI] [PubMed] [Google Scholar]
- Korsmeyer S. Bcl-2 initiates a new category of oncogenes: regulators of cell death. Blood. 1992;85:879–886. [PubMed] [Google Scholar]
- Korsmeyer S. Regulators of cell death. Trends Genet. 1995;11:101–105. doi: 10.1016/S0168-9525(00)89010-1. [DOI] [PubMed] [Google Scholar]
- La Rocca, S.A., M. Grossi, G. Falcone, S. Alema, and F. Tato. Interaction with normal cells suppresses the transformed phenotype of v-myc-transformed quail muscle cells. Cell. 1989;58:123–131. doi: 10.1016/0092-8674(89)90409-1. [DOI] [PubMed] [Google Scholar]
- La Rocca, S.A., D.H. Crouch, and D.A.F. Gillespie. c-Myc inhibits myogenic differentiation and myoD expression by a mechanism which can be dissociated from cell transformation. Oncogene. 1994;9:3499–3508. [PubMed] [Google Scholar]
- Land H, Parada LF, Weinberg RA. Tumorigenic conversion of primary embryo fibroblasts requires at least two cooperating oncogenes. Nature (Lond) 1983;304:596–602. doi: 10.1038/304596a0. [DOI] [PubMed] [Google Scholar]
- McDonnell TJ, Korsmeyer SJ. Progression from lymphoid hyperplasia to high-grade malignant lymphoma in mice transgenic for the t(14;18) Nature (Lond) 1991;349:254–256. doi: 10.1038/349254a0. [DOI] [PubMed] [Google Scholar]
- McDonnell TJ, Deane N, Platt FM, Nunez G, Jaeger U, McKearn JP, Korsmeyer SJ. bcl-2-immunoglobulin transgenic mice demonstrate extended B cell survival and follicular lymphoproliferation. Cell. 1989;57:79–88. doi: 10.1016/0092-8674(89)90174-8. [DOI] [PubMed] [Google Scholar]
- Miyazaki T, Liu Z-J, Kawahara A, Minami Y, Yamada K, Tsujimoto Y, Barsoumian EL, Perlmutter RM, Taniguchi T. Three distinct IL-2 signaling pathways mediated by bcl-2, c-myc, and lck cooperate in hematopoietic cell proliferation. Cell. 1995;81:223–231. doi: 10.1016/0092-8674(95)90332-1. [DOI] [PubMed] [Google Scholar]
- Morgenstern JP, Land H. Advanced mammalian gene transfer: high titre retroviral vectors with multiple drug selection markers and a complementary helper-free packaging cell line. Nucleic Acids Res. 1990;12:3587–3596. doi: 10.1093/nar/18.12.3587. [DOI] [PMC free article] [PubMed] [Google Scholar]
- Murray, A., and T. Hunt. 1993. The Cell Cycle. Oxford University Press, Oxford, UK.
- Nadal-Ginard B. Commitment, fusion, and biochemical differentiation of a myogenic cell line in the absence of DNA synthesis. Cell. 1978;15:855–864. doi: 10.1016/0092-8674(78)90270-2. [DOI] [PubMed] [Google Scholar]
- Neumaier M, Paululat S, Chan A, Matthaes P, Wagener C. Biliary glycoprotein, a potential cell adhesion molecule, is down-regulated in colorectal carcinomas. Proc Natl Acad Sci USA. 1993;90:10744–10748. doi: 10.1073/pnas.90.22.10744. [DOI] [PMC free article] [PubMed] [Google Scholar]
- Oikawa S, Inusuka C, Kuroki M, Matsuoka Y, Kosaki G, Nakazato H. Cell adhesion of non-specific cross-reacting antigen (NCA) and carcinoembryonic antigen (CEA) expressed on CHO cell surface: homophilic and heterophilic adhesion. Biochem Biophys Res Commun. 1989;164:39–45. doi: 10.1016/0006-291x(89)91679-3. [DOI] [PubMed] [Google Scholar]
- Olson E, Klein WH. bHLH factors in muscle development: dead lines and commitments, what to leave in and what to leave out. Genes Dev. 1994;8:1–8. doi: 10.1101/gad.8.1.1. [DOI] [PubMed] [Google Scholar]
- Olson EN, Spizz G, Tainsky MA. The oncogenic forms of N-ras or H-ras prevent skeletal myoblast differentiation. Mol Cell Biol. 1987;7:2104–2111. doi: 10.1128/mcb.7.6.2104. [DOI] [PMC free article] [PubMed] [Google Scholar]
- Packham G, Cleveland JL. c-Myc and apoptosis. Biochim Biophys Acta. 1995;1242:11–28. doi: 10.1016/0304-419x(94)00015-t. [DOI] [PubMed] [Google Scholar]
- Penn, L.J.Z., E.M. Laufer, and H. Land. 1990. C-Myc: Evidence for Multiple Regulatory Functions. In Seminars in Cancer Biology. N. Jones, editor. W.B. Saunders Co., London. 69–80. [PubMed]
- Reed JC, Talwar HS, Cuddy M, Baffy G, Williamson J, Rapp UR, Fisher GJ. Mitochondrial protein p26 BCL2 reduces growth factor requirements of NIH3T3 fibroblasts. Exp Cell Res. 1991;195:277–283. doi: 10.1016/0014-4827(91)90374-4. [DOI] [PubMed] [Google Scholar]
- Rojas M, DeMarte L, Screaton RA, Stanners CP. Radical differences in functions of closely related members of the human carcinoembryonic antigen gene family. Cell Growth Differ. 1996;7:655–662. [PubMed] [Google Scholar]
- Sinicrope FA, Ruan SB, Cleary KR, Stephens LC, Lee JJ, Levin B. bcl-2and p53 oncoprotein expression during colorectal tumorigenesis. Cancer Res. 1995;55:237–241. [PubMed] [Google Scholar]
- Spencer CA, Groudine M. Control of c-myc regulation in normal and neoplastic cells. Adv Cancer Res. 1991;56:1–48. doi: 10.1016/s0065-230x(08)60476-5. [DOI] [PubMed] [Google Scholar]
- Stanners CP, Till JE. DNA synthesis in individual L-strain mouse cells. Biochim Biophys Acta. 1960;37:406–419. doi: 10.1016/0006-3002(60)90496-0. [DOI] [PubMed] [Google Scholar]
- Strasser A, Harris AW, Bath ML, Cory S. Novel primitive lymphoid tumours induced in transgenic mice by cooperation between myc and bcl–2. . Nature (Lond) 1990;348:331–333. doi: 10.1038/348331a0. [DOI] [PubMed] [Google Scholar]
- Takami N, Misumi Y, Kuroki M, Matsuoka Y, Ikehara Y. Evidence for carboxyl-terminal processing and glycolipid-anchoring of human carcinoembryonic antigen. J Biol Chem. 1988;263:12716–12720. [PubMed] [Google Scholar]
- Wagner AJ, Small MB, Hay N. Myc-mediated apoptosis is blocked by ectopic expression of Bcl-2. Mol Cell Biol. 1993;13:2432–2440. doi: 10.1128/mcb.13.4.2432. [DOI] [PMC free article] [PubMed] [Google Scholar]
- Wagner AJ, Kokontis JM, Hay N. Myc-mediated apoptosis requires wild-type p53 in a manner independent of cell cycle arrest and the ability of p53 to induce p21 Waf1/Cip1. Genes Dev. 1994;8:2817–2830. doi: 10.1101/gad.8.23.2817. [DOI] [PubMed] [Google Scholar]
- Weinberg RA. Oncogenes, antioncogenes, and the molecular bases of multistep carcinogenesis. Cancer Res. 1989;49:3713–3721. [PubMed] [Google Scholar]
- Yaffe D. Retention of differentiation potentialities during prolonged cultivation of myogenic cells. Proc Natl Acad Sci USA. 1968;61:477–483. doi: 10.1073/pnas.61.2.477. [DOI] [PMC free article] [PubMed] [Google Scholar]
- Yaffe D, Saxel O. Serial passaging and differentiation of myogenic cells isolated from dystrophic mouse muscle. Nature (Lond) 1977;270:725–727. doi: 10.1038/270725a0. [DOI] [PubMed] [Google Scholar]
- Zhou H, Fuks A, Alcaraz G, Bolling TJ, Stanners CP. Homophilic adhesion between Ig superfamily carcinoembryonic antigen molecules involves double reciprocal bonds. J Cell Biol. 1993;122:951–960. doi: 10.1083/jcb.122.4.951. [DOI] [PMC free article] [PubMed] [Google Scholar]
- Zhu W, Cowie A, Wasfy GW, Penn LZ, Leber B, Andrews DW. Bcl-2 mutants with restricted sub-cellular location reveal spatially distinct pathways for apoptosis in different cell types. EMBO (Eur Mol Biol Organ) J. 1996;15:4130–4141. [PMC free article] [PubMed] [Google Scholar]