

Abstract
Considerable evidence links urokinase plasminogen activator (uPA) bound to its surface receptor (uPAR) with enhanced invasiveness of cancer cells. By blocking uPAR expression in human epidermoid carcinoma cells (HEp3), we have now identified an additional and novel in vivo function for this receptor by showing that receptor-deficient cells enter a state of dormancy reminiscent of that observed in human cancer metastasis. Its main characteristic is survival without signs of progressive growth. Five clones transfected with a vector expressing uPAR antisense RNA under the β-actin promoter were isolated and shown to have uPAR (at the mRNA and protein levels) reduced by 50 to 80%; four clones, transfected with vector alone and having uPAR levels similar to those of parental cells, served as controls. In confirmation of our previous results, reduced uPAR always coincided with a significantly reduced invasiveness. Each of the control clones produced rapidly growing, highly metastatic tumors within 2 wk of inoculation on chorioallantoic membranes (CAMs) of chick embryos. In contrast, each of the clones with low surface uPAR, whose proliferation rate in culture was indistinguishable from controls, remained dormant for up to 5 mo when inoculated on CAMs. Thus, the reduction in uPAR altered the phenotype of HEp3 tumor cells from tumorigenic to dormant. Although protracted, tumor dormancy was not permanent since in spite of maintaining low uPAR levels, each of the in vivo–passaged antisense clones eventually reemerged from dormancy to initiate progressive growth and to form metastases at a level of 20 to 90% of that of fully malignant control. This observation suggested that other factors, whose expression is dependent on cumulative and prolonged in vivo effects, can compensate for the lack of a full complement of surface uPAR required for the expression of malignant properties. These “reemerged,” uPAR-deficient clones were easily distinguishable from the vector-transfected controls by the fact that after only 1 wk in culture, the invasion of CAM by all five clones and tumorigenicity of four of the five clones were reduced back to the values observed before in vivo maintenance. In contrast, dissociated and in vitro–grown cells of control tumors were fully invasive and produced large, metastatic tumors when reinoculated on CAMs. Quantitation of the percent of apoptotic and S-phase cells in vivo, in the control and uPAR-deficient, dormant clones, showed that the mechanism responsible for the dormancy was a diminished proliferation.
Urokinase-type plasminogen activator (uPA)1 interacts with a specific plasma membrane receptor that focuses uPA proteolytic activity on the cell surface (Vassalli et al., 1985; Plow et al., 1986; Roldan et al., 1990; Blasi, 1993). This interaction facilitates activation of surface-bound plasminogen by lowering the K m of this reaction ∼40-fold (Ellis et al., 1991). In addition, surfacebound plasmin generated by this interaction is believed to be at least partially shielded from inhibition by native, high molecular–weight plasma inhibitors (Plow et al., 1986; Stephens et al., 1989). Extensive experimental evidence implicates surface-bound uPA in matrix degradation and invasion in vitro and in vivo (Dano et al., 1985; Mignatti et al., 1986; Ossowski, 1988; Cajot et al., 1989; Schlechte et al., 1989; Testa and Quigley, 1990; Ossowski et al., 1991; Mignatti and Rifkin, 1993; Blasi, 1993; Stahl and Mueller, 1994) as well as in lung colonization and spontaneous metastasis (Ossowski and Reich, 1983; Hearing et al., 1988; Axelrod et al., 1989; Crowley et al., 1993; Kobayashi et al., 1994). It appears that when the uPA production is limiting, the enzyme is most efficiently used when receptor-bound (Ossowski, 1988; Ossowski et al., 1991; Quax et al., 1991). Therefore, when surface-bound, because of more efficient generation of inhibitor- “resistant” plasmin, lesser activity is required than is required in the absence of receptor. Immunocytochemical, and in some cases, in situ hybridization analyses of human cancer tissue sections indicate that most types of malignant tumors acquire uPA through either auto- or paracrine interactions (DeBruin et al., 1987; Janicke et al., 1990; Duffy et al., 1990; Grondahl-Hansen et al., 1991). Similarly, the in vivo expression of uPA receptor (uPAR) has been shown in many tumors (Pyke et al., 1991; Bianchi et al., 1994; Carriero et al., 1994). The prevalence of surface-bound uPA in cancer and the experimental results implicating uPA in this disease suggest that surface proteolysis may represent a potentially attractive target for directed therapy either through inhibition of surface uPA activity or by antagonists competing for uPA binding to its receptor.
In our previous work (Kook et al., 1994), we targeted the surface uPAR expression in highly malignant human carcinoma cells (HEp3) for inhibition by a genetic (antisense) approach. A 5′ fragment of the uPAR-cDNA was subcloned into a mammalian expression vector in antisense orientation. Transfected clones were isolated, of which only one had uPAR reduced by more than 70%. Compared to control, the invasive ability of this clone, measured in the modified chorioallantoic membrane (CAM) assay (Ossowski, 1988), was reduced by ∼70%. Moreover, in vivo this clone did not form CAM tumors for as long as 10 wk (the duration of the experiment), while in nude mice, the initiation of growth followed extended latency and coincided with the reexpression of a full complement of uPAR. It is well established that a large proportion of cancer patients have, at the time of diagnosis, clinically undetected disseminated disease, which becomes evident often many years later. This quiescent state, in which cancer cells persist but do not manifest themselves clinically, is operationally defined as dormancy. Our preliminary observations with the uPAR-deficient clones suggested that, if confirmed, they may reveal a novel mechanism of cancer dormancy. Also, it was tantalizing to consider the possibility of permanent growth arrest of these small cancer foci (dormant metastases) by therapeutic intervention aimed at reduction of cell surface uPAR. The HEp3 clone with reduced uPAR level provided the first cue that such intervention may be possible (Kook et al., 1994). In this clone, a permanent suppression of tumor growth either persisted for a long time or was interrupted when uPAR level rose—most likely because of the inactivation of the viral promoter directing the transcription of the antisense RNA—to that of control level. These results hinted at the possibility that dormancy may be permanent for as long as uPAR reduction is sustained. To explore this possibility, we prepared new transfectants using a mammalian (β-actin) rather than a viral promoter, which was shown to be highly efficient in expressing the EGF receptor antisense RNA in epithelial cells (Moroni et al., 1992). We used the antisense-expressing cells to test whether sustained, low uPAR level can lead to a permanent state of tumor dormancy and, if so, to identify the mechanism responsible for this effect. The results of these studies provided evidence that dormancy is tightly linked to uPAR deficit, but they also showed that this deficit can be bypassed, and dormancy interrupted, after protracted in vivo survival. Identifying and inhibiting the functions responsible for the compensatory mechanisms may, in combination with antiuPAR effects, have important future implications for therapy of occult metastasis.
Materials and Methods
Materials
Materials were obtained from the following suppliers: tissue culture medium, glutamine, and antibiotics, Gibco Laboratories (Grand Island, NY); trypsin, ICN Pharmaceuticals, Inc. (Costa Mesa, CA); collagenase type 1A and BSA, Sigma Chemical Co. (St. Louis, MO); FBS, JRH Biosciences (Lenexa, KS); Pro-uPA was a gift from Dr. J. Henkin, Abbott Laboratories (Abbott Park, IL); 125NaI, New England Nuclear (Boston, MA); plasmin substrate (Spectrozyme PL), American Diagnostica (Greenwich, CT); COFAL-negative embryonated eggs, Specific Pathogen-Free AvianSupply (SPAFAS) (Norwich, CT). Tumor cells (HEp3) are from human epidermoid carcinoma (Toolan, 1954).
Preparation of Constructs
A 296-bp uPAR-cDNA fragment (−46 to 250) was PCR amplified using the following synthetic primers: sense 5′ ATG GAT CCA GAG AAG ACG TGC AGG GAG CTG, (BamHI restriction site in bold) and antisense 5′ AGG CTG GTA AGC TTC AAG CCA GTC CGA TAG (HindIII restriction site in bold). The amplified cDNA fragment was subcloned into BamHI- and HindIII-digested pLK444 vector (Gunning et al., 1987) in antisense orientation. Sequence analysis of the fragment showed 100% homology with the published uPAR sequence (Roldan et al., 1990). The plasmid containing uPAR-cDNA in antisense orientation, under the β-actin promoter, was designated pLKAS. pLKAS and pLK444 were grown in Escherichia Coli XL-1 blue and the plasmids purified using Qiagen plasmid kit (Chatsworth, CA).
Transfection and Selection of Antisense-expressing Clones
Human epidermoid carcinoma HEp3 cells obtained from tumors maintained on the chorioallantoic membrane were dissociated with collagenase and plated at high density in DME with 10% FBS. After one in vitro passage, the cells were plated at 1.3 × 10⁶ cells per 60-mm dish, and when almost confluent, they were transfected with 5 μg of pLK444 or pLKAS DNA using Lipofectin (Gibco Laboratories) in Opti-MEM medium according to manufacturer protocol. The medium was changed 18 h later to DME with 400 μg/ml of G418, and the cells were passaged when confluent. When most cells died, the DME was replaced with RPMI with 10% FBS with G418. 20 control and 34 antisense clones were examined for binding of 125I-labeled pro-uPA. Antisense clones showing >50% inhibition of binding were selected for further testing.
Determination of Receptor Numbers
Recombinant pro-uPA (Abbott Laboratories) was iodinated to a specific activity of ∼1 × 10⁷ cpm/μg protein using IodoGen. The methods used were as described (Ossowski et al., 1991). Briefly, cells (1.5 × 10⁵ per well) in a 24-well tray were stripped of endogenous uPA (Stopelli et al., 1986) and incubated for 60 min at 4°C with 1.5 × 10⁵ cpm (1 nM) of radioactive pro-uPA diluted in DME with 1 mg/ml BSA and 20 mM Hepes. Nonspecific binding was obtained by incubating cells with a 20-fold excess of unlabeled pro-uPA. Cells were washed three times, and the associated radioactivity was measured in a gamma counter. Clones that showed reduced binding were tested again using serial dilutions of the labeled pro-uPA, and Scatchard analysis was performed to determine receptor number and the K d of uPA binding.
Plasminogen Activator Measurements
Released uPA was collected by incubating cells in serum-free DME for 24 h. Cell-associated uPA was obtained by lysis of cells in 0.1% Triton X-100 in 0.1 M Tris, pH 8.1. Samples were tested in a plasminogen activation assay using chromogenic substrate for plasmin as described (Mira-y-Lopez and Ossowski, 1987) and compared to values obtained from a standard curve generated with dilutions (0.1–20.0 U/ml) of purified uPA. The activity shown represents uPA secreted and cell associated from 106 cells over a period of 24 h.
In Vitro Proliferation Rate of Control and Antisense Clones
Cells (8 × 10⁴ per 35-mm dish) were plated in DME with 10% FBS and incubated for 4 d. Medium was changed after 48 h. Each day, cells in two dishes were trypsinized and counted. Growth rate of the control and antisense clones was compared in 1 and 0.2% serum and at fourfold lower plating.
Northern Blot Analysis
Total RNA was extracted from ∼1 × 10⁷ cells with the Ultraspec RNA isolation system (Biotecx Laboratories Inc., Houston, TX). 30 μg of RNA was electrophoresed on 1% agarose gel containing formaldehyde, transferred to Hybond nylon membrane (Amersham Life Science, Buckinghamshire, England) and cross-linked by UV light. The membrane was hybridized with a 1.4-kb uPAR-cDNA probe labeled with [32P]dCTP using DECA prime II random priming DNA labeling kit from Ambion Inc. (Austin, TX). After stripping, the membrane was reprobed with glyceraldehyde 3-phosphate dehydrogenase (GAPDH-cDNA). The bands were scanned by laser densitometer, and the results were expressed as arbitrary units of uPAR per unit of GAPDH.
Southern Blot
Genomic DNA was extracted using QuickClean DNA extraction system from Oncogene Research Products (Cambridge, MA), and 10 μg of each sample was digested with HindIII at 37°C overnight. The samples were electrophoresed on 0.8% agarose, transferred to a nylon membrane, and probed with a 1-kb neo gene cDNA fragment labeled with [32P]dCTP.
Quantitation of Tumor Cell Invasion on Modified CAM
The method used was essentially as described previously (Ossowski, 1988). Tumor cells were labeled in culture with 0.2 μCi/ml of 125I-UdR (iododeoxyuridine) in DME with 5% FBS for 24 h. The specific activity ranged from 0.05 to 0.1 cpm/cell. The cells were washed extensively, and 3 × 10⁵ cells in 50 μl PBS were inoculated onto “resealed” CAMs of 10-d-old chick embryos. After 24 h, noninvading cells were released by trypsinization, and the CAMs were counted in a gamma counter to estimate the number of invasive cells (Ossowski, 1988).
Growth of Tumor Cells on CAMs
Each CAM was inoculated with 5 × 10⁵ tumor cells obtained by trypsinizing cultured control and antisense clones. After 1 wk of incubation, the nodule formed at the site of cell inoculation was excised, weighed, minced, inspected microscopically for presence of tumor cells, and reinoculated on a fresh CAM. When tumors were large (as was the case for control cells), only part of the mince was used for inoculation. With small nodules, the entire mince was serially passaged from CAM to CAM. When antisense tumors showed progressive growth, (between 4 and 5 mo in vivo), they were dissected, minced, digested with collagenase, and plated in culture for 1 wk and used to determine receptor numbers, invasion, and metastasis.
Metastasis Assay
Cells for inoculation were prepared as described above, detached with trypsin, and inoculated (2.5 × 10⁵ cells per CAM) onto two 10-d-old chick embryos. After 1 wk of growth on CAMs, the tumors were excised, weighed, lysed in 500 μl of Tris-Triton, and used for uPA determination. Lungs of tumor-bearing chick embryos were dissected, minced, and reinoculated onto fresh CAMs of 10-d-old chick embryos. 1 wk later, the nodules produced by the lung mince were excised, minced, and inspected microscopically for the presence of tumor cells. At least 10 fields (at 100× magnification) were inspected and the number of tumor cells per field was recorded on a semiquantitative scale from “−” to “4+”, where 4+ represented mainly tumor cells. (The tumor cells are much larger than chicken cells and therefore are easily detectable.) If no tumor cells were detected, the mince received a designation of “−”; single tumor cells in most fields, “1+”; 2–10 tumor cells in most fields, “2+”; <50% per field tumor cells, “3+”; and majority tumor cells, “4+”. The tissue was collected, lysed, and tested for tumor uPA activity. Lungs from uninoculated embryos grown on CAM for the same period of time served as negative controls. We determined previously (Ossowski and Reich, 1983) that secondary lung nodules containing 1 × 10⁵ metastatic HEp3 cells and designated as 4+ produce ∼1 Ploug U/mg of protein of human uPA when tested in the plasmin chromogenic assay, and that a high degree of correlation exists between metastatic tumor cell count in collagenase-dissociated CAM lung nodules and the level of human uPA (Ossowski and Reich, 1983). This correlation was independently confirmed by another group (Brooks et al., 1993). The human uPA values of CAM lung nodules in Fig. 7 and in Tables III and IV were determined by the chromogenic assay, and the number of metastatic cells was calculated from these values.
Figure 7.

Dependence of LK 25 metastasis on primary tumor mass; standard curve. In vivo–grown LK 25 cells were dissociated, kept in culture for 1 wk, and reinoculated on fresh CAMs. After 1 wk on CAM, tumors were excised and weighed. The number of metastatic cells in embryo lungs was measured (see Materials and Methods). As seen, within the range of 90–270 mg, metastasis level is directly proportional to the tumor mass. Tumors smaller than 50 mg do not yield easily detectable metastases.
Table III.
Metastasis Produced by Antisense Clones That Emerged from Dormancy after Serial Passage on CAMs
| Clone | Tumor weight | Metastatic cells in lung mince (microscopy)* | Metastatic cells in lungs (× 10−4) | |||||
|---|---|---|---|---|---|---|---|---|
| Expected from standard curve‡ | Measured (percent of expected) | |||||||
| mg | ||||||||
| AS 24CAM-16 § | 110 | 1+ | 2.1 | 19.0 | ||||
| AS 32CAM-18 | 250 | 3+ | 6.7 | 89.0 | ||||
| AS 33CAM-17 | 100 | 1+ | 1.8 | 17.0 | ||||
| AS 36CAM-9 | 180 | 2+ | 4.9 | 41.0 | ||||
| AS 48CAM-18 | 110 | 1+ | 2.1 | 71.0 | ||||
| LK 25CAM-3 | 200 | 4+ | 6.0 | 100.0 | ||||
Lungs removed from tumor-bearing chick embryos were inoculated on fresh CAMs and grown for 1 wk, and the nodules were excised, minced, and inspected microscopically for presence of metastatic cells. (For additional details and scoring, see Materials and Methods). In each case, the larger of the two (or three) CAM-passaged tumors was used for analysis.
Expected values represent the number of metastatic cells that are expected to be present in lungs of embryos bearing a given tumor mass. They are obtained by extrapolation of a standard curve generated by fully metastatic (LK 25) tumor cells (Fig. 7), which shows that when the experimental conditions are not altered, metastasis is strictly proportional to tumor mass. Therefore, if tumors of equal size yield a smaller number of disseminated cells (such as the case with uPAR-deficient tumors), it indicates a diminished metastatic potential. In each case, the larger of the two (or three) CAM-passaged tumors was used for analysis.
The numbers indicate number of weeks on CAM.
Table IV.
Effect of Reduced uPAR on Lung Metastasis of Antisense Clones Inoculated on CAMs as Single Cell Suspensions
| Clone | Tumor weight | Tumor uPA U/mg protein | Metastatic cells in lungs (× 10−4) | |||||||||
|---|---|---|---|---|---|---|---|---|---|---|---|---|
| Expected from standard curve | Measured (percent of expected) | |||||||||||
| Mean | (SD) | Mean | (SD) | |||||||||
| mg | ||||||||||||
| AS 24 | 55 | (8) | 0.9 | (0.2) | 0.0 | 0.0 | ||||||
| AS 32 | 260 | (114) | 0.9 | (0.2) | 7.4 | 22.9 | ||||||
| AS 33 | 107 | (5) | 0.7 | (0.2) | 2.0 | 20.0 | ||||||
| AS 36 | 64 | (8) | 0.6 | (0.0) | 0.0 | 0.0 | ||||||
| AS 48 | 44 | (12) | 0.7 | (0.1) | 0.0 | 0.0 | ||||||
| LK 25 | 200 | (40) | 0.7 | (0.0) | 6.0 | 100.0 | ||||||
Cells isolated from the same CAM tumors described in Table III and control tumor (LK 25) were enzymatically dissociated, grown in culture for 1 wk, and inoculated on fresh CAMs at 2.5 × 10⁵ cells per CAM, on three embryos each. After 1 wk of in vivo incubation, the tumors were weighed, minced, lysed, and used to determine uPA activity. The embryo lungs were tested for metastasis as described in Materials and Methods. Metastasis shown for the largest tumor of the three in each group.
Quantitation of Necrotic and Apoptotic Cells in CAM Tumors
Tumors were excised, minced finely, and dissociated into single cell suspension using collagenase. Cells were mixed with acridine orange and ethidium bromide at a final concentration of 15 μg/ml each and examined using a fluorescent microscope at a blue excitation range with a 520-nm barrier filter as described (Huang et al., 1995). Live and dead cells take up acridine orange; it intercalates with DNA making it appear green and binds to RNA, staining it orange. Ethidium bromide is taken up only by nonviable cells; it intercalates to DNA making it appear orange. At least 400 cells were counted for each sample and assigned to the following categories: “live-normal” (green with “normal” green nucleus); “live-apoptotic” (green with intensely stained dark green or yellowish condensed chromatin); “dead-necrotic” (orange-red because they are permeable to ethidium bromide, with intact nuclei); and “dead-apoptotic” (bright orange cytoplasm, sometimes poorly identifiable, with chromatin condensed into spherical, yellow heterogeneously sized beads).
Quantitation of Cells in S-phase (Bromodeoxyuridine Incorporation In Vivo)
The fact that CAM tumors are difficult to dissociate to single cells, and that even once dissociated, they easily form aggregates of several cells, necessitated a direct microscopic evaluation (rather than a FACS® analysis) of cells in S-phase. Chick embryos with dormant or growing CAM tumors were injected intravenously with 2.5 mg bromodeoxyuridine (BUdR) in 50 μl, and the embryos were incubated for 2 h. The tumors were excised and dissociated, and the cells were fixed, permeabilized, incubated for 30 min with fluorescein-labeled anti-BUdR antibodies, mounted in mounting medium, and examined. Between 400 and 1,000 cells were examined per sample, and the percent of cells with clearly fluorescent nuclei was calculated. The number of DNA-synthesizing cells was determined in the corresponding clones grown in culture. For these determinations, the procedure was as described, but only 2.5 μg/ml of BUdR and 1-h incorporation time were used.
Results
Isolation and Characterization of HEp3 Cells Transfected with Vectors Expressing uPAR Antisense RNA
Tumors (HEp3) serially passaged on CAMs of chick embryos were dissociated and transfected with a plasmid vector, pLK444 (Gunning et al., 1987) DNA, as a control, or with pLK444, into which a 5′ (−46 to 250) uPAR-cDNA fragment was subcloned in antisense orientation under the β-actin promoter. The vector also contains a G418 resistance gene under the SV-40 promoter. A total of 34 antisense-transfected clones were isolated and examined for levels of uPAR by comparing binding of radioactive prouPA (see Materials and Methods) to that of controls. Only 5 of the 34 clones (designated AS 24, 32, 33, 36, and 48), in which the receptor was reduced by at least 50% either at isolation or after several in vitro passages, were selected for further study (Tables I and II). Clones isolated from transfections with vector alone (designated LK 5, 9, 12, and 25), with receptor numbers differing from that of parental cells by no more than 20%, were used as positive controls.
Table I.
Reduction of uPAR Number in Antisense-transfected Clones
| Clones | uPAR number (percent reduction) | |||||
|---|---|---|---|---|---|---|
| At isolation | After passage in culture | After passage on CAM | ||||
| AS 24 | 68 | 56 | 68 | |||
| AS 32 | 58 | 64 | 54 | |||
| AS 33 | 69 | 63 | 58 | |||
| AS 36 | 61 | 50 | 63 | |||
| AS 48 | 37 | 58 | 33 | |||
Transfected clones at isolation, following 3–4 mo in culture, or after they recovered tumorigenicity in vivo (the latter tested after 1–3 passages in culture) were plated at 1.5 × 10⁵ cells per 24-well tray, and the total receptor number (after stripping the endogenous uPA) was determined using radioactive pro-uPA binding and Scatchard analysis as described in Materials and Methods. LK 12 cells (cultured in vitro or after growth on CAM) or HEp3 parental cells (both expressing similar receptor numbers) were included as positive controls in each experiment. Their receptor number varied between experiments from as low as 4.9 to as high as 7.0 × 10⁵ sites per cell. Each determination was done in duplicates (mean is shown).
Table II.
uPA Activity Produced by uPAR-deficient and Control Clones
| Clones | At isolation | After passage on CAM | ||
|---|---|---|---|---|
| AS 24 | 1.2 | 1.6 | ||
| AS 32 | 1.2 | 1.3 | ||
| AS 33 | 1.2 | 1.2 | ||
| AS 36 | 1.1 | 1.0 | ||
| AS 48 | 1.2 | N.T. | ||
| LK 12 | 1.3 | 1.3 | ||
| LK 25 | 1.3 | 1.3 |
Cells were grown to near confluence, and the cultures were washed. After 24 h of incubation in medium without serum, the conditioned media were collected and the cells were lysed, and both were used for the determination of uPA activity. N.T., not tested.
All clones (AS and controls) were tested for construct integration by Southern blotting using HindIII-digested genomic DNA probed with a 1-kb fragment of the neocDNA. (There is a unique HindIII site in the vector.) We found (results not shown) that all controls and all but one of the antisense clones had one or two detectable bands, suggesting a single or double integration site. AS 32 had multiple bands of very high intensity.
The levels of uPAR-mRNA were determined by Northern blotting and expressed as uPAR-mRNA units per unit of GAPDH-mRNA. The uPAR-mRNA in parental HEp3 cells was taken as 100%. Fig. 1 shows that the reduced uPAR number was coincidental with a reduced (51 to 80%) uPAR-mRNA level in the antisense clones and that the relatively constant level of mRNA in the two control clones tested was comparable to that in the parental HEp3 cells. Only two clones (AS 32 and 36) had easily detectable antisense RNA bands (results not shown). We and others have shown that reduction in mRNA level of the targeted gene is not always proportional to the level of detectable antisense RNA (van der Krol et al., 1988; Kasid et al., 1989; Neckers et al., 1992; Kook et al., 1994). The reduction in uPAR remained 50% or better in all the antisense clones after at least 4 mo in culture (Tables I and II).
Figure 1.
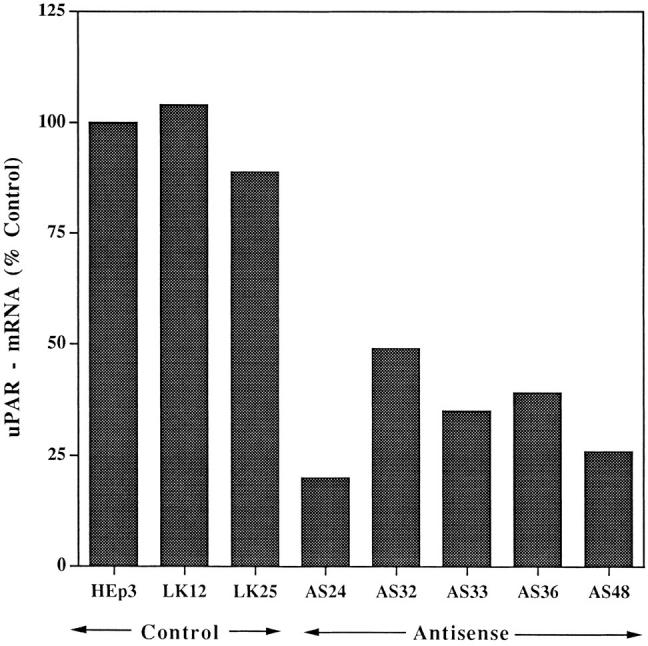
Reduction of uPAR-mRNA level in antisense-transfected clones. uPAR-mRNA steady-state levels were determined in parental HEp3 cells, two control clones, and five uPAR antisense clones by Northern blot hybridization (30 μg total RNA) using uPAR-cDNA (exposure 6 h) and, after stripping, GAPDHcDNA (exposure 1.5 h) as probes. The film was scanned, and the values were expressed as units of uPAR-mRNA per unit of GAPDH-mRNA and calculated as percent of uPAR-mRNA in parental cells.
The reduced uPAR level did not affect the in vitro growth potential of these clones. Fig. 2 shows that the cells in the three control and five antisense clone cultures doubled approximately once every 24 h. Small differences in growth rate were observed, but they did not bear a relation to the level of receptor. No difference in proliferation was observed even under growth limiting conditions, such as reduced serum or reduced plating density. Division time rose to ∼66 h at 1% serum, and even more at 0.2%, for both controls and uPAR-deficient clones (results not shown). No growth over a period of 5 d was observed when cells were plated at 2 × 10⁴ per 35-mm dish. (This is not unexpected because HEp3 with full complement of uPAR grow best when crowded.)
Figure 2.
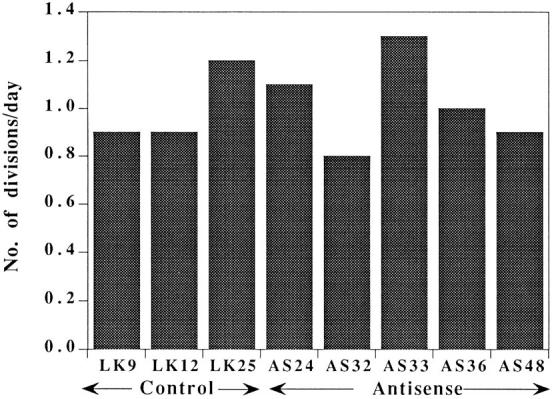
In vitro growth rate of control and antisense clones. Cells (8 × 10⁴) were plated in 35-mm dishes, and two dishes of each clone were trypsinized on four consecutive days and counted. The results shown are calculated by dividing the total number of divisions by 4 d of growth.
A reduction in uPAR level did not affect the overall uPA content of these cells. Combined uPA activity (secreted and cell-associated) produced by 106 cells over a period of 24 h was in the range of 1.1 to 1.3 Ploug units (Table II, first column) and somewhat higher after a passage on CAMs (Table II, second column).
Effect of Reduced uPAR on Invasion of CAMs
The invasive ability of the antisense clones was compared to that of control cells by inoculating equal numbers of 125I-UdR–labeled cells onto CAMs that were wounded and allowed to reseal for 24 h before inoculation (Ossowski, 1988). After 24 h of incubation, the number of labeled invading cells was measured and the invasion calculated as percent of total recovered tumor cells (see Materials and Methods). As shown in Fig. 3, while control cell invasion was 68%, the invasion by clones with reduced uPAR level was only 24% or less. This highly statistically significant difference confirms our previous results, which showed that surface uPA is essential for invasion of CAM and of dermis when inoculated subcutaneously in nude mice (Kook et al., 1994).
Figure 3.

Invasion of “resealed” CAMs by antisense clones grown in culture. 125I-UdR–labeled cells (3 × 10⁵ per CAM) derived from individual clones were inoculated each onto eight CAMs. Before inoculation the CAMs were “wounded” and then allowed to reseal for 24 h. The median of invasion is shown for each group. Comparison of groups by analysis of variance (SYSTAT) analysis showed a highly statistically significant difference (P = 0.000). A post-hoc analysis of each clone versus LK 25 control showed a value of P = 0.000, except for AS 32, in which P = 0.001. Similar results were obtained with control clones (LK 9 and 12) (not shown).
Does Reduction in Surface uPAR Lead to a Prolonged Dormancy?
Previous studies of a single uPAR antisense clone suggested that reduced uPAR expression induced tumor cell dormancy (Kook et al., 1994) and that permanent dormancy may be possible to achieve provided uPAR reduction was sustained. To explore this intriguing but preliminary observation, each of the five newly obtained antisense and four control clones was inoculated onto CAMs and maintained by serial weekly passage onto fresh CAMs. After the first week of growth, and weekly thereafter, the CAMs were inspected visually, and the site of inoculation (a clearly visible small nodule arising in response to wounding occurring during preparation of the CAM) was excised. The nodules were weighed, minced, and microscopically inspected for the presence of live tumor cells. (Tumor cells were always discernible in the mince.) In antisense clones, the entire mince, and in the controls part of the mince, was reinoculated onto fresh CAMs. Starting from week 2 on the CAM, each of the control clones produced progressively growing, large tumors (Fig. 4). In contrast, the small nodules produced by the antisense clones either remained completely static or fluctuated slightly, without showing a persistent increase in mass, for as long as 4 to 5 mo (Fig. 4, A–D). One clone (AS 36) initiated growth after 2 mo (not shown). CAMs were inoculated a second time with cells from each of the controls and all but one (AS 33) of the antisense clones and maintained by serial passages for up to 8 wk, yielding essentially the same results as those shown in Fig. 4 for the initial test period of growth on CAMs and indicating that inability to grow in vivo was a reproducible property of the antisense-inhibited cells. Moreover, dormancy was observed already in the first week on CAM, regardless of the number (as low as 1 × 10⁵ or as high as 2 × 10⁶) of inoculated, uPARdeficient cells (results not shown), suggesting that it was the interaction with the host and not tumor cell–cell interaction that was responsible for the effect.
Figure 4.

Dormancy of antisense-transfected clones maintained in vivo. Cells of individual clones (5 × 10⁵ per CAM) were inoculated on CAMs of two 10-d-old chick embryos and incubated for 1 wk, and the resulting nodules were excised, weighed, minced, and reinoculated onto two fresh CAMs. Serial passage of tumors were discontinued when their weight exceeded 100 mg. (We observed that tumors of this size, which contain mostly live tumor cells, usually continue progressive growth). M(−) indicates that lungs of these embryos were tested for metastases and found to be negative.
We conclude that low uPAR expression coincides with a dramatically lengthened period of cancer dormancy. As noticed from Fig. 4, although dormancy was sustained for a long time period, it was not permanent since at 4 to 5 mo all uPAR-deficient clones regained the ability to grow in vivo (Fig. 4). Was regrowth linked to reexpression of uPAR? To answer this, uPAR-mRNA level and pro-uPA binding were measured in tumors that emerged from dormancy by dissociating and growing the cells for 1 wk in culture. Fig. 5, A and B, and Table I show that uPAR both at the mRNA and receptor number levels remained low.
Figure 5.
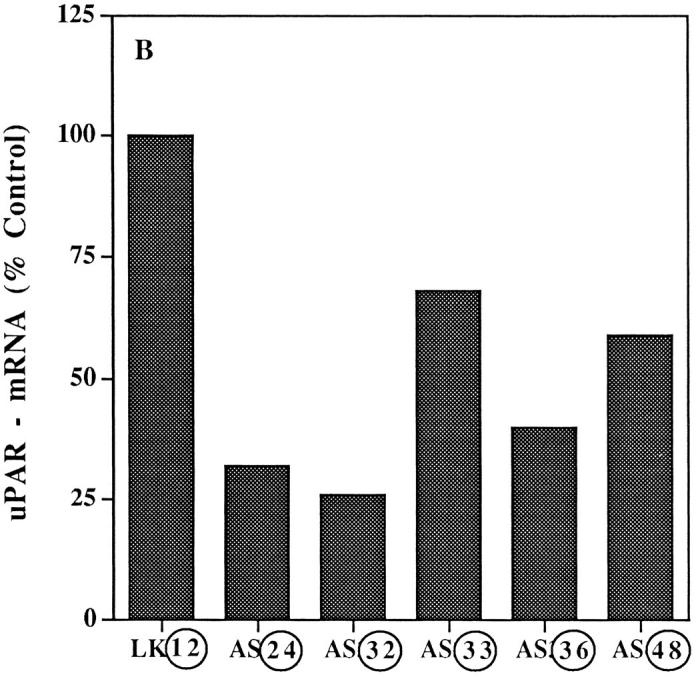

uPAR-mRNA level in cells isolated from reestablished CAM tumors. (A) CAM tumors were dissociated into single-cell suspension, plated, and kept in culture for 1–2 wk. Total RNA was extracted from ∼1 × 10⁷ cells and analyzed by Northern blot hybridization exactly as described in the legend to Fig. 1 . Film was exposed for 40 min after hybridization with labeled uPAR-cDNA and for 20 min after GAPDH probes. (B) Units calculated from a densitometry scan and expressed as described in the legend to Fig. 1. Only clones AS 32 and 36 had detectable antisense RNA, both when grown in culture and after forming CAM tumors. Circled numbers indicate cells after in vivo growth.
Are Other Functions Reestablished when Dormancy Is Interrupted?
Since we found that tumorigenicity was reestablished in spite of low levels of uPAR, we tested whether that also meant a return to full invasive capacity. Reestablished CAM tumors were tested for invasive ability on modified CAMs after 1 wk of growth in vitro. As a general rule, a low level of uPAR foretold low invasiveness (Fig. 6), and all reestablished clones continued to be less invasive than the controls. A slight increase of invasiveness in cells recovered from CAMs was detected (compare Figs. 3 and 6), but when two of the clones (dormant and after reemergence from dormancy) were compared in the same invasion experiment, no significant differences in invasiveness (P = 0.9 and 0.3, respectively) were found (results not shown). We concluded that the fluctuation is due to interexperimental variations and not due to intrinsic differences induced by in vivo conditions. When cells from reemerged clones, with low uPAR and low invasiveness, were reinoculated onto fresh CAMs and maintained in vivo for 7 d, three of five clones produced only very small tumors (see Table IV), suggesting that the compensatory mechanism(s) that took months of in vivo survival to develop was quickly extinguished in culture.
Figure 6.

Invasion of “resealed” CAMs by cells isolated from CAM tumors. Cells isolated from progressively growing CAM tumors (LK 25 control, week 4 in vivo, antisense clones weeks 17 to 22 in vivo) were kept in culture for 1 wk, detached, and inoculated on CAMs resealed for 28 h. Invasion was quantitated as described in the legend to Fig. 3. Analysis of variance revealed a significant P = 0.036 difference between the groups. Circled numbers indicate cells after in vivo growth.
Metastatic Potential of Antisense Clones with Reduced uPAR
The parental cells were shown to be highly metastatic in chick embryo (Ossowski and Reich, 1983) and in nude mice (Ossowski et al., 1991). The question remained whether cells that emerged from the protracted dormancy were metastatic. Tests for lung metastases throughout the dormancy, and especially in the weeks when some increases in the CAM nodules were apparent, were negative (Fig. 4, A and C). However, once growth in vivo became progressive, lung metastasis (measured by the content of human uPA and confirmed by microscopic analysis of lung minces; see Materials and Methods) was detected, albeit at extremely variable levels. Was the variation in metastasis a true reflection of metastatic potential or simply the result of reduced “primary” tumor masses? In a fully malignant control clone (LK 25), the level of lung metastasis was directly proportional to the tumor mass (Fig. 7). If reemergence from dormancy reestablishes a full metastatic potential, then the expected result would be that tumors of equal sizes produced by controls and antisense clones would yield similar levels of lung metastasis. As shown in Table III, when such comparisons were carried out, the metastatic potential of some uPAR-deficient clones (AS 24 and 33) was reduced by more than 80%, while in clone AS 32 it was similar to control. The observed reduced level of lung metastasis in embryos bearing tumors that reemerged from dormancy (Table III) and the even more dramatic loss of metastatic potential of the same cells reinoculated on CAMs after only 1 wk in culture (Table IV) were not simply due to a reduction in the level of uPA produced by these cells. First, as stated in Materials and Methods, uPA analysis of each CAM lung nodule was accompanied by microscopic inspection for presence of tumor cells, and the ones with no tumor cells were later found to have undetectable levels of human uPA. Also, as shown in Table IV, human uPA activity of “primary” tumors produced by control or uPAR-deficient cells was similar, making lung uPA determination a reliable comparative measure of metastasis in these tumors. These results show that a set of functions, which are reexpressed only after a prolonged maintenance of low uPAR cell in vivo, can compensate for the lack of uPAR and restore tumorigenicity in each of the tested clones (and metastasis in some) and suggest that an additional set of compensatory functions may be required for the restoration of the metastatic potential. This tentative conclusion is supported by the findings that of the two functions, tumorigenicity appears to be regained more consistently than metastasis (Fig. 4 and Table III) and maintained more efficiently when the cells are separated from the host (Table IV).
Mechanism(s) Responsible for Tumor Dormancy
Two basic mechanisms can account for the observed inability of the reduced uPAR clones to form progressively larger masses when inoculated on CAMs: an arrest in cell proliferation and/or an increased rate of death. We examined the proportion of live and dead (apoptotic and necrotic) cells in large, progressively growing control (LK 25) tumors, AS 24 tumors in the process of reemergence from dormancy, and AS 48 dormant tumors. As shown in Table V, the percent of live cells in all three types of tumors was nearly identical (76%). Also, there was no indication that uPAR-poor cells were more prone to die by apoptosis since the percents of apoptotic cells (live and dead) were 17, 14, and 13 for LK 25, AS 24, and AS 48, respectively. These results show that the uPAR-antisense clones enter a state of dormancy as a consequence of reduced proliferation. To directly test this possibility, tumorbearing embryos were injected with BUdR and the percent of tumor cells that incorporated BUdR (S-phase cells) were counted. As shown in Table VI, the percent of DNA-synthesizing cells was reduced by more than 60% in a dormant AS 24 clone, as compared to a vector control (progressively growing LK 25 tumor). As expected from the growth curves of clones cultured in vitro (Fig. 2), the DNA synthesis in vitro (determined by the BUdR incorporation method) was similar in the control and the AS 24 cells (Table VI).
Table V.
Proportion of Live and Dead (Necrotic and Apoptotic) Cells in Progressively Growing and Dormant CAM Tumors
| Tumor | Live cells | Dead cells | ||||||||||||||
|---|---|---|---|---|---|---|---|---|---|---|---|---|---|---|---|---|
| Normal | Apoptotic* | Necrotic | Apoptotic | |||||||||||||
| Mean | (SD) | Mean | (SD) | Mean | (SD) | Mean | (SD) | |||||||||
| LK 25 | 75.7 | (8) | 12 | (5) | 6 | (2) | 5 | (2) | ||||||||
| AS 24 | 76.5 | (4) | 8 | (2) | 8 | (2) | 6 | (6) | ||||||||
| AS 48 | 76.5 | (5) | 9 | (2) | 10 | (4) | 4 | (2) | ||||||||
The assignment of cells to the different groups is based on ethidium bromide and acridine orange staining (see Materials and Methods). Tumors growing on CAM for 4 to 10 passages were excised and weighed. They were 310, 110, and 60 mg, for LK 25, AS 24, and AS 48, respectively. The numbers given are the means of four determinations. The experiment was repeated with tumors of LK 9, AS 36 (growing), and AS 24 (dormant), which had 78, 83, and 84% live cells, respectively.
Apoptotic cells with plasma membrane still intact as determined by impermeability to ethidium bromide.
Table VI.
Proportion of DNA-synthesizing Cells In Vivo and In Vitro (BUdR Incorporation)
| Cell type | Growth conditions | BUdR positive (percentage of total cell number) | ||
|---|---|---|---|---|
| LK 25 | In culture | 41.4 | ||
| LK 25 | On CAM, growing | 28.6, 36.4* | ||
| AS 24 | In culture | 38.8 | ||
| AS 24 | On CAM, dormant | 11.8, 10.9* |
Numbers are from two independent experiments. BUdR (2.5 mg/embryo, 2.5 μg/ml of medium) was injected intravenously or added to in vitro cultures, respectively. The in vivo incorporation was measured 2 h after injection, and the in vitro was measured 1 h after addition to culture medium. BUdR incorporation was quantitated by counting fluorescein-labeled nuclei after incubation with fluorescein-coupled anti-BUdR antibodies (see Materials and Methods).
Discussion
The results of this study demonstrate that to initiate progressive tumor growth in vivo, epidermoid carcinoma (HEp3) cells require a full complement of surface uPAR. This conclusion is based on the observation, summarized in Fig. 8, that all control cells (parental and four independent control clones transfected with vector alone) with similarly high uPAR numbers produced actively growing tumors when inoculated on CAMs. In contrast, all five of the antisense clones, with receptor levels reduced by more than 50%, remained dormant for as long as 5 mo in vivo (Fig. 4). Two additional antisense clones (AS 3 and 26), in which uPAR was reduced by only 30%, emerged from dormancy after 6 and 7 wk in vivo, respectively (results not shown). This high degree of correlation between uPAR level and tumorigenicity or dormancy, exhibited by 11 independent clones, establishes a basis for proposing a novel function for uPAR.
Figure 8.

Summary of in vitro and in vivo properties of control and uPAR antisense clones. Cells of control clones rapidly form large tumor masses on CAMs (large open spheres), while cells in which uPAR is inhibited remain dormant in vivo (small circles) for as long as 5 mo and then reemerge to form tumors. However, while the tumorigenic and metastatic properties of the control clones are stable, the compensatory mechanism operating in vivo and leading to the interruption of dormancy produces heterogeneous and unstable phenotype that never reaches the full malignant potential of the controls. H, high; I, intermediate; L, low.
How can a reduction in uPAR block tumorigenicity? Is it possible that the inability to efficiently degrade the surrounding matrix, due to a reduction in surface proteolysis, affects proliferation, or are other growth-stimulating or death-preventing effects mediated via uPAR loss? We showed previously (Kook et al., 1994), and confirmed in the current group of antisense clones (Fig. 3), that cells with low uPAR levels have dramatically (>75%) reduced invasiveness when tested in a modified CAM assay (Ossowski, 1988). This was not unexpected since when prepared for inoculation, the CAM is wounded superficially and then allowed to reseal. During this process, the CAM tissue, and especially its wounded surface, becomes highly enriched in fibroblasts, fibronectin, and collagen, so that to penetrate this barrier, a tumor must generate sufficient proteolytic activity. Because uPAR has an established role in the more efficient generation of plasmin and its occupancy by uPA may be involved in overexpression of additional proteolytic enzymes (Rao et al., 1995), the loss of ability to invade dense tissue, such as a wounded and resealed CAM, is an expected consequence of reduction in this receptor. Tumorigenicity (or dormancy), however, is tested in a wounded CAM that has not been allowed to reseal before tumor cell inoculation and that, as shown (Ossowski, 1988), was highly susceptible to invasion, even by weakly invasive cells. Therefore, regardless of their uPAR level, all cells have a similar chance to access connective tissue and the blood vessels of the CAM. It is still possible, however, that the subsequent expansive growth of uPAR-poor cells may be hindered by the “healing” of CAM, which may proceed in spite of tumor cell presence by forming a dense connective tissue around the tumor inoculum.
An alternative explanation for the observed dormancy of cells with low receptor number may invoke an alteration in tumor cell phenotype either in conjunction or independently of the reduced surface proteolysis. Low uPAR may bring about an intrinsic defect resulting in growth arrest or in enhanced susceptibility to cell death. In the latter case, proliferation may proceed at the same rate, with dormancy achieved through enhanced rate of tumor cell death. Dramatic reduction in tumor cell mass due to apoptosis caused by withdrawal of essential growth factors has been well documented (Kyprianou and Isaacs, 1988; Vaillancourt et al., 1996). It has also been shown that metastases that are “dormant” because of inability to induce new blood vessel formation (Holmgren et al., 1995) maintained their status through a balance between cell proliferation and apoptosis.
At first glance it may seem that for therapeutic purposes, the mechanisms responsible for dormancy are not of major importance as long as tumor cell numbers remain constant (and not expanding). Cycling and dying cells, however, while susceptible to inhibition by the same agents that are effective against progressively growing tumors, are also more prone to accumulating genetic defects. In contrast, arrest or reduction in the rate of cell cycling may reduce emergence of new mutants. For this reason, in vivo models representing both mechanisms need to be established. In the case of HEp3, we found that the proportion of live, intact cells in cell suspensions of tumor produced by antisense clones at the time of dormancy, during emergence from this condition, and in progressively growing control tumors was essentially the same (∼76%) (Table V). Also, regardless of the in vivo growth characteristics of the tumor, the proportion of apoptotic cells (either alive or dead) was similar. These results clearly indicate that the inability to grow in vivo cannot be ascribed to enhanced death of the antisense cells and suggest that uPAR-poor state is associated with a proliferative defect in vivo. The results of in vivo incorporation of BUdR support this conclusion. Although it is too early to speculate on the mechanism(s) responsible for the growth arrest of antisense clones, a full complement of surface uPAR may be necessary for generation of growth stimuli either through autocrine mechanisms or by inducting stroma into paracrine interactions. In addition, reduced proteolysis may interfere with activation, or release from matrix, of growth factors (Saksela and Rifkin, 1990; Mars et al., 1995; Naldini et al., 1995). Finally, a reduced uPAR may diminish responses mediated via this receptor, such as migration, mitogenicity, or induction of neovascularization (Pepper et al., 1987; Odekon et al., 1992; Rabbani et al., 1992; Busso et al., 1994). It is also possible that unlike in Lewis lung carcinoma (Holmgren et al., 1995), a failure to induce new vessel formation by uPAR-poor HEp3 cells as a result of inappropriate remodeling of extracellular matrix, rather than causing their death by apoptosis, may reduce their proliferation.
Although gathered from a single experimental model, our results nevertheless clearly show that by targeting uPAR for reduced expression, a protracted state of tumor dormancy can be achieved. However, as shown in Fig. 4 and summarized in Fig. 8, each of the antisense clones is able to interrupt dormancy in spite of sustaining low levels of uPAR, suggesting that additional factor(s) may compensate for the defect of uPAR-poor cells. It is of obvious importance to determine whether the interruption of dormancy is achieved always through the same mechanism or, as possibly suggested by the heterogeneous phenotypes of the reemerging tumors (Fig. 8), by different compensatory factors. Our current efforts, which include subtractive hybridization, are aimed at identifying these factors.
Acknowledgments
The authors wish to thank Dr. J. Henkin (Abbott Laboratory, Abbott Park, IL) for the gift of recombinant pro-uPA, Dr. R. Mira-y-Lopez for critical reading of the manuscript, Dr. S. Waxman for continuous encouragement and support, Dr. Y. Huang for help with the apoptosis assay, and Ms. U. Rao for help with the graphics.
This work was supported by U.S. Public Health Service research grant CA-40758, The Samuel Waxman Cancer Research Foundation, and The Gloria and Sidney Danziger Foundation Inc.
Footnotes
1. Abbreviations used in this paper: CAM, chorioallantoic membrane; HEp3, human epidermoid carcinoma; IUdR and BUdR, iododeoxyuridine and bromodexoyuridine; uPA, urokinase plasminogen activator; uPAR, uPA receptor.
Address all correspondence to L. Ossowski, The Rochelle Belfer Chemotherapy Foundation Laboratory, Department of Medicine, Division of Neoplastic Diseases, Box 1178, Mount Sinai School of Medicine, New York, NY 10029. Tel.: (212) 241-3194. Fax: (212) 996-5787.
References
- Axelrod JH, Reich R, Miskin R. Expression of human recombinant plasminogen activators enhances invasion and experimental metastasis of H-ras-transformed NIH 3T3 cells. Mol Cell Biol. 1989;9:2133–2141. doi: 10.1128/mcb.9.5.2133. [DOI] [PMC free article] [PubMed] [Google Scholar]
- Bianchi E, Cohen RL, Thor AT, Todd RF, III, Mizukami IF, Lawrence DA, Ljung BM, Shuman MA, Smith HS. The urokinase receptor is expressed in invasive breast cancer but not in normal breast tissue. Cancer Res. 1994;54:861–866. [PubMed] [Google Scholar]
- Blasi F. Urokinase and urokinase receptor: a paracrine/autocrine system regulating cell migration and invasiveness. BioEssays. 1993;15:105–111. doi: 10.1002/bies.950150206. [DOI] [PubMed] [Google Scholar]
- Brooks PC, Lin JM, French DL, Quigley JP. Subtractive immunization yields monoclonal antibodies that specifically inhibit metastasis. J Cell Biol. 1993;122:1351–1359. doi: 10.1083/jcb.122.6.1351. [DOI] [PMC free article] [PubMed] [Google Scholar]
- Busso N, Masur SM, Lazega D, Waxman S, Ossowski L. Induction of cell migration by pro-urokinase binding to its receptor: possible mechanism for signal transduction in human epithelial cells. J Cell Biol. 1994;126:259–270. doi: 10.1083/jcb.126.1.259. [DOI] [PMC free article] [PubMed] [Google Scholar]
- Cajot J-F, Schleuning W-D, Medcalf RL, Bamat RJ, Testa J, Liebermann L, Sordat B. Mouse L-cells expressing human prourokinase type PA: effects on extracellular matrix degradation and invasion. J Cell Biol. 1989;109:915–929. doi: 10.1083/jcb.109.2.915. [DOI] [PMC free article] [PubMed] [Google Scholar]
- Carriero MV, Franco P, Del-Vecchio S, Massa O, Botti G, D'Aiuto G, Stoppelli MP, Salvatore M. Tissue distribution of soluble and receptor bound urokinase in human breast cancer using a panel of monoclonal antibodies. Cancer Res. 1994;54:5445–5454. [PubMed] [Google Scholar]
- Crowley WC, Cohen RL, Lucas BK, Liu G, Shuman MA, Levinson AD. Prevention of metastasis by inhibition of the urokinase receptor. Proc Natl Acad Sci USA. 1993;90:5021–5025. doi: 10.1073/pnas.90.11.5021. [DOI] [PMC free article] [PubMed] [Google Scholar]
- Dano K, Andreasen PA, Grondahl-Hansen J, Kristensen P, Nielsen L, Skriver L. Plasminogen activators, tissue degradation and cancer. Adv Cancer Res. 1985;44:139–266. doi: 10.1016/s0065-230x(08)60028-7. [DOI] [PubMed] [Google Scholar]
- DeBruin PA, Griffioen G, Verspaget HV, Verheijen JH. Plasminogen activators and tumor development in the human colon. Activity levels in normal mucosa, adenomateous tissue, polyps and adenocarcinomas. Cancer Res. 1987;47:4654–4657. [PubMed] [Google Scholar]
- Duffy MJ, Reilly D, O'Sullivan C, O'Higgins N, Fennely JJ. Urokinase plasminogen activator and prognosis in breast cancer. Lancet. 1990;13:108–111. doi: 10.1016/0140-6736(90)90571-l. [DOI] [PubMed] [Google Scholar]
- Ellis V, Behrendt N, Dano K. Plasminogen activation by receptorbound urokinase. A kinetic study with both cells-associated and isolated receptor. J Biol Chem. 1991;266:12752–12758. [PubMed] [Google Scholar]
- Grondahl-Hansen J, Ralfkiaer E, Kirkeby L, Kristensen P, Lund LR, Dano K. Localization of urokinase-type plasminogen activator in stromal cells in adenocarcinomas of the colon in humans. Am J Pathol. 1991;138:111–117. [PMC free article] [PubMed] [Google Scholar]
- Gunning P, Leavitt J, Muscat G, Ng S-Y, Kedes L. A human β-actin expression vector system directs high-level accumulation of antisense transcripts. Proc Natl Acad Sci USA. 1987;84:4831–4825. doi: 10.1073/pnas.84.14.4831. [DOI] [PMC free article] [PubMed] [Google Scholar]
- Hearing VJ, Law LW, Corti A, Appella E, Blasi F. Modulation of metastatic potential by cell surface urokinase of murine melanoma cells. Cancer Res. 1988;48:1270–1278. [PubMed] [Google Scholar]
- Holmgren L, O'Reilly MS, Folkman J. Dormancy of micrometastases: balanced proliferation and apoptosis in the presence of angiogenesis suppression. Nat Med. 1995;1:149–153. doi: 10.1038/nm0295-149. [DOI] [PubMed] [Google Scholar]
- Huang Y, Scher BM, Waxman S. Combination cytotoxic-differentiation therapy-induced apoptosis correlates with decreased intracellular pH and activation of endonucleases. Mol Cell Diff. 1995;3:241–260. [Google Scholar]
- Janicke F, Schmidt M, Hollrieder A, Babic R, Ulm K, Gossner W, Graeff H. Urokinase-type plasminogen activator (uPA) is a predictor of early relapse in breast cancer. Fibrinolysis. 1990;4:69–78. [Google Scholar]
- Kasid U, Pfeiffer A, Breannan T, Beckett M, Weichselbaum RR, Dritschillo A, Mark GE. Effect of antisense c-raf-1 on tumorigenicity and radiation sensitivity of a human squamous carcinoma. Science (Wash DC) 1989;243:1354–1356. doi: 10.1126/science.2466340. [DOI] [PubMed] [Google Scholar]
- Kobayashi H, Gotoh J, Fujie M, Shinohara H, Moniwa N, Terao T. Inhibition of metastasis of Lewis lung carcinoma by a synthetic peptide within growth factor domain of urokinase in the experimental and spontaneous metastasis model. Int J Cancer. 1994;57:727–733. doi: 10.1002/ijc.2910570520. [DOI] [PubMed] [Google Scholar]
- Kook Y-H, Adamski J, Zelent A, Ossowski L. The effect of antisense inhibition of urokinase receptor in human squamous cells carcinoma on malignancy. EMBO (Eur Mol Biol Organ) J. 1994;13:3983–3991. doi: 10.1002/j.1460-2075.1994.tb06714.x. [DOI] [PMC free article] [PubMed] [Google Scholar]
- Kyprianou N, Isaacs JT. Activation of programmed cell death in the rat ventral prostate after castration. Endocrinology. 1988;122:552–562. doi: 10.1210/endo-122-2-552. [DOI] [PubMed] [Google Scholar]
- Mars WM, Liu ML, Kitson RP, Goldfarb RH, Gabauer MK, Michalopoulos GK. Immediate early detection of urokinase receptor after partial hepatectomy and its implication for liver regeneration. Hepatology. 1995;21:1695–1701. [PubMed] [Google Scholar]
- Mignatti P, Rifkin D. Biology and biochemistry of proteinases in tumor invasion. Physiol Rev. 1993;73:161–195. doi: 10.1152/physrev.1993.73.1.161. [DOI] [PubMed] [Google Scholar]
- Mignatti P, Robbins E, Rifkin DB. Tumor invasion through the human amniotic membrane: requirement for a proteinase cascade. Cell. 1986;47:487–498. doi: 10.1016/0092-8674(86)90613-6. [DOI] [PubMed] [Google Scholar]
- Mira-y-Lopez R, Ossowski L. Hormonal modulation of plasminogen activator: an approach to prediction of human breast tumor responsiveness. Cancer Res. 1987;47:3558–3564. [PubMed] [Google Scholar]
- Moroni MC, Willingham MC, Beguinot L. EGF-R antisense blocks expression of the epidermal growth factor receptor and suppresses the transformed phenotype of a human carcinoma cell line. J Biol Chem. 1992;267:2714–2722. [PubMed] [Google Scholar]
- Naldini L, Vigna E, Bardelli A, Follenzi A, Galimi F, Comoglio PM. Biological activation of pro-HGF (hepatocyte growth factor) by urokinase is controlled by a stoichiometric reaction. J Biol Chem. 1995;270:603–611. doi: 10.1074/jbc.270.2.603. [DOI] [PubMed] [Google Scholar]
- Odekon LE, Sato Y, Rifkin DB. Urokinase-type plasminogen activator mediates basic fibroblast growth factor-induced bovine endothelial cell migration independent of its proteolytic activity. J Cell Physiol. 1992;150:258–263. doi: 10.1002/jcp.1041500206. [DOI] [PubMed] [Google Scholar]
- Ossowski L. In vivo invasion of modified membrane by tumor cells: the role of cell surface-bound urokinase. J Cell Biol. 1988;107:2437–2445. doi: 10.1083/jcb.107.6.2437. [DOI] [PMC free article] [PubMed] [Google Scholar]
- Ossowski L, Reich E. Antibodies to plasminogen activator inhibit human tumor metastasis. Cell. 1983;35:611–619. doi: 10.1016/0092-8674(83)90093-4. [DOI] [PubMed] [Google Scholar]
- Ossowski L, Clunie G, Masucci T, Blasi F. In vivo paracrine interaction between urokinase and its receptor: effect on tumor cell invasion. J Cell Biol. 1991;115:1107–1112. doi: 10.1083/jcb.115.4.1107. [DOI] [PMC free article] [PubMed] [Google Scholar]
- Ossowski L, Russo-Payne H, Wilson EL. Inhibition of urokinasetype plasminogen activator by antibodies: the effect on dissemination of a human tumor in the nude mouse. Cancer Res. 1991;51:274–281. [PubMed] [Google Scholar]
- Pepper MS, Vassalli J-D, Montesano R, Orci L. Urokinase-type plasminogen activator is induced in migrating capillary endothelial cells. J Cell Biol. 1987;105:2535–2541. doi: 10.1083/jcb.105.6.2535. [DOI] [PMC free article] [PubMed] [Google Scholar]
- Plow EF, Freaney DE, Plescia J, Miles LA. The plasminogen system and cell surfaces: evidence for plasminogen and urokinase receptors on the same cell type. J Cell Biol. 1986;103:2411–2420. doi: 10.1083/jcb.103.6.2411. [DOI] [PMC free article] [PubMed] [Google Scholar]
- Pyke C, Kristensen P, Ralkfiaer E, Ronne E, Grondahl-Hansen J, Eriksen J, Blasi F, Dano K. Urokinase-type plasminogen activator is expressed in stromal cells and its receptor in cancer cells in invasive foci in human colon adenocarcinomas. Am J Path. 1991;138:1059–1067. [PMC free article] [PubMed] [Google Scholar]
- Quax PHA, Pedersen N, Masucci MT, Weeningverhoeff EJD, Dano K, Verheijnen JH, Blasi F. Complementation between urokinaseproducing and receptor producing cells in extracellular matrix degradation. Cell Regul. 1991;2:793–803. doi: 10.1091/mbc.2.10.793. [DOI] [PMC free article] [PubMed] [Google Scholar]
- Rabbani SA, Mazar AP, Bernier SM, Haq M, Bolivar I, Henkin J, Goltzman D. Structural requirements for the growth factor activity of the amino-terminal domain of urokinase. J Biol Chem. 1992;267:14151–14156. [PubMed] [Google Scholar]
- Rao NK, Shi GP, Chapman HA. Urokinase is a multifunctional protein: influence of receptor occupancy on macrophage gene expression. J Clin Invest. 1995;96:465–474. doi: 10.1172/JCI118057. [DOI] [PMC free article] [PubMed] [Google Scholar]
- Roldan AL, Cubellis MV, Masucci MT, Behrendt N, Lund LR, Dano K, Appella E, Blasi F. Cloning and expression of the receptor for human urokinase plasminogen activator, a central molecule in cell surface, plasmin dependent proteolysis. EMBO (Eur Mol Biol Organ) J. 1990;9:467–474. doi: 10.1002/j.1460-2075.1990.tb08132.x. [DOI] [PMC free article] [PubMed] [Google Scholar]
- Saksela O, Rifkin DB. Release of bFGF-heparan sulfate complexes from endothelial cells by plasminogen activator mediated proteolytic activity. J Cell Biol. 1990;110:767–775. doi: 10.1083/jcb.110.3.767. [DOI] [PMC free article] [PubMed] [Google Scholar]
- Schlechte W, Murano G, Boyd D. Examination of the role of urokinase receptors in human colon cancer mediated laminin degradation. Cancer Res. 1989;49:6064–6069. [PubMed] [Google Scholar]
- Stahl A, Mueller BM. Binding of urokinase to its receptor promotes migration and invasion of human melanoma cells in vitro. Cancer Res. 1994;54:3066–3071. [PubMed] [Google Scholar]
- Stephens RW, Pollanen J, Tapiovara H, Leung K-C, Sim P-S, Salonen E-M, Ronne E, Behrendt N, Dano K, Vaheri A. Activation of pro-urokinase and plasminogen on human sarcoma cells: a proteolytic system with surface-bound reactants. J Cell Biol. 1989;108:1987–1995. doi: 10.1083/jcb.108.5.1987. [DOI] [PMC free article] [PubMed] [Google Scholar]
- Stopelli MP, Tacchetti C, Cubellis MV, Corti A, Hearing VJ, Cassani G, Appella E, Blasi F. Autocrine saturation of prourokinase receptors on human A431 cells. Cell. 1986;45:657–684. doi: 10.1016/0092-8674(86)90782-8. [DOI] [PubMed] [Google Scholar]
- Testa JE, Quigley JP. The role of plasminogen activator in aggressive tumor behavior. Cancer Metastasis Rev. 1990;9:353–367. doi: 10.1007/BF00049524. [DOI] [PubMed] [Google Scholar]
- Toolan HW. Transplantable human neoplasms maintained in cortisonetreated laboratory animals: HS#1, H.Ep.#1, H.Ep.#2, H.Ep.#3 and H.Emb.#1. Cancer Res. 1954;14:660–666. [PubMed] [Google Scholar]
- Vaillancourt L, Tetu B, Fradet Y, Dupont A, Gomez J, Cusan L, Suburu ER, Diamond P, Candas B, Labrie F. Effect of neoadjuvant endocrine therapy (combined androgen blockade) on normal prostate and prostatic carcinoma. Am J Surg Pathol. 1996;20:86–93. doi: 10.1097/00000478-199601000-00010. [DOI] [PubMed] [Google Scholar]
- Van der Krol AR, Mol JNM, Stuitje AR. Modulation of gene expression by complementary RNA or DNA sequences. Biotechniques. 1988;6:958–976. [PubMed] [Google Scholar]
- Vassalli J-D, Baccino D, Belin D. A cellular binding site for the M r55,000 form of the human plasminogen activator, urokinase. J Cell Biol. 1985;100:86–92. doi: 10.1083/jcb.100.1.86. [DOI] [PMC free article] [PubMed] [Google Scholar]