

Abstract
Mitochondria act as potent buffers of intracellular Ca2+ in many cells, but a more active role in modulating the generation of Ca2+ signals is not well established. We have investigated the ability of mitochondria to modulate store-operated or “capacitative” Ca2+ entry in Jurkat leukemic T cells and human T lymphocytes using fluorescence imaging techniques. Depletion of the ER Ca2+ store with thapsigargin (TG) activates Ca2+ release-activated Ca2+ (CRAC) channels in T cells, and the ensuing influx of Ca2+ loads a TG- insensitive intracellular store that by several criteria appears to be mitochondria. Loading of this store is prevented by carbonyl cyanide m-chlorophenylhydrazone or by antimycin A1 + oligomycin, agents that are known to inhibit mitochondrial Ca2+ import by dissipating the mitochondrial membrane potential. Conversely, intracellular Na+ depletion, which inhibits Na+-dependent Ca2+ export from mitochondria, enhances store loading. In addition, we find that rhod-2 labels mitochondria in T cells, and it reports changes in Ca2+ levels that are consistent with its localization in the TG-insensitive store. Ca2+ uptake by the mitochondrial store is sensitive (threshold is <400 nM cytosolic Ca2+), rapid (detectable within 8 s), and does not readily saturate. The rate of mitochondrial Ca2+ uptake is sensitive to extracellular [Ca2+], indicating that mitochondria sense Ca2+ gradients near CRAC channels. Remarkably, mitochondrial uncouplers or Na+ depletion prevent the ability of T cells to maintain a high rate of capacitative Ca2+ entry over prolonged periods of >10 min. Under these conditions, the rate of Ca2+ influx in single cells undergoes abrupt transitions from a high influx to a low influx state. These results demonstrate that mitochondria not only buffer the Ca2+ that enters T cells via store-operated Ca2+ channels, but also play an active role in modulating the rate of capacitative Ca2+ entry.
Mitochondria fill several essential physiological roles in cells. Their best recognized function is to produce the bulk of the cell's ATP through oxidative metabolism (Nicholls and Ferguson, 1992). As described by the chemiosmotic theory, this is made possible by a series of mitochondrial enzymes in the respiratory chain that pump protons out of the mitochondrial matrix and establish a large electrical and proton gradient across the inner membrane. The high driving force for proton reentry drives a proton pump (the F1F0 ATPase, or ATP synthase) in the mitochondria in reverse, causing it to synthesize ATP as it allows protons to reenter the mitochondrion. In addition to this fundamental role as the cell's primary energy supplier, mitochondria have become increasingly well known in recent years as potent buffers of cytosolic Ca2+. The large negative potential across the inner membrane (up to −180 mV) drives Ca2+ into mitochondria through a uniporter located in the inner membrane, and export is achieved via multiple mechanisms, including an electroneutral Na+/Ca2+ exchanger (Crompton et al., 1976; Carafoli, 1987; Gunter and Pfeiffer, 1990; Thayer and Miller, 1990; Cox and Matlib, 1993; Gunter et al., 1994).
Studies of excitable and nonexcitable cells have suggested several important consequences of Ca2+ uptake by mitochondria. First, increases in mitochondrial Ca2+ concentration ([Ca2+]m)1 are believed to modulate the production of ATP. Several of the dehydrogenases that supply substrates for the electron transport chain are stimulated by Ca2+ (Gunter et al., 1994; Hansford, 1994; Nichols and Denton, 1995), and recent studies have verified that mitochondrial uptake of Ca2+ in vivo is accompanied by increased levels of NADH or NADPH (Rizzuto et al., 1994; Hajnoczky et al., 1995) and activation of the matrix enzyme pyruvate dehydrogenase (Rutter et al., 1996). This behavior is thought to couple the rate of ATP production to demand such that, during periods of high cytosolic Ca2+ concentration ([Ca2+]i), the increased rate of ATP hydrolysis by Ca2+ pumps is balanced by enhanced ATP generation.
In addition, uptake and release of Ca2+ by mitochondria has a powerful impact on Ca2+ signaling. Several characteristics are important in this regard. [Ca2+]m is generally low (∼200 nM) in resting cells (Rizzuto et al., 1992, 1994; Sheu and Jou, 1994; Babcock et al., 1997), but significant uptake occurs at modestly elevated levels of [Ca2+]i (>∼0.5 μM) and does not saturate readily (Gunter et al., 1994; Sparagna et al., 1995). In HeLa cells and hepatocytes, it has been shown that mitochondria have the capacity to sequester and export Ca2+ at physiological [Ca2+]i probably by sensing microdomains of high [Ca2+]i close to sources such as IP3 receptors in the ER or Ca2+ channels in the plasma membrane (Rizzuto et al., 1993; Hajnoczky et al., 1995; Lawrie et al., 1996). Mitochondrial uptake may help to avert excessive increases in [Ca2+]i that may damage the cell or trigger apoptosis (Ankarcrona et al., 1995). Their high rate of uptake enables mitochondria to play a dominant role among several mechanisms (including Na+/ Ca2+ exchange and Ca2+-ATPases) for clearing large loads of cytosolic Ca2+ (Mohr and Fewtrell, 1990; Ali et al., 1994; Werth and Thayer, 1994; Herrington et al., 1996; Park et al., 1996). By slowly releasing stored Ca2+, mitochondria can prolong the period of [Ca2+]i elevation in response to a transient episode of Ca2+ influx (Thayer and Miller, 1990; Friel and Tsien, 1994; Babcock et al., 1997). These actions may have important effects on such Ca2+dependent processes as exocytosis and synaptic transmission. Thus, mitochondria act like a slow, nonsaturable, nonlinear buffer for intracellular Ca2+; they sequester Ca2+ during periods of rapid Ca2+ entry and release it slowly after Ca2+ entry has ceased.
While there is now considerable evidence for the passive Ca2+ buffering actions of mitochondria, few studies have addressed the possibility that they may actively influence the generation of Ca2+ signals. In Xenopus oocytes, mitochondrial inhibitors affect the generation and propagation of IP3-triggered Ca2+ waves, leading to the notion that intact mitochondria may reduce the local Ca2+ concentration near IP3 receptors and thereby influence their Ca2+dependent modulation (Jouaville et al., 1995). In cerebellar granule cells, the uptake of Ca2+ by mitochondria has been proposed to enhance Ca2+ influx by reducing the Ca2+-dependent inactivation of voltage-gated Ca2+ channels in the plasma membrane (Budd and Nicholls, 1996).
In this study we examine the ability of mitochondria to modulate Ca2+ influx through store-operated Ca2+ channels in T lymphocytes. In T cells and many other nonexcitable cells, depletion of the ER Ca2+ stores leads to the activation of voltage-independent, store-operated channels that conduct Ca2+ across the plasma membrane (for reviews see Penner et al., 1993; Putney and Bird, 1993; Fasolato et al., 1994; Berridge, 1995; Lewis and Cahalan, 1995). Store-operated channels are believed to constitute a family of related channels, of which the Ca2+ release-activated Ca2+ (CRAC) channel in T cells and mast cells is the most extensively characterized (Hoth and Penner, 1993; Zweifach and Lewis, 1993). After recognition of antigen by the T cell receptor and the resulting depletion of stores by IP3, CRAC channels in T cells open and act to elevate [Ca2+]i for an extended period of minutes to hours. Prolonged Ca2+ influx through CRAC channels appears to be required to induce interleukin-2 gene expression and to commit T cells to become activated (Goldsmith and Weiss, 1988; Negulescu et al., 1994; Partiseti et al., 1994; Fanger et al., 1995). Here we report the initial characterization of a high capacity mitochondrial Ca2+ store in human T cells. We find that mitochondria play a major role in sustaining high rates of Ca2+ influx through CRAC channels, and that this function depends on their ability to take up and export Ca2+. Thus, mitochondria act not only as passive Ca2+ buffers in T cells, but also contribute actively to the mechanisms that control store-operated Ca2+ entry. A preliminary account of this work has appeared in abstract form (Hoth, M., C.M. Fanger, A.B. Nelson, and R.S. Lewis. 1996. Biophys. J. 66:181a).
Materials and Methods
Cell Lines and Reagents
Parental Jurkat T cells and the mutant Jurkat cell line CJ-4 have been previously described and characterized (Fanger et al., 1995). Cells were grown in complete medium consisting of RPMI 1640 (Mediatech, Herndon, VA) supplemented with 10% FCS (Gemini Bio-Products, Inc., Calabasas, CA), 2 mM glutamine (Mediatech), and penicillin-streptomycin (50 U/ml and 50 μg/ml; Mediatech). Cells were continuously maintained in log-phase growth at 37°C with 6% CO2. Human peripheral blood T cells were isolated as previously described (Dolmetsch and Lewis, 1994). Reagents include thapsigargin (TG; LC Laboratories, Woburn, MA; 1 mM stock in DMSO); ionomycin-free acid (Calbiochem-Novabiochem Corp., La Jolla, CA; 4 mM stock in DMSO); carbonyl cyanide m-chlorophenylhydrazone (CCCP; Sigma Chemical Co., St. Louis, MO; 1 mM stock in ethanol); carbonyl cyanide p-trifluoromethoxyphenylhydrazone (FCCP; Sigma Chemical Co.; 10 mM stock in ethanol); antimycin A1 (Sigma Chemical Co.; 2 mM stock in ethanol); oligomycin (Sigma Chemical Co., 5 mg/ml stock in DMSO); and N-methyl-d-glucamine (NMDG; Sigma Chemical Co.).
Video Microscopic Measurements of Cytosolic [Ca2+] and pH
Cells were loaded at 20°–25°C for 30 min with 1 μM fura-2/AM (Molecular Probes, Eugene, OR) in complete medium, washed with fresh medium, and stored in the dark at room temperature until use. Loaded cells were allowed to adhere to poly-l-ornithine–coated glass coverslip chambers on the stage of an Axiovert 35 microscope equipped with a ×40 Achrostigmat objective (NA 1.3) (Carl Zeiss, Inc., Thornwood, NY). Imaging experiments were performed as previously described (Dolmetsch and Lewis, 1994). Cells were alternately illuminated at 350 ± 5 nm and 380 ± 6 nm (bandpass interference filters; Omega Optical, Brattleboro, VT), and the fluorescence emissions at λ > 480 nm (longpass interference filter; Chroma Technology Corp., Brattleboro, VT) were captured with an intensified CCD camera (Hamamatsu Corp., Bridgewater, NJ) and digitized and analyzed using a VideoProbe imaging system (ETM Systems, Irvine, CA). Ratio images were recorded at intervals of 0.5–5 s. [Ca2+]i was estimated from the relation [Ca2+]i = K* (R − Rmin)/(Rmax − R), where the values of K*, Rmin, and Rmax were determined from an in situ calibration of fura-2 in Jurkat T cells loaded by intracellular dialysis as described (Lewis and Cahalan, 1989). Ringer's solution had the following composition (mM): 155 NaCl, 4.5 KCl, 2 CaCl2, 1 MgCl2, 10 d-glucose, and 5 Hepes (pH 7.4 with NaOH). Ca2+-free Ringer's solution was prepared by substituting MgCl2 for CaCl2 and adding 1 mM EGTA. All experiments were conducted at 22°–25°C.
For qualitative measurements of mitochondrial Ca2+, cells were loaded with rhod-2/AM (Molecular Probes) in Ringer's solution at a concentration of 4–8 μM (2 mM stock in DMSO) for 30–40 min at 20°–25°C. Cells were illuminated at 540 ± 12 nm (bandpass filter; Chroma Technology Corp.), and the fluorescence emission at 605 ± 28 nm (bandpass filter; Chroma Technology Corp.) was captured and analyzed as described above for fura-2. For these experiments, a ×63 Zeiss Neofluar objective (NA 1.25) was used. Movement of mitochondria posed a serious problem for time-lapse imaging. To minimize movement artifacts, we first flattened the cells by attaching them to poly-ornithine–coated coverslips followed by incubation for 30 min with 10 μg/ml phytohemagglutinin in Ringer's solution. In control experiments using fura-2–loaded cells, phytohemagglutinin did not appear to affect Ca2+ plateaus or responses to mitochondrial inhibitors, implying that it does not alter mitochondrial Ca2+ uptake. The microscope was focused on the mitochondria immediately before collecting each set of data (see Fig. 5, B and C). Rhod-2 fluorescence was not calibrated in terms of [Ca2+]m but is expressed relative to the initial fluorescence intensity.
Figure 5.


Rhod-2/AM labels mitochondria and reports changes in intramitochondrial [Ca2+]. (A) Confocal micrographs of Jurkat cells after incubation with rhod-2/AM (left) or MitoTracker™ Green FM, a mitochondrial marker (center). Rhod-2 labeling of mitochondria (arrowhead) is easily distinguished from labeling of the nucleolus (arrow). An overlay of the two images demonstrates specific colocalization of the two dyes in the mitochondria (right). (B) Mitochondrial Ca2+ imaging with rhod-2. In these pseudocolored video microscopic images of a single TG-treated cell, rhod-2 fluorescence in the mitochondria increases within 3 min after readdition of 2 mM Ca2+ (top). 1 μM CCCP prevents the fluorescence increase in another cell (bottom). Warmer colors indicate higher rhod-2 fluorescence. (C) Quantification of rhod-2 fluorescence in “hot spots” in cells of the experiment shown in B. Hot spot fluorescence was measured before and 3 min after readdition of 2 mM Ca2+. The fluorescence intensity before readdition was normalized to one. 35 cells (control) and 28 cells (+CCCP) were analyzed. Error bars reflect standard deviations. Bar, 5 μm.
For pHi measurements, cells were loaded with 2′,7′-bis(2-carboxylethyl)-5(6)-carboxyfluorescein (BCECF; Molecular Probes) at a concentration of 2 μM (2 mM stock in DMSO) for 45 min at 20°–25°C in complete medium. Cells were illuminated at 440 ± 5 nm and 495 ± 5 nm (bandpass filters; Omega Optical), and the emission at λ > 515 nm (Schott glass filter; Omega Optical) was captured and analyzed as described above for fura-2. Calibration of BCECF ratios was performed using nigericin (a K+/H+ ionophore) and high [K+]o as follows (Thomas et al., 1979). Cells were perfused with a high [K+] Ringer's solution (close to the assumed intracellular [K+]) of the following composition (mM): 29.5 NaCl, 130 KCl, 2 CaCl2, 1 MgCl2, 10 d-glucose, and 5 Hepes. The pH of this solution was set to 6.05, 6.68, 7.25, or 7.63, respectively, with NaOH, and 10 μM nigericin (Molecular Probes; 10 mM stock in ethanol) was added. Under conditions of high internal and external [K+], nigericin equilibrates transmembrane pH. A plot of the fluorescence ratio (495/440) against pHo resulted in a linear calibration curve. Cells were alkalinized by external application of 5 mM NH4Cl, which allows NH3 to quickly diffuse into the cells and bind intracellular protons (Roos and Boron, 1981).
Confocal Microscopy
Jurkat cells were doubly labeled with rhod-2/AM as described above and with 100 nM MitoTrackerTM Green FM (Molecular Probes) for 30 min at 20°–25°C. Excess dye was removed by washing three times. Cells were imaged with a MultiProbe 2010 confocal laser scanning microscope (Molecular Dynamics, Sunnyvale, CA) using a Diaphot 200 inverted microscope and ×60 Plan Apo objective (NA 1.4) (Nikon Inc., Garden City, NY). Cells were illuminated by the 488 nm and 568 nm emission lines of a krypton/argon laser at 10% power, and fluorescence was collected simultaneously at 515–545 nm (bandpass filter; Chroma Technology Corp.) for MitoTrackerTM Green FM and at λ > 590 nm (longpass interference filter; Chroma Technology Corp.) for rhod-2. A 100-μm pinhole was used.
Data Analysis
Data were analyzed using Igor Pro (WaveMetrics, Lake Oswego, OR). Ca2+ clearance rates were measured from several hundred TG-treated cells displaying different [Ca2+]i magnitudes in the presence of Ca2+ o ± mitochondrial inhibitors. In each cell, the rate of ongoing Ca2+ clearance from the cytosol was measured from the rate of decline in [Ca2+]i after rapid perfusion with 0-Ca2+ (EGTA) Ringer's. The recording chamber (vol ∼60 μl) had a 90% exchange time of ∼2 s when perfused with 3 ml of solution in 10 s. The rate of [Ca2+]i decline (Δ[Ca2+]i/Δt) was measured from the steepest slope after addition of EGTA, which occurred within 3–6 s of the solution change.
To quantify loading of the TG-insensitive store (see Figs. 2 and 3), cells were chosen for analysis if they satisfied two criteria: (a) [Ca2+]i was approximately constant (Δ[Ca2+]i/Δt between −0.1 and 0.1 nM/s) over the final 800 s of the Ca2+ readdition period; and (b) [Ca2+]i did not oscillate or undergo spontaneous transitions (e.g., see Fig. 9). 33–53% of the cells met these two criteria. The relative store content was estimated in these cells from the amount of Ca2+ released by 4 μM ionomycin in three different ways: (a) from the maximum rate of [Ca2+]i rise, (b) from the peak [Ca2+]i as fitted by a polynomial function, and (c) by the integral of [Ca2+]i during the ionomycin release transient after correction for the ongoing clearance rate (Bergling, S., R. Dolmetsch, R.S. Lewis, and J. Keizer, manuscript in preparation). Upon addition of ionomycin, the rate at which [Ca2+]i changes is proportional to the rate of Ca2+ release from the TG-insensitive store minus the rate of Ca2+ clearance across the plasma membrane. The clearance rate in Jurkat cells is an approximately linear function of [Ca2+]i up to 1.5 μM (rate constant = 0.057 s−1); thus the clearance rate as a function of time can be estimated by scaling [Ca2+]i by this rate constant. By adding the clearance rate at each time point to the corresponding time derivative of [Ca2+]i, we obtained the rate of release from the store. This curve was then integrated to give a measure of total mitochondrial Ca2+ released. This method is equivalent to a summation of the amount of Ca2+ irreversibly pumped across the plasma membrane, which reflects the total Ca2+ released from mitochondria under the given conditions.
Figure 2.

Ca2+ dependence of uptake by the TG-insensitive Ca2+ store. (A) Cells were stimulated as in Fig. 1 B to load the TG- insensitive store. The loading period was terminated by removing extracellular Ca2+, and 4 μM ionomycin was added subsequently to assay store content. The responses of three single cells from one experiment are superimposed. (B) Store content plotted as a function of the average magnitude of the Ca2+ plateau for individual cells. Three measures of store content are plotted: the peak [Ca2+]i (•), the maximum rate of [Ca2+]i rise (○), and the integral of released Ca2+ (corrected for clearance rate, see Materials and Methods; □) in response to ionomycin. Results were obtained from 964 cells in 11 experiments and binned into 100-nM intervals of [Ca2+]i.
Figure 3.

The TG-insensitive store senses Ca2+ near CRAC channels. Experimental conditions and analysis were identical to Fig. 2 with the exception that conditions during the plateau phase were varied. (A and B) 2 mM Ca2+ (dotted trace, ○) or 20 mM Ca2+ with 8 mM Ni2+ (solid trace) or 5–10 mM Ni2+ (•) was added to create plateaus of comparable magnitude. (C and D) 2 mM Ca2+ was applied to parental Jurkat cells (dotted trace, ○), and 20 mM Ca2+ was applied to CJ-4 cells (solid trace, •), a Jurkat mutant with reduced CRAC channel function. (E and F) 20 mM Ca2+ was added (solid trace, •) and compared to the response to 2 mM Ca2+ (○, data from Fig. 2 B). Graphs show mean values ± SD: parent cells, 2 mM Ca2+ (964 cells/11 experiments), 20 mM Ca2+ + Ni2+ (604/6), 20 mM Ca2+ (439/3); CJ-4 cells, 20 mM Ca2+ (900/5). Each of the experiments in A, C, and E represents the average response of ∼300 cells.
Figure 9.

Abrupt transitions of [Ca2+]i in single cells. Data were obtained from the experiments shown in Fig. 7 A. (A) Superimposition of control responses from eight cells shows rapid transitions from a high Ca2+ to a low Ca2+ plateau. (B) An amplitude histogram from period after Ca2+ readdition in the experiment shown in A is bimodal, indicating that cells spend most of their time in one of two well-defined states. (C) 2 μM antimycin A1 increases the frequency of transitions from the high to low Ca2+ states. (D) Amplitude histogram from period after Ca2+ readdition in the experiment shown in C. The high Ca2+ peak is somewhat lower than in the control cells, probably due to the slow decline in the high Ca2+ plateau illustrated in C.
Results
A TG-insensitive Ca2+ Store in T Cells
In all experiments described below, Jurkat T cells or human T cells were treated with TG to activate capacitative Ca2+ entry, and the lipophilic ionophore ionomycin was applied to probe the content of TG-insensitive Ca2+ stores. Exposure to 1 μM TG in Ca2+-free Ringer's solution fully inhibits the sarco-endoplasmic reticulum Ca2+ATPases of the ER (Thastrup et al., 1990), causing a transient rise in [Ca2+]i due to the unopposed leakage of Ca2+ from stores followed by extrusion across the plasma membrane. As shown in Fig. 1 A (dotted trace), ionomycin releases very little stored intracellular Ca2+ when applied after TG, indicating that TG almost completely depletes the ionomycin-releasable Ca2+pool in resting Jurkat T cells. Readdition of Ca2+ after store depletion causes an initial rapid increase of [Ca2+]i to a peak, which falls slowly thereafter to a plateau level. In cells that have been exposed to a low Ca2+ concentration (0.5 mM; Fig. 1 A, solid trace), the average plateau level is <500 nM, and subsequent removal of Ca2+ o evokes a rapid decline of [Ca2+]i to the basal level as Ca2+ is cleared from the cytosol. Ionomycin-releasable stores remain nearly empty under these conditions, as shown by the small response to ionomycin.
Figure 1.
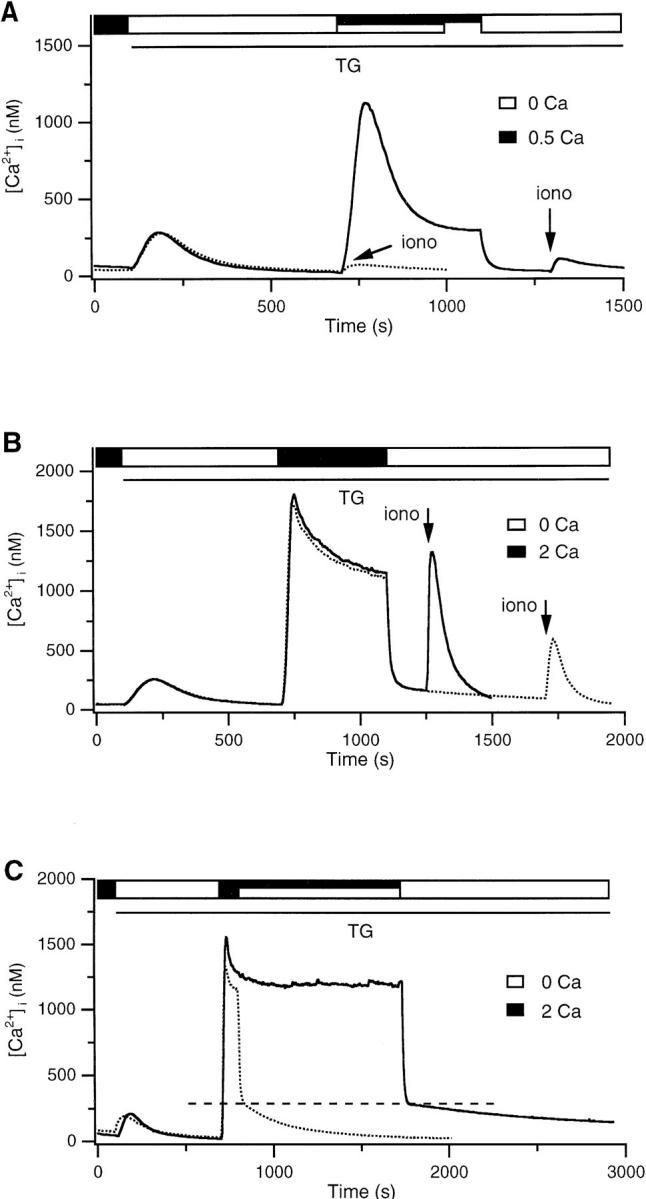
A TG-insensitive Ca2+ store in Jurkat T cells. (A–C) fura-2–loaded cells were treated with 1 μM TG in Ca2+-free Ringer's solution to deplete TG-sensitive stores (open bar). Ca2+ was subsequently readded to elicit capacitative Ca2+ entry (filled bar). Where indicated, 4 μM ionomycin was applied in Ca2+-free Ringer's solution to assay the content of intracellular stores. Each trace represents the average response of ∼300 cells. (A) Readdition of 0.5 mM Ca2+ is not sufficient to load the TG-insensitive store. After exposure to 0.5 mM Ca2+, ionomycin releases a small amount of Ca2+ (solid trace) that is not significantly greater than the amount released before Ca2+ readdition (dotted trace). (B) Readdition of 2 mM Ca2+ loads a TG-insensitive store that is releasable by ionomycin. Two experiments are superimposed, showing that the content of the TG-insensitive store and the low Ca2+ plateau decline in parallel. (C) The TG-insensitive store is loaded during long (1,000 s; solid trace) and short (100 s; dotted trace) exposure to 2 mM Ca2+. In each case, after removal of Ca2+ o, [Ca2+]i returns to baseline with a biphasic time course. The slow recovery phase is lengthened by increasing the loading period.
In contrast, Ca2+ removal does not quickly reduce [Ca2+]i to baseline in cells previously exposed to a higher level of Ca2+ o (Fig. 1 B). Addition of 2 mM Ca2+ elicits a [Ca2+]i plateau >1 μM, and, upon removal of Ca2+ o, [Ca2+]i falls to a slowly declining plateau significantly higher than the resting level. In this case, subsequent application of ionomycin releases a large bolus of stored Ca2+ (Fig. 1 B, solid trace), indicating that Ca2+ was taken up by a TG-insensitive store during the high Ca2+ plateau. The amount of Ca2+ released by ionomycin, and hence the store content, declines in parallel with the low plateau during exposure to Ca2+-free Ringer's solution (dotted trace). This result suggests that Ca2+ is exported from the TG- insensitive store, and the gradual depletion of this source of Ca2+ is responsible for the slowly declining plateau. This conclusion is further supported by the observation that the duration of the low Ca2+ plateau is correlated with the length of time the store was allowed to fill (i.e., the duration of the high Ca2+ plateau; Fig. 1 C). Thus, after Ca2+ removal, the low Ca2+ plateau declines with an exponential time constant τ that varies with loading duration: τ = 232 s (for 100 s loading time; Fig. 1 C, dotted trace), τ = 378 s (for 500 s loading time; Fig. 1 B, dotted trace), and τ = 543 s (for 1,000 s loading time; Fig. 1 C, solid trace). In contrast, the average initial value of the low plateau appears to be independent of the degree of loading (dashed line in Fig. 1 C). These results clearly demonstrate that a TG- insensitive store can rapidly sequester Ca2+ that has entered the T cell via the capacitative Ca2+ entry mechanism, ICRAC.
The loading of the TG-insensitive store appears to depend on the cytosolic Ca2+ concentration since the ionomycin-releasable pool is larger in cells with higher Ca2+ plateaus (compare Fig. 1, A and B). We analyzed the content of the store as a function of the plateau [Ca2+]i in single cells to determine quantitatively the [Ca2+]i dependence of loading. After depleting stores in Ca2+-free Ringer's solution with TG, 2 mM Ca2+ was applied for 1,000 s. This long period was chosen to assure that loading occurred primarily at a single well-defined level of [Ca2+]i. The loading period was terminated by applying Ca2+-free Ringer's for 150 s, followed by 4 μM ionomycin to assess store content. To simplify analysis of the 250–300 single cells of each Ca2+ imaging experiment, we analyzed only those cells (33–53%) that displayed a relatively constant plateau [Ca2+]i (see Materials and Methods). In the three cells meeting this criterion shown in Fig. 2 A, the amount of ionomycin-releasable Ca2+ increased with the size of the Ca2+ plateau. Relative store content was estimated from the maximum rate of [Ca2+]i rise, the peak [Ca2+]i, or the integral of released Ca2+ (after correction for the ongoing clearance rate; see Materials and Methods) in response to ionomycin + EGTA. All three measures of store content gave similar estimates (Fig. 2 B). The content of the TG-insensitive store appears to increase in a biphasic fashion, beginning at [Ca2+]i > 400 nM and increasing without signs of saturation to [Ca2+]i > 1.8 μM. It should be noted that the quantitation of store content in these experiments is complicated by the fact that ionomycin evoked [Ca2+]i elevations as large as 6 μM, far greater than the effective K d of fura-2 for Ca2+ (200–1,000 nM, depending on conditions; Uto et al., 1991). Thus, it is possible that the nonlinear shape of the loading curve is a consequence of a systematic error in fura-2 measurements at high [Ca2+]i. In this regard it is encouraging that the store measurements based on the maximum rate of [Ca2+]i rise gave similar results, as they were made at [Ca2+]i < 1 μM. Some uptake also occurred at [Ca2+]i < 400 nM; a close examination revealed that in cells with plateau [Ca2+]i between 100 and 500 nM, ionomycin evoked an average [Ca2+]i peak of ∼200 nM, which did not increase with [Ca2+]i but was significantly greater than the peak Ca2+ released by ionomycin before store loading (40–80 nM).
The TG-insensitive Store Senses Local Ca2+ near CRAC Channels
In several cell types it has been shown that Ca2+ uptake by organelles such as mitochondria is greatly enhanced by close proximity to sites of Ca2+ release or influx into the cytoplasm (Rizzuto et al., 1993; Hajnoczky et al., 1995; Lawrie et al., 1996). This behavior is thought to result from microdomains of high [Ca2+]i close to Ca2+ sources. If the sites of influx and uptake are closely apposed, uptake should be determined primarily by the local influx rate rather than by global [Ca2+]i far from the influx site. Therefore, to determine whether the TG-insensitive store can sense local Ca2+ accumulation near CRAC channels, we asked whether store loading is sensitive to the driving force for Ca2+ entry under conditions where the global [Ca2+]i is held constant. Store loading was assessed by measurements of the peak [Ca2+]i or release rate in response to ionomycin (both gave identical results). In each set of experiments, Ca2+ flux through individual CRAC channels was increased by raising [Ca2+]o from 2 to 20 mM, while one of several methods was used to equalize the global Ca2+ plateau under the two conditions. In the first set of experiments, 5–10 mM Ni2+ was added to the external medium containing 20 mM Ca2+. Under these conditions, the partial blockade of CRAC channels by Ni2+ compensates for the increased single-channel rate of influx, making the average magnitude of the global Ca2+ plateau comparable to that observed with 2 mM extracellular Ca2+ alone (Fig. 3 A). However, the content of the ionomycin-releasable store was significantly higher in the cells exposed to 20 mM Ca2+. As illustrated by the singlecell analysis in Fig. 3 B, loading of the TG-insensitive store was enhanced at all plateau [Ca2+]i levels >500 nM. Similar results were obtained in a second set of experiments that compared store loading in normal Jurkat cells with that in CJ-4, a mutant Jurkat cell line that exhibits ∼40% of the normal level of CRAC channel function (Fanger et al., 1995). Although the average [Ca2+]i plateau in CJ-4 cells with 20 mM Ca2+ o is slightly lower than that in control cells with 2 mM Ca2+ o, ionomycin releases significantly more Ca2+ from the stores in CJ-4 (Fig. 3 C). As was observed in the Ni2+ experiments, the content of the ionomycin-releasable store was increased in the presence of 20 mM extracellular Ca2+ over a wide range of [Ca2+]i levels (Fig. 3 D). As a third test, we compared store content in single normal cells exposed to 2 or 20 mM Ca2+ that happened to display the same plateau [Ca2+]i. For any given plateau level >100 nM, the loading of the ionomycin- releasable pool was enhanced by previous exposure to 20 mM Ca2+ (Fig. 3, E and F). Together, these results demonstrate that the uptake of Ca2+ into the TG-insensitive store increases with the driving force for Ca2+ entry, irrespective of global [Ca2+]i. Hence, the store uptake mechanism appears able to sense local [Ca2+]i gradients that exist in the proximity of open CRAC channels.
Calcium Uptake by the TG-insensitive Store Is Rapid
In order for the TG-insensitive store to contribute to Ca2+ signaling under a range of physiological conditions, it must be able to take up Ca2+ during transient as well as sustained periods of [Ca2+]i elevation. We therefore determined the [Ca2+]i dependence of store loading during short applications of Ca2+ (8–10 s). This short pulse of Ca2+ elicited a brief spike of [Ca2+]i that declined as Ca2+ was pumped across the plasma membrane (Fig. 4 A). After complete recovery, Ca2+ was applied again; immediately after the end of the pulse, ionomycin was applied to release any Ca2+ that had accumulated in the TG-insensitive store. By aligning the initial falling phases of the two Ca2+ spikes (Fig. 4 B), it is possible to detect Ca2+ released by ionomycin as a result of store loading. As shown by the average response of 40 cells (Fig. 4 B) and in two single cells (Fig. 4 C), [Ca2+]i elevation for 8–10 s causes significant loading of the TG-insensitive store. Results from 62 cells are summarized in Fig. 4 D as a plot of the Ca2+ released by ionomycin against the peak [Ca2+]i immediately before ionomycin (a rough measure of the Ca2+accessible to the store for loading). The amount of Ca2+ released by ionomycin after all Ca2+ spikes >300 nM exceeded the amount released in resting cells (40–80 nM; shaded line), and loading increased nonlinearly above ∼1.5 μM cytosolic Ca2+. The ability of the TG-insensitive store to sequester Ca2+ in response to small, brief Ca2+ spikes suggests that it may participate in modulating transient as well as sustained Ca2+ signals.
Figure 4.

Rapid loading of the TG-insensitive store. (A) After depletion of the TGsensitive store, 20 mM Ca2+ was added twice for 8 s (solid trace) or 10 s (dotted trace) in two separate experiments. 5 s after the second application of Ca2+, 4 μM ionomycin was added to assay the content of the TG-insensitive store. Each trace is the average of 40 cells. (B) The initial falling phases of the two 10-s transients from (A) are aligned on an expanded timescale. Ionomycin releases stored Ca2+ after the second transient (dotted trace). (C) Data from two cells displaying either a high (dotted trace) or a low (solid trace) response to ionomycin. For each cell, the initial falling phases of the two transients are aligned as in B to enable detection of the Ca2+ released by ionomycin. (D) Ca2+ dependence of store loading in response to brief Ca2+ transients. Cells from four experiments were analyzed as described in C. The first pulse was subtracted from the second one, and the peak of the resulting “ionomycin release transient” was taken as a measure of store loading. This is plotted as a function of the peak [Ca2+]i during the second transient before ionomycin. The shaded bar shows the range of ionomycin response (40– 80 nM) observed in resting cells before store loading.
Rhod-2 Reports Changes in Mitochondrial Free Calcium
The behavior of the TG-insensitive Ca2+ store suggests that it may consist of mitochondria. The store is relatively empty under resting conditions and takes up Ca2+ rapidly and without signs of saturation at [Ca2+]i > ∼400 nM, much like mitochondria as studied in other cells (Carafoli, 1987; Gunter and Pfeiffer, 1990; Thayer and Miller, 1990; Friel and Tsien, 1994; Gunter et al., 1994; Herrington et al., 1996). We tested this idea using the Ca2+-sensitive fluorescent indicator rhod-2 (Minta et al., 1989), which has been shown in some cells to accumulate preferentially in mitochondria (Hajnoczky et al., 1995; Rutter et al., 1996; Babcock et al., 1997). After loading cells with rhod-2/AM, we observed diffusely labeled cytoplasm punctuated with brightly fluorescent structures of variable organization among different cells. Confocal microscopy was used to test whether the dye was specifically localized to mitochondria. In double-labeling experiments, rhod-2 and MitoTrackerTM Green FM, a mitochondria-specific dye, were colocalized in most intracellular structures (Fig. 5 A). The only notable difference between the labeling patterns was the result of rhod-2 labeling of one or several round intranuclear structures, most likely representing the nucleolus. Nucleolar and mitochondrial stainings were easily distinguished by virtue of the much lower fluorescence of the nucleolus (Fig. 5 A, left).
Initiation of capacitative Ca2+ entry caused the brightness of mitochondrial rhod-2 to increase by ∼43% within 3 min (Fig 5, B and C), while areas of diffuse rhod-2 fluorescence adjacent to the “hot spots” increased only ∼10% under the same conditions. Since the diffuse areas receive contributions from cytosolic dye and probably some diffusely localized mitochondria as well, their intensity places an upper limit on the contamination of the mitochondrial signal by cytosolic dye. The increase in mitochondrial rhod-2 fluorescence was prevented by preincubation with 1 μM CCCP (Fig. 5, B and C), a membrane-permeant protonophore that rapidly depolarizes mitochondria and effectively inhibits their ability to take up Ca2+ (Thayer and Miller, 1990; Werth and Thayer, 1994; Budd and Nicholls, 1996; Herrington et al., 1996; Park et al., 1996; Babcock et al., 1997). These results directly support the conclusion that the TG-insensitive store represents mitochondria.
Effects of Mitochondrial Inhibitors
To test further whether the store represents mitochondria, we examined the ability of several inhibitors of mitochondrial Ca2+ transport to affect the content of the ionomycinreleasable pool. As described below, these inhibitors did interfere with store loading and therefore enabled us to test whether the store also plays an active role in modulating capacitative Ca2+ entry. In a first series of experiments, CCCP (1 μM) was applied shortly before the readdition of Ca2+ to TG-treated cells. CCCP had two prominent effects: it greatly attenuated the size of the Ca2+ plateau produced by Ca2+ readdition, and it effectively prevented loading of the TG-insensitive store, as indicated by the small amount of Ca2+ released by ionomycin (Fig. 6 A and Table I). The inhibition of loading could result from the fact that CCCP reduced the [Ca2+]i plateau to a level near the threshold for Ca2+ uptake (see Fig. 2 B). However, the ionomycin response was similarly inhibited in the minority of cells that displayed a [Ca2+]i plateau >1 μM (Fig. 6 B), demonstrating that CCCP directly blocks uptake by the store. Similar results were obtained with a related protonophore, FCCP (2 μM). Application of CCCP had little or no effect on [Ca2+]i in resting Jurkat cells (data not shown). However, CCCP added during the high Ca2+ plateau evoked an immediate transient rise in the average [Ca2+]i (Fig. 6 C). The magnitude and the duration of the rise in [Ca2+]i induced by CCCP increased with the duration of store loading, demonstrating that even at these supramicromolar levels of [Ca2+]i, uptake by the store continues for at least 15 min.
Figure 6.
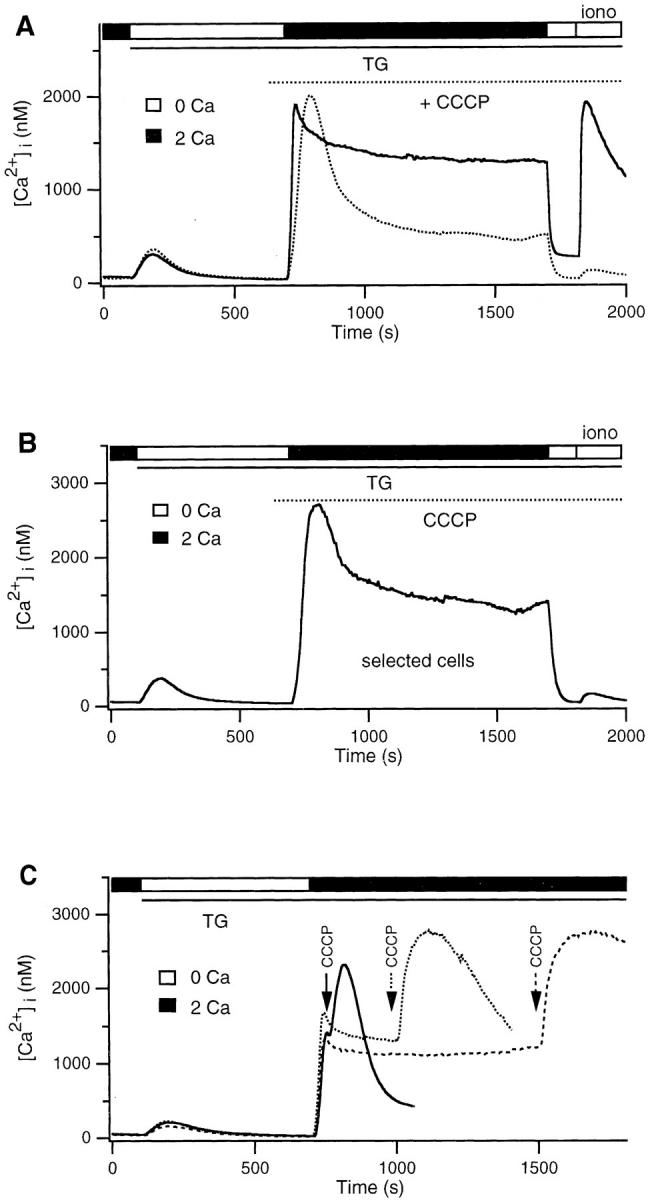
CCCP attenuates the Ca2+ plateau and inhibits loading of the TG-insensitive store. (A) 2 mM Ca2+ was readded to TGtreated cells in the presence (dotted trace) or absence (solid trace) of 1 μM CCCP. After termination of the store loading period, ionomycin was added to assay store content. (B) Average response of CCCP-treated cells selected for a final [Ca2+]i plateau >1 μM from the experiment shown in A (43/264 cells). CCCP prevents store loading even if [Ca2+]i is high. (C) 1 μM CCCP was applied at different times during the plateau response in 2 mM Ca2+. Each trace represents the average of 250–300 cells.
Table I.
Effects of Mitochondrial Inhibitors on the Ca2+ Plateau and Loading of the TG-insensitive Store
| Plateau [Ca2+]i | Store content | |||||||
|---|---|---|---|---|---|---|---|---|
| Jurkat | Human T cells | Jurkat | Human T cells | |||||
| nM | nM | |||||||
| Control (2 mM Ca2+ o) | 1,003 ± 249 (14) | 1,100 (1) | 1,412 ± 555 (14) | 3,052 (1) | ||||
| + CCCP | 399 ± 110 (6) | 623 (1) | 116 ± 15 (3) | 76 (1) | ||||
| + Antimycin A1 | 395 ± 137 (6) | 400 (1) | 626 ± 43 (3) | 1,033 (1) | ||||
| + Antimycin A1/oligomycin | 298 (1) | ND | 60 (1) | ND | ||||
| − Na | 334 ± 64 (5) | 279 (1) | 1,731 ± 699 (2) | 1,929 (1) | ||||
Plateau [Ca2+]i was measured 1,000 s after readdition of Ca2+ to TG-treated cells. The store content of the TG-insensitive store is expressed as the peak [Ca2+]i after addition of ionomycin (see Fig. 2). All values are given as a mean ± SD (number of experiments), and 250–300 cells were analyzed for each experiment.
Qualitatively similar results were observed in cells treated with antimycin A1 (2 μM). Antimycin A1 inhibits electron transport through the respiratory chain at complex III, which by itself prevents oxidative reactions from creating a proton electrochemical gradient across the inner mitochondrial membrane (Mohr and Fewtrell, 1990; Nicholls and Ferguson, 1992; Ali et al., 1994). The Ca2+ plateau was diminished (Fig. 7 A), and uptake by the TGinsensitive store was significantly reduced (Table I), although both effects were not as extreme as those seen in the presence of protonophores. Inhibition of electron transport by itself may not depolarize mitochondria completely; if a supply of ATP is available through glycolysis, mitochondria uncoupled by antimycin can maintain their membrane potential by running the ATP synthase “in reverse,” i.e., by hydrolyzing ATP to pump protons out of the mitochondrial matrix (Mohr and Fewtrell, 1990; Budd and Nicholls, 1996). Oligomycin prevents this by inhibiting the ATP synthase and allows the mitochondria to depolarize (Mohr and Fewtrell, 1990; Budd and Nicholls, 1996). Simultaneous application of antimycin A1 and oligomycin inhibited the high Ca2+ plateau and completely blocked Ca2+ uptake by the TG-insensitive store (Fig. 7 B). As seen after CCCP treatment, ionomycin applied after antimycin A1 + oligomycin failed to release a significant amount of Ca2+ even in the cells that happened to have a [Ca2+]i plateau >1 μM (Fig. 7 C). Together with the effects of the protonophores, these results support the notion that the TG-insensitive store in T cells is mitochondrial. Furthermore, they suggest that Ca2+ uptake by mitochondria is required to maintain the high Ca2+ plateau.
Figure 7.
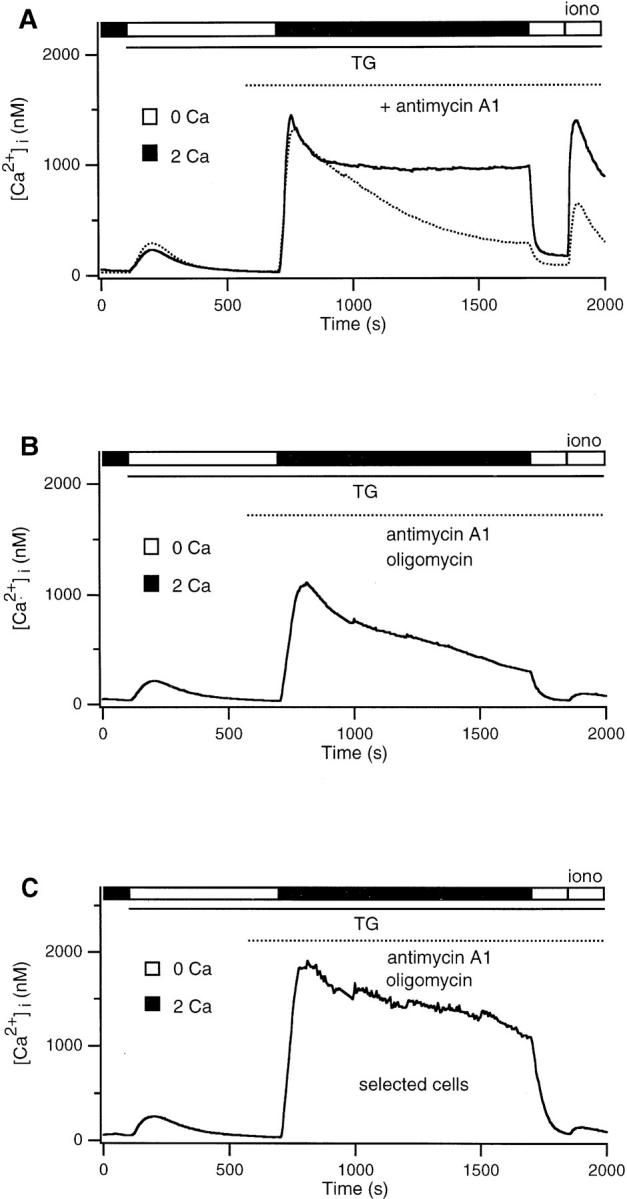
Antimycin A1 + oligomycin attenuates the Ca2+ plateau and inhibits loading of the TG-insensitive store. (A) 2 mM Ca2+ was readded to TG-treated cells in the presence (dotted trace) or absence (solid trace) of 2 μM antimycin A1. Antimycin alone inhibits the plateau and store loading, although part of the reduction in loading is due to the reduced plateau. (B) Antimycin A1 applied together with 5 μg/ml oligomycin completely inhibits store loading. (C) Average response of cells selected for a final [Ca2+]i plateau >1 μM from the experiment shown in B (15/278 cells). Antimycin A1 and oligomycin together completely abolish store loading even if [Ca2+]i is high.
Effects of Na+ Depletion
A large proportion of Ca2+ export from mitochondria is carried out by a Na+/Ca2+ exchanger in the mitochondrial inner membrane (Crompton et al., 1976; Carafoli, 1987; Gunter and Pfeiffer, 1990; Cox and Matlib, 1993; Gunter et al., 1994). As a further test of whether the TG-insensitive store is mitochondrial, we asked whether the depletion of intracellular Na+, a condition that inhibits Na+/ Ca2+ exchange in mitochondria (Crompton et al., 1976; Gunter and Pfeiffer, 1990; Thayer and Miller, 1990; Gunter et al., 1994), enhances the accumulation of Ca2+ in the TG-insensitive store. The removal of external Na+ to deplete Na+ i diminished the Ca2+ plateau evoked by Ca2+ readdition (Fig. 8 A). Similar results were obtained when Na+ was removed 600 s (Fig. 8 A) or 30 s before the readdition of Ca2+. Na+ depletion also enhanced store loading; this is most clearly evident from a comparison of ionomycin-induced release in cells bathed in 0 Na+ (Fig. 8 B, solid trace) or in normal Na+ selected for a comparably low plateau [Ca2+]i (dotted trace). Readdition of Na+ evoked the export of intracellular Ca2+ after a delay of ∼30 s (Fig. 8 C), consistent with the reactivation of mitochondrial Na+/ Ca2+ exchange. Na+ readdition did not elicit a [Ca2+]i rise in cells not previously exposed to Ca2+, i.e., cells in which the TG-insensitive store was empty (data not shown). These results support the idea that mitochondria constitute the TG-insensitive store, and they suggest that Ca2+ export from mitochondria is essential for maintenance of the high Ca2+ plateau.
Figure 8.
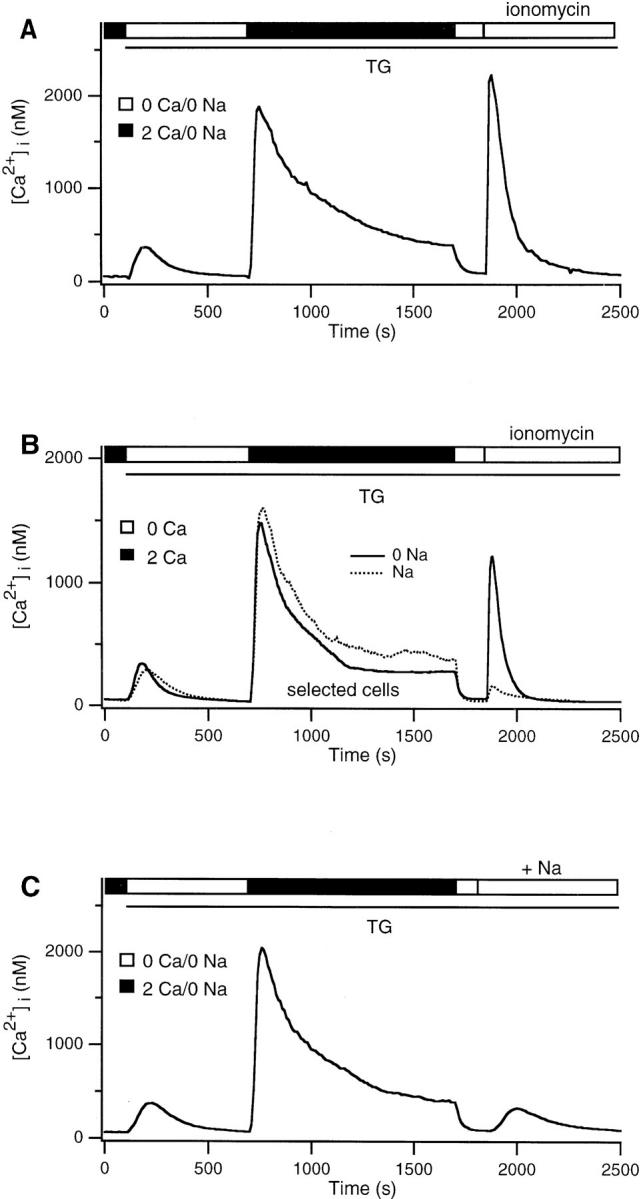
Na+ depletion attenuates the Ca2+ plateau but enhances loading of the TG-insensitive store. (A) In the continuous absence of Na+, 2 mM Ca2+ was readded to TG-treated cells. The plateau was attenuated by Na+ removal, yet ionomycin released a large amount of Ca2+ from the store. (B) Comparison of the average responses of cells in the presence (dotted trace; 17/191 cells) or absence (solid trace; 131/313 cells) of Na+, in which the mean [Ca2+]i was selected to be <500 nM during the last half of the Ca2+ readdition period. Despite similar [Ca2+]i profiles during the loading period, cells bathed in Na+-free solution retain significantly more Ca2+ in the TG-insensitive store. (C) 2 mM Ca2+ was readded to TG-treated cells in Na+-free Ringer's solution as depicted in A. Subsequent addition of Na+ in Ca2+-free Ringer's released Ca2+ from the TG-insensitive store.
Potential Side Effects of Mitochondrial Inhibitors
Several potential nonspecific effects of the inhibitors we applied should be considered, including decreased Ca2+ influx resulting from CRAC channel blockade or depolarization, as well as changes in intracellular pH. Antimycin A1 exhibited neither of these effects (data not shown). As measured with BCECF, Ca2+ readdition caused a slight acidification of the cytoplasm, from a value of 7.52 to 7.44. CCCP did not affect pHi beyond this range. CCCP did suppress the rate of Ca2+ influx by ∼50%, but restoration of the normal rate of entry by elevating [Ca2+]o to 8 mM did not restore the high Ca2+ plateau. Thus, while the reduction in influx by CCCP might contribute to the observed kinetics of the Ca2+ response, it cannot by itself account for the inhibition of the high Ca2+ plateau. Na+ depletion did not affect the Ca2+ influx rate but did increase the acidification observed after Ca2+ readdition to a value of 7.1. However, alkalinization of the cytoplasm to pH 7.44 with 5 mM NH4Cl (see Materials and Methods) did not restore the high Ca2+ plateau in the absence of Na+. This result is consistent with a report that intracellular acidification does not affect capacitative Ca2+ entry in thymocytes (Marriott and Mason, 1995). It should also be noted that even if Na+/Ca2+ exchange is functional in the plasma membrane of Jurkat cells (Balasubramanyam et al., 1993; but see Donnadieu and Trautmann, 1993), inhibition of its activity by Na+ removal would be expected to impede Ca2+ efflux and thus elevate [Ca2+]i, opposite to the effect that was observed. Hence, side effects of the inhibitors are unlikely to account for the observed effects on the Ca2+ plateau. The only exception is oligomycin, which appears to inhibit the clearance of Ca2+ from the cytosol (compare the rates of clearance in 0 Ca2+ o in Fig. 7, A and C). An inhibition of Ca2+ extrusion may account for the unexpected finding that oligomycin slows down the decay of the high Ca2+ plateau in antimycin A1–treated cells despite the fact that it helps to prevent Ca2+ uptake by the mitochondria (Fig. 7, A and B).
Mitochondrial Modulation of Ca2+ Signaling Is Similar in Human T Lymphocytes
The experiments described thus far were carried out using Jurkat cells, a human leukemic T cell line. Unlike normal human T cells that are quiescent before contact with antigen, Jurkat cells proliferate continuously, and it is possible that they express a relative overabundance of mitochondria to cope with their increased metabolic needs. Thus, to extend our results to a more physiological context, it is important to verify that mitochondria exert comparable effects on Ca2+ signaling in normal human T cells isolated from peripheral blood. As summarized in Table I, a TGinsensitive store is loaded by the sustained high Ca2+ plateau in human T cells as it is in Jurkat cells. The loading of the store is decreased or eliminated by antimycin A1 or CCCP, respectively, and is enhanced by Na+ removal (Table I). Moreover, all three conditions preclude maintenance of the high Ca2+ plateau; therefore, mitochondria appear to function in normal quiescent T cells to modulate capacitative Ca2+ entry in a manner similar to that observed in Jurkat cells.
Abrupt Transitions of [Ca2+]i in Single Cells
Examination of single-cell responses to Ca2+ readdition may shed light on the mechanism by which mitochondria help to maintain the high Ca2+ plateau. Under control conditions, most of the cells maintain a high intracellular Ca2+ concentration of >1 μM for the entire 1,000 s of exposure to 2 mM Ca2+ (Fig. 9 A). However, in a minority of cells, [Ca2+]i declines rapidly to a much lower level around 400 nM, a phenomenon that we refer to as a “transition.” In the experiment shown in Fig. 9 A, 14% of the cells showed transitions, which occurred at widely varying times after Ca2+ readdition. An amplitude histogram of [Ca2+]i compiled from 272 cells during the exposure to Ca2+ is depicted in Fig. 9 B. The bimodal shape of the histogram indicates that the cells spend most of their time in one of two states (a high and a low amplitude plateau), with relatively little time spent at intermediate levels. The rate of capacitative Ca2+ entry can be estimated during the high and low Ca2+ states by the rate of [Ca2+]i decline (Δ[Ca2+]i/Δt) immediately after removal of extracellular Ca2+. For the experiment in Fig. 9 A, these values were 56 nM/s and 15 nM/s for the high and low Ca2+ states, respectively. Thus, the transition from high to low Ca2+ plateau reflects a sudden decrease in the rate of Ca2+ influx.
Interestingly, mitochondrial uncouplers (CCCP or antimycin A1) or Na+ depletion increase the likelihood and reduce the latency of these abrupt transitions. The variable latencies of the transitions among single cells play the dominant role in determining the smooth decline of the averaged population Ca2+ response (e.g., Figs. 6 A and 7 A). A number of single-cell responses in the presence of antimycin A1 are superimposed in Fig. 9 C. While the amplitudes of the high and low Ca2+ plateaus (Fig. 9 D) are similar to those seen in control cells, transitions to the low Ca2+ state are much more common, occurring in 63% of the cells (125/200). Similar results were observed with 1 μM CCCP and Na+ depletion (not shown). The implication of these results is that functional mitochondria maintain a high rate of capacitative Ca2+ influx by delaying or preventing abrupt decreases in the influx rate in individual cells.
Discussion
In this study we report that a TG-insensitive store most likely representing mitochondria regulates store-operated Ca2+ signaling in T cells. The store appears to be nearly empty of Ca2+ in resting cells, but after depletion of TGsensitive stores, it senses the local Ca2+ elevation near activated CRAC channels and takes up incoming Ca2+ rapidly and without signs of saturation. The TG-insensitive store plays an active role in maintaining a high rate of Ca2+ entry, and hence a high Ca2+ plateau after the depletion of TG-sensitive stores. These results provide new evidence that mitochondria not only shape Ca2+ signals by acting as high capacity Ca2+ buffers, but that they can dynamically regulate the generation of Ca2+ signals as well.
Evidence for a Mitochondrial Ca2+ Store in T Cells
A mitochondrial Ca2+ store has not been previously described in T cells; therefore, several independent approaches were used to test the idea that the TG-insensitive store is mitochondrial. First, FCCP and CCCP were found to prevent store loading. These protonophores are known to inhibit Ca2+ uptake through the mitochondrial uniporter by collapsing the mitochondrial proton gradient and dissipating the membrane potential across the inner membrane that provides the driving force for Ca2+ import (Thayer and Miller, 1990; Friel and Tsien, 1994; Werth and Thayer, 1994; Budd and Nicholls, 1996; Herrington et al., 1996; Park et al., 1996; Babcock et al., 1997). In addition, CCCP added to cells during the Ca2+ plateau transiently elevates [Ca2+]i. A similar effect has been reported in neurons (Werth and Thayer, 1994) and chromaffin cells (Herrington et al., 1996), and it may be explained by the sudden inhibition of Ca2+ uptake by the mitochondria, which would be expected to increase transiently the net Ca2+ flux into the cytosol from both extracellular and intramitochondrial sources. It is important to note that in some cells protonophores such as FCCP are known to interfere with nonmitochondrial Ca2+ stores (Jensen and Rehder, 1991; Marrion and Adams, 1992). For this reason, we also tested the ability of antimycin and oligomycin to prevent store loading. These agents act differently from the protonophores to depolarize mitochondria and to prevent Ca2+ uptake by inhibiting electron transport and the mitochondrial ATP synthase (Mohr and Fewtrell, 1990; Nicholls and Ferguson, 1992; Ali et al., 1994). Antimycin + oligomycin effectively prevented uptake of Ca2+ by the TG- insensitive store in T cells, consistent with the view that the TG-insensitive store is mitochondrial.
The effects of Na+ removal further support this conclusion. Export of Ca2+ from mitochondria occurs through Na+-dependent and well as Na+-independent mechanisms (Crompton et al., 1976; Carafoli, 1987; Gunter and Pfeiffer, 1990; Cox and Matlib, 1993; Gunter et al., 1994). While the contribution of each appears to vary according to cell type, a significant part of mitochondrial Ca2+ export in many cells is due to Na+/Ca2+ exchange across the inner membrane. Na+ depletion enhances net Ca2+ uptake by mitochondria in vivo and in vitro, while readdition of Na+ triggers its release (Crompton et al., 1976; Thayer and Miller, 1990). Likewise, we found that removal of extracellular Na+, which is expected to deplete intracellular Na+, enhanced the loading of the TG-insensitive store in T cells, and Na+ readdition evoked Ca2+ release. Thus, while none of the several treatments used is absolutely specific for mitochondria, the ability of protonophores, an unrelated electron transport inhibitor, and Na+ depletion to affect loading of the store argues strongly that it represents mitochondria.
Finally, experiments with rhod-2 offer independent evidence for a mitochondrial Ca2+ store. Rhod-2 has been used to detect changes in mitochondrial [Ca2+] in several cells, including hepatocytes (Hajnoczky et al., 1995), CHO cells (Rutter et al., 1996), and chromaffin cells (Babcock et al., 1997). The precise location of rhod-2 within mitochondria has not to our knowledge been demonstrated in any cell. However, several factors argue that the dye reports primarily [Ca2+] in the matrix rather than in the space between mitochondrial inner and outer membranes: (a) the intermembrane volume is small compared to the matrix volume; (b) porins and voltage-dependent anion-selective channels in the outer membrane would be expected to conduct rhod-2 out of the intermembrane space (Zalman et al., 1980); and (c) the highly negative potential that exists across the inner but not the outer membrane (Benz, 1994) would be expected to promote accumulation of positively charged rhod-2 in the matrix. We found that rhod-2 labeled the mitochondria in Jurkat cells, as judged from its colocalization with a selective mitochondrial stain, MitoTracker™ Green FM. The compartmentalized rhod-2 increased its fluorescence in response to increases in [Ca2+]i, and this response was inhibited by CCCP. These studies provide the most direct evidence that mitochondria do in fact constitute the TG-insensitive store in T cells.
Interestingly, cyclic ADP ribose has recently been shown to release Ca2+ from a TG-insensitive store in permeabilized Jurkat T cells (Guse et al., 1995). It is not clear how this store is related to the mitochondrial store we describe. One possibility is that cyclic ADP ribose releases Ca2+ from mitochondria; alternatively, a separate cyclic ADP ribose-sensitive store may be responsible for the small amount of Ca2+ released by ionomycin in resting cells (Fig. 1) or in cells treated with mitochondrial inhibitors (Figs. 6 and 7).
Properties of the Mitochondrial Ca2+ Store
Several characteristics of the TG-insensitive store are consistent with the known behavior of mitochondria in other cells and in vitro (Carafoli, 1987; Gunter and Pfeiffer, 1990; Gunter et al., 1994). These features include the modest threshold of ∼400 nM for Ca2+ uptake, and high capacity that shows no signs of saturation even at high [Ca2+]i (>1.8 μM) sustained over long periods (10–20 min). Occasionally, we observed signficant uptake at [Ca2+]i of 100– 400 nM, implying that the threshold for uptake may be quite close to resting [Ca2+]i in some cells. Alternatively, some mitochondria in these “hypersensitive” cells may simply lie close to the plasma membrane or near a region of high CRAC channel density, where they are exposed to high local [Ca2+]i (see below). Interestingly, the Ca2+ dependence of loading appears to be biphasic, consisting of a low rate of uptake at low [Ca2+]i and a faster nonlinear rate at higher [Ca2+]i. The nonlinear increase in uptake with [Ca2+]i is consistent with reports that the activity of the uniporter in vitro increases with the second power of [Ca2+] (Gunter and Pfeiffer, 1990).
Calcium uptake by mitochondria in T cells is rapid, occurring within 8–10 s at physiological levels of [Ca2+]i (Fig. 4). Comparably rapid uptake has been detected with rhod-2 or mitochondrially targeted aequorin in other cells after Ca2+ release from IP3-sensitive stores (Rizzuto et al., 1993, 1994; Hajnoczky et al., 1995). A recent report of hepatocyte mitochondria in vitro has resolved two modes of Ca2+ uptake: a rapid mode that is active at [Ca2+]i as low as 171 nM and inactivates within 1 s, and a slower mode that is activated in a sustained fashion by [Ca2+]i > ∼400 nM (Sparagna et al., 1995). Unfortunately, it is difficult to assess the contributions of each mode to the Ca2+ loading we have observed, due to the relatively slow rise time of the [Ca2+]i increase in our experiments.
The Mitochondrial Store Can Sense Local Ca2+ Gradients near CRAC Channels
We find that mitochondrial uptake at any given level of global cytosolic [Ca2+]i is enhanced by increasing the driving force for Ca2+ entry. This result implies that the store responds not merely to the global [Ca2+]i averaged over the entire cell, but to localized Ca2+ gradients that exist in the vicinity of open CRAC channels as well. Previous studies in hepatocytes and HeLa cells have shown that Ca2+ released from IP3-sensitive stores is taken up by mitochondria more efficiently than comparable amounts of Ca2+ entering through plasma membrane channels, suggesting that in those cells mitochondria can sense the Ca2+ microdomains near open IP3 receptors (Rizzuto et al., 1993; Hajnoczky et al., 1995). This result does not apply to all cells, however; in endothelial cells, for example, mitochondrial Ca2+ is more efficiently raised by Ca2+ influx across the plasma membrane than by ER release (Lawrie et al., 1996). Interestingly, EM measurements indicate that more of the mitochondria in HeLa cells are close to the ER than to the plasma membrane, whereas the opposite is true for endothelial cells. In Jurkat and peripheral blood T cells, the nucleus occupies most of the cell volume, thus confining the mitochondria to a region close to the plasma membrane. Although a detailed ultrastructural analysis remains to be done, a substantial proportion of mitochondrial profiles can be seen within 100–500 nm of the plasma membrane in electron micrographs of T cells (Veerman and van Rooijen, 1975; Huhn et al., 1976; Facchetti et al., 1988). Thus, it appears reasonable that mitochondria are able to sense local gradients in the proximity of CRAC channels.
How much of the Ca2+ that enters the T cell through CRAC channels is taken up by mitochondria? A rough estimate can be made as follows. During the high Ca2+ plateau, influx and efflux of Ca2+ from the cytosol are equal. Thus, influx through CRAC channels is balanced by net uptake into mitochondria plus extrusion across the plasma membrane. At a plateau level of 1 μM, the extrusion rate (measured in 0 Ca2+ + CCCP) is 50 nM s−1. The total mitochondrial content as estimated by the integral of ionomycin-released Ca2+ is ∼5 μM (Fig. 2 B), which upon dividing by the loading time (1,000 s) implies an average rate of 5 nM s−1 for net uptake. Thus, during the high Ca2+ plateau, the rate of capacitative Ca2+ entry is equal to 50 nM s−1 (the extrusion rate) plus 5 nM s−1 (the net mitochondrial uptake rate), or 55 nM s−1. By this estimate, mitochondria may accumulate ∼10% (5/55) of the incoming Ca2+. Since mitochondria are also continously exporting Ca2+, the true uptake rate is likely to exceed 5 nM s−1, as explained by the following argument. After Ca2+ removal, the low Ca2+ plateau declines slowly, implying that Ca2+ extrusion across the plasma membrane is nearly balanced by the release of Ca2+ from mitochondria (the only significant source of Ca2+ in these TG-treated cells). The extrusion rate was measured to be ∼15 nM s−1 at cytosolic Ca2+ values corresponding to the low Ca2+ plateau (see Materials and Methods). Therefore, the implied unidirectional uptake rate is 20 nM s−1 (5 nM s−1 net uptake plus 15 nM s−1 export), suggesting that ∼36% (20/55) of the incoming Ca2+ enters the mitochondria.
Mitochondria Help Maintain a High Rate of Capacitative Calcium Entry
Functional mitochondria appear to help maintain a high rate of capacitative Ca2+ entry after the continued depletion of IP3/TG-sensitive stores. This conclusion follows from the ability of several types of mitochondrial inhibitors to dramatically reduce the level of the Ca2+ plateau. The gradual decline in the population average [Ca2+]i in the presence of mitochondrial inhibitors results primarily from abrupt stochastic transitions between states of high and low Ca2+ influx occurring asynchronously in each cell. While these transitions take place even in control cells, the inhibitors increase their frequency and decrease their latency. Thus, functional mitochondria appear to maintain the high Ca2+ plateau by preventing or delaying an abrupt decrease in the Ca2+ influx rate.
The reduction of capacitative Ca2+ entry during the transitions is extremely rapid. In single cells, the rate of [Ca2+]i decline during a transition reaches a maximal value that can be as much as two-thirds of the Ca2+ clearance rate measured in the absence of Ca2+ o, and this can be reached within 5 s of the onset of the transition. These results imply that capacitative Ca2+ entry is reduced by about two-thirds in <5 s. The mechanism that governs these rapid flux-rate transitions is unknown. The rapid time course is reminiscent of the permeability transition of mitochondria, a catastrophic increase in permeability to small solutes and ions that can be triggered by excessive loading of mitochondria with Ca2+ (Gunter and Pfeiffer, 1990; Gunter et al., 1994). However, this process would release the entire mitochondrial Ca2+ content in an explosive fashion, and an increase in [Ca2+]i was never observed immediately preceding the transitions. For this reason, we believe it is unlikely that the [Ca2+]i transitions we have observed involve the permeability transition of mitochondria. Alternatively, the flux-rate transitions may result from Ca2+ accumulation and the Ca2+-dependent inactivation of CRAC channels (see below) or from membrane depolarization, which is known to profoundly inhibit Ca2+ entry through CRAC channels (for review see Lewis and Cahalan, 1995). Tests of these possible mechanisms await further study.
In what capacity do the mitochondria act to maintain capacitative Ca2+ entry? Given the dominant role of mitochondria in producing most of the cell's ATP, one obvious possibility is that mitochondria are required to maintain a high [ATP]/[ADP] ratio in the cell. Gamberucci et al. (1994) reported inhibitory effects of mitochondrial poisons on the TG-induced [Ca2+]i rise in Jurkat cells and several other cell lines, an effect they attributed to a decreased [ATP]/ [ADP] ratio or most likely to increased [ADP]. Later patch-clamp studies in rat basophilic leukemia cells demonstrated that increased [ADP] can inhibit ICRAC (Innocenti et al., 1996). ATP depletion also inhibits capacitative Ca2+ entry in rat thymocytes at 37°C (Marriott and Mason, 1995). However, even though changes in [ATP]/[ADP] could certainly contribute to the effects of mitochondrial inhibitors we have seen, a number of arguments suggest that they are not primarily responsible for these effects. First, ADP inhibits ICRAC at 37°C but not at 25°C, and the effects of mitochondrial inhibitors on the Ca2+ response at 37°C are reduced in the presence of glucose (Innocenti et al., 1996). We conducted all experiments below 25°C and included 10 mM extracellular glucose to provide a substrate for glycolytic ATP production that has been shown to be sufficient to keep ATP levels high (Mohr and Fewtrell, 1990; Budd and Nicholls, 1996). Second, antimycin A1 (Fig. 6) and CCCP (data not shown) inhibited the high Ca2+ plateau even when oligomycin was included to prevent reverse-mode hydrolysis of ATP by the ATP synthase. Third, CCCP, antimycin, or Na+ depletion did not alter the rate of Ca2+ clearance after prolonged Ca2+ elevation (data not shown), suggesting that none of these treatments caused a gross depletion of intracellular ATP. Finally, the initial Ca2+ influx rate in CCCP-treated cells was constant (38 nM/s) in response to multiple readditions of Ca2+ separated by a 200-s recovery period in 0 Ca2+ o. These results argue against a long-lasting depletion of intracellular ATP as the basis for the observed effects on the Ca2+ plateau.
Hypothesis for the Mitochondrial Regulation of Capacitative Calcium Entry
Inhibition of either mitochondrial Ca2+ uptake (by CCCP or antimycin A1) or export (by Na+ depletion) attenuates the high Ca2+ plateau, suggesting that both uptake and export of Ca2+ are necessary to maintain a high rate of capacitative Ca2+ entry. A model based on Ca2+-dependent inhibition of CRAC channels (Hoth and Penner, 1993; Zweifach and Lewis, 1995a ,b) may provide a way to reconcile these results. As shown in Fig. 10 A, in the absence of functional mitochondria (e.g., with CCCP or antimycin + oligomycin present), Ca2+ entering the cell through CRAC channels accumulates near the plasma membrane and inhibits Ca2+ entry, leading eventually to a steadystate level of ICRAC and [Ca2+]i. Intracellular Ca2+ inhibits ICRAC in several ways. Fast inactivation is thought to involve binding of Ca2+ to sites located within several nanometers of the intracellular mouth of the channels (Zweifach and Lewis, 1995a ), while slow inactivation occurs via store refilling as well as by a store-independent process that persists in the presence of TG (Zweifach and Lewis, 1995b). Slow inactivation can be prevented by intracellular EGTA, implying that the Ca2+ binding sites underlying this process are located further than ∼100 nm from the channels (Zweifach and Lewis, 1995a ,b). Considering the evidence that mitochondria can sense [Ca2+]i gradients near CRAC channels (Fig. 3), it seems reasonable that they may reduce [Ca2+]i at locations that influence slow inactivation. Effects on fast inactivation are less likely given the extreme constraints that the inactivation site would place on mitochondrial location and uptake rates. Thus, when mitochondria are allowed to take up but not export Ca2+ (e.g., in Na+-depleted cells; Fig. 10 B), they may act as a sink to reduce the local [Ca2+]i. The reduction of local [Ca2+]i would lessen CRAC channel inactivation until a new steady state is reached, in which ICRAC is somewhat greater than it was before and the local [Ca2+]i is somewhat less than it was before. Thus, the paradoxical result would be that, without export, mitochondrial uptake would enhance ICRAC but not necessarily global [Ca2+]i. Only if Ca2+ export from mitochondria is also permitted (e.g., in untreated cells; Fig. 10 C) can the increased Ca2+ influx contribute effectively to the global [Ca2+]i. Thus, mitochondria may serve two functions; as Ca2+ buffers, they remove Ca2+ from sites where it inhibits CRAC channels, and through Ca2+ export, they redistribute it to distant sites where it does not inhibit ICRAC. To explain why transitions are uncommon in normal cells, we would speculate that the redistribution of Ca2+ by mitochondria helps to prevent transitions. As discussed above, further study will be required to test this hypothesis.
Figure 10.

A hypothesis for mitochondrial modulation of capacitative Ca2+ entry. (A) When Ca2+ uptake by mitochondria is blocked, Ca2+ accumulates near CRAC channels and inhibits them (bold dashed line). A steady-state [Ca2+]i near the channels is reached as a result of this negative feedback. (B) Sequestration of Ca2+ by mitochondria in the absence of export reduces the local [Ca2+]i, thereby partially relieving inactivation of ICRAC (thin dashed line). At steady state, ICRAC is larger than in A, but much of the Ca2+ from this increased influx is sequestered and hence is not available to enhance global [Ca2+]i. (C) In the presence of normal mitochondrial uptake and release of Ca2+, mitochondria redistribute the Ca2+ derived from enhanced ICRAC to distant sites where it can elevate global [Ca2+]i.
Possible Physiological Roles of Mitochondria during T Cell Activation
The properties described here for the mitochondrial Ca2+ store are consistent with a role of mitochondria in Ca2+ signaling during T cell activation by antigen. Stimulation of the T cell receptor by antigen or polyclonal mitogens is known to elevate [Ca2+]i to levels of 0.5 to >1 μM in human T cells and Jurkat cells, largely by triggering Ca2+ influx through CRAC channels (Lewis and Cahalan, 1995). The [Ca2+]i rise can take a variety of forms, including sustained Ca2+ plateaus, periodic oscillations, and irregular Ca2+ transients (Lewis and Cahalan, 1989; Donnadieu et al., 1992a ,b; Negulescu et al., 1996). The modest threshold and rapid kinetics of Ca2+ uptake by mitochondria in T cells, as well as their ability to sense Ca2+ in the vicinity of CRAC channels, should enable them to respond to and modulate these Ca2+ signals. Ca2+-dependent activation of the T cell transcription factor NFAT is rapidly reversible, and this characteristic is believed to underlie the requirement for sustained [Ca2+]i elevation during T cell activation (Shibasaki et al., 1996; Timmerman et al., 1996). Mitochondria may therefore help to enhance NFAT-dependent transcription and T cell activation by prolonging Ca2+ plateaus, or by slowly releasing sequestered Ca2+ to lengthen Ca2+ transients.
One of the most commonly ascribed functions of mitochondria is to buffer pathophysiological rises of [Ca2+]i. Such a role may be an especially important safeguard in T cells considering the prolonged period of [Ca2+]i elevation needed to commit cells to the activation pathway. In addition, increases in [Ca2+]m are known to activate several dehydrogenases that supply substrates to the Kreb's cycle, an action that has been interpreted as a means of upregulating ATP generation in response to increased metabolic demand in the heart and liver (Gunter et al., 1994; Hansford, 1994). In an analogous fashion, Ca2+ influx through CRAC channels may signal mitochondria to prepare quiescent T cells for the increased metabolic commitments associated with entry into the cell cycle and cell proliferation. Thus, mitochondria may fill multiple roles in the T cell, acting within a feedback loop to sense and regulate Ca2+ entry via store-operated Ca2+ channels, while preparing the cell for the increased demands of cell activation.
Acknowledgments
The authors thank Alexandra B. Nelson for participation in early experiments, Adam Zweifach and Ricardo Dolmetsch for helpful discussions, and Donald Button and Ricardo Dolmetsch for a critique of the manuscript.
This work was supported by postdoctoral fellowships from Boehringer Ingelheim Fonds and the Human Frontier Science Program (to M. Hoth), by a National Institutes of Health (NIH) predoctoral training grant (to C.M. Fanger), and by NIH grant GM45374 (to R.S. Lewis).
Abbreviations used in this paper
- BCECF
2′,7′-bis(2-carboxylethyl)- 5(6)-carboxyfluorescein
- [Ca2+]i
cytosolic Ca2+ concentration
- [Ca2+]m
mitochondrial Ca2+ concentration
- CCCP
carbonyl cyanide m-chlorophenylhydrazone
- CRAC
Ca2+ release-activated Ca2+
- FCCP
carbonyl cyanide p-trifluoromethoxyphenylhydrazone
- TG
thapsigargin
Footnotes
M. Hoth would like to dedicate this paper to his late friend Kai Stockhusen, with whom he learned in school about the importance of the mitochondrial Ca2+ store.
Please address all correspondence to Markus Hoth, Department of Molecular and Cellular Physiology, Stanford University School of Medicine, Stanford, CA 94305-5426. Tel.: (415) 723-9623. Fax: (415) 725-8021. e-mail: mhoth@leland.stanford.edu
References
- Ali H, Maeyama K, Sagi-Eisenberg R, Beaven MA. Antigen and thapsigargin promote influx of Ca2+ in rat basophilic RBL-2H3 cells by ostensibly similar mechanisms that allow filling of inositol 1,4,5-trisphosphatesensitive and mitochondrial Ca2+stores. Biochem J. 1994;304:431–440. doi: 10.1042/bj3040431. [DOI] [PMC free article] [PubMed] [Google Scholar]
- Ankarcrona M, Dypbukt JM, Bonfoco E, Zhivotovsky B, Orrenius S, Lipton SA, Nicotera P. Glutamate-induced neuronal death: a succession of necrosis or apoptosis depending on mitochondrial function. Neuron. 1995;15:961–973. doi: 10.1016/0896-6273(95)90186-8. [DOI] [PubMed] [Google Scholar]
- Babcock DF, Herrington J, Goodwin PC, Park YB, Hille B. Mitochondrial participation in the intracellular Ca2+network. J Cell Biol. 1997;136:833–844. doi: 10.1083/jcb.136.4.833. [DOI] [PMC free article] [PubMed] [Google Scholar]
- Balasubramanyam M, Kimura M, Aviv A, Gardner JP. Kinetics of calcium transport across the lymphocyte plasma membrane. Am J Physiol. 1993;265:C321–C327. doi: 10.1152/ajpcell.1993.265.2.C321. [DOI] [PubMed] [Google Scholar]
- Benz R. Permeation of hydrophilic solutes through mitochondrial outer membranes: review on mitochondrial porins. Biochim Biophys Acta. 1994;1197:167–196. doi: 10.1016/0304-4157(94)90004-3. [DOI] [PubMed] [Google Scholar]
- Berridge MJ. Capacitative calcium entry. Biochem J. 1995;312:1–11. doi: 10.1042/bj3120001. [DOI] [PMC free article] [PubMed] [Google Scholar]
- Budd SL, Nicholls DG. A reevaluation of the role of mitochondria in neuronal Ca2+homeostasis. J Neurochem. 1996;66:403–411. doi: 10.1046/j.1471-4159.1996.66010403.x. [DOI] [PubMed] [Google Scholar]
- Carafoli E. Intracellular calcium homeostasis. Annu Rev Biochem. 1987;56:395–433. doi: 10.1146/annurev.bi.56.070187.002143. [DOI] [PubMed] [Google Scholar]
- Cox DA, Matlib MA. Modulation of intramitochondrial free Ca2+ concentration by antagonists of Na+-Ca2+exchange. Trends Pharmacol Sci. 1993;14:408–413. doi: 10.1016/0165-6147(93)90063-P. [DOI] [PubMed] [Google Scholar]
- Crompton M, Capano M, Carafoli E. The sodium-induced efflux of calcium from heart mitochondria. Eur J Biochem. 1976;69:453–462. [Google Scholar]
- Dolmetsch R, Lewis RS. Signaling between intracellular Ca2+ stores and depletion-activated Ca2+ channels generates [Ca2+]ioscillations in T lymphocytes. J Gen Physiol. 1994;103:365–388. doi: 10.1085/jgp.103.3.365. [DOI] [PMC free article] [PubMed] [Google Scholar]
- Donnadieu E, Trautmann A. Is there a Na+/Ca2+ exchanger in macrophages and in lymphocytes? . Pflügers Arch. 1993;424:448–455. doi: 10.1007/BF00374907. [DOI] [PubMed] [Google Scholar]
- Donnadieu E, Bismuth G, Trautmann A. Calcium fluxes in T lymphocytes. J Biol Chem. 1992a;267:25864–25872. [PubMed] [Google Scholar]
- Donnadieu E, Cefai D, Tan YP, Paresys G, Bismuth G, Trautmann A. Imaging early steps of human T cell activation by antigen-presenting cells. J Immunol. 1992b;148:2643–2653. [PubMed] [Google Scholar]
- Facchetti F, De Wolf-Peeters C, van den Oord JJ, De Vos R, Desmet VJ. Plasmacytoid T cells: a cell population normally present in the reactive lymph node. Hum Pathol. 1988;19:1085–1092. doi: 10.1016/s0046-8177(88)80091-1. [DOI] [PubMed] [Google Scholar]
- Fanger CM, Hoth M, Crabtree GR, Lewis RS. Characterization of T cell mutants with defects in capacitative calcium entry: genetic evidence for the physiological roles of CRAC channels. J Cell Biol. 1995;131:655–667. doi: 10.1083/jcb.131.3.655. [DOI] [PMC free article] [PubMed] [Google Scholar]
- Fasolato C, Innocenti B, Pozzan T. Receptor-activated Ca2+ influx: how many mechanisms for how many channels? . Trends Pharmacol Sci. 1994;15:77–83. doi: 10.1016/0165-6147(94)90282-8. [DOI] [PubMed] [Google Scholar]
- Friel DD, Tsien RW. An FCCP-sensitive Ca2+ store in bullfrog sympathetic neurons and its participation in stimulus-evoked changes in [Ca2+]i . J Neurosci. 1994;14:4007–4024. doi: 10.1523/JNEUROSCI.14-07-04007.1994. [DOI] [PMC free article] [PubMed] [Google Scholar]
- Gamberucci A, Innocenti B, Fulceri R, Bànhegyi G, Giunti R, Pozzan T, Benedetti A. Modulation of Ca2+influx dependent on store depletion by intracellular adenine-guanine nucleotide levels. J Biol Chem. 1994;269:23597–23602. [PubMed] [Google Scholar]
- Goldsmith MA, Weiss A. Early signal transduction by the antigen receptor without commitment to T cell activation. Science (Wash DC) 1988;240:1029–1031. doi: 10.1126/science.3259335. [DOI] [PubMed] [Google Scholar]
- Gunter TE, Pfeiffer DR. Mechanisms by which mitochondria transport calcium. Am J Physiol. 1990;258:C755–C786. doi: 10.1152/ajpcell.1990.258.5.C755. [DOI] [PubMed] [Google Scholar]
- Gunter TE, Gunter KK, Sheu S-S, Gavin CE. Mitochondrial calcium transport: physiological and pathological relevance. Am J Physiol. 1994;267:C313–C339. doi: 10.1152/ajpcell.1994.267.2.C313. [DOI] [PubMed] [Google Scholar]
- Guse AH, da Silva CP, Emmrich F, Ashamu GA, Potter BVL, Mayr GW. Characterization of cyclic adenosine diphosphate-ribose- induced Ca2+release in T lymphocyte cell lines. J Immunol. 1995;155:3353–3359. [PubMed] [Google Scholar]
- Hajnoczky G, Robb-Gaspers LD, Seitz MB, Thomas AP. Decoding of cytosolic calcium oscillations in the mitochondria. Cell. 1995;82:415–424. doi: 10.1016/0092-8674(95)90430-1. [DOI] [PubMed] [Google Scholar]
- Hansford RG. Physiological role of mitochondrial Ca2+transport. J Bioenerg Biomembr. 1994;26:495–508. doi: 10.1007/BF00762734. [DOI] [PubMed] [Google Scholar]
- Herrington J, Park YB, Babcock DF, Hille B. Dominant role of mitochondria in clearance of large Ca2+loads from rat adrenal chromaffin cells. Neuron. 1996;16:219–228. doi: 10.1016/s0896-6273(00)80038-0. [DOI] [PubMed] [Google Scholar]
- Hoth M, Penner R. Calcium release-activated calcium current in rat mast cells. J Physiol (Lond) 1993;465:359–386. doi: 10.1113/jphysiol.1993.sp019681. [DOI] [PMC free article] [PubMed] [Google Scholar]
- Huhn D, Rodt H, Thiel E, Fink U, Ruppelt W. Elektronenmikroskopische und immunhistochemische Untersuchungen an menschlichen Lymphozyten. Blut. 1976;32:87–102. doi: 10.1007/BF00995936. [DOI] [PubMed] [Google Scholar]
- Innocenti B, Pozzan T, Fasolato C. Intracellular ADP modulates the Ca2+ release-activated Ca2+ current in a temperature- and Ca2+-dependent way. J Biol Chem. 1996;271:8582–8587. doi: 10.1074/jbc.271.15.8582. [DOI] [PubMed] [Google Scholar]
- Jensen JR, Rehder V. FCCP releases Ca2+from a non-mitochondrial store in an identified Helisoma neuron. Brain Res. 1991;551:311–314. doi: 10.1016/0006-8993(91)90947-t. [DOI] [PubMed] [Google Scholar]
- Jouaville LS, Ichas F, Holmuhamedov EL, Camacho P, Lechleiter JD. Synchronization of calcium waves by mitochondrial substrates in Xenopus laevisoocytes. Nature (Lond) 1995;377:438–441. doi: 10.1038/377438a0. [DOI] [PubMed] [Google Scholar]
- Lawrie AM, Rizzuto R, Pozzan T, Simpson AWM. A role for calcium influx in the regulation of mitochondrial calcium in endothelial cells. J Biol Chem. 1996;271:10753–10759. doi: 10.1074/jbc.271.18.10753. [DOI] [PubMed] [Google Scholar]
- Lewis RS, Cahalan MD. Mitogen-induced oscillations of cytosolic Ca2+ and transmembrane Ca2+current in human leukemic T cells. Cell Regul. 1989;1:99–112. doi: 10.1091/mbc.1.1.99. [DOI] [PMC free article] [PubMed] [Google Scholar]
- Lewis RS, Cahalan MD. Potassium and calcium channels in lymphocytes. Annu Rev Immunol. 1995;13:623–653. doi: 10.1146/annurev.iy.13.040195.003203. [DOI] [PubMed] [Google Scholar]
- Marrion NV, Adams PR. Release of intracellular calcium and modulation of membrane currents by caffeine in bull-frog sympathetic neurones. J Physiol (Lond) 1992;445:515–535. doi: 10.1113/jphysiol.1992.sp018937. [DOI] [PMC free article] [PubMed] [Google Scholar]
- Marriott I, Mason MJ. ATP depletion inhibits capacitative Ca2+entry in rat thymic lymphocytes. Am J Physiol. 1995;269:C766–C774. doi: 10.1152/ajpcell.1995.269.3.C766. [DOI] [PubMed] [Google Scholar]
- Minta A, Kao JPY, Tsien RY. Fluorescent indicators for cytosolic calcium based on rhodamine and fluorescein chromophores. J Biol Chem. 1989;264:8171–8178. [PubMed] [Google Scholar]
- Mohr FC, Fewtrell C. The effect of mitochondrial inhibitors on calcium homeostasis in tumor mast cells. Am J Physiol. 1990;258:C217–C226. doi: 10.1152/ajpcell.1990.258.2.C217. [DOI] [PubMed] [Google Scholar]
- Negulescu PA, Shastri N, Cahalan MD. Intracellular calcium dependence of gene expression in single T lymphocytes. Proc Natl Acad Sci USA. 1994;91:2873–2877. doi: 10.1073/pnas.91.7.2873. [DOI] [PMC free article] [PubMed] [Google Scholar]
- Negulescu PA, Khan A, Krasieva TB, Kerschbaum HH, Cahalan MD. Polarity of T cell shape, motility, and sensitivity to antigen. Immunity. 1996;4:421–430. doi: 10.1016/s1074-7613(00)80409-4. [DOI] [PubMed] [Google Scholar]
- Nicholls, D.G., and S.J. Ferguson. 1992. Bioenergetics 2. Academic Press, London. 255 pp.
- Nichols, B.J., and R.M. Denton. 1995. Towards the molecular basis for the regulation of mitochondrial dehydrogenases by calcium ions. Mol. Cell. Biochem. 149/150:203–212. [DOI] [PubMed]
- Park YB, Herrington J, Babcock DF, Hille B. Ca2+clearance mechanisms in isolated rat adrenal chromaffin cells. J Physiol (Lond) 1996;492:329–346. doi: 10.1113/jphysiol.1996.sp021312. [DOI] [PMC free article] [PubMed] [Google Scholar]
- Partiseti M, Le Diest F, Hivroz C, Fischer A, Korn H, Choquet D. The calcium current activated by T cell receptor and store depletion in human lymphocytes is absent in a primary immunodeficiency. J Biol Chem. 1994;51:32327–32335. [PubMed] [Google Scholar]
- Penner R, Fasolato C, Hoth M. Calcium influx and its control by calcium release. Curr Opin Neurobiol. 1993;3:368–374. doi: 10.1016/0959-4388(93)90130-q. [DOI] [PubMed] [Google Scholar]
- Putney JW, Jr, Bird GSJ. The inositol phosphate-calcium signaling system in nonexcitable cells. Endocr Rev. 1993;14:610–631. doi: 10.1210/edrv-14-5-610. [DOI] [PubMed] [Google Scholar]
- Rizzuto R, Simpson AWM, Brini M, Pozzan T. Rapid changes of mitochondrial Ca2+revealed by specifically targeted recombinant aequorin. Nature (Lond) 1992;358:325–327. doi: 10.1038/358325a0. [DOI] [PubMed] [Google Scholar]
- Rizzuto R, Brini M, Murgia M, Pozzan T. Microdomains with high Ca2+ close to IP3-sensitive channels that are sensed by neighboring mitochondria. Science (WashDC) 1993;262:744–747. doi: 10.1126/science.8235595. [DOI] [PubMed] [Google Scholar]
- Rizzuto R, Bastianutto C, Brini M, Murgia M, Pozzan T. Mitochondrial Ca2+homeostasis in intact cells. J Cell Biol. 1994;126:1183–1194. doi: 10.1083/jcb.126.5.1183. [DOI] [PMC free article] [PubMed] [Google Scholar]
- Roos A, Boron WF. Intracellular pH. Physiol Rev. 1981;61:296–434. doi: 10.1152/physrev.1981.61.2.296. [DOI] [PubMed] [Google Scholar]
- Rutter GA, Burnett P, Rizzuto R, Brini M, Murgia M, Pozzan T, Tavaré JM, Denton RM. Subcellular imaging of intramitochondrial Ca2+with recombinant targeted aequorin: significance for the regulation of pyruvate dehydrogenase activity. Proc Natl Acad Sci USA. 1996;93:5489–5494. doi: 10.1073/pnas.93.11.5489. [DOI] [PMC free article] [PubMed] [Google Scholar]
- Sheu S-S, Jou M-L. Mitochondrial free Ca2+concentration in living cells. J Bioenerg Biomembr. 1994;26:487–493. doi: 10.1007/BF00762733. [DOI] [PubMed] [Google Scholar]
- Shibasaki F, Price ER, Milan D, McKeon F. Role of kinases and the phosphatase calcineurin in the nuclear shuttling of transcription factor NF-AT4. Nature (Lond) 1996;382:370–373. doi: 10.1038/382370a0. [DOI] [PubMed] [Google Scholar]
- Sparagna GC, Gunter KK, Sheu S-S, Gunter TE. Mitochondrial calcium uptake from physiological-type pulses of calcium. A description of the rapid uptake mode. J Biol Chem. 1995;270:27510–27515. doi: 10.1074/jbc.270.46.27510. [DOI] [PubMed] [Google Scholar]
- Thastrup O, Cullen PJ, Drobak BK, Hanley MR, Dawson AP. Thapsigargin, a tumor promoter, discharges intracellular Ca2+ stores by specific inhibition of the endoplasmic reticulum Ca2+-ATPase. Proc Natl Acad Sci USA. 1990;87:2466–2470. doi: 10.1073/pnas.87.7.2466. [DOI] [PMC free article] [PubMed] [Google Scholar]
- Thayer SA, Miller RJ. Regulation of the intracellular free calcium concentration in single rat dorsal root ganglion neurones in vitro. . J Physiol (Lond) 1990;425:85–115. doi: 10.1113/jphysiol.1990.sp018094. [DOI] [PMC free article] [PubMed] [Google Scholar]
- Thomas JA, Buchsbaum RN, Zimniak A, Racker E. Intracellular pH measurements in Ehrlich ascites tumor cells utilizing spectroscopic probes generated in situ. Biochemistry. 1979;18:2210–2218. doi: 10.1021/bi00578a012. [DOI] [PubMed] [Google Scholar]
- Timmerman LA, Clipstone NA, Ho SN, Northrop JP, Crabtree GR. Rapid shuttling of NF-AT in discrimination of Ca2+signals and immunosuppression. Nature (Lond) 1996;383:837–840. doi: 10.1038/383837a0. [DOI] [PubMed] [Google Scholar]
- Uto A, Arai H, Ogawa Y. Reassessment of fura-2 and the ratio method for determination of intracellular Ca2+concentrations. Cell Calcium. 1991;12:29–37. doi: 10.1016/0143-4160(91)90082-p. [DOI] [PubMed] [Google Scholar]
- Veerman AJP, van Rooijen N. Lymphocyte capping and lymphocyte migration as associated events in the in vivoantigen trapping process. An electron-microscopic autoradiographic study in the spleen of mice. Cell Tissue Res. 1975;161:211–217. doi: 10.1007/BF00220369. [DOI] [PubMed] [Google Scholar]
- Werth JL, Thayer SA. Mitochondria buffer physiological calcium loads in cultured rat dorsal root ganglion neurons. J Neurosci. 1994;14:348–356. doi: 10.1523/JNEUROSCI.14-01-00348.1994. [DOI] [PMC free article] [PubMed] [Google Scholar]
- Zalman LS, Nikaido H, Kagawa Y. Mitochondrial outer membrane contains a protein producing nonspecific diffusion channels. J Biol Chem. 1980;255:1771–1774. [PubMed] [Google Scholar]
- Zweifach A, Lewis RS. Mitogen-regulated Ca2+ current of T lymphocytes is activated by depletion of intracellular Ca2+stores. Proc Natl Acad Sci USA. 1993;90:6295–6299. doi: 10.1073/pnas.90.13.6295. [DOI] [PMC free article] [PubMed] [Google Scholar]
- Zweifach A, Lewis RS. Rapid inactivation of depletion-activated calcium current (I CRAC) due to local calcium feedback. J Gen Physiol. 1995a;105:209–226. doi: 10.1085/jgp.105.2.209. [DOI] [PMC free article] [PubMed] [Google Scholar]
- Zweifach A, Lewis RS. Slow calcium-dependent inactivation of depletion-activated calcium current. Store-dependent and -independent mechanisms. J Biol Chem. 1995b;270:14445–14451. doi: 10.1074/jbc.270.24.14445. [DOI] [PubMed] [Google Scholar]