

Abstract
We have developed a biochemical approach for identifying the components of cortical actin assembly sites in polarized yeast cells, based on a permeabilized cell assay that we established for actin assembly in vitro. Previous analysis indicated that an activity associated with the cell cortex promotes actin polymerization in the bud. After inactivation by a chemical treatment, this activity can be reconstituted back to the permeabilized cells from a cytoplasmic extract. Fractionation of the extract revealed that the reconstitution depends on two sequentially acting protein factors. Bee1, a cortical actin cytoskeletal protein with sequence homology to Wiskott-Aldrich syndrome protein, is required for the first step of the reconstitution. This finding, together with the severe defects in actin organization associated with the bee1 null mutation, indicates that Bee1 protein plays a direct role in controlling actin polymerization at the cell cortex. The factor that acts in the second step of the reconstitution has been identified by conventional chromatography. It is composed of a novel protein, Pca1. Sequence analysis suggests that Pca1 has the potential to interact with SH3 domain-containing proteins and phospholipids.
The cortical actin cytoskeleton plays a profound role in cell surface growth and shape definition. The diversity of morphogenetic processes requires that the machinery that controls cortical actin dynamics must be able to respond to intricate cellular signals, to localize to specific regions of the cell cortex, and to assemble actin filaments into defined super-structures. This requirement implies that the sites of actin assembly are likely to be composed of complex sets of proteins, including not only the structural proteins that modulate the dynamic behavior of actin filaments, but also proteins that could integrate the signals from various regulatory cascades.
The complexity of signaling networks and cytoskeletal architecture have made it difficult to define the exact mechanisms of actin assembly at the cell cortex. In this regard, the genetic tractability and relative simplicity of yeast cells present advantages for studying cortical actin assembly. Genetic analysis in yeast has been fruitful in identifying a number of genes that encode actin cytoskeletal components, and in revealing the in vivo processes in which actin itself and some of the classical actin-binding proteins are involved (for review see Welch et al., 1994). As a first step toward integrating biochemical and genetic studies of the mechanism of actin assembly, we developed an assay for cortical actin assembly in permeabilized yeast cells (Li et al., 1995). This assay is based on a permeabilization method that involves rupturing the cell wall by rapid freezing and permeabilization of the membrane by treatment with saponin. Cells thus permeabilized have the ability to incorporate rhodamine-labeled actin (Rd-actin)1 into patch-like structures, many, but not all, of which coincide with endogenous actin patches. The incorporation of Rd-actin into the permeabilized yeast cells results from actin polymerization, and the pattern of actin assembly in vitro correlates with the distribution of actin patches characteristic of the cell cycle stage at which the cells are permeabilized (Li et al., 1995).
Our studies were conducted mostly with small-budded cells, a population that is undergoing polarized cell surface growth. Permeabilized cells enriched for this population incorporate Rd-actin preferentially into the bud (Li et al., 1995). Rd-actin assembly in the bud is sensitive to protease and heat treatments and therefore depends on localized protein factors. Kinetic analysis indicated that these sites contain an activity that reduces the lag (nucleation) phase of actin polymerization (Li et al., 1995). This activity is not likely to represent the elongation of endogenous filaments, because the pattern of actin assembly in the permeabilized cells does not always correlate with the distribution of endogenous cortical actin filaments, and the assembly sites are not blocked by cytochalasin D, a barbed end-capping agent (Cooper, 1987). Mutations in specific cytoskeletal proteins, such as Sla1, an SH3 domain-containing protein, and Sla2, a protein with a talin-like domain (Holtzman et al., 1993), abolish actin polymerization in the permeabilized cells (Li et al., 1995). However, it was not clear whether these proteins are in fact components of the actin assembly sites, because the effects of the mutations could be indirect.
In this report, we describe an in vitro reconstitution approach for identifying the components of cortical actin assembly sites and for studying their activation mechanism. Using this method, in conjunction with mutant analysis and biochemical fractionation, we have identified two protein factors that activate the actin assembly sites in a sequential pathway.
Materials and Methods
Strains, Media, and Genetic Manipulations
Yeast strains used in this work are listed in Table I. Yeast cell culture and genetic techniques were carried out by methods described by Sherman et al. (1974).
Table I.
Yeast Strains
| Name | Genotype | Source | ||
|---|---|---|---|---|
| RLY1 | MATa ura3-52 his3-Δ200 leu2-3, 112 lys2-801 | Drubin lab | ||
| RLY148 | MATa ura3-52 his3-Δ200 leu2-3, 112 lys2-801 Δpca1::HIS3 | This work | ||
| RLY157 | MATa ura3-52 his3-Δ200 leu2-3, 112 lys2-801 Δbee1::LEU2 | Li, 1997 | ||
| RLY160 | MATa ura3-52 his3-Δ200 leu2-3, 112 lys2-801 Δbee1::LEU2 pBEE1-myc | Li, 1997 | ||
| RLY163 | MATa ura3-52 his3-Δ200 leu2-3, 112 lys2-801 Δpca1::HIS3 pPCA1-myc | This work |
All of the above strains are congenic in S288C background.
Plasmid and Strain Construction
Yeast genomic DNA was prepared from strain RLY1 as described (Hoffman and Winston, 1987). A 2.88-kb DNA fragment containing the PCA1 open reading frame with 326- and 221-bp upstream and downstream sequences, respectively, was amplified from yeast genomic DNA by PCR. This fragment was cut with BamHI and XbaI and cloned into Bluescript SK to yield pRL82. To construct the PCA1 knock out plasmid, pRL80 was cut with HpaI and PpuMI, removing 78% of PCA1 coding region (amino acids 22–632), blunted, and ligated with a DNA fragment containing the HIS3 gene, yielding pRL83. To construct a plasmid that expresses COOH-terminal myc-tagged Pca1, a PCA1 fragment containing the 326-bp upstream sequence and the entire coding region (amino acids 1–779) was PCR amplified from yeast genomic DNA and ligated into an in frame BamHI site of pRL102, a PRS306- (Sikorski and Hieter, 1989) based vector for COOH-terminal myc tagging (Li, 1997). The orientation of the insert was determined, and the resulting plasmid in which the myc tag was at the 3′ end of PCA1 was named pRL95.
To construct the Δpca1 strain (RLY152), PRL83 was cut with XbaI and BamHI and transformed into a His3− diploid yeast strain. The diploid was sporulated, and the tetrads were dissected and analyzed. The tetrads showed 2:2 segregation for the His+ phenotype. The Δpca1 in the Leu+ colonies was confirmed by both Southern hybridization analysis and PCR analysis similar to that described for the construction of Δbee1 (Li, 1997). To construct the myc-Pca1–expressing strain (RLY163), pLY95 was linearized by cutting in the URA3 gene with StuI and transformed into RLY148.
Extract Preparation
Yeast cells were grown to mid to late log phase in YPD. For small-scale assays, cells were lysed by the liquid nitrogen-grinding method (Sorger and Pelham, 1987). After the grinding step, an equal volume of UB (50 mM KHepes, pH 7.5, 100 mM KCl, 3 mM MgCl2, 1 mM EGTA) supplemented with protease inhibitors (PI), as described (Li et al., 1995), was added to the cell homogenate, and the lysate was centrifuged at 300,000 g for 60 min. The resulting high speed supernatant was usually at a concentration of 20 mg/ml. For large-scale extract preparation, a yeast cell pellet was washed with 10 vol of UB plus PI and resuspended in UB plus PI to 0.8 g/ml. The cells were lysed by passing through a French Pressure Cell Press (Aminco, Silver Springs, MD) at 1,200 psi. The lysate was centrifuged at 250,000 g for 60 min to yield the high speed supernatant, usually at a concentration of 30–40 mg/ml.
In Vitro Reconstitution of Cortical Actin Assembly Sites
The preparation of small-budded permeabilized cells and rhodamine labeling of rabbit muscle actin were carried out as described (Li et al., 1995). After the permeabilization by saponin, the cells were washed once with UB plus PI. The urea or high salt treatment was carried out by incubating the permeabilized cells in UB plus PI containing 2 M urea (Sigma Ultra grade; Sigma Chemical Co., St. Louis, MO) or 0.5 M KCl for 30 min at 27°C. The urea or high salt treated cells were washed twice with UB plus PI and then incubated with 20 μl extract for 30 min at 27°C. When ACF1 and ACF2 (for definitions see Fig. 3 legend) were added sequentially, the cells were first incubated with 10 μl of an ACF1-containing fraction for 20 min at 27°C, washed with UB plus PI, and then incubated with 10 μl of an ACF2-containing fraction for 30 min at 27°C. The cells were washed with UB plus PI, and the Rd-actin assembly reaction was carried out for 8 min as described (Li et al., 1995).
Figure 3.


Sequential activation of actin assembly sites by ACF1 and ACF2. (A) An extract was fractionated over a Q-Sepharose column to yield the flow through and the 0.5 M KCl eluate, which were subsequently desalted and concentrated. The urea-treated, permeabilized cells were incubated with the flow through (a), the eluate (b), or a 1:1 mixture of the two fractions (c) before Rd-actin polymerization. Rhodamine fluorescence images of representative groups of cells are shown. (B) The complementing factors in the flow through and in the eluate are designated ACF1 and ACF2, respectively. The histograms show the percentages of the urea-treated cells that preferentially incorporated Rd-actin into the bud after the cells were incubated with the buffer, a mixture of ACF1 and ACF2, ACF1 first and then ACF2, or ACF2 first and then ACF1. In the latter two treatments, the cells were washed with the buffer after the incubation with the first factor. The percentages shown are averages of the results from two experiments, and the error bars are standard deviations. Bar, 10 μm.
Fluorescence imaging was performed on a microscope (Axiophot; Zeiss, Inc., Oberkochen, Germany) with a HB100 W/Z high pressure mercury lamp and an oil immersion objective (100× Plan Neofluar; Zeiss, Inc.). Image acquisition was performed using Northern Exposure (Phase 3 Imaging Systems, Milford, MA). To calculate the percentage of the small-budded cells that incorporated Rd-actin preferentially in the bud, a random field of cells was chosen under phase, and the total number of small-budded cells (bud size <1/3 of the mother size) was counted. After switching to the rhodamine channel, we counted, within the same field, the number of cells in which the level of Rd-actin incorporation is higher than the background fluorescence in the mother. For each test, usually ∼200 cells from 8–10 randomly chosen fields were counted. Quantification of the average fluorescence intensity in the bud in the experiment described in Fig. 2 was carried out using Metamorph 2.0 (Universal Imaging Corp., West Chester, PA). The fluorescence level in the bud was subtracted by the fluorescence level in the mother (as the background). For each time point, we measured ∼40 cells that preferentially incorporated Rd-actin into the bud. These cells were first randomly chosen under phase and then visualized in the rhodamine channel. The average and standard deviation were calculated from the 40 measurements.
Figure 2.

Quantification of the activity that complements the urea-treated cells at various extract concentrations (horizontal axis). The complementation activity was quantified by two methods: (a) the percentage of the small budded cells that assemble Rd-actin to a higher level in the bud than in the mother (closed circles); (b) the average fluorescence intensity in the bud over the background fluorescence in the mother (open squares). The error bars are standard deviations. The fluorescence unit is arbitrary.
Purification of Pca1
All of the column chromatography experiments were performed on the BioLogic automated protein purification system (BioRad Laboratories, Hercules, CA) at 4°C. 1-liter extract (15 mg/ml) from 0.4 kg of wet RLY1 cell pellet was loaded onto a 400-ml Q Sepharose column (Macro-Prep Q; BioRad Laboratories) equilibrated with UB plus PI. The column was washed with 2 liters UB plus PI and was eluted with an 800-ml salt gradient (0.1– 0.25 M KCl in UB plus PI) at a flow rate of 4 ml/min. A small amount of each fraction was desalted over Econo-Pac 10DG columns (BioRad Laboratories), concentrated three- to fivefold by Centricon 10 (Amicon, Inc., Beverly, MA) and assayed for ACF2 activity. The fractions that contain ACF2 activity, eluting at 0.15–0.18 M KCl, were pooled and precipitated with 45% ammonium sulfate (Sigma Ultra grade; Sigma Chemical Co.). The above procedure was repeated, and the resulting materials were combined.
The ammonium sulfate precipitate was resuspended in and dialyzed against UB plus PI. The protein solution was divided into 0.5-ml aliquots and heated at 60°C for 10 min in a water bath. The denatured proteins were pelleted by centrifugation at 14,000 g for 10 min. The supernatant was pooled, diluted to a KCl concentration of 25 mM, and adjusted to pH 6.0 with small amounts of 0.5 M 2-(N-Morpholino)ethanesulfonic acid (MES), pH 5.3. The resulting solution was passed through a 5-ml Econo-Pac S-Sepharose column connected in series with a 5-ml Econo-Pac heparin column (BioRad Laboratories) equilibrated in 25 mM MES, pH 6.0, 25 mM KCl, 1 mM EGTA, 1 mM MgCl2, and PI. The flow through was collected, adjusted back to pH 7.5 with small amounts of Tris, pH 9.1, and ammonium sulfate added to 1 M. The protein solution was loaded onto a 5-ml Econo-Pac methyl hydrophobic interaction (mHIC) column (BioRad Laboratories) equilibrated with 1 M ammonium sulfate in UB plus PI. ACF2 activity was eluted by a 40-ml ammonium sulfate gradient (1–0.25 M). The ACF2 peak fractions, eluting at 0.78–0.34 M, were pooled and fractionated over a S-200 gel filtration column (Pharmacia Fine Chemicals, Piscataway, NJ), where ACF2 activity elutes between 54–63 ml. The pooled fraction was further purified two times over a Bio-Scale Q2 column (BioRad Laboratories). The major Coomassie blue-stained band with an apparent molecular mass of 86 kD as shown in Fig. 6, was excised from an SDS–polyacrylamide gel. Tryptic peptide mass determination and protein identification was carried out by Protein and Peptide Group (European Molecular Biology Laboratory, Heidelberg, Germany) as described (Winter et al., 1997). The purification procedure was only used for the identification of ACF2, because the recovery was low (∼2 μg ACF2 was purified from 12 g starting protein, even though the purification was >20,000-fold, as estimated by comparing the specific activity of the starting material with that of the final product.
Figure 6.

Pca1 is the protein component of ACF2. An extract prepared from the wild-type (RLY1) or the Pca1-myc expressing strain (RLY163) was fractionated over a Q column as described in the legend to Fig. 4 to yield the FT, P1, and P2 fractions. (A) Immunoblot analysis with a mouse anti-myc antibody showing that Pca1-myc is present exclusively in P2 (a), and the depletion of Pca1-myc from P2 by the anti-myc affinity beads but not by the control anti-HA affinity beads (b). (B) The histograms show the percentages of the urea-treated cells that preferentially incorporated Rd-actin into the bud after the cells were incubated in steps under the conditions described in the table below. The percentages shown are averages of the results from two experiments. wt, the wild-type strain (RLY1); Δpca1, RLY148; Pm, the Pca1-myc expressing strain (RLY163); HA-dpl, after depletion with the control anti-HA affinity beads; myc-dpl, after depletion with the anti-myc affinity beads.
Crude ACF1 fractions, which were necessary for assaying ACF2 activity, were prepared by precipitating the flow through from the Macro-Prep Q column with 55–75% ammonium sulfate. The precipitate, which contains ACF1, was dissolved in UB plus PI to ∼30 mg/ml, desalted, aliquoted, and stored frozen at −80°C.
Immunodepletion and Immunoblot Analysis
For immunodepletion of the myc-tagged Pca1 or Bee1, 40 μl of the relevant fraction was incubated for 1 h at 4°C, with 20 μl protein A-Sepharose beads (Pharmacia Fine Chemicals) bound with mouse anti-myc monoclonal antibody (ascites; Evan et al., 1985), or as a control, mouse anti-HA monoclonal antibody (ascites; BAbCO, Richmond, CA). The supernatant was separated from the beads by centrifugation. Immunoblot analysis was carried out using the enhanced chemiluminescence (ECL) detection kit (Amersham Corp., Arlington Heights, IL).
Results
Making Actin Assembly in the Permeabilized Cells Dependent on a Cytoplasmic Extract
We took a biochemical complementation strategy for identifying the functional components of actin assembly site in permeabilized yeast cells. We first sought conditions under which a loss of the activity can be complemented from soluble cell extracts. Fractionation of the extracts would then lead to the identification of the complementing factors.
Treatment with 2 M urea or 0.6 M KCl, mild conditions that are likely to inactivate or dissociate some of the components of actin assembly sites, abolishes the ability of the permeabilized cells to assemble actin into the bud. To test whether the loss of the assembly activity can be complemented by cytosolic factors, a soluble extract was prepared after centrifugation of cell lysates at 300,000 g and was incubated with cells treated with urea or KCl. The cells were washed with the low salt buffer after the treatment. Because our goal was to identify the components of actin assembly sites at the cortex rather than any soluble proteins that can enhance actin polymerization, cells were separated from the extract and washed with buffer before the Rd-actin assembly reaction. As shown in Fig. 1, the extract has the ability to restore actin assembly to the buds of the urea-treated cells. This extract also complements the high salt-treated cells (data not shown). The complementation does not occur in the presence of 2 M urea or 0.6 M salt (data not shown), suggesting that the complementing factors could be the components of the actin assembly sites that are inactivated. The complementing activity in the extract is sensitive to trypsin or heat (70°C) treatments (data not shown), indicating that the activity is dependent on protein factors.
Figure 1.

Reconstitution of actin assembly sites in permeabilized yeast cells. Rhodamine fluorescence images of the permeabilized cells after Rd-actin assembly. (a) Untreated, permeabilized cells. (b) Permeabilized cells that were treated with 2 M urea and then incubated with the buffer. (c) Permeabilized cells that were treated with 2 M urea and then incubated with the extract. Bar, 10 μm.
The localization of actin assembly in the extract complemented cells is still much more favored in the buds (Fig. 1), indicating that residual factors that are not sensitive to the urea or high salt treatment are likely to provide the spatial cue for the reconstitution. Interestingly, if the permeabilized cells are treated with both 0.6 M KCl and 0.1% Triton X-100, a concentration of Triton that alone has no effect on the actin assembly activity, the cytoplasmic extract can no longer restore actin incorporation to the buds (Table II). This suggests that the urea or salt-sensitive factor(s) provided by the extract are likely to interact with a detergent-extractable membrane component. 0.1% Triton X-100 alone does not extract the membrane protein probably due to the presence of protein complexes, as observed for some of the cytoskeleton-associated membrane proteins.
Table II.
Complementation Conditions
| Cell treatment | Actin incorporation | Complementation by the soluble extract | ||
|---|---|---|---|---|
| 2 M Urea | − | + | ||
| 0.6 M KCl | − | + | ||
| 1% Tx-100 | − | − | ||
| 0.1% Tx-100 | + | Not apply | ||
| 0.6 M KCl + | − | − | ||
| 0.1% Tx-100 |
Quantification of the Activity that Complements the Urea-treated Cells
Since the urea treatment usually gives a more complete inactivation of the actin assembly activity (i.e., lower background assembly), we set out to identify the factors that can restore actin assembly in these cells. The activity that complements the urea-treated cells is dependent on the concentration of the extract. The effects of the extract can be quantified by measuring: (a) the percentage of cells that incorporate Rd-actin preferentially into the bud; or (b) the level of fluorescence incorporated into the bud over the background fluorescence in the mother. Both quantification methods demonstrate a dependence of the complementing activity on extract concentration (Fig. 2). The concentration dependence curves obtained by the two methods show a very similar linear range and plateau, indicating that either method could be used for quantifying the complementing activity. Since the first method of quantification is the easier of the two, this method was used for rapid determination of the activity peaks during the purification and subsequent experiments.
The Complementing Activity Is Composed of Two Sequentially Acting Protein Factors
The complexity of the complementing activity was assessed by fractionation of the extract on an anion exchange column. After passing the extract through a Q-Sepharose column, two fractions were obtained: the flow through and the eluate with 0.5 M KCl. The fractions were desalted, concentrated, and assayed for the ability to complement the urea-treated cells. Neither fraction alone showed any complementing activity, but when the urea-treated cells were incubated with a mixture of both fractions, actin assembly in the bud was fully restored, suggesting that at least two protein factors are required for the reconstitution of the actin assembly activity (Fig. 3 A). For convenience, the factor in the Q flow through will be referred to as ACF1 (assembly complementing factor), and the factor in the Q eluate will be referred to as ACF2.
ACF1 and ACF2 do not appear to exist in a stable complex, as they can be separated by fractionation of the extract on a gel filtration column (data not shown). One possibility is that ACF1 and ACF2 interact sequentially with the permeabilized cells. This possibility was tested by first incubating the urea-treated cells with the ACF1-containing fraction, washing the cells with extract buffer, and then incubating the cells with the ACF2-containing fraction. Actin assembly is fully restored in urea-treated cells after the sequential incubations (Fig. 3 B). However, if the cells were incubated with ACF2 first, washed, and then incubated with ACF1, actin assembly is not restored to the urea-treated cells, suggesting that ACF1 and ACF2 act sequentially in a defined order. Complementation of KCl-treated cells also depends on the same sequential incubation with ACF1 and ACF2 (data not shown).
Bee1 Protein Is a Component of ACF1
One way to rapidly identify ACF1 and ACF2 is to test whether an extract lacking a known cortical patch component is defective in the complementing activity. We first tested a number of mutant extracts, including those from Δabp1 (Drubin et al., 1988), Δsac6 (Adams et al., 1991), Δcap2 (Amatruda et al., 1992), Δsla1, Δsla2 (Holtzman et al., 1993), and cdc42-1 (Adams et al., 1990). All of the extracts exhibit a wild-type level of the complementing activity, suggesting that the proteins corresponding to the null mutations are unlikely to be the complementing factors. Recently, we cloned the gene encoding Bee1, a yeast protein with sequence similarity to Wiskott-Aldrich syndrome protein, and constructed a strain bearing the Δbee1 mutation (Li, 1997). The extract prepared from Δbee1 cells failed to complement the urea-treated cells (Fig. 4 B). Bee1 protein has a net charge of +8.75 and an isoelectric point of 9.27, properties that are consistent with the fact that ACF1 binds to a cation exchange column (S-Sepharose) but not to anion exchange columns (Q-Sepharose).
Figure 4.


Bee1 is an essential component of ACF1. An extract prepared from the wild-type (RLY1) or the Bee1-myc–expressing strain (RLY160) was passed over a Q-Sepharose column yielding the flow through (FT). The bound proteins were eluted with 0.25 M KCl to yield P1 and then with 0.4 M KCl to yield P2. (A) Immunoblot analysis with a mouse anti-myc antibody showing that Bee1-myc is mostly in P2 (a) and showing the depletion of Bee1-myc from P2 by the anti-myc affinity beads but not by the control anti-HA affinity beads (b). (B) The histograms show the percentages of the urea-treated cells that preferentially incorporated Rd-actin into the bud after the cells were incubated under the conditions described in the table below. The cells were washed with the buffer between the two incubation steps. The percentages shown are averages of the results from two experiments, and the error bars are standard deviations. wt-ext, An extract from the wild-type strain (RLY1); Δb1-ext, an extract from the Δbee1 strain (RLY157); Bm, the Bee1-myc–expressing strain (RLY160); HA-dpl, after depletion with the control anti-HA affinity beads; myc-dpl, after depletion with the anti-myc affinity beads. (C) The order of interaction between Bee1 and the unknown ACF1 component. The histograms show the percentages of the urea-treated cells that preferentially incorporated Rd-actin into the bud after the cells were incubated under the conditions described in the table below. The cells were washed with the buffer between the two incubation steps. The percentages shown are averages of the results from four experiments, and the error bars are standard deviations. The abbreviations are the same as in B.
To determine whether Bee1 is a component of ACF1, we fractionated an extract prepared from a strain that expresses the myc-tagged Bee1 (Bee1-myc) as the sole source of Bee1 protein (Li, 1997). This strain grows at a rate comparable to that of the wild type. Bee1-myc binds to the Q column because the 6 myc tags add 24 negative charges to the protein. The Q column flow through does not contain any Bee1-myc and is defective in ACF1 activity (Fig. 4, A and B). The Q column was eluted by a step gradient of 0.25 M KCl (P1) followed by 0.4 M KCl (P2). P1 contains all of ACF2 activity, whereas P2 contains the majority of Bee1-myc. P2 alone is not sufficient for ACF1 activity, but when it was added back to the flow through, ACF1 was reconstituted (Fig. 4 B). Depletion of Bee1-myc from P2 eliminates the ability of this fraction to reconstitute ACF1. This suggests that Bee1 is a component of ACF1, but another factor in the flow through of the Q column is also required for this activity. We previously showed that Bee1 interacts with Sla1 (Li, 1997), but Sla1 is not the unidentified factor, because Sla1 protein is not present in Q flow through (data not shown).
We examined the order of interaction between Bee1 and the unknown ACF1 factor. As shown in Fig. 4 C, complementation was most efficient when Bee1 (P2 of Bee1-myc extract) and the fraction containing the unknown ACF1 factor (Q flow through of Bee1-myc extract) were added together and least efficient when the unknown factor was added before Bee1. A precise mechanistic explanation for this observation will not be available until the unknown factor is identified.
The Purification and Identification of ACF2
We devised a procedure for the purification of ACF2 by conventional column chromatography. The column fractions were assayed for ACF2 activity: the ability to restore actin assembly to urea-treated cells when combined with an ACF1-containing fraction. A high-speed supernatant was first fractionated on a Q-Sepharose column to separate ACF1 and ACF2. ACF2 eluted as a single peak at 152–182 mM KCl. The pooled ACF2 fractions were further purified by ammonium sulfate precipitation, heat treatment, S-Sepharose column, methyl-hydrophobic interaction (mHIC) column, gel filtration, and mono Q as described in Materials and Methods. During each fractionation step, only a single peak of ACF2 activity was detected. Fig. 5 shows the protein profiles of the peak fractions after each step. During the mHIC step and the steps after, a protein of roughly 86 kD (p86) always cofractionated with the ACF2 activity and was the major protein after the final step of purification.
Figure 5.

Purification of ACF2. The peak fractions that contained ACF2 activity after each consecutive purification step (from left to right) were analyzed on 12.5% SDS–polyacrylamide gels. The gels were stained with Coomassie blue and photographed. M, protein molecular weight marker (Life Technologies, Inc., Gaithersburg, MD). E, the starting extract; Q, Q-Sepharose column; AS, 45% ammonium sulfate precipitation; H, heat treatment at 60°C; S, S-Sepharose and heparin columns (connected in series); HI, methyl hydrophobic interaction column; GF, S-200 Gel filtration column; Q2, Bio-Scale Q2 column.
The 86-kD protein was excised from a polyacrylamide gel and was digested with trypsin. The resulting peptides were analyzed by mass spectroscopy, and their molecular weights identified one open reading frame from the yeast genome database. The details of this protein identification method are described in Winter et al. (1997). To show that p86 was indeed ACF2, the corresponding gene was cloned and a knock-out allele constructed. The extract prepared from cells bearing the p86 knock-out mutation did not contain any ACF2 activity (Fig. 6 B). ACF2 activity was restored to the strain by a plasmid that expresses a myc-tagged p86. When the myc-p86–containing extract was fractionated over the Q-Sepharose column, ACF2 was detected in the 0.4 M KCl eluate rather than in the 0.25 M KCl eluate where ACF2 is normally detected (Fig. 6). Again, we believe that this shift in ACF2 elution position on the salt gradient is due to the 24 additional negative charges in the 6 myc epitopes. Finally, depletion of myc-p86 completely eliminates ACF2 activity from the 0.4 M KCl eluate (Fig. 6 B). These results show that p86 is indeed ACF2. We have named this protein Pca1, standing for polarized cortical actin assembly.
PCA1 Encodes a Novel Protein
Pca1 is a novel protein of 779 amino acids in length and has a molecular mass of 88 kD. Its predicted net charges, isoelectric point, and hydrophobicity all agree with the chromatographic behavior of ACF2. The NH2 terminus has two proline-rich sequences that match the SH3 domain-binding motifs PPxPxR/K and R/KxxPPxP (Fig. 7 A). The COOH-terminal half contains two putative pleckstrin homology (PH) domains, the first of which matches well with the consensus sequence derived from other known PH domains (Fig. 7). We constructed a knock-out allele in which 78% of the Pca1 coding sequence was replaced by a marker gene. Δpca1 cells grow at a wild-type rate and do not exhibit any apparent defects in actin organization and cell morphology (data not shown). Further genetic analysis has indicated that this lack of phenotype is most likely to be due to functional redundancy.
Figure 7.
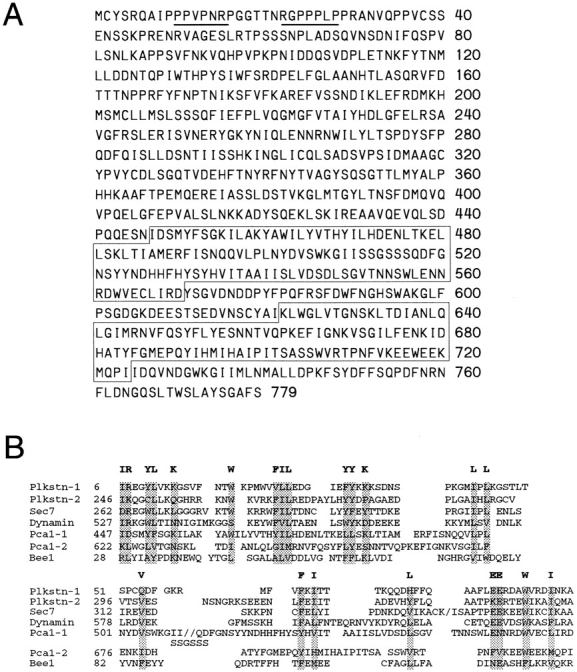
Sequence features of Pca1 protein. (A) Amino acid sequence of Pca1 (these sequence data are available from GenBank/EMBL/DDBJ under accession number Z73316). The proline-rich SH3 domain-interacting sequences are underlined. The two putative PH domains are boxed. (B) Alignment of the two putative PH domains with the PH domains of pleckstrin (Tyers et al., 1988), Sec7 (Liu and Pohajdak, 1992), dynamin (Downing et al., 1994), and Bee1 (Symons et al., 1996). The conserved hydrophobic and basic amino acids are highlighted.
Discussion
A Biochemical Approach for Identifying the Proteins that Directly Control Cortical Actin Assembly
In this report, we have described an in vitro reconstitution approach for identifying protein components required for cortical actin assembly. Several considerations motivated us to take on this biochemical approach. First, genetic studies have identified a number of cortical cytoskeletal components, but an understanding of their mechanistic roles has been limited by lack of knowledge of their biochemical and physical interactions. Because the assembly or activity of key cytoskeletal complexes may be cortex dependent, it may not be possible to assay the biochemical activities of individual components in solution. Where similar problems have been encountered in membrane trafficking studies, permeabilized cell systems have proven useful for developing functional assays (for review see Pryer et al., 1992). We reasoned that permeabilized yeast cells could provide the cellular context for studying the activity of actin assembly complexes. This is demonstrated by the fact that neither Pca1 nor a fraction that contains ACF1 stimulates actin polymerization in solution (data not shown), but strong actin assembly-stimulating activity is detected when these factors are combined with the chemically stripped, permeabilized cells.
Second, biochemical purification can help identify functionally redundant components. A striking feature of the actin cytoskeleton is that many important functions are carried out by redundant proteins. For example, a null mutation in either of the two myosin I genes, MYO3 and MYO5, results in a phenotype that is indistinguishable from that of the wild type, but the double mutant exhibits severe defects in cell growth and actin organization (Goodson and Spudich, 1995; Goodson et al., 1996). These functionally redundant genes are likely to be missed by classical genetic screens based on loss-of-function phenotypes, and PCA1 may be such an example. We have now isolated a number of mutations that are synthetically lethal with PCA1 null (Hayne, C., and R. Li, unpublished result), suggesting that other protein(s) can functionally substitute for Pca1 in vivo, and the shared function is essential. Since we only detected a single peak of ACF2 activity during each fractionation step, these proteins may be in low abundance, may not exist in the soluble extract, or may not be active in vitro. Their identification can be accomplished by cloning of the genes that rescue the Δpca1 synthetic lethal mutations.
Several of the mutations, including Δsla1, Δsla2, and cdc42-1, that we previously showed to be defective in actin polymerization in the permeabilized cell assay (Li et al., 1995) do not affect the assembly complementing activities defined in this study. Two possible explanations may account for this difference. First, the proteins affected by the above mutations may not be extracted by the mild urea treatment. In fact, the level of Sla2 immunofluorescence staining in the permeabilized cells does not seem to change before and after the urea treatment (data not shown). Cdc42, thought to be anchored in the membrane by a COOH-terminal geranylgeranyl group (Ziman et al., 1991), should also be resistant to the extraction. Second, the mutations may affect a step before the ACF-dependent steps in the activation of actin nucleation sites in vivo, and the former step is not affected by the urea treatment in wild-type permeabilized cells. Thus, the complementation assay is perhaps more direct in identifying actin assembly factors than assaying actin polymerization in mutant permeabilized cells.
The Role of Bee1 and Pca1 in Cortical Actin Assembly
We have identified Bee1 as one of the proteins required for the reconstitution of actin assembly sites. We have recently reported genetic and cytological studies of the in vivo function of Bee1. Bee1 protein is localized to actin patches, and the Δbee1 mutation disrupts cortical patch formation, resulting in the assembly of aberrant cable-like actin structures in the bud (Li, 1997). The results reported here provide the biochemical evidence that a WASP family protein is directly involved in actin polymerization at the cell cortex.
Mutations in WASP result in severe deficiencies in blood cell function and morphogenesis (for review see Kirchhausen and Rosen, 1996; Remold-O'Donnell et al., 1996). Speculations have been made on the function of WASP family proteins based on the fact that these proteins contain multiple domains for interacting with signaling and cytoskeletal proteins (for review see Featherstone, 1997). The presence of these functional regions suggests that WASP may act as a molecular scaffold that nucleates the formation of an actin assembly complex in response to various signaling cascades. This notion is supported by the observation that overexpression of WASP in cultured cells results in the formation of actin-rich foci that contain WASP (Symons et al., 1996). Bee1 has all of the functional domains of WASP except the Cdc42-binding domain (Symons et al., 1996). Thus, one simple model for the action of Bee1 is that it activates or recruits a key actin nucleation factor. This nucleation factor could be the unidentified ACF1 component or could be an actin assembly site component that is resistant to the urea treatment.
The NH2-terminal half of Bee1 shows structural similarity with VASP, a protein that forms a complex with profilin and regulates the rate of Listeria movement, possibly by controlling the rate of actin elongation (Smith et al., 1996). Both proteins contain an NH2-terminal domain with sequence similarity to WASP homology domain 1 (WH1; Symons et al., 1996). This domain in VASP and Bee1, as well as in WASP, are followed by the G/APPPPP sequences that bind profilin (Reinhard et al., 1995; Southwick and Purich, 1995). This structural similarity, together with our identification of Bee1 as an actin assembly factor, suggests that a common function could be shared by VASP and WASP family proteins.
Since Pca1 must be supplied together with or after Bee1, it might be the final limiting component or activator of the actin assembly complex. It is interesting that both Bee1 and Pca1 contain PH domains (Fig. 7) which are phospholipid-binding modules found in many signaling and cytoskeletal proteins (for review see Shaw, 1996). Bacterially expressed PH domain of N-WASP has been shown to bind to phosphoinositides in vitro (Miki et al., 1996). There are numerous examples where PH domains are required for the localization of proteins to specific regions of the plasma membrane (Lemmon and Ferguson, 1996; Shaw, 1996). The interaction of Akt PH domain with phosphatidylinositol-3,4-bisphosphate has also been shown to directly regulate the dimerization and kinase activation of Akt (Datta et al., 1995; Franke et al., 1996). Similarly, the PH domains in Bee1 and Pca1 could serve as membrane anchors, could promote a lipid-dependent interaction between Bee1 and Pca1, or could stimulate the biochemical activity of these proteins in actin polymerization. The involvement of phosphoinositides in the activation of actin assembly sites is likely to be significant for the spatial and temporal regulation of actin dynamics, because many signaling pathways are mediated through the lipid kinases that control the level and distribution of specific phospholipids (for review see Carpenter and Cantley, 1996).
Acknowledgments
We are grateful to Matthias Mann, Tony Hyman, and Protein and Peptide Group at European Molecular Biology Laboratory (Heidelberg, Germany) for identifying the peptide sequence of Pca1. We are grateful to Lewis Cantley in the Department of Cell Biology, Harvard Medical School (Cambridge, MA) for his help in sequence alignment of Pca1 PH domains. We thank Marc Kirschner for encouragement throughout this work, and Phil Allen, Tim Mitchison, and Ryn Miake-Lye for comments on the manuscript.
This work was supported by Harcourt General Charitable Foundation.
Footnotes
1. Abbreviations used in this paper: PH, pleckstrin homology; PI, protease inhibitors; Rd, rhodamine.
Please address all correspondence to R. Li, Department of Cell Biology, Harvard Medical School, 240 Longwood Ave., Boston, MA 02115. Tel.: (617) 432-0640; Fax: (617) 432-1144; E-mail: RLi@warren.med.harvard.edu
References
- Adams AE, Johnson DI, Longnecker RM, Sloat BF, Pringle JR. CDC42 and CDC43, two additional genes involved in budding and the establishment of cell polarity in the yeast Saccharomyces cerevisiae. . J Cell Biol. 1990;111:131–142. doi: 10.1083/jcb.111.1.131. [DOI] [PMC free article] [PubMed] [Google Scholar]
- Adams AE, Botstein D, Drubin DG. Requirement of yeast fimbrin for actin organization and morphogenesis in vivo. . Nature (Lond) 1991;354:404–408. doi: 10.1038/354404a0. [DOI] [PubMed] [Google Scholar]
- Amatruda JF, Gattermeir DJ, Karpova TS, Cooper JA. Effects of null mutations and overexpression of capping protein on morphogenesis, actin distribution, and polarized secretion in yeast. J Cell Biol. 1992;119:1151–1162. doi: 10.1083/jcb.119.5.1151. [DOI] [PMC free article] [PubMed] [Google Scholar]
- Carpenter CL, Cantley LC. Phosphoinositide kinases. Curr Opin Cell Biol. 1996;8:153–158. doi: 10.1016/s0955-0674(96)80060-3. [DOI] [PubMed] [Google Scholar]
- Cooper JA. Effects of cytochalasin and phalloidin on actin. J Cell Biol. 1987;105:1473–1478. doi: 10.1083/jcb.105.4.1473. [DOI] [PMC free article] [PubMed] [Google Scholar]
- Datta K, Franke TF, Chan TO, Makris A, Yang S, Kaplan DR, Morrison DK, Golemis EA, Tsichlis PN. AH/PH domain-mediated interaction between Akt molecules and its potential role in Akt regulation. Mol Cell Biol. 1995;15:2304–2310. doi: 10.1128/mcb.15.4.2304. [DOI] [PMC free article] [PubMed] [Google Scholar]
- Downing AK, Driscoll PC, Gout I, Salim K, Zvelebil MJ, Waterfield MD. Three-dimensional solution structure of the pleckstrin homology domain from dynamin. Curr Biol. 1994;4:884–891. doi: 10.1016/s0960-9822(00)00197-4. [DOI] [PubMed] [Google Scholar]
- Drubin DG, Miller KG, Botstein D. Yeast actin-binding proteins: evidence for a role in morphogenesis. J Cell Biol. 1988;107:2551–2561. doi: 10.1083/jcb.107.6.2551. [DOI] [PMC free article] [PubMed] [Google Scholar]
- Evan GI, Lewis GK, Ramsay G, Bishop JM. Isolation of monoclonal antibodies specific for human c-mycproto-oncogene product. Mol Cell Biol. 1985;5:3610–3616. doi: 10.1128/mcb.5.12.3610. [DOI] [PMC free article] [PubMed] [Google Scholar]
- Featherstone C. The many faces of WAS protein. Science (Wash DC) 1997;275:27–28. doi: 10.1126/science.275.5296.27. [DOI] [PubMed] [Google Scholar]
- Franke TF, Kaplan DR, Cantley LC, Toker A. Direct regulation of the Aktproto-oncogene product by phosphatidylinositol-3,4-bisphosphate. Science (Wash DC) 1996;275:665–668. doi: 10.1126/science.275.5300.665. [DOI] [PubMed] [Google Scholar]
- Goodson HV, Spudich JA. Identification and molecular characterization of a yeast myosin I. Cell Motil Cytoskeleton. 1995;30:73–84. doi: 10.1002/cm.970300109. [DOI] [PubMed] [Google Scholar]
- Goodson HV, Anderson BL, Warrick HM, Pon LA, Spudich JA. Synthetic lethality screen identifies a novel yeast myosin I gene (MYO5): myosin proteins are required for polarization of the actin cytoskeleton. J Cell Biol. 1996;133:1277–1291. doi: 10.1083/jcb.133.6.1277. [DOI] [PMC free article] [PubMed] [Google Scholar]
- Hoffman CS, Winston F. A ten-mintue DNA preparation from yeast efficiently releases autonomous plasmids for transformation of Escherichia coli. . Gene. 1987;57:267–272. doi: 10.1016/0378-1119(87)90131-4. [DOI] [PubMed] [Google Scholar]
- Holtzman DA, Yang S, Drubin DG. Synthetic-lethal interactions identify two novel genes, SLA1 and SLA2, that control membrane cytoskeleton assembly in Saccharomyces cerevisiae. . J Cell Biol. 1993;122:635–644. doi: 10.1083/jcb.122.3.635. [DOI] [PMC free article] [PubMed] [Google Scholar]
- Kirchhausen T, Rosen FS. Disease mechanism: unraveling Wiskott-Aldrich syndrome. Curr Biol. 1996;6:676–678. doi: 10.1016/s0960-9822(09)00447-3. [DOI] [PubMed] [Google Scholar]
- Lemmon MA, Ferguson KM. PH domains, diverse sequences with a common fold, recruit signaling molecules to the cell surface. Cell. 1996;85:621–624. doi: 10.1016/s0092-8674(00)81022-3. [DOI] [PubMed] [Google Scholar]
- Li R. Bee1, a yeast protein with homology to Wiskott-Aldrich syndrome protein, is critical for the assembly of cortical actin cytoskeleton. J Cell Biol. 1997;136:649–658. doi: 10.1083/jcb.136.3.649. [DOI] [PMC free article] [PubMed] [Google Scholar]
- Li R, Zheng Y, Drubin D. Regulation of cortical actin cytoskeleton assembly during polarized cell growth in budding yeast. J Cell Biol. 1995;128:599–615. doi: 10.1083/jcb.128.4.599. [DOI] [PMC free article] [PubMed] [Google Scholar]
- Liu L, Pohajdak B. Cloning and sequencing of a human cDNA from cytosolic NK/T cells with homology to Sec7. Biochim Biophys Acta. 1992;1132:75–78. doi: 10.1016/0167-4781(92)90055-5. [DOI] [PubMed] [Google Scholar]
- Miki H, Miura K, Takenawa T. N-WASP, a novel actin depolymerizing protein, regulates the cortical cytoskeletal rearrangement in a PIP2- dependent manner downstream of tyrosine kinases. EMBO (Eur Mol Biol Organ) J. 1996;15:5326–5335. [PMC free article] [PubMed] [Google Scholar]
- Pryer NK, Wuestehube LJ, Schekman R. Vesicle-mediated protein transport. Annu Rev Biochem. 1992;61:471–516. doi: 10.1146/annurev.bi.61.070192.002351. [DOI] [PubMed] [Google Scholar]
- Reinhard M, Giehl K, Abel K, Haffner C, Jarchau T, Hoppe V, Jockusch BM, Walter U. The proline-rich focal adhesion and microfilament protein VASP is a ligand for profilins. EMBO (Eur Mol Biol Organ) J. 1995;14:1583–1589. doi: 10.1002/j.1460-2075.1995.tb07146.x. [DOI] [PMC free article] [PubMed] [Google Scholar]
- Remold-O'Donnell E, Rosen FS, Kenney DM. Defects in Wiskott-Aldrich syndrome blood cells. Blood. 1996;87:2621–2631. [PubMed] [Google Scholar]
- Shaw G. The pleckstrin homology domain: an intriguing multifunctional protein module. Bioessays. 1996;18:35–46. doi: 10.1002/bies.950180109. [DOI] [PubMed] [Google Scholar]
- Sherman, F., G. Fink, and C. Lawrence. 1974. Methods in Yeast Genetics. Cold Spring Harbor Laboratory, Cold Spring Harbor, New York.
- Sikorski RS, Hieter P. A system of shuttle vectors and yeast host strains designed for efficient manipulation of DNA in Saccharomyces cerevisiae. . Genetics. 1989;122:19–27. doi: 10.1093/genetics/122.1.19. [DOI] [PMC free article] [PubMed] [Google Scholar]
- Smith GA, Theriot JA, Portnoy DA. The tandem repeat domain in the Listeria monocytogenesActA protein controls the rate of actin-based motility, the percentage of moving bacteria, and the localization of vasodilator-stimulated phosphoprotein and profilin. J Cell Biol. 1996;135:647–660. doi: 10.1083/jcb.135.3.647. [DOI] [PMC free article] [PubMed] [Google Scholar]
- Sorger PK, Pelham HR. Purification and characterization of a heat-shock element binding protein from yeast. EMBO (Eur Mol Biol Organ) J. 1987;6:3035–3041. doi: 10.1002/j.1460-2075.1987.tb02609.x. [DOI] [PMC free article] [PubMed] [Google Scholar]
- Southwick FS, Purich DL. Inhibition of Listerialocomotion by mosquito oostatic factor, a natural oligoproline peptide uncoupler of profilin action. Infect Immun. 1995;63:182–190. doi: 10.1128/iai.63.1.182-190.1995. [DOI] [PMC free article] [PubMed] [Google Scholar]
- Symons M, Derry JMJ, Karlak B, Jiang S, Lemahieu V, McCormick F, Francke U, Abo A. Wiskott-Aldrich syndrome protein, a novel effector for the GTPase CDC42Hs, is implicated in actin polymerization. Cell. 1996;84:723–734. doi: 10.1016/s0092-8674(00)81050-8. [DOI] [PubMed] [Google Scholar]
- Tyers M, Rachubinski RA, Stewart MI, Varrichio AM, Shorr RG, Haslam RJ, Harley CB. Molecular cloning and expression of the major protein kinase C substrate of platelets. Nature (Lond) 1988;333:470–473. doi: 10.1038/333470a0. [DOI] [PubMed] [Google Scholar]
- Welch MD, Holtzman DA, Drubin DG. The yeast actin cytoskeleton. Curr Opin Cell Biol. 1994;6:110–119. doi: 10.1016/0955-0674(94)90124-4. [DOI] [PubMed] [Google Scholar]
- Winter, D., A.V. Podtelejnikov, M. Mann, and R. Li. 1997. The protein complex containing actin-related proteins Arp2 and Arp3 is required for the motility and integrity of yeast cortical actin patches. Curr. Biol. In press. [DOI] [PubMed]
- Ziman M, O'Brien JM, Ouellette LA, Church WR, Johnson DI. Mutational analysis of CDC42Sc, a Saccharomyces cerevisiaegene that encodes a putative GTP-binding protein involved in the control of cell polarity. Mol Cell Biol. 1991;11:3537–3544. doi: 10.1128/mcb.11.7.3537. [DOI] [PMC free article] [PubMed] [Google Scholar]