

Abstract
Ca2+-dependent exocytotic pathways in mouse pancreatic β cells were investigated using both capacitance measurement and amperometric detection of vesicular contents. Serotonin was preloaded into large dense-core vesicles for the amperometry. Exocytosis was induced by rapid elevation of cytosolic Ca2+ concentrations using caged-Ca2+ compounds. Capacitance measurement revealed two major components of exocytosis, and only the slow component was accompanied by amperometric events reflecting quantal serotonin secretion. Moreover, the fast and slow exocytoses induced the two forms of endocytosis that were reported to follow the exocytoses of small-clear and large dense-core vesicles, respectively. Interestingly, we recorded two types of responses of quantal events: in the type-1 response, most quantal events occurred with a delay of 0.2 s and were rapidly exhausted with a time constant of 1.7 s, while, in the type-2 response, quantal events occurred with a delay of 2.5 s and were sustained. This suggests the existence of two pathways or modes of the exocytosis involving large dense-core vesicles. Thus, we have revealed three exocytotic pathways with divergent fusion kinetics in β cells, which provide a new basis for the understanding of the physiology and pathology of β cells.
Two types of secretory vesicles, small-clear vesicles (SVs)1 and large dense-core vesicles (LVs), have been identified in a wide variety of cells (Kelly, 1993; De Camilli and Jahn, 1990). The properties of SVs and LVs are best characterized in synaptic terminals, where SVs contain classical neurotransmitters and LVs contain neuropeptides. The two types of vesicles undergo exocytosis in response to distinct stimuli and are involved in different neuronal functions (Jan and Jan, 1982; Andersson et al., 1982; Matteoli et al., 1988; De Camilli and Jahn, 1990; Verhage et al., 1991). In endocrine cells, hormones are primarily stored in LVs, while SVs are also present (Thomas-Reetz and De Camilli, 1994). Moreover, even nonsecretory CHO cells show massive exocytosis involving SVs and LVs (Morimoto et al., 1995; Ninomiya et al., 1996; Coorssen et al., 1996). In general, SVs are generated by recycling between the plasma membrane and early endosomes (Kelly, 1993), while LVs are generated in trans-Golgi networks. The two types of vesicles also exhibit marked differences in the time courses of exocytosis (Bruns and Jahn, 1995). Recent capacitance measurement in PC12 cells has suggested that SVs and LVs showed distinct time courses of fusion even when they were subjected to the same elevations of cytosolic Ca2+ concentrations ([Ca2+]i) using caged-Ca2+ compounds (Kasai et al., 1996; Ninomiya et al., 1997).
Two types of secretory vesicles have also been identified in pancreatic β cells (Thomas-Reetz and De Camilli, 1994), where LVs and SVs contain primarily insulin and γ-amino- n-butyric acid (GABA), respectively. The existence of multiple types of vesicles is a possible problem in studies relying on capacitance measurement, because vesicle types cannot readily be identified using this means (Gillis and Misler, 1992, 1993; Ämmälä et al., 1993, 1994; Bokvist et al., 1995; Eliasson et al., 1996; Renstroem et al., 1996). A way to resolve this problem has recently been developed. Vesicular secretion from single β cells can be recorded by amperometric measurement using carbon fiber electrodes. Insulin contained in LVs can be detected by ruthenium-coated carbon fiber electrodes (Kennedy et al., 1987; Huang et al., 1996). Serotonin can be loaded into secretory granules by preincubating β cells with serotonin and can be detected by bare carbon fiber electrodes (Smith et al., 1995; Zhou and Misler, 1996). Selective uptake of serotonin into LVs has been detected using electron microscopic histochemistry (Jaimm-Etcheverry and Zieher, 1968), autoradiography (Ekholm et al., 1971), and subcellular fractionation (Hellman et al., 1972). Secretion of serotonin could be more effectively monitored than that of insulin and exhibited characteristics similar to those of insulin secretion (Gylfe, 1978; Smith et al., 1995; Zhou and Misler, 1996). Thus, amperometric measurement of serotonin secretion can be used to identify exocytosis involving LVs.
In the present study Ca2+ and time dependencies of LV exocytosis were examined using both capacitance measurement and amperometric detection of serotonin in β cells that were stimulated with rapid elevation of [Ca2+]i using caged-Ca2+ compounds. Our data indicate the existence of three pathways of exocytosis in β cells, likely involving SVs and two pathways of LVs, and provide a new basis for understanding Ca2+-dependent exocytosis in β cells and other cells.
Materials and Methods
β Cell Preparation
Pancreatic islets were isolated from mice (ICR mice) older than 8 wk using collagenase and dispersed into single cells by low Ca2+ treatment as described (Rorsman and Trube, 1986). The cells were plated onto glass coverslips (No. 00; Menzel Glass, Braunschweig, Germany) and maintained for 1–2 d in a humidified atmosphere containing 5% CO2 in DME-based tissue-culture medium (1.0 g/liter glucose) supplemented with 10% FCS, 100 μU/ml penicillin, and 100 μg/ml streptomycin at 37°C. We chose to study only those cells whose diameters were >10 μm, so that >90% of the cells were expected to be β cells (Rorsman and Trube, 1986).
Capacitance Measurement
Pancreatic β cells were voltage clamped at −65 mV in the whole-cell mode using a patch-clamp amplifier, AxoPatch (Axon Instruments, Foster City, CA) at room temperature (20°–25°C). The standard external bathing solution had the following composition (mM): 150 NaCl, 5 KCl, 1 MgCl2, 2 CaCl2, 10 Hepes, and 2.5 glucose at pH 7.4. Capacitance measurement was performed as described (Kasai et al., 1996). In brief, a 1-kHz sine-wave voltage command with a peak to peak amplitude of 40 mV was superimposed on the holding potential. Membrane capacitance was calculated from 10 cycles of sine waves and sampled at 44 Hz in most experiments, while it was calculated from one cycle of sine waves and sampled at 1 kHz in some of them. A phase offset was obtained using a phase-tracking method (Joshi and Fernandez, 1988), which was performed shortly before inducing Ca2+ jumps and every 11 s thereafter. The internal solution had the following composition (mM): 50 Cs-Hepes, 100 Cs-glutamate, 5 CsCl, 0.2 benzothiazole coumarin (BTC; Molecular Probes, Eugene, OR) at pH 7.2. In most experiments, 10 mM dimethoxynitrophenamine tetrasodium salt (DM-nitrophen; Calbiochem-Novabiochem Corp., La Jolla, CA) was added as a caged compound together with 0.5–4 mM CaCl2. In some experiments, 2-nitrophenyl O,O′-bis (2-aminoethyl) ethyleneglycol-N,N,N′,N′-tetraacetic acid tetrapotassium salt (NP-EGTA; Molecular Probes) was used instead of DM-nitrophen in the presence of (mM): 2 MgCl2, 1 Na2ATP, and 0.2 GTP. The results were not significantly different from those obtained using DM-nitrophen. The osmolarity of the internal solutions was ∼320 mM after addition of these chemicals. Membrane capacitances of β cells ranged between 2.3 and 10.8 pF, and the mean value was 4.8 ± 1.4 pF (mean ± SD, n = 205). The mean access resistance was 9.6 ± 1.3 MΩ in our experiments.
Ca2+ Measurement and Photolysis of Caged-Ca2+ Compounds
Dual-wavelength ratiometric fluorimetry was performed using a ratioable long-wavelength Ca2+-indicator dye, BTC (Molecular Probes) as described (Kasai et al., 1996). In brief, the dye was excited with light emitted from a xenon lamp alternated rapidly between 430 and 480 nm (T.I.L.L. Photonics, Munich, Germany), and the emitted fluorescence was collected using an objective lens, filtered through an LP520 (Olympus Corp., Tokyo, Japan), and detected using a photomultiplier (NT5783; Hamamatsu Photonics, Hamamatsu, Japan). Photolysis of caged-Ca2+ compounds was performed using either a mercury lamp (IX-RFC; Olympus Corp.) or a xenon flash lamp (High-Tech Instruments, Salisbury, UK) as described (Kasai et al., 1996). Open circles in [Ca2+]i traces in Figs. 1 and 2 indicate that the xenon flash lamp was used to generate Ca2+ jumps. Data obtained using the xenon flash and mercury lamps were combined to generate the histograms in Figs. 4 and 5.
Figure 1.
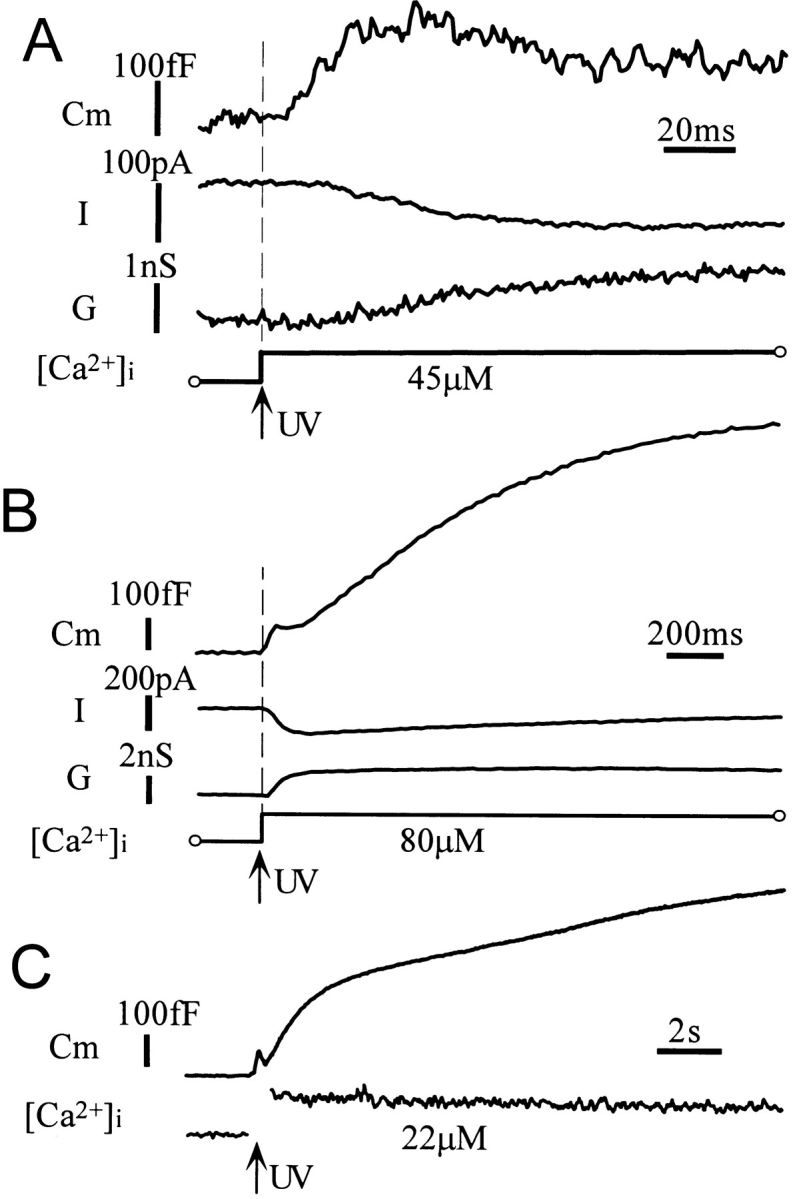
Membrane capacitance changes evoked by Ca2+ jumps in mouse β cells. Capacitance changes recorded from three cells. (A) The onset of the capacitance increases (Cm) preceded any changes in current (I) and conductance (G). The fast exocytotic component occurred with a delay and was followed by rapid endocytosis. (B) The slow exponential component of capacitance increase after the fast exocytotic component. This slow component was not associated with any changes in current (I) or conductance (G). (C) A linear increase in capacitance after the slow exponential component. This type of response frequently appeared when [Ca2+]i increases were sustained.
Figure 2.

Ca2+ dependence of the three components of capacitance increases in β cells. (A) Typical capacitance traces recorded from four different cells where [Ca2+]i was elevated to the levels indicated on the left of each trace. Symbols denote the slope of each of the two components of capacitance increases (see text). (B) An example of a capacitance trace where increase in [Ca2+]i was sustained and a linear slow phase of capacitance increase occurred. The slope of the linear component of capacitance increase was measured 2 s after the onset of Ca2+ jumps to minimize a contribution from the exponential component. (C–E) Ca2+ dependence of the rate of the fast component (fEX) and the two phases in the slow component of the increase in capacitance (s1EX and s2EX). The ordinate represents the maximal slope (rate) of each capacitance trace normalized by the total cell capacitance in each cell. Open small symbols represent data from individual cells, and large filled symbols represent means of the data obtained at certain intervals of [Ca2+]i increases. Vertical bars in the filled symbols denote the SD for 3–12 data points. Smooth lines are drawn according to the Hill equation with Hill coefficients of 3.2, 2.8, and 2.3 in C, D, and E, respectively. The dotted line in C is drawn according to Eq. 1 and predicted parameters in the text.
Figure 4.
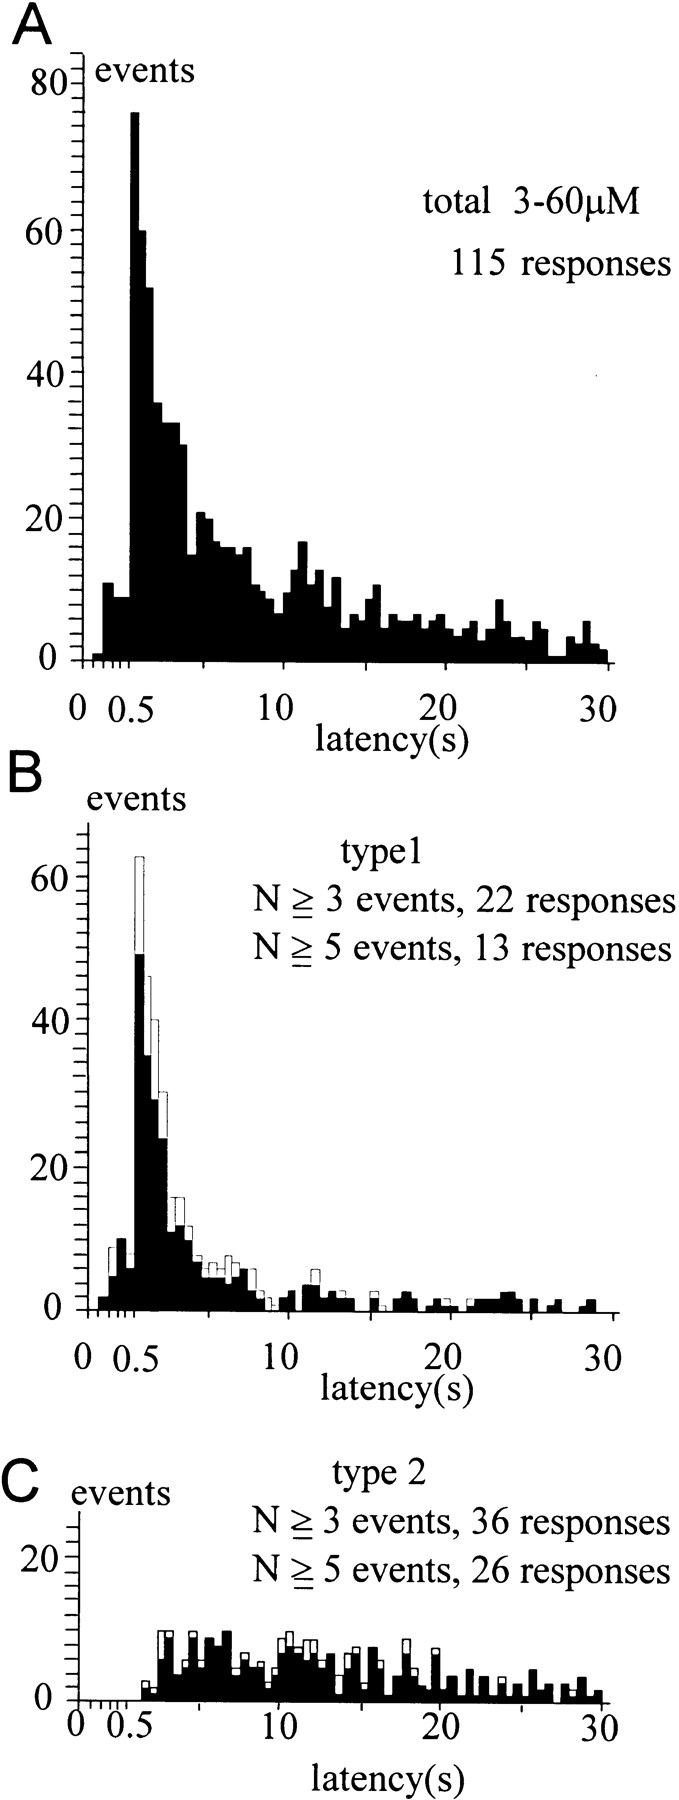
Type-1 and type-2 distributions. (A) The distribution of quantal events induced by Ca2+ jumps resulting in [Ca2+]i between 3 and 60 μM. (B) Estimated type-1 distribution obtained from the typical type-1 responses that contained at least N events (five and three for solid and open columns, respectively) within 1.5 s after the Ca2+ jumps. (C) Estimated type-2 distribution obtained from the typical type-2 responses that contained at least N events (five and three for solid and open columns, respectively) >1.5 s after the Ca2+ jumps. The width of the bin is set as 0.1 s until 0.5 s after the onset of Ca2+ jumps, when it is set as 0.5 s.
Figure 5.

Ca2+ dependence of type-1 and type-2 distributions. (A–C and E–G) Estimated type-1 (A–C) and type-2 (E–G) distributions obtained from the typical type-1 and type-2 responses, respectively, induced by Ca2+ jumps resulting in [Ca2+]i between 3 and 20 μM (A and E), between 20 and 40 μM (B and F), and between 40 and 60 μM (C and G). (D and H) Superimposed traces for time courses of [Ca2+]i, each trace corresponding to (A and E), (B and F), and (C and G). Each point is an average for more than five experiments.
In vivo calibration experiments of BTC were performed in whole-cell clamped β cells in the presence of caged compounds (Almers and Neher, 1985; Kasai et al., 1996). We prepared a set of 12 calibration solutions that contained the basic internal solution and 10 mM of either caged or photolysed forms of DM-nitrophen or NP-EGTA, and the Ca2+ concentration of these solutions was adjusted to either 0 mM, 15 μM, or 20 mM with Ca2+ buffers and CaCl2. Fluorescence ratios were obtained a few min after loading when the ratios stabilized. In our setup, Rmin, Rmax, and K d′ were 0.5, 2.3, and 109 μM for photolysed DM-nitrophen; 0.5, 1.9, and 107 μM for DM-nitrophen; 0.47, 2.0, and 89 μM for photolysed NP-EGTA; and 0.5, 2.0, and 87 μM for NP-EGTA, respectively. We used these values for photolysed caged-Ca2+ compounds to calculate peak [Ca2+]i (Kasai et al., 1996). We carried out all experimental procedures under yellow light illumination (FL40S-Y-F; National, Tokyo, Japan) to prevent photolysis of caged-Ca2+ compounds.
Amperometric Detection of Serotonin Secretion
For the real-time measurement of secretion of vesicular contents, β cells were maintained in the culture medium containing 0.5 mM serotonin and 0.5 mM 5-hydroxytryptophan for 4–8 h before recording. Discrete oxidative currents, “quantal events,” each due to secretion of serotonin from individual LVs, were recorded using a patch-clamp amplifier (CE2400; Nihon Koden, Tokyo, Japan) and a carbon fiber electrode (Pro CFE; Axon Instruments) with a diameter of ∼5 μm to which a positive potential (650 mV) was applied (Ninomiya et al., 1997). Amperometric currents were filtered at 0.1 kHz and sampled at 44 Hz (see Fig. 3). Artifacts of amperometry because of flash irradiation were subtracted using the trace from the same cell at the second or third flash where no secretion was detected. Forskolin (10 μM) was added to the bathing solution in most amperometric measurements.
Figure 3.

Simultaneous measurement of membrane capacitance and serotonin secretion. (A) A single component of capacitance increase for which a quantal secretory event was not detected in its early period. (B) An example of a type-1 response showing multiple quantal events within 1.5 s from the onset of Ca2+ jumps. (C and D) Two examples of type-2 responses where all of at least five quantal events were detected >1.5 s after the Ca2+ jump. The fast, slow-1, and slow-2 phases of capacitance increases are indicated by open circles, open triangles, and open diamonds, respectively.
Statistical Analysis of the Quantal Events
A Ca2+ jump induced in a cell triggered a series of quantal events, which we termed a “quantal response.” Statistical analysis to determine the existence of two types of quantal responses induced by Ca2+ jumps was performed as follows. We assume that a quantal response is a set of random samples from a quantal-event distribution between 0 and 30 s after the onset of Ca2+ jumps. Then, a probability density function, q(t), of the quantal-event distribution satisfies ∫030q(t)dt = 1. As a null hypothesis, we claim that both types of quantal responses are samples from the same quantal-event distribution. Consider a set of random F N quantal responses that contain N quantal events. The null hypothesis predicts the number, A N, of responses containing quantal events only between 2.5 and 30 s to be F N · p N, where p represents the probability of the occurrence of quantal events between 2.5 and 30 s, namely, p = ∫2.530q(t)dt. Using actual values of F N, A N, and p, the hypothesis can be tested with a level of significance
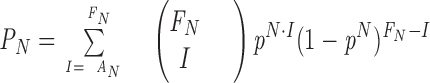
For this statistical analysis, all responses elicited by various magnitudes of Ca2+ jumps were included (see Fig. 4), because the time courses of the occurrence of quantal events did not differ significantly (see Fig. 5). The value of p was estimated to be 0.676 (± 0.012, SEM) from 779 events in 115 responses (see Fig. 4 A). A series of the parameters (N, F N, F N · p N, A N, P N) was then obtained as (1, 24, 16, 21, 0.025), (2, 19, 8, 12, 0.09), (3, 13, 4, 8, 0.02), (4, 10, 2, 3, 0.34), (5, 6, 0.8, 3, 0.2), (6, 11, 1, 7, 0.5 × 10⁻⁵), (7, 4, 0.25, 2, 0.02), (8, 4, 0.2, 2, 0.01), (9, 4, 0.15, 1, 0.13), (10, 2, 0.04, 1, 0.04), and (11, 5, 0.07, 4, 1.6 × 10⁻⁷). Thus, A N is always larger than F N · p N, and the hypothesis is rejected at N = 1, 3, 6, 7, 8, 10, and 11 with P N < 0.05. This indicates that the quantal responses arise from at least two types of quantal-event distributions, one involving fast events (type-1), and the other delayed events (type-2).
Results
Three Components of Capacitance Increases
Cultured mouse β cells were whole-cell clamped with a pipette containing a caged-Ca2+ compound and a Ca2+ indicator, BTC. The membrane capacitance of β cells was continuously monitored, and rapid stepwise elevation of cytosolic Ca2+ concentrations (Ca2+ jump) was induced using photolysis of the caged-Ca2+ compound. Increases in membrane capacitance, evoked by the Ca2+ jumps, exhibited two components as in other endocrine cells (Fig. 1, A and B) (Thomas et al., 1993; Neher and Zucker, 1993; Kasai et al., 1996). The fast increase in capacitance occurred after a short delay and was not preceded by any change in membrane current or conductance (Fig. 1 A). There was a rapid decrease in capacitance after the first increase in 45% of the cells (Fig. 1, A and B). The kinetic properties of the fast increase and decrease in capacitance will be analyzed in detail below. The increase in capacitance continued as long as [Ca2+]i remained high (Fig. 1 C), and the slow component was decomposed further into an early exponential phase (phase-1) and a late linear phase (phase-2).
Ca2+ dependencies of the increases in membrane capacitance were systematically investigated as shown in Fig. 2. No increase in capacitance was detected at [Ca2+]i <3 μM (Fig. 2 A). The increases in capacitance induced at [Ca2+]i of between 3 and 10 μM appeared as a single component, while those induced at [Ca2+]i >10 μM often displayed the fast and slow components (Figs. 1 B and 2 A). Ca2+ dependencies of the maximal rates of increase in capacitance are plotted in Fig. 2, C and D. Circles and triangles represent the fast and slow components, respectively, for those data for which the slow component could be separated from the fast one. Changes in capacitance were normalized by the total plasma membrane capacitance of each cell and expressed as percentage(s), because membrane capacitance varied considerably among cells (see Materials and Methods). The rate of capacitance increase was saturated at [Ca2+]i >50 μM for both the fast and slow components. The half-maximal rate was achieved at 23 μM and a Hill coefficient of 2.8 in the slow component (Fig. 2 D). Maximum rates obtained from data for which capacitance increases appeared as a single component are represented by squares in Fig. 2, C and D. These capacitance increases may involve both the fast and slow components (see below). Assuming that these rates preferentially reflect the rate for the fast component, the half-maximal rate of that component was calculated as 26 μM, with a Hill coefficient of 3.2 (Fig. 2 C).
The slow component of the capacitance increase was decomposed into two phases in the cells where increases in [Ca2+]i were long lasting (Figs. 1 C and 2 B). The early exponential phase (slow-1) showed a time constant of between 0.54 and 3 s (1.5 ± 0.4/s, mean ± SD, n = 17), suggesting depletion of a pool of vesicles. The late linear phase (slow-2) occurred with a constant rate as long as [Ca2+]i increases were sustained. The maximal rate of the slow-2 component was therefore measured at 2 s after the onset of Ca2+ jumps when the slow-1 component was almost depleted. Fig. 2 E shows that the rate of the slow-2 component also saturated at high [Ca2+]i, and the half-maximal rate was achieved at 18 μM with a Hill coefficient of 2.3.
The mean amplitude of the fast capacitance increases was ∼4.3 ± 1.7% (n = 108) of whole-cell capacitance in those cells where peak Ca2+ concentrations were >10 μM, while that of the slow-1 component was 16.2 ± 0.9% (n = 32). The amplitudes of the slow-2 component depended on the time course of [Ca2+]i. The mean amplitude was 25.8 ± 6.6% (n = 12) in those cells where Ca2+ concentrations were >10 μM for more than 10 s.
Quantal Secretion of Serotonin
To elucidate which of the two components represents exocytosis of LVs, we performed simultaneous capacitance measurement and amperometric measurement of serotonin in β cells stimulated with a caged-Ca2+ compound. β cells were preincubated with serotonin for 4–8 h. We frequently recorded transient oxidative currents (quantal events) representing fusion of a single LV containing serotonin after Ca2+ jumps (Figs. 3 and 4) (Smith et al., 1995; Zhou and Misler, 1996). However, no quantal event was detected during the fast component of capacitance increase in the examples shown in Fig. 3 (open circles). This can also be seen in the latency histogram (Fig. 4 A), where only four out of 779 quantal events were detected within 0.2 s after the onset of Ca2+ jumps at any [Ca2+]i. This suggests that the fast component does not reflect exocytosis of LVs. Even when the capacitance increase appeared as a single component, serotonin secretion was not detected at the beginning of the increase (Fig. 3 A). Thus, the apparent single component was considered to involve both the fast and slow exocytotic processes.
A Ca2+ jump induced in a cell triggered a sequence of quantal events, which we refer to as a quantal response. We noticed the existence of two types of quantal responses. In a type-1 response, quantal events occurred within 1.5 s after the onset of a Ca2+ jump (Fig. 3, A and B), whereas, in a type-2 response, quantal events were delayed (>1.5 s) and sustained (Fig. 3, C and D). The multiple occurrence of delayed events in type-2 responses supported the idea that both types of responses originated from two distinct quantal-event distributions (see Materials and Methods). We assume that each quantal response was a set of random samples from either a type-1 or a type-2 distribution. These distributions were therefore estimated using responses involving multiple quantal events to identify definitively the types of distribution from which the quantal responses originated. Namely, the type-1 distribution (Fig. 4 B) was estimated from those responses (type-1 response) involving at least five events within 1.5 s after the onset of Ca2+ jumps, while the type-2 distribution (Fig. 4 C) was estimated from those responses (type-2 response) with all of at least five events appearing more than 1.5 s after the onset of Ca2+ jumps. The estimated distributions were not affected to a significant degree if we used responses involving no less than three events (open bars in Fig. 4, B and C), or if we set the time threshold as 1.0 or 2.0 s (data not shown). The distribution of the events for all responses (Fig. 4 A) apparently can be accounted for by the sum of those for the two types of responses, consistent with the idea that responses can be classified into two types. For this study we used all responses elicited by various magnitudes of Ca2+ jumps, because time courses of type-1 and type-2 distributions did not depend significantly on [Ca2+]i (Fig. 5). Events involved in the type-1 and type-2 responses seem to contribute roughly equally to the distribution involving all responses (Fig. 4 A).
The estimated type-1 distribution showed a peak at 0.5 s after the onset of Ca2+ jumps, and the major component decayed rapidly with a time constant of 1.7 s (Fig. 4 B). This indicated the existence of a pool of LVs (type-1 LV pool) that fused with the membrane with a time constant of 1.7 s. No quantal events were evoked at [Ca2+]i <3 μM (data not shown), and the number of events per type-1 response was higher at greater [Ca2+]i (Fig. 5 A). Thus, time and [Ca2+]i dependencies of the type-1 distribution were consistent with those of the slow-1 component of capacitance increase. Temporal correspondence of the type-1 quantal response and capacitance increase was found even in a single cell, where the time course of the amperometric currents was roughly fitted with the time derivative of the slow component of capacitance increase (Fig. 3 B). Amperometric currents appeared to contain a nonquantal smooth component (Fig. 3 B), particularly in those responses involving many events within a few seconds after the onset of Ca2+ jumps. This apparent nonquantal component was interpreted to be the sum of many secretory events at sites distal to a recording carbon fiber, because quantal events originating at distal sites should be small and flat.
The estimated type-2 distribution (Fig. 4 C) peaked at ∼2.5 s after the onset of Ca2+ jumps, and the frequency of occurrence of quantal events decreased in parallel with the decay in [Ca2+]i (Fig. 5 C). This indicates the existence of another pool of LVs (type-2 LV pool) that fuse with the membrane very slowly. The type-2 quantal secretion occurred with a time course similar to that of the slow-2 phase of capacitance increase. It should be noted that the cells in which the type-2 response was recorded exhibited amplitudes of capacitance increases in the slow-1 phase similar to those of cells in which the type-1 response was recorded (Fig. 3); the mean amplitudes of the slow-1 component were 17.6 ± 1.0% (mean ± standard error, n = 10) and 15.0 ± 1.6% (n = 12) in the cells showing type-1 and type-2 responses, respectively. Thus, the type-1 pool appeared to exist with similar sizes in those cells that did not exhibit the type-1 response (see Discussion).
Vesicles in type-1 and type-2 pools seemed to take up similar amounts of serotonin. Peak amplitudes and total charges of individual amperometric currents were not significantly different between early events (<1.5 s) in the typical type-1 responses and those in the typical type-2 responses. They were 2.24 ± 0.24 pA and 119 ± 24 fC (mean ± standard error, n = 47), and 2.7 ± 0.7 pA and 163 ± 35 fC (n = 35), respectively.
Fast Exo- and Endocytosis
The properties of the fast exocytosis were investigated in those cells where the fast component of exocytosis could be distinguished from the slow one (Figs. 1 B, 2 B, and 6 A). The fast exocytosis appeared after a delay and occurred with a single exponential time course (Fig. 6 A). Both the delay and the time constants depended on [Ca2+]i (Fig. 6, B and C). The mean amplitude of the fast exocytosis was 4.3% of the total membrane area at [Ca2+]i >10 μM (Fig. 6 D). A very rapid decline in the capacitance followed the fast exocytosis in 45% of the cells examined. In such cases, the decline appeared to start after the capacitance increases reached a steady-state level, and it occurred with a single exponential time course. The time constant was also Ca2+ dependent (Fig. 6 E). If endocytosis occurs with a delay (Thomas et al., 1994; Heinemann et al., 1994; Kasai et al., 1996), the amplitudes of exocytosis and endocytosis can be quantified (Kasai et al., 1996). The amplitudes of the endocytosis (fEN) quantified as the decrease in capacitance during the fast endocytosis tended to correlate with those of the preceding fast exocytosis (fEX) in the same cell (Fig. 6 F). This suggests the coupling between the fast exocytosis and endocytosis (Kasai et al., 1996).
Figure 6.

Fast exo- and endocytosis. (A) Time courses of the fast exo- and endocytosis. The dashed curve is an exponential fit of the data. (B–D) Ca2+ dependence of the delays (B), time constants (C), and amplitudes (D) of the fast exocytosis. Smooth dashed curves in B and D are drawn according to Eq. 1 and parameters in the text. (E) Ca2+ dependence of the time constants of the fast endocytosis. (F) Correlation between the amplitudes of the fast exocytosis and endocytosis. The solid line indicates the relationship fEX = fEN. The correlation coefficient is 0.449 (P < 0.025). The width of the bin is set as 0.1 s until 0.5 s after the onset of Ca2+ jumps, when it is set as 0.5 s.
Slow Endocytosis
Slow decreases in the capacitance, representing the slow endocytosis, often followed the slow-2 exocytosis when [Ca2+]i tended to decline (Fig. 7 A). The slow endocytosis was often associated with stepwise decreases in capacitance (arrowheads in Fig. 7). The sizes of stepwise decreases ranged between 16 fF and 78 fF (Fig. 7 B); this indicates endocytosis of vesicles >0.8 μm, corresponding to the phenomenon called “vacuolation” (Baker and Knight, 1981; Back et al., 1993; Knoll et al., 1992; Kasai et al., 1996). The stepwise decreases could also be identified as negative spikes in the time derivative of the capacitance traces (Fig. 7 A). Interestingly, the slow-1 phase of exocytosis was followed by a transient decrease in the capacitance in seven cells where [Ca2+]i was >30 μM (Fig. 7 C). The endocytosis after the slow-1 phase was also associated with the stepwise decreases in membrane capacitance. Thus, both slow-1 and slow-2 phases of exocytosis triggered endocytosis with vacuolation, but the onsets of the endocytoses were different. These data are consistent in suggesting that distinct pools of LVs caused two phases of exocytosis and subsequent slow endocytosis.
Figure 7.

Slow endocytosis. (A) An example of the slow endocytosis that occurred after the slow-2 phase of capacitance increase. Arrows indicate the stepwise decreases in capacitance, which appear as negative spikes in the time derivative of capacitance (Cm/dt). (B) Amplitude distribution of the stepwise capacitance decreases, representing endocytosis of large vesicles. Diameters of the vesicles are calculated assuming a spherical shape of the vesicles and a membrane capacitance of 1 μF/cm2. (C) An example of the slow endocytosis that occurred immediately after the slow-1 phase of capacitance increase.
Discussion
We have investigated exocytosis in β cells by simultaneously using capacitance measurement and amperometric detection of vesicular contents. Three lines of evidence indicated the existence of three exocytotic pathways in β cells. First, the increase in membrane capacitance induced by Ca2+ jumps exhibited two major components, a fast and a slow component, and the latter was further decomposed into two phases (Fig. 8 A). Second, quantal events of serotonin secretion occurred with two distinct time distributions, each of which corresponds to one of the two phases of slow capacitance increase. Finally, three forms of endocytosis followed the three components of exocytosis. We will discuss below the validity and implications of the multiple exocytotic pathways in β cells (Fig. 8, B and C).
Figure 8.

Exocytotic events induced by Ca2+ jumps in a pancreatic β cell. (A) Three phases (a, b, and c) in the increase in membrane capacitance induced by Ca2+ jumps. (B) Sequential model. This model contains only one fusion step with a rate constant (a) preceded by two sequential steps with rate constants (b and c). This model is inconsistent with our data for β cells, first because quantal serotonin secretion was only associated with the slow capacitance increase, suggesting a separate SV pathway, and second because the two types of responses of quantal events were detected during the slow capacitance increase, indicating the existence of two LV pathways (see text). (C) Multi-pathway model. Three pathways, one SV and two LV pathways, undergo exocytosis with time constants reflected by a, b, and c. The two LV pathways either represent two independent pathways or two modes of the same pathway where the modes are regulated by cellular metabolic states.
Slow Exocytotic Pathways
We believe that the slow increases in membrane capacitance reflect exocytosis of LVs, first of all because they were associated with secretion of serotonin that was reported to be loaded predominantly into LVs in β cells (Jaimm-Etcheverry and Zieher, 1968; Ekholm et al., 1971; Hellman et al., 1972). Although in some neurons monoamines are also believed to be stored in small dense-core vesicles (Bruns and Jahn, 1995; Bauerfeind et al., 1995), the existence of such vesicles in endocrine cells has not been reported. Second, the slow exocytosis was followed by a slow decline in the capacitance with large stepwise reductions, the phenomenon termed vacuolation, which is reported to follow LV exocytosis (Fig. 6) (Baker and Knight, 1981; Back et al., 1993; Knoll et al., 1992).
The exocytosis that we studied at room temperature mostly represents exocytosis of the fusion-ready vesicles that have undergone the final ATP-dependent step (Südhof, 1995), because it did not depend to any great extent on cytosolic ATP concentration; we performed most of the experiments in the absence of ATP (see Materials and Methods) (Renstroem et al., 1996). The first Ca2+ jumps induced exocytosis of most of the fusion-ready vesicles, while the second Ca2+ jumps induced little exocytosis in our preparations, unlike those reported to occur in synaptic terminals (Hsu et al., 1996). Thus, the first Ca2+ jumps exhausted the fusion-ready vesicles. Assuming the mean diameter of LVs to be 250 nm and a membrane capacitance of 1 μF/cm2, the mean amplitude of the slow component of capacitance increase (2.1 ± 0.3 pF) gives a lower limit of the number of fusion-ready LVs as 950–1,250 per cell. Since the native pancreatic β cells possess ∼13,000 insulin granules (Dean, 1973), at least 7–9% of the granules appear to be fusion-ready in β cells.
Interestingly, we recorded two types of quantal responses, type-1 and type-2, with distinct quantal-event distributions (Fig. 4), indicating the existence of two LV pools. The two LV pools can be accounted for by two LV pathways with distinct time constants of fusion (Fig. 8 C). The existence of the two pools might also be explained by a sequential model (Fig. 8 B), in which LVs in the type-2 pool need to proceed to the type-1 pool before fusion. To explain the existence of the two types of responses, however, we have to assume two types of sequential pathways whose pools are filled with LVs to different degrees, otherwise we should have detected only a single type of response. The difference in the filling states of the pools means that the rate constants of vesicle transitions between the pools are different among the two pathways. In this sense, even considering the sequential mechanism, the existence of two distinct LV pathways is required for understanding our data (Fig. 8 C). The two pathways represent either two independent pathways or two “modes” of the same pathway where the modes are regulated by cellular metabolic states in β cells.
We believe that the existence of both the type-1 and type-2 pools of LVs in β cells is important for β cell functions for the following two reasons. First, other secretory cells exhibit either a type-1 or a type-2 pool; the type-1 pool is the major pool in adrenal chromaffin cells exhibiting rapid secretion of catecholamine (Ninomiya et al., 1997), whereas the type-2 pool is predominant in PC12 cells (Ninomiya et al., 1997) and likely predominant in exocrine acinar cells exhibiting slow secretion of zymogen granules (Ito et al., 1997). Second, the β cells are known to exhibit biphasic patterns of insulin secretion during application of glucose or other stimuli (Cerasi and Luft, 1967; Curry et al., 1968; Wollheim and Sharp, 1981; Hagopian et al., 1993). It can be speculated that, after the fast exocytosis of type-1 pool LVs in β cells, a substantial portion of type-2 pool LVs remains available for the late phase of secretion. Thus, the two pools of LVs may contribute to the biphasic secretion of insulin, in addition to other mechanisms underlying the biphasic secretion of insulin that have already been proposed (Wollheim and Sharp, 1981). The time courses of the slow-2 phase of LV exocytosis in the present study (>10 s) appeared to be faster than that of the late phase of insulin secretion in vivo (>5 min) (Wollheim and Sharp, 1981). This may be due to the fact that secretion was triggered by sustained increases in [Ca2+]i in this study, while it was triggered intermittently by Ca2+ spikes in vivo (Bergesten, 1995). Selective deficit of the fast pulsatile secretion of insulin has been reported as an early symptom with non–insulin-dependent diabetes (O'Rahilly et al., 1988). Our data suggest the new possibility that selective impairment of the type-1 LV exocytosis and/or selective depletion of the type-1 LV pool underlie the pathogenesis of diabetes.
We have seen an apparent correspondence between the two phases of slow capacitance increase and the two quantal responses, consistent with the vesicle hypothesis of secretion involving LVs. In more detail, however, the slow-1 phases of capacitance increases were similar in the cells showing type-1 and type-2 responses (Fig. 3). This suggests that a type-1 LV pool of a size similar to that in the cells that exhibited the type-1 responses appeared to exist in those cells that did not exhibit the type-1 responses. This discrepancy can be accounted for by the following explanations. First, there is a regional variation in the distribution of LV pools within a single β cell, and the type-1 response can be recorded only from a part of the surface area of the cell. Indeed, polarized localization of LVs has been observed using quinacrine in cultured mouse β cells (Bokvist et al., 1995), and a carbon fiber electrode can sense secretory substances present within only a few micrometers from the electrodes (Schroeder et al., 1994). Second, serotonin uptake into vesicles of the two LV pools might be variable among β cells.
In the present study exocytosis was seldom induced at [Ca2+]i <3 μM and did not saturate even at 10 μM (Figs. 2 and 5). This finding is consistent with the estimates obtained for permeabilized pancreatic β cells using electrical shock (Jones et al., 1985), digitonin (Tamagawa et al., 1985), or streptolysin-O (Okazaki et al., 1994). This finding, however, is not in line with those obtained in microfluorimetric studies, where insulin secretion and increases in [Ca2+]i were simultaneously measured, and where insulin secretion occurred at [Ca2+]i <1 μM (Smith et al., 1995; Bergesten, 1995). However, it has been reported that there are [Ca2+]i hot spots in β cells (Theler et al., 1992; Bokvist et al., 1995), and that [Ca2+]i in the hot spots can be underestimated using the high affinity Ca2+ indicators (Ito et al., 1997) that have been used in previous studies (Smith et al., 1995; Bergesten, 1995). Hence, local [Ca2+]i increases around secretory vesicles can be larger than reported, and more precise [Ca2+]i measurements using low affinity Ca2+ indicators and tomographic imaging techniques are necessary to determine the precise Ca2+ dependence of exocytosis during physiological stimulation. Recently, it has been pointed out that exocytosis of LVs in exocrine acinar cells requires larger increases in [Ca2+]i than hitherto considered (Ito et al., 1997).
Fast Exocytotic Pathway
The fast exocytosis likely represents exocytosis of SVs, because β cells possess both SVs and LVs, and the fast exocytosis was not accompanied by secretion of serotonin. In addition, some of the kinetic properties of the fast exocytosis are similar to those of the fast exocytosis in PC12 cells, including a delay in the occurrence of exocytosis (Figs. 1 A and 6 A) and a tendency for exocytosis to be canceled out by the following rapid endocytosis (Fig. 6 F) that is Ca2+ dependent (Fig. 6, B and C). The fast exocytosis in PC12 cells has been recently demonstrated to represent exocytosis of SVs (Kasai et al., 1996; Ninomiya et al., 1997). Our data, however, cannot entirely rule out the possibility that the fast exocytotic pathway in β cells involves secretory vesicles other than SVs, e.g., LVs that did not take up serotonin. The exocytosis of SVs may have a secretory function; cells of one β cell line, β-TC6, secrete GABA upon high glucose stimulation (Gaskins et al., 1995). Physiological effects of GABA secretion on glucagon-secreting cells were previously proposed (Rorsman et al., 1989; Sorenson et al., 1991; Gilon et al., 1991). SV exocytosis may have functions other than secretion, such as membrane remodeling and resealing (Bi et al., 1995) or transport of molecules in the plasma membrane (Kiss et al., 1994).
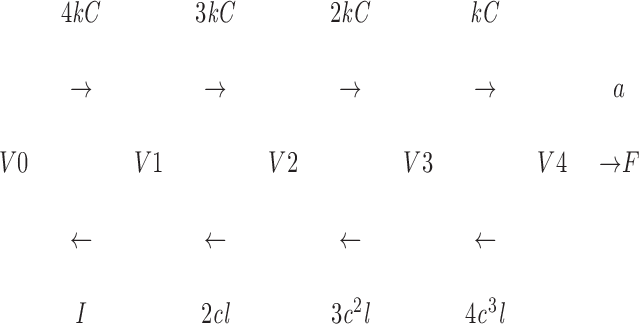
To compare kinetic features of the Ca2+-dependent exocytosis of SVs in β cells and those in neurons, the rate constants and delays of the fast exocytosis were fitted to a model used to explain those of the exocytosis in a nerve terminal (Heidelberger et al., 1994). We postulate cooperative binding of four Ca ions, because the Hill coefficient of the Ca2+ dependence of the fast exocytotic component was 3.2.
 |
1 |
where V0 to V4 represent vesicles whose Ca2+ binding sites are occupied by zero to four Ca ions, F represents a fused vesicle, k is the rate constant of Ca2+ binding, C is the concentration of Ca2+, l is the rate constant of Ca2+ dissociation, and a is the rate constant of fusion. A parameter c is used to account for the cooperative Ca2+ binding (Heidelberger et al., 1994) and is fixed at 0.2. We estimated the rate constant of fusion, a, to be 100/s from the maximum rate of exocytosis at high [Ca2+]i. Then, the delay in the exocytosis was chiefly attributed to k, and the Ca2+ sensitivity to k and l. A satisfactory fit of the data was obtained by setting k = 4 × 10⁶/s/M and l = 300/s (dashed line in Figs. 2 C and 6, B and C). Thus, the SVs of β cells exhibit a 10 times smaller fusion rate (a) than the SVs of synaptic vesicles.
Another important characteristic of SV exocytosis in β cells is its Ca2+ dependence, which is similar to that of LV exocytosis in the same cells. This suggests that SV exocytosis was induced by elevation of [Ca2+]i in a similar way to LV exocytosis. Capacitance measurement has been widely used for elucidating the regulatory mechanisms of exocytosis in β cells that are subjected to depolarization (Gillis and Misler, 1992, 1993; Ämmälä et al., 1993, 1994; Bokvist et al., 1995; Eliasson et al., 1996; Renstroem et al., 1996). In such experiments, the contribution of the fast exocytosis to the capacitance increase cannot be precisely estimated because the exact increase of [Ca2+]i in the vicinity of SVs is not known. Assuming, however, that [Ca2+]i increases to 5 μM in the vicinity of vesicles (Bokvist et al., 1995) for 200 ms, the above model predicts exocytosis of 16% of the fusion-ready SVs, which amounts to a 33 fF increase in membrane capacitance. Hence, the capacitance increases induced by depolarization should be interpreted with caution, since they may substantially involve SV as well as LV exocytosis. In contrast, the capacitance increases induced by Ca2+ jumps offer the possibility of investigating exocytosis of each type of vesicle with distinct fusion rate constants (Fig. 8, A and C).
The capacitance changes induced by Ca2+ jumps (Fig. 8 A) have often been interpreted using a single-pathway sequential model (Fig. 8 B) for endocrine cells (Neher and Zucker, 1993; Thomas et al., 1993). The sequential model postulates only one type of vesicle and one final fusion step. Previous studies in chromaffin and PC12 cells, however, indicated the existence of two Ca2+-dependent exocytotic pathways, involving SVs and LVs, with distinct fusion rate constants (Ninomiya et al., 1997). In the present study we have further suggested the existence of two LV pathways with distinct fusion time constants and distributions in β cells (Fig. 8 C). Thus, the involvement of multiple exocytotic pathways needs to be considered to interpret the changes in membrane capacitance in secretory cells. Pancreatic β cells offer a good system to elucidate morphological bases of multiple exocytotic pathways and to reveal molecular mechanisms underlying divergent fusion kinetics in secretory cells.
Acknowledgments
We thank K. Yasuda (Third Department of Internal Medicine) for helpful discussion, and Y. Ninomiya, K. Ito, and T. Kishimoto (Department of Physiology) for technical assistance.
This work was supported by grants-in-aid from the Japanese Ministry of Education, Science, and Culture, a grant from the Takeda Foundation, a research grant from the Human Frontier Science Program, Research for the Future of the Japan Society for the Promotion of Science, and Core Research for Evolutional Science and Technology of the Japan Science and Technology Corporation. N. Takahashi is a research fellow of the Japan Society for the Promotion of Science.
Footnotes
1. Abbreviations used in this paper: BTC, benzothiazole coumarin; [Ca2+]i, cytosolic Ca2+ concentration; DM-nitrophen, dimethoxynitrophenamine tetrasodium salt; GABA, γ-amino-n-butyric acid; LV, large dense-core vesicle; NP-EGTA, 2-nitrophenyl O, O′-bis (2-aminoethyl) ethyleneglycol-N,N,N′,N′-tetraacetic acid tetrapotassium salt; SV, small-clear vesicle.
Please address all correspondence to Haruo Kasai, Department of Physiology, Faculty of Medicine, University of Tokyo, Hongo, Bunkyo-ku, Tokyo 113, Japan. Fax: (81) 3-5802-8686. e-mail: hkasai@m.u-tokyo.ac.jp
References
- Almers W, Neher E. The Ca signal from fura-2 loaded mast cells depends strongly on the method of dye-loading. FEBS Lett. 1985;192:13–18. doi: 10.1016/0014-5793(85)80033-8. [DOI] [PubMed] [Google Scholar]
- Ämmälä C, Eliasson L, Bokvist K, Larsson O, Ashcroft FM, Rorsman P. Exocytosis elicited by action potentials and voltage-clamp calcium currents in individual mouse pancreatic B-cells. J Physiol. 1993;472:665–688. doi: 10.1113/jphysiol.1993.sp019966. [DOI] [PMC free article] [PubMed] [Google Scholar]
- Ämmälä C, Eliasson L, Bokvist K, Berggren P, Honkanen RE, Sjoeholm A, Rorsman P. Activation of protein kinases and inhibition of protein phophatases play a central role in the regulation of exocytosis in mouse pancreatic β cells. Proc Natl Acad Sci USA. 1994;91:4343–4347. doi: 10.1073/pnas.91.10.4343. [DOI] [PMC free article] [PubMed] [Google Scholar]
- Andersson PO, Bloom SR, Edwards AV. Effects of stimulation of the chorda tympani in bursts on submaxilliary responses in the cat. J Physiol. 1982;322:469–483. doi: 10.1113/jphysiol.1982.sp014050. [DOI] [PMC free article] [PubMed] [Google Scholar]
- Back N, Soinila S, Virtanen I. Endocytotic pathways in the melanotroph of the rat pituitary. Histochem J. 1993;23:133–139. doi: 10.1007/BF00157985. [DOI] [PubMed] [Google Scholar]
- Baker P, Knight DE. Calcium control of exocytosis and endocytosis in bovine adrenal medullary cells. Philos Trans R Soc Lond Ser B Biol Sci. 1981;296:83–103. doi: 10.1098/rstb.1981.0174. [DOI] [PubMed] [Google Scholar]
- Bauerfeind R, Jelinek R, Hellwig A, Huttner WB. Neurosecretory vesicles can be hybrids of synaptic vesicles and secretory granules. Proc Natl Acad Sci USA. 1995;92:7342–7346. doi: 10.1073/pnas.92.16.7342. [DOI] [PMC free article] [PubMed] [Google Scholar]
- Bergesten P. Slow and fast oscillations of cytosolic Ca2+in pancreatic islets correspond to pulsatile insulin release. Am J Physiol. 1995;268:E282–E287. doi: 10.1152/ajpendo.1995.268.2.E282. [DOI] [PubMed] [Google Scholar]
- Bi G, Alderton JM, Steinhardt RA. Calcium-regulated exocytosis is required for cell membrane resealing. J Cell Biol. 1995;131:1747–1758. doi: 10.1083/jcb.131.6.1747. [DOI] [PMC free article] [PubMed] [Google Scholar]
- Bokvist K, Eliasson L, Ämmälä C, Renstroem E, Rorsman P. Co-localization of L-type Ca2+channels and insulin-containing secretory granules and its significance for the initiation of exocytosis in mouse pancreatic B-cells. EMBO (Eur Mol Biol Organ) J. 1995;14:50–57. doi: 10.1002/j.1460-2075.1995.tb06974.x. [DOI] [PMC free article] [PubMed] [Google Scholar]
- Bruns D, Jahn R. Real-time measurement of transmitter release fom single synaptic vesicles. Nature (Lond) 1995;377:62–65. doi: 10.1038/377062a0. [DOI] [PubMed] [Google Scholar]
- Cerasi E, Luft R. The plasma insulin response to glucose infusion in healthy subjects and in diabetes mellitus. Acta Endocrinol. 1967;55:278–304. doi: 10.1530/acta.0.0550278. [DOI] [PubMed] [Google Scholar]
- Coorssen JR, Schmitt H, Almers W. Ca2+triggered massive exocytosis in Chinese hamster ovary cells. EMBO (Eur Mol Biol Organ) J. 1996;15:3787–3791. [PMC free article] [PubMed] [Google Scholar]
- Curry DL, Bennet LL, Grodsky GM. Dynamics of insulin secretion by the prefused rat pancreas. Endocrinology. 1968;83:572–584. doi: 10.1210/endo-83-3-572. [DOI] [PubMed] [Google Scholar]
- De Camilli P, Jahn R. Pathways to regulated exocytosis in neurons. Annu Rev Physiol. 1990;52:625–645. doi: 10.1146/annurev.ph.52.030190.003205. [DOI] [PubMed] [Google Scholar]
- Dean PM. Ultrastructural morphometry of the pancreatic beta-cell. Diabetologia. 1973;9:115–119. doi: 10.1007/BF01230690. [DOI] [PubMed] [Google Scholar]
- Ekholm R, Ericson LE, Lundquist I. Monoamines in the pancreatic islets of the mouse. Diabetologia. 1971;7:339–348. doi: 10.1007/BF01219468. [DOI] [PubMed] [Google Scholar]
- Eliasson L, Renstroem E, Ämmälä C, Berggren P, Bertorello AM, Bokvist K, Chibalin A, Deeney JT, Flatt PR, Gabel J, et al. PKC- dependent stimulation of exocytosis by sulfonylureas in pacreatic β cells. Science (Wash DC) 1996;271:813–815. doi: 10.1126/science.271.5250.813. [DOI] [PubMed] [Google Scholar]
- Gaskins HR, Baldeon ME, Selassie L, Beverly JL. Glucose modulates γ-aminobutyric acid release from the pancreatic βTC6 cell line. J Biol Chem. 1995;270:30286–30289. doi: 10.1074/jbc.270.51.30286. [DOI] [PubMed] [Google Scholar]
- Gillis KD, Misler S. Single cell assay of exocytosis from pancreatic islet B cells. Pfluegers Arch. 1992;420:121–123. doi: 10.1007/BF00378654. [DOI] [PubMed] [Google Scholar]
- Gillis KD, Misler S. Enhancers of cytosolic cAMP augument depolarization-induced exocytosis from pancreatic B-cells: evidence from effects distal to Ca2+entry. Pfluegers Arch. 1993;424:195–197. doi: 10.1007/BF00374612. [DOI] [PubMed] [Google Scholar]
- Gilon P, Bertrand G, Loubatieres-Mariani MM, Remacle C, Henquin JC. The influence of γ-aminobutyric acid on hormone release by the mouse and rat endocrine pancreas. Endocrinology. 1991;129:2521–2529. doi: 10.1210/endo-129-5-2521. [DOI] [PubMed] [Google Scholar]
- Gylfe E. Association between 5-hydroxytryptamine release and insulin secretion. J Endocrinol. 1978;78:239–248. doi: 10.1677/joe.0.0780239. [DOI] [PubMed] [Google Scholar]
- Hagopian WA, Karlsen AE, Petersen JS, Teague J, Gervassi A, Jiang J, Fujimoto W, Lernmark A. Regulation of glutamic acid decarboxylase diabetes autoantigen expression in highly purified isolated islets from Macaca nemestria. Endocrinology. 1993;132:2674–2681. doi: 10.1210/endo.132.6.8504767. [DOI] [PubMed] [Google Scholar]
- Heidelberger R, Heinemann C, Neher E, Matthews G. Calcium dependence of the rate of exocytosis in a synaptic terminal. Nature (Lond) 1994;371:513–515. doi: 10.1038/371513a0. [DOI] [PubMed] [Google Scholar]
- Heinemann C, Chow RH, Neher E, Zucker RS. Kinetics of the secretory response in bovine chromaffin cells following flash photolysis of caged Ca2+ . Biophys J. 1994;67:2546–2557. doi: 10.1016/S0006-3495(94)80744-1. [DOI] [PMC free article] [PubMed] [Google Scholar]
- Hellman B, Lernmark A, Sehlin J, Taljedal I. Transport and storage of 5-hydroxytryptamine in pancreatic β-cells. Biochem Pharmacol. 1972;21:695–706. doi: 10.1016/0006-2952(72)90062-7. [DOI] [PubMed] [Google Scholar]
- Hsu S, Augustine GJ, Jackson MB. Adaptation of Ca2+-triggered exocytosis in presynaptic terminals. Neuron. 1996;17:501–512. doi: 10.1016/s0896-6273(00)80182-8. [DOI] [PubMed] [Google Scholar]
- Huang L, Shen H, Atkinson MA, Kennedy RT. Detection of exocytosis at individual pancreatic β cells by amperometry at a chemically modified microelectrode. Proc Natl Acad Sci USA. 1996;92:9608–9612. doi: 10.1073/pnas.92.21.9608. [DOI] [PMC free article] [PubMed] [Google Scholar]
- Ito K, Miyashita Y, Kasai H. Micromolar and submicromolar Ca2+spikes regulating distinct cellular functions in pancreatic acinar cells. EMBO (Eur Mol Biol Organ) J. 1997;16:242–251. doi: 10.1093/emboj/16.2.242. [DOI] [PMC free article] [PubMed] [Google Scholar]
- Jaimm-Etcheverry G, Zieher LM. Electron microscopic cytochemistry of 5-hydroxytryptamine (5-HT) in the beta cells of guinea pig endocrine pancreas. Endocrinology. 1968;83:917–923. doi: 10.1210/endo-83-5-917. [DOI] [PubMed] [Google Scholar]
- Jan LY, Jan YN. Peptidergic transmission in sympathetic ganglia of the frog. J Physiol. 1982;327:219–246. doi: 10.1113/jphysiol.1982.sp014228. [DOI] [PMC free article] [PubMed] [Google Scholar]
- Jones PM, Stutchfield J, Howell SL. Effects of Ca2+and a phorbol ester on insulin secretion from islets of Langerhans permeabilized by high-voltage discharge. FEBS Lett. 1985;191:102–107. doi: 10.1016/0014-5793(85)81002-4. [DOI] [PubMed] [Google Scholar]
- Joshi C, Fernandez JM. Capacitance measurements: an analysis of the phase detector technique used to study exocytosis and endocytosis. Biophys J. 1988;53:885–892. doi: 10.1016/S0006-3495(88)83169-2. [DOI] [PMC free article] [PubMed] [Google Scholar]
- Kasai H, Takagi H, Ninomiya Y, Kishimoto T, Ito K, Yoshida A, Yoshioka T, Miyashita Y. Two components of exocytosis and endocytosis in PC12 cells studied using caged-Ca2+compounds. J Physiol. 1996;494:53–65. doi: 10.1113/jphysiol.1996.sp021475. [DOI] [PMC free article] [PubMed] [Google Scholar]
- Kelly RB. Storage and release of neurotransmitters. Cell. 1993;72:45–53. doi: 10.1016/s0092-8674(05)80027-3. [DOI] [PubMed] [Google Scholar]
- Kennedy RT, Huang L, Atkinson MA, Dush P. Amperometric monitoring of chemical secretions from individual pancreatic β-cells. Anal Chem. 1987;65:1882–1887. doi: 10.1021/ac00062a012. [DOI] [PubMed] [Google Scholar]
- Kiss JZ, Wang C, Olive S, Rougon G, Lang J, Baetens D, Harry D, Pralong W. Activity-dependent mobilization of the adhesion molecule polysialic NCAM to the surface of neurons and endocrine cells. EMBO (Eur Mol Biol Organ) J. 1994;13:5284–5292. doi: 10.1002/j.1460-2075.1994.tb06862.x. [DOI] [PMC free article] [PubMed] [Google Scholar]
- Knoll G, Plattner H, Nordmann J. Exo-endocytosis in isolated peptidergic nerve terminals occurs in the sub-second range. Biosci Rep. 1992;12:495–501. doi: 10.1007/BF01122037. [DOI] [PubMed] [Google Scholar]
- Matteoli M, Haimann C, Torri-Tarelli F, Polak JM, Ceccarelli B, De Camilli P. Differential effect of α-latrotoxin on exocytosis from small synaptic vesicles and from large dense-core vesicles containing calcitonin gene-related peptide at the frog neuromuscular junction. Proc Natl Acad Sci USA. 1988;85:7366–7370. doi: 10.1073/pnas.85.19.7366. [DOI] [PMC free article] [PubMed] [Google Scholar]
- Morimoto T, Popov S, Buckley KM, Poo M. Calcium-dependent transmitter secretion from fibroblasts: modulation by synaptotagmin I. Neuron. 1995;15:689–696. doi: 10.1016/0896-6273(95)90156-6. [DOI] [PubMed] [Google Scholar]
- Neher E, Zucker RS. Multiple calcium-dependent processes related to secretion in bovine chromaffin cells. Neuron. 1993;10:21–30. doi: 10.1016/0896-6273(93)90238-m. [DOI] [PubMed] [Google Scholar]
- Ninomiya Y, Kishimoto T, Miyashita Y, Kasai H. Ca2+-dependent exocytotic pathways in CHO fibroblasts revealed by capacitance measurement and a caged-Ca2+compound. J Biol Chem. 1996;271:17751–17754. doi: 10.1074/jbc.271.30.17751. [DOI] [PubMed] [Google Scholar]
- Ninomiya Y, Kishimoto T, Yamazawa T, Ikeda H, Miyashita Y, Kasai H. Kinetic diversity in the fusion of exocytotic vesicles. EMBO (Eur Mol Biol Organ) J. 1997;16:929–934. doi: 10.1093/emboj/16.5.929. [DOI] [PMC free article] [PubMed] [Google Scholar]
- O'Rahilly S, Turner RC, Matthews DR. Impaired pulsatile secretion of insulin in relatives of patients with non-insulin dependent diabetes. N Engl J Med. 1988;318:1225–1230. doi: 10.1056/NEJM198805123181902. [DOI] [PubMed] [Google Scholar]
- Okazaki K, Niki I, Iino S, Kobayashi S, Hidaka H. A role of calcyclin, a Ca2+-binding protein, on the Ca2+-dependent insulin release from the pancreatic β cell. J Biol Chem. 1994;269:6149–6152. [PubMed] [Google Scholar]
- Renstroem E, Eliasson L, Bokvist K, Rorsman P. Cooling inhibits exocytosis in single mouse pancreatic B-cells by suppression of granule mobilization. J Physiol. 1996;494:41–52. doi: 10.1113/jphysiol.1996.sp021474. [DOI] [PMC free article] [PubMed] [Google Scholar]
- Rorsman P, Trube G. Calcium and delayed potassium currents in mouse pancreatic β-cells under voltage-clamp conditions. J Physiol. 1986;374:531–550. doi: 10.1113/jphysiol.1986.sp016096. [DOI] [PMC free article] [PubMed] [Google Scholar]
- Rorsman P, Berggren P, Bokvist K, Ericson H, Moehler H, Ostensen C, Smith PA. Glucose-inhibition of glucagon secretion involves activation of GABAA-receptor chloride channels. Nature (Lond) 1989;341:233–236. doi: 10.1038/341233a0. [DOI] [PubMed] [Google Scholar]
- Schroeder TJ, Jankowski JA, Senyshyn J, Holz RW, Wightman M. Zones of exocytotic release on bovine adrenal medullary cells in culture. J Biol Chem. 1994;269:17215–17220. [PubMed] [Google Scholar]
- Smith PA, Duchen MR, Ashcroft FM. A fluorimetric and amperometric study of calcium and secretion in isolated mouse pancreatic β-cells. Pfluegers Arch. 1995;430:808–818. doi: 10.1007/BF00386180. [DOI] [PubMed] [Google Scholar]
- Sorenson RL, Garry DG, Brelje TC. Structural and functional considerations of GABA in islets of Langerhans. Diabetes. 1991;40:1365–1374. doi: 10.2337/diab.40.11.1365. [DOI] [PubMed] [Google Scholar]
- Südhof TC. The synaptic vesicle cycle: a cascade of protein-protein interactions. Nature (Lond) 1995;756:6357–6361. doi: 10.1038/375645a0. [DOI] [PubMed] [Google Scholar]
- Tamagawa T, Niki H, Niki A. Insulin release independent of a rise in cytosolic free Ca2+by forskolin and phorbol ester. FEBS Lett. 1985;183:430–432. doi: 10.1016/0014-5793(85)80825-5. [DOI] [PubMed] [Google Scholar]
- Theler J, Mollard P, Guerineau N, Vacher P, Pralong WF, Schegel W, Wollheim CB. Video imaging of cytosolic Ca2+in pancreatic β-cells stimulated by glucose, carbacol and ATP. J Biol Chem. 1992;267:18110–18117. [PubMed] [Google Scholar]
- Thomas P, Wong JG, Lee AK, Almers W. A low affinity Ca2+receptor controls the final steps in peptide secretion from pituitary melanotrophs. Neuron. 1993;11:93–104. doi: 10.1016/0896-6273(93)90274-u. [DOI] [PubMed] [Google Scholar]
- Thomas P, Lee AK, Wong JG, Almers W. A triggered mechanism retrieves membrane in seconds after Ca2+-stimulated exocytosis in single pituitary cells. J Cell Biol. 1994;124:667–675. doi: 10.1083/jcb.124.5.667. [DOI] [PMC free article] [PubMed] [Google Scholar]
- Thomas-Reetz AC, De Camilli P. A role for synaptic vesicles in non-neuronal cells: clues from pancreatic β cells and from chromaffin cells. FASEB (Fed Am Soc Exp Biol) J. 1994;8:209–216. doi: 10.1096/fasebj.8.2.7907072. [DOI] [PubMed] [Google Scholar]
- Verhage M, McMahon HT, Ghijsen WEJM, Boomsma F, Scholten G, Wiegant VM, Nicholls DG. Differential release of amino acids, neuropeptides, and catecholamines from isolated nerve terminals. Neuron. 1991;6:517–524. doi: 10.1016/0896-6273(91)90054-4. [DOI] [PubMed] [Google Scholar]
- Wollheim CB, Sharp GWG. Regulation of insulin release by calcium. Physiol Rev. 1981;61:914–973. doi: 10.1152/physrev.1981.61.4.914. [DOI] [PubMed] [Google Scholar]
- Zhou Z, Misler S. Amperometric detection of quantal secretion from patch-clamped rat pancreatic β-cells. J Biol Chem. 1996;270:270–277. doi: 10.1074/jbc.271.1.270. [DOI] [PubMed] [Google Scholar]