

Abstract
Purpose
Little is known about population determinants of short sleep duration. The authors examined associations between short sleep duration and income, education and race/ethnicity, and assessed changes over time in relative disparities.
Methods
Questionnaire data from the Alameda County Health and Ways of Living Study (ACS) was obtained at five time-points (1965, 1974, 1983, 1994, and 1999) for short sleep duration (<7 hours sleep per night). Household income, education level and race/ethnicity were assessed at baseline (n=6928). Odds ratios were computed to examine short sleep duration across income, education and race/ethnicity, adjusting for age, sex and time-varying covariates, and to assess changes over time.
Results
Prevalence of short sleep at baseline was 15.2%.The (age-adjusted) odds of short sleep was increased for the lowest household income quintile (OR = 1.62, 95% CI: 1.34, 1.94), those with less than high school education (OR = 1.51, 95% CI: 1.30, 1.75), and among African Americans (odds ratio (OR) = 1.97, 95% confidence interval (CI): 1.68, 2.30). Relative disparities increased over time for African Americans and Hispanics compared to whites.
Conclusions
Socioeconomic position is a robust determinant of short sleep duration, even after adjusting for health-related characteristics linked to short sleep duration.
MeSH Headings: sleep, sleep deprivation, social class, socioeconomic factors, health behavior
Background
Short sleep duration was first linked to mortality in the scientific literature over 40 years ago(1) in community-based data that indicated an increased mortality risk among those with a usual sleep duration of less than 7 hours per night. Only a few studies in subsequent decades followed up with reports of similar findings between short sleep and mortality (2–4). In the past five years, however, evidence from large-scale cohort studies further supports the link between short sleep and mortality (5–8), in addition to incident diabetes (9), coronary heart disease (10), hypertension (11), obesity and worsening metabolic profiles in the population (12–15). Parallel evidence from experimental studies has provided insights into the physiologic impact of sleep loss on neuroendocrine and metabolic systems (16–19). While the accumulation of epidemiologic and clinical evidence is important for understanding the potential role of short sleep as a population health determinant, little is known about what determines patterns of short sleep duration in the population.
It may be that sleep of sufficient duration for the maintenance of health and well-being has become a luxury in modern society. Average sleep duration among US adults age 18–54 was 6.9 hours per night according to a nationwide poll conducted in 2004, with 16% typically sleeping 6 hours or less, and 40% sleeping 7 hours or less (20). Some have suggested that average sleep duration may have declined in the US during the 20th century as a by-product of increased late-night diversions, such as internet and television, and longer work schedules characteristic of our modern society (21; 22). As with other luxuries that come at the cost of either money or time, sleep may be a resource whose price is beyond the reach of some segments of the population.
Population subgroups which have been described as having shorter average sleep durations include night shift workers, minority race/ethnic groups, those with lower social class ranking and those with fewer years of formal education (5; 7; 23–27). However, as investigating socioeconomic disparities in short sleep was not the primary aim of most of these studies, they did not assess the extent to which socioeconomic disparities in short sleep duration reflected the influence of other individual characteristics that could impact sleep acquisition, such as chronic health conditions, depression, obesity, smoking, alcohol consumption and physical activity. Additionally, studying these factors could provide insights into potentially modifiable mediators in the pathway between low socioeconomic position and short sleep duration.
The purpose of this study was to examine the relationship between short sleep duration and three indicators of social and economic position, household income, highest achieved level of education, and race/ethnic background, using follow-up data collected over 34 years from residents of Alameda County, California. We also examined the relative influence of other health-related characteristics on the relationship between short sleep and income, education and race/ethnicity, and additionally, assessed whether disparities in short sleep increased over time.
Methods
Study design
The Alameda County Health and Ways of Living Study (ACS) was conducted by the Human Population Laboratory in Alameda County, California. The study was implemented in 1965, with a stratified, random sample of the adult, non-institutionalized population of 6,928 adults (86% of eligible respondents) ages 16 to 94 years. Baseline participants were followed regardless of location or disability status and written questionnaires were readministered to all surviving subjects. Corresponding response rate and sample size for each follow-up wave were: 1974 (85%, n = 4,864), 1994 (93%, n = 2,730) and 1999 (95%, n = 2,123), and among the 50% random sample of eligible subjects in 1983 (87%, n = 1,799).
Social and economic predictor variables
Social and economic predictor variables assessed at study baseline were household income, highest achieved level of education and race/ethnicity. While household income was originally reported within categorical intervals, a continuous measure was derived using multiple imputation methods which have been previously described in greater detail (28). Imputed income values were constrained to fall within the range of the reported income intervals and were subsequently adjusted to the Consumer Price Index for 1999. Income at baseline (1965) was grouped into quintiles. The highest achieved level of education was based on years of education reported in 1965, or if a change occurred in the first follow-up interval, updated to 1974 values. Education was then grouped into categories of less than high school (<12 years), high school graduate (12 years), or having at least some post-high school education (>12 years).
Racial/ethnic group membership was self-identified in the ACS questionnaire and categorized as follows: White, African American, Hispanic and Other (consisting of groups too small for separate analyses, including American Indian, Asian, Chinese, Japanese, and Filipino).
Short sleep
In all waves, respondents indicated the number of hours of sleep they usually get at night as 6 hours or less, 7 hours, 8 hours, or 9 hours or more. Sleep duration was dichotomized so that those with usual sleep duration of 6 hours or less were compared to those with 7 or 8 hours of sleep. Those with 9 or more hours of usual sleep duration were excluded from the analysis.
Covariates
Demographics and living conditions. All analyses were adjusted for gender and age at baseline. Other sociodemographic factors included marital status (never married, married, separated, divorced, widowed), home ownership (own versus rent), and household density (number of household members/number of rooms in household).
Chronic conditions and ailments. The presence of chronic conditions and ailments was ascertained by the question ‘have you had any of these [conditions or ailments] during the past 12 months?’ Chronic health conditions included high blood pressure, heart trouble, stroke, chronic bronchitis, asthma, arthritis or rheumatism, diabetes, cancer, and stomach or duodenal ulcer. Physical ailments included frequent leg cramps, pain or tightness in chest, trouble breathing or shortness of breath, swollen ankles, back pain, stomach pain, frequent headaches, constant coughing or frequent chest colds, stiffness, swelling or aching in joints or muscles, and getting tired in a short period of time. Reliability and validity of chronic conditions in this dataset have been previously reported (29; 30).
Health risk factors and behaviors
Smoking status was reported as current, never or former, and total number of cigarettes was computed over all years of reported smoking. The alcohol quantity score was based on monthly frequency and quantity of consuming beer, wine and liquor. A physical activity score was based on frequency of taking part in physical exercise, active sports, and long walks or swimming. Responses for never, sometimes or often (coded as 0, 2 or 4) were summed to generate a continuous score ranging from 0 to 12. Body mass index was calculated as the ratio of weight (kilograms) to height (meters2).
Depression
The measure of depressive symptoms used here was a slight modification of the depression measure used in previous reports from the Alameda County Study (31–34). Since the established 18-item measure of depressive symptoms includes a question about insomnia, one of the covariates in the present analysis, a 17-item depression score was generated in a similar manner as the 18-item score by assigning one point for each ‘often’ or ‘never’ response indicative of a ‘depressed’ response. Chronbach’s alpha coefficients were similar for both 17-item and 18-item scales (α=.75 and α=.77, respectively). The correlation between the 17- and 18-item scales was 0.99.
Insomnia, which was assessed through self-reported difficulty initiating or maintaining sleep, was also included as a covariate in this analysis. Those who indicated “often” for experiencing the complaint were classified as having insomnia.
Statistical methods
Frequency, prevalence and odds ratios for short sleep at baseline (1965) were calculated across categories of each covariate. Due to the repeated nature of the data, a generalized estimating equations (GEE) approach with a logit link was used for parameter estimation and statistical testing of 1) the relative odds of short sleep across income, education and race/ethnic predictor variables, and 2) time-by-predictor interactions indicative of growing socioeconomic disparities in the odds of short sleep. The time variable (year of data collection: 1965, 1974, 1983, 1994 and 1999) was modeled in its more parsimonious form (ordinal) after conducting sensitivity analysis comparing both ordinal and dummy variable forms. An exchangeable correlation structure was deemed suitable after comparing empirical and model-based standard error estimates, which were nearly identical.
Separate models adjusting for time-varying covariates (measured at all five data collection points) that were grouped into six major headings (age, living conditions, current health status, health behaviors and body mass index, depression, and insomnia) were used to assess the relative impact of each group of covariates on the relationship between each socioeconomic predictor and short sleep. Different forms of each covariate (ie, continuous with and without quadratic terms, categorical, and ordinal) were assessed separately in bivariate models, with non-linear forms included in final models where appropriate. Covariates were modeled as grouped into categories shown in Table 1. Results were not altered by the inclusion of an indicator variable for loss to follow-up or death. All analyses were performed using SAS version 9.0.
Table 1.
Stratum-specific frequency, percent, and age-adjusted odds ratios for short sleep duration (≤ 6 hours/night)†: Alameda County Health and Ways of Living Study, 1965
| Frequency | Percent | Odds Ratio | |
|---|---|---|---|
| Gender | |||
| Female | 568 | 15.1 | 1.00 |
| Male | 482 | 15.3 | REF |
| Age Group‡ | |||
| <25 | 117 | 11.5 | REF |
| 25 to 34 | 192 | 13.1 | 1.09 |
| 35 to 44 | 239 | 15.5 | 1.32* |
| 45 to 54 | 194 | 15.4 | 1.33* |
| 55 to 64 | 144 | 17.6 | 1.56* |
| 65+ | 164 | 20.0 | 1.97* |
| Marital Status | |||
| Never married | 120 | 17.2 | 1.53* |
| Married | 676 | 13.1 | REF |
| Separated | 39 | 22.0 | 2.02* |
| Divorced | 89 | 21.9 | 1.77* |
| Widowed | 126 | 26.0 | 1.98* |
| Home Ownership | |||
| Owns | 605 | 14.5 | REF |
| Rents | 438 | 16.1 | 1.25* |
| Household Density (persons/room) | |||
| .5 or less | 308 | 16.8 | REF |
| .51 to .75 | 353 | 13.6 | 0.90 |
| .76 to 1.0 | 175 | 15.7 | 1.17 |
| 1 or greater | 203 | 15.6 | 1.18 |
| Chronic Conditions | |||
| None | 582 | 12.3 | REF |
| One | 259 | 17.8 | 1.50* |
| Two or more | 181 | 27.9 | 2.62* |
| Chronic Ailments | |||
| None | 263 | 9.6 | REF |
| One or two | 365 | 14.7 | 1.62* |
| Three or more | 368 | 25.2 | 3.13* |
| Physical Activity Score | |||
| None | 254 | 22.0 | 1.82* |
| Mid 50% | 378 | 14.9 | 1.16 |
| High 25% | 399 | 12.9 | REF |
| Alcohol Consumption Quantity Score (drinks/mo.) | |||
| Abstainers | 269 | 17.3 | 1.39* |
| 1st quartile (≤ 9) | 207 | 15.5 | 1.25* |
| 2nd quartile (10–16) | 173 | 12.8 | REF |
| 3rd quartile (17–33) | 193 | 14.4 | 1.13 |
| 4th quartile (34 +) | 207 | 15.6 | 1.27* |
| Smoking | |||
| +10 pack-years | N/A | N/A | 1.07* |
| Smoking Status | |||
| Current | 523 | 17.2 | 1.43* |
| Former | 140 | 12.9 | 0.95 |
| Never | 369 | 13.6 | REF |
| Body Mass Index | |||
| 1st quartile | 253 | 14.7 | REF |
| 2nd quartile | 241 | 14.2 | 0.93 |
| 3rd quartile | 255 | 15.0 | 0.94 |
| 4th quartile | 290 | 16.8 | 1.04 |
| Depression Score | |||
| ≥5 points | 244 | 28.9 | 2.79* |
| < 5 points | 714 | 12.9 | REF |
| Frequent Insomnia | |||
| Yes | 290 | 52.3 | 7.54* |
| No | 759 | 11.9 | REF |
p < .05
Those with sleep duration ≥ 9 hours/night (n=576) are excluded from odds ratio contrast, but included in denominator for prevalence (%) calculations.
Odds ratios for age groups are not age-adjusted.
Results
The overall percentage of short sleepers in the baseline, 1965 cohort of the Alameda County Study was 15.2%. Characteristics associated with increased odds of short sleep included older age, non-married status, living in a rented residence, having one or more chronic conditions or ailments, physical inactivity, smoking, abstaining from alcohol consumption, consuming more than one alcoholic drink per day, depression and insomnia (Table 1).
Table 2 presents the results from GEE models describing the relationship between, household income level, highest achieved level of education and race/ethnicity with short sleep, presented as odds ratios computed from six separate models adjusting for groups of risk factors, including age, living conditions, current health status, health behaviors and body mass index, depression, and insomnia. The relative odds of short sleep was higher among those in the lower two income quintiles, in those with less than high school education, and among those of African-American race/ethnicity compared to whites. The increased odds of short sleep associated with the lowest income quintile (odds ratio (OR)=1.62, 95% confidence interval (CI): 1.34, 1.94) was substantially reduced 69% after adjusting for living conditions, race/ethnicity and education, reduced 42% after adjustment for depression, and reduced 31% after adjustment for chronic health conditions. The increased odds of short sleep associated with having less than a high school education (OR=1.51, 95% CI: 1.30, 1.75) was reduced 31–33% in separate models adjusting for living conditions (including race/ethnicity and income), health risk behaviors and depression. For African Americans, the age-adjusted odds ratio for short sleep (OR=1.97, 95% CI: 1.68, 2.30) was reduced 32% after adjusting for household living conditions, income and education, and only marginally reduced (12–13%) after adjustment for chronic health conditions, health risk behaviors and depression. Adjusting for insomnia had no substantial effect on the relative odds of short sleep across income, education and race/ethnic groups.
Table 2.
Odds ratios (95% confidence interval) for short sleep duration across household income quintiles, highest level of education and race/ethnic groups for six separate adjustment models: Alameda County Health and Ways of Living Study, 1965–1999
| frequency (%) in 1965 | Model 1: Age | Model 2: Living Conditions | Model 3: Current Health | Model 4: Behaviors and BMI | Model 5: Depression | Model 6: Insomnia | |
|---|---|---|---|---|---|---|---|
| Household Income (quintiles) | |||||||
| Lowest | 1382 (20.0) | 1.62 (1.34, 1.94) | 1.19 (0.91, 1.37) | 1.43 (1.19, 1.74) | 1.57 (1.30, 1.90) | 1.36 (1.12, 1.66) | 1.54 (1.27, 1.86) |
| 2nd | 1384 (16.0) | 1.31 (1.09, 1.58) | 1.02 (0.84, 1.24) | 1.26 (1.04, 1.52) | 1.35 (1.11, 1.63) | 1.27 (1.05, 1.54) | 1.29 (1.06, 1.56) |
| 3rd | 1379 (13.0) | 1.06 (0.87, 1.28) | 0.86 (0.70, 1.05) | 1.04 (0.86, 1.27) | 1.05 (0.86, 1.27) | 1.02 (0.84, 1.25) | 1.11 (0.91, 1.35) |
| 4th | 1387 (13.5) | 1.06 (0.87, 1.28) | 0.94 (0.77, 1.14) | 1.00 (0.82, 1.21) | 1.06 (0.87, 1.29) | 0.99 (0.81, 1.21) | 1.03 (0.84, 1.26) |
| Highest | 1384 (13.5) | 1.00 | 1.00 | 1.00 | 1.00 | 1.00 | 1.00 |
| Highest Level of Education | |||||||
| < High School | 2396 (18.6) | 1.51 (1.30, 1.75) | 1.34 (1.14, 1.57) | 1.35 (1.16, 1.60) | 1.35 (1.16, 1.58) | 1.35 (1.16, 1.57) | 1.42 (1.22, 1.65) |
| High School | 1989 (13.8) | 1.11 (0.95, 1.29) | 1.12 (0.96, 1.31) | 1.06 (0.91, 1.24) | 1.06 (0.91, 1.24) | 1.08 (0.92, 1.26) | 1.08 (0.93, 1.26) |
| > High School | 2516 (13.0) | 1.00 | 1.00 | 1.00 | 1.00 | 1.00 | 1.00 |
| Race/Ethnicity | |||||||
| Afr.-American | 860 (22.2) . | 1.97 (1.68, 2.30) | 1.66 (1.40, 1.97) | 1.85 (1.57, 2.18) | 1.87 (1.58, 2.20) | 1.86 (1.58, 2.20) | 2.07 (1.77, 2.43) |
| Hispanic | 272 ( 8.1) . | 0.82 (0.60, 1.12) | 0.68 (0.48, 0.94) | 0.83 (0.60, 1.15) | 0.75 (0.54, 1.04) | 0.75 (0.54, 1.05) | 0.84 (0.60, 1.17) |
| Other | 327 (17.1) . | 1.43 (1.11, 1.85) | 1.34 (1.03, 1.74) | 1.46 (1.13, 1.88) | 1.36 (1.04, 1.79) | 1.38 (1.07, 1.79) | 1.53 (1.18, 1.99) |
| White | 5455 (14.3) . | 1.00 | 1.00 | 1.00 | 1.00 | 1.00 | 1.00 |
Model 1 adjusted for age and gender.
Model 2 adjusted for age, gender, marital status, home ownership, household density and the alternate two measures of SEP not included as the main predictor (ie, household income, highest level of education, and race/ethnicity).
Model 3 adjusted for age, gender, chronic conditions and chronic ailments.
Model 4 adjusted for age, gender, physical activity, smoking (status and pack-years), alcohol consumption and body mass index (BMI).
Model 5 adjusted for age, gender and depression score.
Model 6 adjusted for age, gender and insomnia.
Figure 1 displays the results of the longitudinal analysis of short sleep over the five waves of data collection (34-year period) across income quintiles at baseline, highest achieved level of education, and race/ethnic groups. With each successive wave of follow-up, the likelihood of short sleep increased for all groups, with some notable differences with respect to the rate of change. As figure 1c illustrates, African Americans, who were more likely than whites to have short sleep duration at baseline, also experienced a greater increase in the likelihood of short sleep over time. In 1965, the age-adjusted predicted probability of short sleep among African Americans was 26% (95% CI: 23, 29), which doubled to 54% (95% CI: 48, 60) by 1999, while the increase in whites over the same time span was more moderate, from 15% (95% CI: 14, 17) in 1965 to 25% (95% CI: 23, 27) in 1999. Hispanics, in contrast, were slightly less likely than whites to have short sleep duration at baseline in 1965 (12%, 95% CI: 9, 15), but experienced a greater increase over time in the likelihood of short sleep such that by 1999 the predicted probability of short sleep in Hispanics was greater than that of whites (37%, 95% CI: 28, 47). There was no difference across household income quintiles with respect to the change over time in the likelihood of short sleep (figure 1a). Likewise, there was a similar increase over time in the likelihood of short sleep across all education groups (figure 1b). Adjustment for time-varying covariates did not alter the observed patterns of change in short sleep over time (results not shown).
Figure 1.
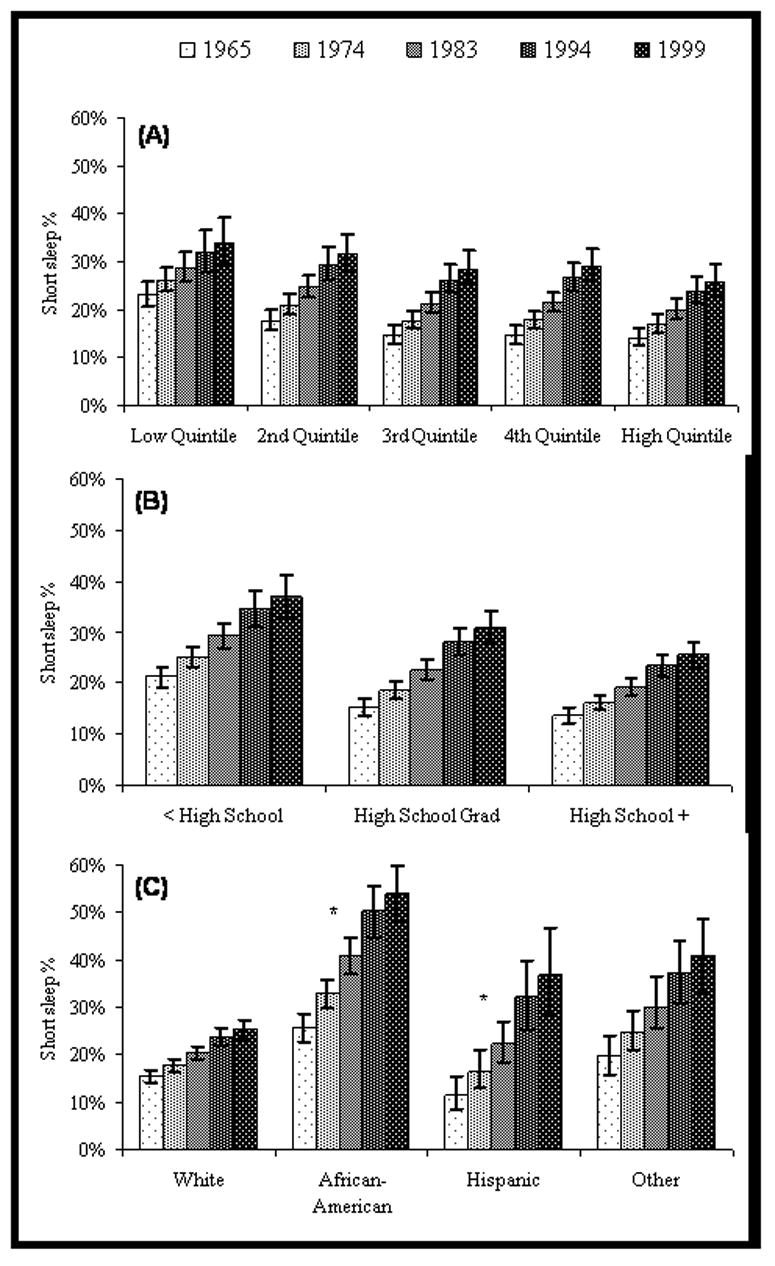
Age-adjusted mean probability of short sleep duration over five waves of follow-up by a) household income quintile, b) education level, and c) race/ethnic group: Alameda County Health and Ways of Living Study, 1965–1999
* Increase over time in the probability of short sleep duration was significantly greater in African Americans (p<.0001) and Hispanics (p<.001) compared to whites.
Conclusions
Income, education and race/ethnicity have been described as indicators of “life chances” and “opportunity” (35; 36) and important for understanding the forces that determine health-promoting resources available to individuals operating in a social context (37; 38). Insofar as sleep is one example of a health promoting resource, these results indicate that the opportunity for sleep of adequate duration may be hindered in low income and education groups, and among those of African-American and Hispanic descent in the US.
The current findings indicate that short sleep duration is more common among those with lower income and education levels, and among minority race/ethnic groups. The strongest potential mediators of short sleep across income, education and race/ethnic groups were living conditions and other markers of socioeconomic position. This was particularly true in the relationship between race/ethnicity and short sleep, which was markedly attenuated only after adjustment for other socioeconomic factors and living conditions, mostly due to the impact of income and education. Adjustment for individual health-related characteristics, such as current health status, health risk behaviors, and depression, appeared to impact the relationships between short sleep and socioeconomic position, but to a lesser extent than mutual adjustment with other living conditions. These findings suggest that individual health related characteristics may partially confound or mediate the relationship between socioeconomic position and short sleep duration, but that the context of socioeconomic disadvantage may play a more important role in determining patterns of short sleep duration across sociodemographic groups than individual health-related characteristics.
Duration of sleep is, in part, a reflection of the hours available for rest in a given 24-hour period, which among the US adult population, is largely determined by work schedule (39). The distinction between groups working long hours, multiple jobs, and night or rotating shifts compared to those with flexible or lighter work schedules may underscore the difference between groups with chronic sleep loss and no opportunity for restitution compared to those who experience occasional sleep loss, which is ubiquitous. A recent study in Japan found that men with lower grade jobs were more likely to have poor sleep quality, a pattern which appeared to be explained by work-related characteristics such as shift work, daily work hours, higher work demands and lower control at work (40). Shift work is a known cause of sleep restriction (41), and is generally more common in occupations that do not require advanced degrees (with some notable exceptions such as the medical professions). In the US, African Americans and Hispanics are more likely to work the night shift and less likely to have flexible work schedules than whites (42; 43). Other daily time pressures leading to sleep curtailment include family demands such as housework and caretaking, responsibilities more likely to impact sleep duration in women (40). In addition, other potential sleep-limiting sources specific to disadvantaged groups may include suboptimal sleep environments with distressing levels of noise, exposure to light, lack of adequate ambient temperature control, non- private sleep quarters, and uncomfortable sleep surfaces. Further studies utilizing both quantitative and qualitative approaches are needed to characterize community, workplace, household, and lifestyle sources of sleep restriction and disturbance specific to various aspects of socioeconomic circumstance.
The current findings also indicate that disparities in short sleep may have increased among African Americans and Hispanics compared to whites over the 34 years of follow-up in this cohort, while the relative disparity across income and education groups did not change over time. The relationships over time were not altered by adjustment for any other time-varying characteristics measured in this study. Furthermore, loss to follow-up or death was higher among minority race/ethnic groups and among short sleepers over the 34-year period (results not reported), which would have the likely result of reducing the observed associations among surviving participants over time. It is possible that minority race/ethnicity may exert stronger age-related impacts on sleep duration than income or education. The distinction in time-related patterns may also have been a function of the difference in stability of our predictors measured at baseline over the course of the follow-up period. That is, race/ethnic identity did not change over time, although household income levels fluctuated over the follow-up period. While the aim of our study was to examine socioeconomic characteristics as predictors of future changes in short sleep and insomnia over time, it may have limited our ability to detect changes over time in relation to income and education.
Although duration of sleep can be best measured directly with polysomnography, usual sleep duration in the habitual setting in large, population-based samples most often relies on self-report. Previous analyses have shown that self-reported short sleep is predictive of mortality in these data (4). In addition, the face-validity of covariates used in the multivariable models was demonstrated by their bivariate relationships with short sleep.
The most common underlying sleep disorders with the potential to impact sleep duration are insomnia and sleep-disordered breathing (SDB). Insomnia, the inability to initiate or maintain sleep, is another potential source of sleep restriction and has been previously found to be related to economic disadvantage (44–49), although not strongly related to race/ethnicity (44; 50; 51). As expected, there was a strong bivariate relationship between insomnia and short sleep in our cohort. However, adjustment for insomnia did not alter the relationship between short sleep and income, education or race/ethnicity. We did not have data on SDB, which has been found to be related to shorter sleep duration (<6 hours) in the Sleep Heart Health Study cohort (Gottlieb 2006). It is possible that secular increases in SDB, a likely outcome of increased obesity rates in the US, could have contributed to disparities in short sleep duration observed in the current study. However, adjustment for body habitus has been found to attenuate race/ethnic differences in SDB (Young 2002). Thus, our adjustment for obesity as a time-varying covariate could have accounted in part for any race/ethnic differences in short sleep duration attributable to SDB.
Clarifying the determinants of population patterns of short sleep duration may provide some insight toward the application of study findings linking short sleep to subsequent morbidity and mortality. That is, if population sleep habits are primarily influenced by other health-related conditions that are more proximal to the outcomes of interest, then the role of short sleep as a directly modifiable causal agent may be weakened. On the other hand, if evidence, like the current findings, suggests that population patterns of sleep duration are also strongly influenced by inequitably distributed features of the social and economic environment, then the potential role of sleep restriction as a source of health inequity and modifiable population health determinant may be strengthened.
Acknowledgments
Supported by the following National Institutes of Health grant awards:
5R37AG011375 - National Institute on Aging
1P50HD038986 – National Institute of Child Health and Development
1R24HD047861 – National Institute of Child Health and Human Development
Footnotes
Publisher's Disclaimer: This is a PDF file of an unedited manuscript that has been accepted for publication. As a service to our customers we are providing this early version of the manuscript. The manuscript will undergo copyediting, typesetting, and review of the resulting proof before it is published in its final citable form. Please note that during the production process errors may be discovered which could affect the content, and all legal disclaimers that apply to the journal pertain.
Reference List
- 1.Hammond EC. Some preliminary findings on physical complaints from a prospective study of 1,064,004 men and women. Am J Public Health Nations Health. 1964;54:11–23. doi: 10.2105/ajph.54.1.11. [DOI] [PMC free article] [PubMed] [Google Scholar]
- 2.Belloc NB. Relationship of health practices and mortality. Prev Med. 1973;2(1):67–81. doi: 10.1016/0091-7435(73)90009-1. [DOI] [PubMed] [Google Scholar]
- 3.Kripke DF, Simons RN, Garfinkel L, Hammond EC. Short and long sleep and sleeping pills. Is increased mortality associated? Arch Gen Psychiatry. 1979;36(1):103–16. doi: 10.1001/archpsyc.1979.01780010109014. [DOI] [PubMed] [Google Scholar]
- 4.Wingard DL, Berkman LF. Mortality risk associated with sleeping patterns among adults. Sleep. 1983;6(2):102–7. doi: 10.1093/sleep/6.2.102. [DOI] [PubMed] [Google Scholar]
- 5.Heslop P, Smith GD, Metcalfe C, Macleod J, Hart C. Sleep duration and mortality: The effect of short or long sleep duration on cardiovascular and all-cause mortality in working men and women. Sleep Med. 2002;3(4):305–14. doi: 10.1016/s1389-9457(02)00016-3. [DOI] [PubMed] [Google Scholar]
- 6.Kripke DF, Garfinkel L, Wingard DL, Klauber MR, Marler MR. Mortality associated with sleep duration and insomnia. Arch Gen Psychiatry. 2002;59:131–6. doi: 10.1001/archpsyc.59.2.131. [DOI] [PubMed] [Google Scholar]
- 7.Patel SR, Ayas NT, Malhotra MR, White DP, Schernhammer ES, Speizer FE, et al. A prospective study of sleep duration and mortality risk in women. Sleep. 2004;27(3):440–444. doi: 10.1093/sleep/27.3.440. [DOI] [PubMed] [Google Scholar]
- 8.Tamakoshi A, Ohno Y. Self-reported sleep duration as a predictor of all-cause mortality: results from the JACC study, Japan. Sleep. 2004;27(1):51–54. [PubMed] [Google Scholar]
- 9.Ayas NT, White DP, Al-Delaimy WK, Manson JE, Stampfer MJ, Speizer FE, et al. A prospective study of self-reported sleep duration and incident diabetes in women. Diabetes Care. 2003;26(2):380–4. doi: 10.2337/diacare.26.2.380. [DOI] [PubMed] [Google Scholar]
- 10.Ayas NT, White DP, Manson JE, Stampfer MJ, Speizer FE, Malhotra A, et al. A prospective study of sleep duration and coronary heart disease in women. Arch Intern Med. 2003;163(2):205–9. doi: 10.1001/archinte.163.2.205. [DOI] [PubMed] [Google Scholar]
- 11.Gangwisch JE, Heymsfield SB, Boden-Albala B, Buijs RM, Kreier F, Pickering TG, et al. Short sleep duration as a risk factor for hypertension: Analyses of the first National Health and Nutrition Examination Survey. Hypertension. 2006;47(5):833–839. doi: 10.1161/01.HYP.0000217362.34748.e0. [DOI] [PubMed] [Google Scholar]
- 12.Gangwisch JE, Malaspina D, Boden-Albala B, Heymsfield SB. Inadequate sleep as a risk factor for obesity: analyses of the NHANES I. Sleep. 2005;28(10):1289–1296. doi: 10.1093/sleep/28.10.1289. [DOI] [PubMed] [Google Scholar]
- 13.Taheri S, Lin L, Austin D, Young T, Mignot E. Short sleep duration is associated with reduced leptin, elevated ghrelin, and increased body mass index. PLoS Med. 2004;1(3):e62. doi: 10.1371/journal.pmed.0010062. [DOI] [PMC free article] [PubMed] [Google Scholar]
- 14.Hasler G, Buysse DJ, Klaghofer R, Gamma A, Ajdacic V, Eich D, et al. The association between short sleep duration and obesity in young adults: a 13-year prospective study. Sleep. 2004;27(4):661–666. doi: 10.1093/sleep/27.4.661. [DOI] [PubMed] [Google Scholar]
- 15.Sekine M, Yamagami T, Handa K, Saito T, Nanri S, Kawaminami K, et al. A dose-response relationship between short sleeping hours and childhood obesity: results of the Toyama Birth Cohort Study. Child Care Health and Development. 2002;28(2):163–170. doi: 10.1046/j.1365-2214.2002.00260.x. [DOI] [PubMed] [Google Scholar]
- 16.Mullington JM, Chan JL, Van Dongen HP, Szuba MP, Samaras J, Price NJ, et al. Sleep loss reduces diurnal rhythm amplitude of leptin in healthy men. J Neuroendocrinol. 2003;15(9):851–4. doi: 10.1046/j.1365-2826.2003.01069.x. [DOI] [PubMed] [Google Scholar]
- 17.Spiegel K, Leproult R, Van Cauter E. Impact of sleep debt on metabolic and endocrine function. The Lancet. 1999;354:1435–39. doi: 10.1016/S0140-6736(99)01376-8. [DOI] [PubMed] [Google Scholar]
- 18.Spiegel K, Leproult R, L'Hermite-Baleriaux M, Copinschi G, Penev PD, Van Cauter E. Leptin levels are dependent on sleep duration: relationships with sympathovagal balance, carbohydrate regulation, cortisol, and thyrotropin. J Clin Endocrinol Metab. 2004;89(11):5762–71. doi: 10.1210/jc.2004-1003. [DOI] [PubMed] [Google Scholar]
- 19.Spiegel K, Tasali E, Penev P, Van Cauter E. Brief communication: Sleep curtailment in healthy young men is associated with decreased leptin levels, elevated ghrelin levels, and increased hunger and appetite. Ann Intern Med. 2004;141(11):846–50. doi: 10.7326/0003-4819-141-11-200412070-00008. [DOI] [PubMed] [Google Scholar]
- 20.National Sleep Foundation. 2005 Sleep in America Poll: Summary Findings. 2005 [Google Scholar]
- 21.Bliwise DL. Historical change in the report of daytime fatigue. Sleep. 1996;19(6):462–4. doi: 10.1093/sleep/19.6.462. [DOI] [PubMed] [Google Scholar]
- 22.Rajaratnam SM, Arendt J. Health in a 24-h society. Lancet. 2001;358(9286):999–1005. doi: 10.1016/S0140-6736(01)06108-6. [DOI] [PubMed] [Google Scholar]
- 23.Akerstedt T, Fredlund P, Gillberg M, Jansson B. Work load and work hours in relation to disturbed sleep and fatigue in a large representative sample. Journal of Psychosomatic Research. 2002;53(1):585–8. doi: 10.1016/s0022-3999(02)00447-6. [DOI] [PubMed] [Google Scholar]
- 24.Drake CL, Roehrs T, Richardson G, Walsh JK, Roth T. Shift work sleep disorder: prevalence and consequences beyond that of symptomatic day workers. Sleep. 2004;27(8):1453–1462. doi: 10.1093/sleep/27.8.1453. [DOI] [PubMed] [Google Scholar]
- 25.Jean-Louis G, Kripke DF, Ancoli-Israel S, Klauber MR, Sepulveda RS. Sleep duration, illumination, and activity patterns in a population sample: effect of gender and ethnicity. Biological Psychology. 2000;47:921–7. doi: 10.1016/s0006-3223(99)00169-9. [DOI] [PubMed] [Google Scholar]
- 26.Spilsbury JC, Storfer-Isser A, Drotar D, Rosen CL, Kirchner LH, Benham H, et al. Sleep behavior in an urban US sample of school-aged children. Arch Pediatr Adolesc Med. 2004;158(10):988–94. doi: 10.1001/archpedi.158.10.988. [DOI] [PubMed] [Google Scholar]
- 27.Ohayon MM, Vecchierini MF. Normative sleep data, cognitive function and daily living activities in older adults in the community. Sleep. 2005;28(8):981–989. [PubMed] [Google Scholar]
- 28.Harper S, Lynch J, Hsu WL, Everson SA, Hillemeier MM, Raghunathan TE, et al. Life course socioeconomic conditions and adult psychosocial functioning. Int J Epidemiol. 2002;31(2):395–403. [PubMed] [Google Scholar]
- 29.Kaplan GA, Kotler PL. Self-reports predictive of mortality from ischemic heart disease: a nine-year follow-up of the Human Population Laboratory cohort. J Chronic Dis. 1985;38(2):195–201. doi: 10.1016/0021-9681(85)90092-x. [DOI] [PubMed] [Google Scholar]
- 30.Meltzer JW, Hochstim JR. Reliability and validity of survey data on physical health. Public Health Rep. 1970;85(12):1075–86. [PMC free article] [PubMed] [Google Scholar]
- 31.Kaplan GA, Roberts RE, Camacho TC, Coyne JC. Psychosocial predictors of depression. Prospective evidence from the human population laboratory studies. Am J Epidemiol. 1987;125(2):206–20. doi: 10.1093/oxfordjournals.aje.a114521. [DOI] [PubMed] [Google Scholar]
- 32.Kaplan GA, Lazarus NB, Cohen RD, Leu DJ. Psychosocial factors in the natural history of physical activity. Am J Prev Med. 1991;7(1):12–7. [PubMed] [Google Scholar]
- 33.Roberts RE, O'Keefe SJ. Sex differences in depression reexamined. J Health Soc Behav. 1981;22(4):394–400. [PubMed] [Google Scholar]
- 34.Roberts RE, Stevenson JM, Breslow L. Symptoms of depression among blacks and whites in an urban community. J Nerv Ment Dis. 1981;169(12):774–779. doi: 10.1097/00005053-198112000-00005. [DOI] [PubMed] [Google Scholar]
- 35.Jones CP. Invited commentary: "race," racism, and the practice of epidemiology. Am J Epidemiol. 2001;154(4):299–304. doi: 10.1093/aje/154.4.299. [DOI] [PubMed] [Google Scholar]
- 36.Lynch J, Kaplan GA. Socioeconomic Position. In: Berkman LF, Kawachi I, editors. Social Epidemiology. New York: Oxford University Press; 2000. pp. 13–35. [Google Scholar]
- 37.Kaufman JS, Cooper RS. Commentary: considerations for use of racial/ethnic classification in etiologic research. Am J Epidemiol. 2001;154(4):291–8. doi: 10.1093/aje/154.4.291. [DOI] [PubMed] [Google Scholar]
- 38.Pearce N, Foliaki S, Sporle A, Cunningham C. Genetics, race, ethnicity, and health. Bmj. 2004;328(7447):1070–2. doi: 10.1136/bmj.328.7447.1070. [DOI] [PMC free article] [PubMed] [Google Scholar]
- 39.Dinges D, Fomberstein K, William J, Banks S. Waking activities associated with reduced sleep time. Sleep. 2006;29:408. [Google Scholar]
- 40.Sekine M, Chandola T, Martikainen P, Marmot M, Kagamimori S. Work and family characteristics as determinants of socioeconomic and sex inequalities in sleep: The Japanese Civil Servants Study. Sleep. 2006;29(2):206–216. doi: 10.1093/sleep/29.2.206. [DOI] [PubMed] [Google Scholar]
- 41.Akerstedt T. Shift work and disturbed sleep/wakefulness. Occup Med (Lond) 2003;53(2):89–94. doi: 10.1093/occmed/kqg046. [DOI] [PubMed] [Google Scholar]
- 42.Bureau of Labor Statistics. Workers on Flexible and Shift Schedules in May 2004. Washington, DC: US Department of Labor; 2005. [Google Scholar]
- 43.Golden L. Flexible Work Schedules: Which workers get them? American Behavioral Scientist. 2001;44(7):1157–1178. [Google Scholar]
- 44.Gellis LA, Lichstein KL, Scarinci IC, Durrence HH, Taylor DJ, Bush AJ, et al. Socioeconomic status and insomnia. J Abnorm Psychol. 2005;114(1):111–8. doi: 10.1037/0021-843X.114.1.111. [DOI] [PubMed] [Google Scholar]
- 45.Geroldi C, Frisoni GB, Rozzini R, De Leo D, Trabucchi M. Principal lifetime occupation and sleep quality in the elderly. Gerontology. 1996;42(3):163–169. doi: 10.1159/000213788. [DOI] [PubMed] [Google Scholar]
- 46.Hunt SM, McEwen J, McKenna SP. Social inequalities and perceived health. Eff Health Care. 1985;2(4):151–160. [PubMed] [Google Scholar]
- 47.Hyyppa MT, Kronholm E, Alanen E. Quality of sleep during economic recession in Finland: a longitudinal cohort study. Soc Sci Med. 1997;45(5):731–8. doi: 10.1016/s0277-9536(96)00407-8. [DOI] [PubMed] [Google Scholar]
- 48.Pallesen S, Nordhus IH, Nielsen GH, Havik OE, Kvale G, Johnsen BH, et al. Prevalence of insomnia in the adult Norwegian population. Sleep. 2001;24(7):771–9. [PubMed] [Google Scholar]
- 49.Phillips B, Mannino DM. Correlates of Sleep Complaints in Adults: the ARIC Study. Journal of Clinical Sleep Medicine. 2005;1(3):277–283. [PubMed] [Google Scholar]
- 50.Paine SJ, Gander PH, Harris R, Reid P. Who reports insomnia? Relationships with age, sex, ethnicity, and socioeconomic deprivation. Sleep. 2004;27(6):1163–9. doi: 10.1093/sleep/27.6.1163. [DOI] [PubMed] [Google Scholar]
- 51.Roberts RE, Shema SJ, Kaplan GA, Strawbridge WJ. Sleep complaints and depression in an aging cohort: a prospective perspective. American Journal of Psychiatry. 2000;157:81–88. doi: 10.1176/ajp.157.1.81. [DOI] [PubMed] [Google Scholar]