Abstract
Context: An estimated 300 000 sport-related traumatic brain injuries, predominantly concussions, occur annually in the United States. Sports are second only to motor vehicle crashes as the leading cause of traumatic brain injury among people aged 15 to 24 years.
Objective: To investigate the epidemiology of concussions in a nationally representative sample of high school athletes and to compare rates of concussion among high school and collegiate athletes.
Design: Descriptive epidemiologic study
Setting: 100 United States high schools and 180 US colleges.
Patients or Other Participants: United States high school and collegiate athletes.
Main Outcome Measure(s): Data from 2 injury surveillance systems, High School Reporting Information Online (RIO) and the National Collegiate Athletic Association Injury Surveillance System, were analyzed to calculate rates, describe patterns, and evaluate potential risk factors for sport-related concussion.
Results: Concussions represented 8.9% (n = 396) of all high school athletic injuries and 5.8% (n = 482) of all collegiate athletic injuries. Among both groups, rates of concussions were highest in the sports of football and soccer. In high school sports played by both sexes, girls sustained a higher rate of concussions, and concussions represented a greater proportion of total injuries than in boys. In all sports, collegiate athletes had higher rates of concussion than high school athletes, but concussions represented a greater proportion of all injuries among high school athletes.
Conclusions: Sport-related injury surveillance systems can provide scientific data to drive targeted injury-prevention projects. Developing effective sport-related concussion preventive measures depends upon increasing our knowledge of concussion rates, patterns, and risk factors.
Keywords: epidemiology, injury surveillance, sex differences, traumatic brain injury
Key Points
Developing effective sport-related concussion preventive measures depends upon increasing our knowledge of concussion rates, patterns, and risk factors.
Contact with another person was the risk factor responsible for most concussions among high school athletes.
In sports played by both sexes, girls sustained more concussions than boys in both high school and college.
Concussion rates were higher among collegiate athletes, but concussions represented a higher proportion of all injuries sustained by high school athletes.
An estimated 300 000 sport-related traumatic brain injuries, predominantly concussions, occur annually in the United States (US).1,2 In fact, for young people ages 15 to 24 years, sports are second only to motor vehicle crashes as the leading cause of traumatic brain injury.1 Studies of high school and collegiate athletes indicating that cumulative effects may result from 3 or more concussive episodes highlight the seriousness of sport-related concussions.3–5 Participation in high school and collegiate sports continues to increase, with more than 7 million high school students participating in 2005–20066 and almost 385 000 collegiate students participating in 2004–2005.7 The number of student-athletes sustaining concussions may similarly increase unless preventive measures continue to progress.
Few authors8,9 have studied sport-related concussion among both high school and collegiate athletes. Investigators using the National Collegiate Athletic Association Injury Surveillance System (NCAA ISS)10 have provided concussion rates for collegiate athletes,8,11 and a study supported by the National Athletic Trainers Association (NATA) provided concussion rates for high school athletes.12 Additional authors have suggested potential sex differences in concussion incidence and recovery.11,13 Moreover, recent research into concussion symptom resolution has resulted in recommendations regarding athletes' return to play after concussion.14,15
However, research into sport-related concussions among high school and collegiate athletes is incomplete. For instance, the association of factors such as sex and level of competition with concussion is still poorly understood. Some authors14,16,17 have shown that the incidence of concussions is higher and recovery time longer for high school athletes compared with their collegiate counterparts. Yet contrary evidence has also been presented, suggesting that the incidence of concussions may be higher at the collegiate level.8,11 Furthermore, most groups14–16 comparing concussion incidence and recovery in high school and collegiate athletes focused primarily on football, with minor consideration given to other male sports or to female sports. No authors to date have evaluated concussion rates for multiple sports among high school and collegiate athletes using directly comparable, nationally representative data.
Our purpose was to investigate the epidemiology of concussions in a nationally representative sample of high school athletes and to compare rates of concussion among high school and collegiate athletes.
METHODS
In the 2005–2006 High School Sports-Related Injury Surveillance Study, Reporting Information Online (RIO), an Internet-based surveillance system, was used to collect injury and exposure data for athletes participating in 9 US high school sports.18–20 The sports of interest were boys' football, soccer, basketball, wrestling, and baseball and girls' soccer, volleyball, basketball, and softball. All high schools with 1 or more NATA-affiliated high school certified athletic trainers (ATs) with a valid e-mail address were invited to participate (n = 4120). Schools with ATs agreeing to participate as data reporters (n = 425) were categorized into 8 sampling strata based on US census geographic regions21 and school size (enrollment ≤1000 or >1000). A simple random sample was then used to select schools from each sampling strata to achieve a nationally representative sample of 100 schools.
Weekly throughout the study period, ATs from participating schools logged onto the High School RIO Web site using a unique study ID number to report athlete-exposure and injury data. Athlete-exposure (A-E) was defined as 1 athlete's participation in a practice or competition. Injury was defined as (1) occurring during an organized high school practice or competition, (2) requiring medical attention by a team AT or a physician, and (3) resulting in restriction of the student-athlete's participation in either practice or competition for 1 or more days. Additionally, for each injury, the AT completed an injury report form that collected data on athlete demographics, where and when the injury occurred, concussion symptoms resolution time, length of time until return to play, injury recurrence, etc. Athletic trainers were able to view, edit, and update previously entered information throughout the study period.
Data from High School RIO were analyzed to assess the rates and patterns of sport-related concussion. The overall rate of injury was calculated as the ratio of injuries per 1000 total A-Es. Injury rates were also calculated as the ratio of practice injuries per 1000 practice exposures and as the ratio of competition injuries per 1000 competition exposures. To calculate national estimates of the number of high school injuries, each reported injury was assigned a sample weight based on the inverse of the probability of the school's selection into the study (based on the total number of US high schools in each of the 8 sampling strata).18 If a school dropped out of the surveillance study, a replacement school from the same sampling stratum was enrolled. Data were analyzed using SPSS software (version 14.0; SPSS Inc, Chicago, IL) and Epi Info (version 6.0; Centers for Disease Control and Prevention, Atlanta, GA). Statistical analyses included calculation of rate ratios (RRs), proportion ratios (PRs), and χ2 tests. All 95% confidence intervals (CIs) not containing 1.0 with P values of less than .05 were considered statistically significant. As an example, PRs were calculated as follows:
 |
The NCAA has maintained the ISS for intercollegiate athletics since 1982. The primary goal of the NCAA ISS is to collect injury and exposure data from a representative sample of NCAA institutions in a variety of sports. Relevant data are then shared with NCAA sport and policy committees for making evidence-based decisions on health and safety issues.10 In 2004, the NCAA converted from a paper-based data collection system to the current Web-based platform. Participation in the NCAA ISS is voluntary and available to all member institutions. The goal of the NCAA ISS is to obtain participation from at least 10% of all schools sponsoring a particular sport, with appropriate representation of Divisions I, II, and III. In 2005–2006, 180 schools participated in ISS data collection for up to 16 sports through their ATs. Each participating school entered data for the sports of its choosing; thus each sport had a different sample size. This sampling scheme attempted to balance the needs of maintaining a representative cross-section of institutions while accommodating the needs of the voluntary participants. The NCAA ISS does not calculate national estimates.
High School RIO was closely modeled after the NCAA ISS. The 2005–2006 data used for analysis in this study represented the first year of High School RIO data collection at the high school level and the second year of Web-based NCAA ISS data collection at the collegiate level. Because High School RIO used the same definitions of injury and exposure as those in the NCAA ISS, the injury rates among high school and collegiate athletes were directly compared. Nationwide Children's Hospital Institutional Review Board approved this study.
RESULTS
Incidence and Rates
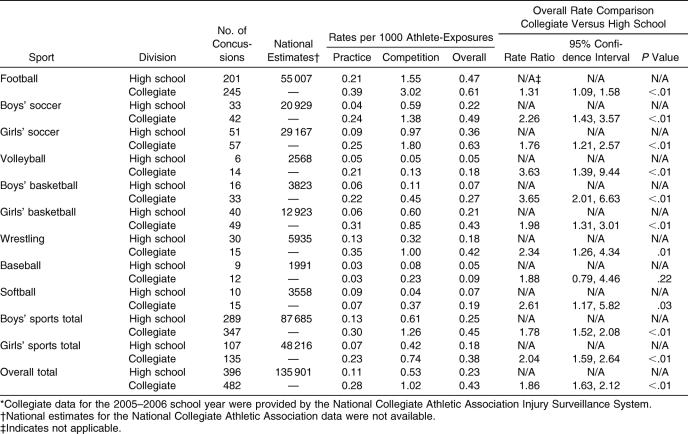
In the 9 high school sports studied over the course of the 2005–2006 school year, 4431 injuries were reported, 396 (8.9%) of which were concussions. This included 137 concussions (34.6%) that occurred in practice and 259 (65.4%) that occurred during competition. These injuries were sustained during the course of 1 730 764 athletic exposures (1 246 499 practice and 484 265 competition exposures), resulting in a concussion injury rate of 0.23 concussions per 1000 A-Es (practice rate = 0.11 concussions per 1000 A-Es, competition rate = 0.53 concussions per 1000 A-Es). The weighted national estimate for the number of concussions sustained in all sports was 135 901. Based on the national estimate, the majority of concussions resulted from participation in football (40.5%, n = 55 007), followed by girls' soccer (21.5%, n = 29 167), boys' soccer (15.4%, n = 20 929), and girls' basketball (9.5%, n = 12 923). The rate of concussion was higher in competition than in practice for all sports except high school girls' softball and volleyball (Table 1). Because only 6 concussions were reported in volleyball, this sport will not be discussed in detail below.
Table 1. Concussion Rates Among US High School and Collegiate* Athletes, High School Sports-Related Injury Surveillance Study and National Collegiate Athletic Association Injury Surveillance System, United States, 2005–2006 School Year.
Symptoms and Return to Play
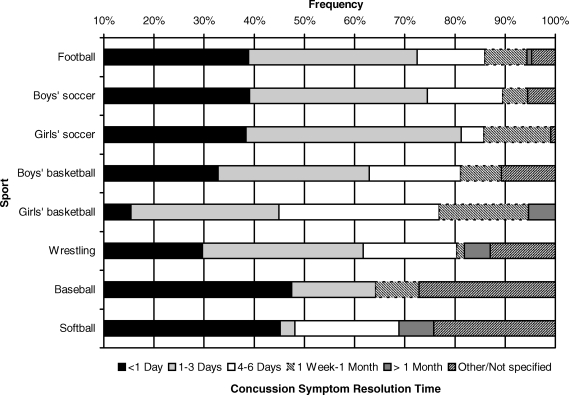
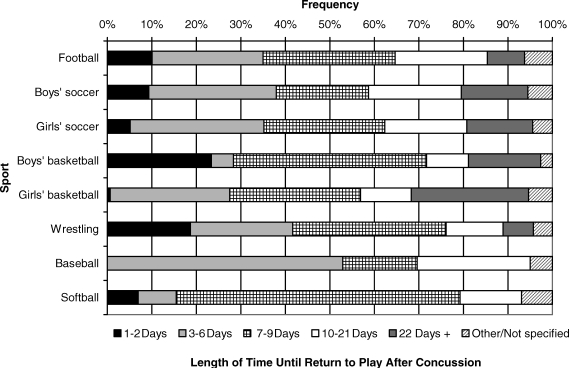
Among high school athletes, the most commonly reported concussion symptom was headache (40.1%, n = 54 494), followed by dizziness (15.3%, n = 20 743), and confusion (8.6%, n = 11 752). Other symptoms included loss of consciousness (3.9%, n = 5302) and amnesia (6.4%, n = 8679). Overall, 16.8% (n = 22 873) of high school athletes suffering a concussion had previously suffered a sport-related concussion, either that season or in a previous season; more than 20% of concussions in boys' and girls' soccer and basketball were recurrent concussions. In more than 50% of athletes in sports other than girls' basketball and softball, concussion symptoms resolved in 3 days or less (Figure 1). More than 50% of athletes in every sport returned to play in 9 days or less (Figure 2).
Figure 1. National estimates of concussion symptom resolution time for high school athletes, High School Sports-Related Injury Surveillance Study, United States, 2005–2006 school year.
Figure 2. National estimates of length of time until return to play after concussion for high school athletes, High School Sports-Related Injury Surveillance Study, United States, 2005–2006 school year.
Risk Factors in High School Athletes by Sport
Football
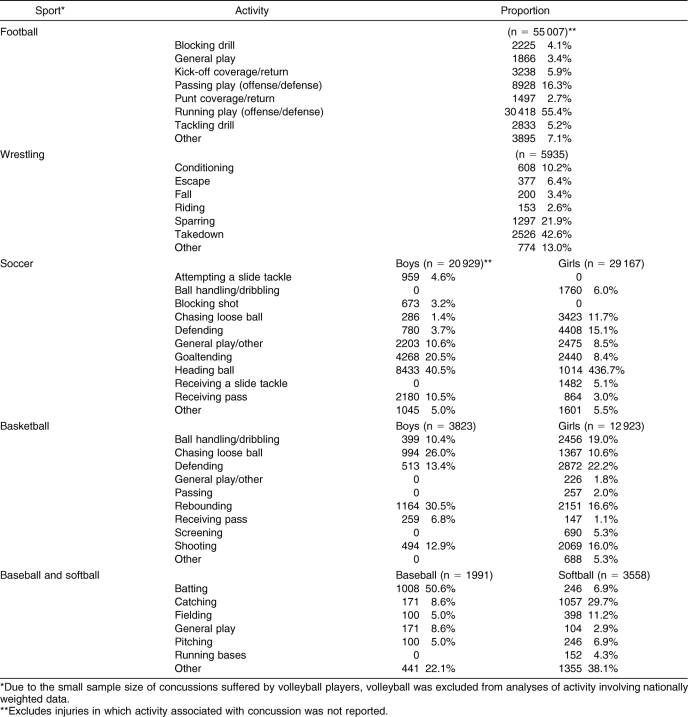
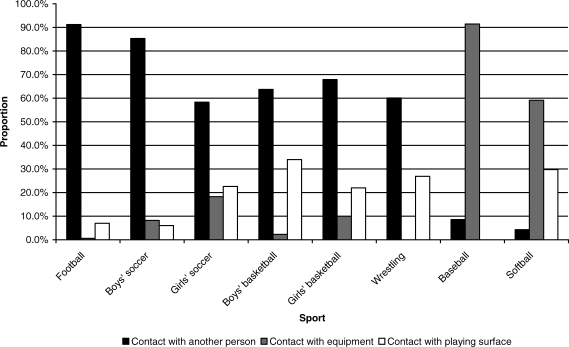
The highest proportion of concussion injuries occurred during running plays (Table 2) and resulted from contact with another person (Figure 3). More specifically, tackling and being tackled were responsible for 67.6% (n = 37 113) of the concussions in football. Linebackers suffered 40.9% (n = 9464) of all concussions among defensive players, and concussions represented a higher proportion of their total injuries (13.1%, n = 9464) than for all other defensive positions combined (10.8%, n = 13 649) (PR = 1.21, 95% CI = 1.18, 1.24, P < .01). Running backs sustained 29.4% (n = 6785) of concussions suffered by players in offensive positions. However, no significant differences by offensive positions existed.
Table 2. National Estimates of Activity Associated With Concussion Injury by Sport, High School Sports-Related Injury Surveillance Study, United States, 2005–2006 School Year.
Figure 3. National estimates of the mechanism of concussion by sport for high school athletes, High School Sports-Related Injury Surveillance Study, United States, 2005–2006 school year.
High School Soccer
Girls had a higher rate of concussion (0.36 concussions per 1000 A-Es) than boys (0.22 concussions per 1000 A-Es) (RR = 1.68, 95% CI = 1.08, 2.60, P = .03) (Table 1), and concussions represented a greater proportion of total injuries among girls (15.1%, n = 29 167) than boys (9.4%, n = 20 929) (PR = 1.61, 95% CI = 1.59, 1.64, P < .01). The risk factors for concussion in soccer differed significantly by sex. Among both boys' and girls' soccer players, the activity most frequently associated with concussions was heading the ball (40.5%, n = 8433, and 36.7%, n = 10 714, respectively) (Table 2). Additionally, 64.1% (19 147) of injuries sustained while heading the ball were concussions. Contact with another person resulted in a greater proportion of concussions in boys (85.3%, n = 17 857) than in girls (58.3%, n = 17 008) (PR = 1.46, 95% CI = 1.45, 1.48, P < .01) (Figure 3). However, contact with the ground (22.6%, n = 6588, and 6.0%, n = 1253, respectively) (PR = 3.77, 95% CI = 3.56, 4.00, P < .01) and contact with the soccer ball (18.3%, n = 5350, and 8.2%, n = 1716, respectively) (PR = 3.68, 95% CI = 3.45, 3.92, P < .01) were related to a significantly greater proportion of concussions in girls than in boys. Another risk factor associated with concussions was goaltending, with 21.7% (n = 8116) of injuries to goalkeepers being concussions, compared with 11.1% (n = 41 878) of injuries to other positions (PR = 1.96, 95% CI = 1.92, 2.00, P < .01).
High School Basketball
Girls had a higher rate of concussion (0.21 concussions per 1000 A-Es) than boys (0.07 concussions per 1000 A-Es) (RR = 2.93, 95% CI = 1.64, 5.24, P < .01) (Table 1), and concussions represented a greater portion of total injuries among girls (11.7%, n = 12 923) (PR = 3.09, 95% CI = 2.98, 3.20, P < .01) than boys (3.8%, n = 3823). Boys had a quicker symptom resolution and return to play than girls (Figures 1 and 2). This was particularly true for student-athletes returning after 1 to 2 days postconcussion (PR = 38.21, 95% CI = 30.44, 47.96, P < .01).
Among girls, a greater proportion of concussions than all other injuries were sustained while defending (16.8%, n = 2872) compared with other plays (10.8%, n = 10 051) (PR = 1.56, 95% CI = 1.50, 1.62, P < .01). With regard to specific activities within basketball, girls sustained a greater proportion of concussions while ball handling/dribbling (19.0%, n = 2456) (PR = 1.83, 95% CI = 1.65, 2.02, P = .01) and while defending (22.2%, n = 2872) (PR = 1.66, 95% CI = 1.52, 1.81, P < .01) than boys (10.4%, n = 399, and 13.4%, n = 513, respectively) (Table 2). Conversely, boys sustained a greater proportion of concussions while chasing loose balls (26.0%, n = 994) (PR = 2.46, 95% CI = 2.28, 2.64, P < .01) and rebounding (30.5%, n = 1164) (PR = 1.83, 95% CI = 1.72, 1.95, P < .01) than girls (10.6%, n = 1367, and 16.6%, n = 2151, respectively) (Table 2). A larger proportion of boys (34.0%, n = 1299) than girls (22.0%, n = 2850) received a concussion due to contact with the playing surface (PR = 1.54, 95% CI = 1.46, 1.63, P < .01) (Figure 3). A small proportion of girls (6.0%, n = 769) and no boys reported a concussion resulting from contact with the ball.
High School Wrestling
In wrestling, takedowns were responsible for 42.6% (n = 2526) of the concussions (Table 2) and were more likely to lead to a concussion (7.6%, n = 2526) than other wrestling activities (4.5%, n = 3409) (PR = 1.69, 95% CI = 1.61, 1.78, P < .01). Additionally, 60.1% (n = 3565) of wrestling concussions were from contact with another person and 26.9% (n = 1597) of wrestling injuries from contact with the playing surface (13.0%, n = 773, were unknown) (Figure 3).
High School Baseball and Softball
Softball players (0.07 concussions per 1000 A-Es) and baseball players (0.05 concussions per 1000 A-Es) experienced a similar rate of concussion (RR = 1.48, 95% CI = 0.60, 3.63, P = .53) (Table 1). However, concussions represented a significantly greater proportion of total injuries in softball players (5.5%, n = 3558) than in baseball players (2.9%, n = 1991) (PR = 1.91, 95% CI = 1.81, 2.01, P < .01). A greater proportion of baseball players had concussions resulting from contact with the ball (91.4%, n = 1820) (PR = 1.55, 95% CI = 1.50, 1.59, P < .01) than softball players (59.1%, n = 2102) (Figure 3). Furthermore, a larger proportion of concussions among baseball players (50.6%, n = 1008) could be attributed to being hit by a pitch (PR = 7.32, 95% CI = 6.44, 8.32, P < .01) than among softball players (6.9%, n = 246). After 6 days or fewer, symptoms were resolved in a slightly greater proportion of softball players (68.8%, n = 2449) than baseball players (64.2%, n = 1279) (PR = 1.07, 95% CI = 1.03, 1.11, P < .01) (Figure 1). However, a greater proportion of baseball players returned to play within 6 days (52.9%, n = 1053) than softball players (15.5%, n = 550) (PR = 3.42, 95% CI = 3.13, 3.73, P < .01) (Figure 2).
Comparison of High School and Collegiate Athletes
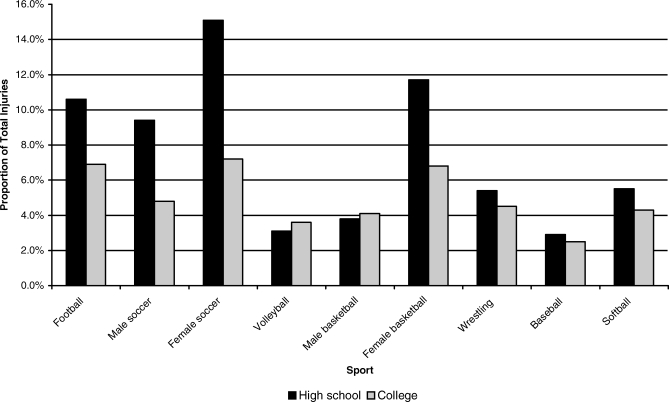
In the 2005–2006 school year, for the 9 college sports corresponding to those studied in High School RIO, a total of 8293 injuries were reported, including 482 (5.8%) concussions. In general, the overall rate of concussion was higher in the collegiate sports than their high school counterparts, although the difference was not significant in baseball (Table 1). With the exception of high school baseball and softball players, collegiate concussion rates were higher than high school rates in both competition and practice. Conversely, concussions comprised a greater proportion of total injuries sustained by high school athletes than by collegiate athletes in all sports except volleyball and men's basketball (Figure 4).
Figure 4. Concussions as a percentage of total injuries sustained by high school and collegiate athletes, High School Sports-Related Injury Surveillance Study and National Collegiate Athletic Association Injury Surveillance System, United States, 2005–2006 school year.
DISCUSSION
As participation in high school sports continues to increase, ATs will continue to be heavily relied upon to diagnose and treat concussions. Sport-related injury surveillance systems can provide the scientific data needed to calculate injury rates, monitor patterns of injury, and identify risk factors. For example, our data demonstrated differences in sport-related concussion among sports and between the sexes and levels of play (ie, high school versus collegiate). By identifying patterns that could predict concussions, we may be able to reduce concussion rates through targeted, evidence-based interventions.
In our study, concussions represented 8.9% of all high school sport-related injuries. This amount is higher than the 5.5% reported by authors12 of a study of high school athletes conducted a decade ago using similar definitions of injury and exposure and the 7.5% reported in authors of a more recent North Carolina study who included all concussions regardless of time loss.9 One potential explanation is that the prior research included sports not included in our study, such as girls' field hockey12 and track and field,9 which have relatively low concussion rates. However, the higher concussion rate reported here may reflect an increased awareness of, and subsequent diagnosis and treatment of, concussions.22 Educational campaigns, such as the distribution of the “Heads Up: Concussion in High School Sports” tool kit by the Centers for Disease Control and Prevention, National Center for Injury Prevention and Control,23 have increased awareness of concussion symptoms among coaches, athletes, and parents. In general, contact with another person appears to be the risk factor responsible for most of the concussions among high school athletes (Figure 3). Full-contact sports (eg, football and wrestling) as well as partial-contact sports (eg, soccer and basketball) had the highest competition-related rates of concussion.
In sports both sexes played in, high school girls had higher rates of concussion than boys. This trend, which was also seen among college athletes (Table 1), has been noted previously.11,12 In our study, sex differences in risk factors for concussion were also noted. In soccer, contact with the ground or with the ball was a more frequent cause of concussion in girls than boys (Table 2). Comparing baseball and softball, boys were more likely than girls to sustain a concussion after being hit by a pitch, a finding possibly attributable to the different pitching styles and balls. In soccer, more boys suffered concussions goaltending, whereas more girls sustained concussions defending. In basketball, more boys sustained concussions while rebounding and chasing loose balls, whereas more girls sustained concussions defending and ball handling. Such differences may be attributable to differences in the style of play.
One possible explanation for the observed sex differences in concussion rates is biomechanical differences. Barnes et al24 suggested that differences in concussion symptoms between male and female soccer players may be due to smaller head to ball ratios or weaker necks. Queen et al25 demonstrated that in children, an increased head mass resulted in decreased linear acceleration of the head. In a study of collegiate soccer players,26 females had 26% less total mass in their head and neck than males. In another recent study,27 females demonstrated greater angular acceleration and displacement of the head and neck. This movement was despite the earlier activity of the sternocleidomastoid muscle in females, which should have acted to stabilize and decrease acceleration and movement of the head.27 Although this acceleration may not play as great a role in soccer players, who learn to resist such forces with the head in practice and competition,26 tests using accelerative forces large enough to observe sex differences in soccer players have not yet been performed.26 Nevertheless, head and neck acceleration differences between the sexes may play a role in other sports.
Cultural explanations may also play a role in the observed sex differences in concussion rates. Traditionally, US society has tended to be more protective of female athletes.28 This may lead coaches, ATs, and parents to treat head injuries in female athletes more seriously or to delay their return to play. Similar cultural tendencies may encourage male athletes to play despite injuries or to avoid reporting injuries, particularly in certain sports. Thus, some boys suffering from head injuries may not report their symptoms for fear of being removed from play.29 A reluctance to report injury was demonstrated in high school football players30: only 47.3% of players claiming to have suffered a concussion reported their injury. Underestimating the seriousness of the injury, not wanting to be withdrawn from competition, and not being aware of having suffered a concussion have been cited as reasons for underreporting concussion injury.30
We found that although rates of concussion were higher among collegiate athletes, concussions represented a higher proportion of all injuries sustained by high school athletes. This finding is contrary to the work of several authors,16,17 who reported that rates of concussions were higher among high school athletes than collegiate athletes. The potential for more playing time, lower-quality protective equipment, and lower skill level were suggested as reasons why a higher rate of concussion might be expected among high school athletes.16 Conversely, collegiate athletes play at a faster, more competitive level and are bigger and stronger than high school athletes,11 which some argue may increase the former's risk of concussion. The truth likely lies somewhere in between, and it may be that a lower level of skill leads to a higher proportion of concussions compared with other injuries at the high school level. Furthermore, greater intensity of play at the collegiate level may predispose those athletes to a higher rate of concussion, as well as increase the rate of other injuries and lower the proportion of all injuries that are concussions. Recently, however, only small differences were noted between head impact in high school and collegiate football players.31 Thus, the higher rates of concussion at the collegiate level may stem from the intensity of play leading to a greater number of impacts rather than greater force of impact.
This study, like all studies, had limitations. Eligibility was limited to high schools with NATA-affiliated ATs. Thus, although schools were selected to be nationally representative with respect to geographic location and school size, our findings may not be generalizable to schools without an AT. However, the increased quality of data provided by these medically trained reporters justified this inclusion criterion. Another potential limitation was our definition of injury. Only time-loss injuries that came to the attention of the school's AT were included in the study. In addition, low-grade concussions that were not accurately diagnosed and concussions that did not keep the athlete out of play for at least 1 day were not captured. Therefore, concussion rates among high school athletes are likely actually higher than those reported here. Another potential limitation was the definition of an A-E as 1 athlete's participation in a practice or competition, rather than the more precise approach based on the minutes an athlete was exposed.32 This definition was necessitated by our use of ATs as reporters because it was not possible for high school ATs to be simultaneously present at all athletic practices and competitions to collect such detailed exposure data. Additionally, our definitions of injury and A-E mirrored the definitions used in the NCAA ISS, which enabled us to directly compare concussion rates among high school and collegiate athletes. Finally, although we used a weighting factor to estimate national numbers of high school concussion injuries, we were unable to apply weighting factors to the standard error when calculating confidence intervals and P values because the NCAA ISS values were not based on national averages.
The rates of concussion among high school and collegiate athletes shown in this study are higher than those previously reported.8,11,12 Competition-related concussion rates were highest among full-contact sports (football and wrestling) and partial-contact sports in which player-to-player contact often occurs (ie, soccer and basketball). We found the rates of concussions among high school athletes were lower than those among collegiate athletes, whereas concussions comprised a greater proportion of total injuries among high school athletes. Additionally, for sports both sexes played, the rate of concussion as well as the proportion of all injuries attributable to concussions was higher among females. With an estimated 135 901 concussions occurring nationally among high school athletes participating in these 9 sports during the 2005–2006 academic year, we must attempt to identify methods for preventing these serious sports injuries.
Although the risk of sport-related concussion does not outweigh the many benefits of sport participation, preventive interventions should be implemented to decrease concussion rates to the lowest possible levels. Development of effective sport-related concussion preventive measures depends upon increasing our knowledge of concussion rates, patterns, and risk factors. Future studies are needed to further investigate potential interventions such as educational programs,23 improved protective equipment, increased conditioning, enhanced enforcement of sporting rules, and policy changes33 that might prevent concussions at both the high school and collegiate levels. For example, while enhanced officiating and rule changes may reduce sex differences in concussion rates by addressing differences in style of play, improved protective gear may need to account for biomechanical differences. Additionally, improved concussion management driven by a better understanding of concussion symptoms and symptom resolution time may reduce the long-term sequelae of concussions. We support current guidelines regarding concussion diagnosis, treatment, and athletes' return to play, but additional research is necessary to determine the validity of self-reported symptoms29 and symptom resolution as viable determinants of return to play. Furthermore, because no consensus as to the effects of multiple concussions exists,3–5 we believe caution should be exercised when clearing athletes with multiple concussions to return to play. Such caution may be especially pertinent to high school athletes who suffered concussions and then continue to play in college.
Acknowledgments
We acknowledge Rosemary Schmalz, PhD, from the National Collegiate Athletic Association (NCAA) Injury Surveillance System, for aiding in the analysis of collegiate concussions. The lead author was funded by the Samuel J. Roessler Scholarship from the Landacre Honor Society at The Ohio State University. This research was funded by the Centers for Disease Control and Prevention (CDC) grant #R49/CEOOO674-01. The content of this report is solely the responsibility of the authors and does not necessarily represent the official view of the CDC or the NCAA.
REFERENCES
- Sosin DM, Sniezek JE, Thurman DJ. Incidence of mild and moderate brain injury in the United States, 1991. Brain Inj. 1996;10:47–54. doi: 10.1080/026990596124719. [DOI] [PubMed] [Google Scholar]
- Centers for Disease Control and Prevention (CDC). Sports-related recurrent brain injuries—United States. MMWR Morb Mortal Wkly Rep. 1997;46:224–227. [PubMed] [Google Scholar]
- Collins MW, Lovell MR, Iverson GL, Cantu RC, Maroon JC, Field M. Cumulative effects of concussion in high school athletes. Neurosurgery. 2002;51:1175–1181. doi: 10.1097/00006123-200211000-00011. [DOI] [PubMed] [Google Scholar]
- Guskiewicz KM, McCrea M, Marshall SW. Cumulative effects associated with recurrent concussion in collegiate football players: the NCAA Concussion Study. JAMA. 2003;290:2549–2555. doi: 10.1001/jama.290.19.2549. et al. [DOI] [PubMed] [Google Scholar]
- Iverson GL, Brooks BL, Lovell MR, Collins MW. No cumulative effects for one or two previous concussions. Br J Sports Med. 2006;40:72–75. doi: 10.1136/bjsm.2005.020651. [DOI] [PMC free article] [PubMed] [Google Scholar]
- Participation in high school sports increases again; confirms NFHS commitment to stronger leadership. National Federation of State High School Associations. Available at: http://www.nfhs.org/web/2006/09/participation_in_high_school_sports_increases_again_confirms_nf.aspx. Accessed March 23, 2007.
- 1981–82–2004–05 NCAA sports sponsorship and participation rates report. National Collegiate Athletic Association. Available at: http://www.ncaa.org/ library/research/participation_rates/1982-2005/1982_2005_participation_rates.pdf. Accessed March 27, 2007.
- Covassin T, Swanik CB, Sachs ML. Epidemiological considerations of concussions among intercollegiate athletes. Appl Neuropsychol. 2003;10:12–22. doi: 10.1207/S15324826AN1001_3. [DOI] [PubMed] [Google Scholar]
- Schulz MR, Marshall SW, Mueller FO. Incidence and risk factors for concussion in high school athletes, North Carolina, 1996–1999. Am J Epidemiol. 2004;160:937–944. doi: 10.1093/aje/kwh304. et al. [DOI] [PubMed] [Google Scholar]
- NCAA Injury Surveillance System (ISS). National Collegiate Athletic Association. Available at: http://www1.ncaa.org/membership/ed_outreach/health-safety/iss/index.html. Accessed March 19, 2007.
- Covassin T, Swanik CB, Sachs ML. Sex differences and the incidence of concussions among collegiate athletes. J Athl Train. 2003;38:238–244. [PMC free article] [PubMed] [Google Scholar]
- Powell JW, Barber-Foss KD. Traumatic brain injury in high school athletes. JAMA. 1999;282:958–963. doi: 10.1001/jama.282.10.958. [DOI] [PubMed] [Google Scholar]
- Broshek DK, Kaushik T, Freeman JR, Erlanger D, Webbe F, Barth JT. Sex differences in outcome following sports-related concussion. J Neurosurg. 2005;102:856–863. doi: 10.3171/jns.2005.102.5.0856. [DOI] [PubMed] [Google Scholar]
- Field M, Collins MW, Lovell MR, Maroon J. Does age play a role in recovery from sports-related concussion? A comparison of high school and collegiate athletes. J Pediatr. 2003;142:546–553. doi: 10.1067/mpd.2003.190. [DOI] [PubMed] [Google Scholar]
- McClincy MP, Lovell MR, Pardini J, Collins MW, Spore MK. Recovery from sports concussion in high school and collegiate athletes. Brain Inj. 2006;20:33–39. doi: 10.1080/02699050500309817. [DOI] [PubMed] [Google Scholar]
- Guskiewicz KM, Weaver NL, Padua DA, Garrett WE., Jr. Epidemiology of concussion in collegiate and high school football players. Am J Sports Med. 2000;28:643–650. doi: 10.1177/03635465000280050401. [DOI] [PubMed] [Google Scholar]
- Theye F, Mueller KA. “Heads up”: concussions in high school sports. Clin Med Res. 2004;2:165–171. doi: 10.3121/cmr.2.3.165. [DOI] [PMC free article] [PubMed] [Google Scholar]
- Centers for Disease Control and Prevention (CDC). Sports-related injuries among high school athletes—United States, 2005–06 school year. MMWR Morb Mortal Wkly Rep. 2006;55:1037–1040. [PubMed] [Google Scholar]
- Shankar PR, Fields SK, Collins CL, Dick RW, Comstock RD. Epidemiology of high school and collegiate football injuries in the United States, 2005–2006. Am J Sports Med. 2007;35:1295–1303. doi: 10.1177/0363546507299745. [DOI] [PubMed] [Google Scholar]
- Nelson AJ, Collins CL, Yard EE, Fields SK, Comstock RD. Ankle injuries among US high school sports athletes, 2005–2006. J Athl Train. 2007; 42:381–387. [PMC free article] [PubMed]
- Census Regions of the United States. US Census Bureau. Available at: http://www.census.gov/const/regionmap.pdf. Accessed March 23, 2007.
- Guskiewicz KM, Bruce SL, Cantu RC. Research based recommendations on management of sport related concussion: summary of the National Athletic Trainers' Association position statement. Br J Sports Med. 2006;40:6–10. doi: 10.1136/bjsm.2005.021683. et al. [DOI] [PMC free article] [PubMed] [Google Scholar]
- Free CDC Tool Kit on Concussion for High School Coaches. Centers for Disease Control, National Center for Injury Prevention and Control. Available at: http://www.cdc.gov/ncipc/tbi/Coaches_Tool_Kit.htm. Accessed March 27, 2007.
- Barnes BC, Cooper L, Kirkendall DT, McDermott TP, Jordan BD, Garrett WE., Jr. Concussion history in elite male and female soccer players. Am J Sports Med. 1998;26:433–438. doi: 10.1177/03635465980260031601. [DOI] [PubMed] [Google Scholar]
- Queen RM, Weinhold PS, Kirkendall DT, Yu B. Theoretical study of the effect of ball properties on impact force in soccer heading. Med Sci Sports Exerc. 2003;35:2069–2076. doi: 10.1249/01.MSS.0000099081.20125.A5. [DOI] [PubMed] [Google Scholar]
- Mansell J, Tierney RT, Sitler MR, Swanik KA, Stearne D. Resistance training and head-neck segment dynamic stabilization in male and female collegiate soccer players. J Athl Train. 2005;40:310–319. [PMC free article] [PubMed] [Google Scholar]
- Tierney RT, Sitler MR, Swanik CB, Swanik KA, Higgins M, Torg J. Gender differences in head-neck segment dynamic stabilization during head acceleration. Med Sci Sports Exerc. 2005;37:272–279. doi: 10.1249/01.mss.0000152734.47516.aa. [DOI] [PubMed] [Google Scholar]
- Vertinsky PA. The Eternally Wounded Woman: Women, Doctors, and Exercise in the Late Nineteenth Century. Urbana, IL: University of Illinois Press; 1994:1–7.
- Lovell MR, Collins MW, Maroon JC. Inaccuracy of symptom reporting following concussion in athletes [abstract] Med Sci Sports Exerc. 2002;34:S298. et al. (suppl 1) [Google Scholar]
- McCrea M, Hammeke T, Olsen G, Leo P, Guskiewicz K. Unreported concussion in high school football players: implications for prevention. Clin J Sport Med. 2004;14:13–17. doi: 10.1097/00042752-200401000-00003. [DOI] [PubMed] [Google Scholar]
- High school football players sustain nearly same head impact forces as collegiate players. American Orthopaedic Society for Sports Medicine. Available at: http://www.sportsmed.org/sml/document.asp?did=302. Accessed March 13, 2007.
- Fuller CW, Ekstrand J, Junge A. Consensus statement on injury definitions and data collection procedures in studies of football (soccer) injuries. Clin J Sport Med. 2006;16:97–106. doi: 10.1097/00042752-200603000-00003. et al. [DOI] [PubMed] [Google Scholar]
- McIntosh AS, McCrory P. Preventing head and neck injury. Br J Sports Med. 2005;39:314–318. doi: 10.1136/bjsm.2005.018200. [DOI] [PMC free article] [PubMed] [Google Scholar]


