

Abstract
Cysteine-rich domains (Cys-domains) are ∼50–amino acid–long protein domains that complex two zinc ions and include a consensus sequence with six cysteine and two histidine residues. In vitro studies have shown that Cys-domains from several protein kinase C (PKC) isoforms and a number of other signaling proteins bind lipid membranes in the presence of diacylglycerol or phorbol ester. Here we examine the second messenger functions of diacylglycerol in living cells by monitoring the membrane translocation of the green fluorescent protein (GFP)-tagged first Cys-domain of PKC-γ (Cys1–GFP). Strikingly, stimulation of G-protein or tyrosine kinase–coupled receptors induced a transient translocation of cytosolic Cys1–GFP to the plasma membrane. The plasma membrane translocation was mimicked by addition of the diacylglycerol analogue DiC8 or the phorbol ester, phorbol myristate acetate (PMA). Photobleaching recovery studies showed that PMA nearly immobilized Cys1–GFP in the membrane, whereas DiC8 left Cys1–GFP diffusible within the membrane. Addition of a smaller and more hydrophilic phorbol ester, phorbol dibuterate (PDBu), localized Cys1–GFP preferentially to the plasma and nuclear membranes. This selective membrane localization was lost in the presence of arachidonic acid. GFP-tagged Cys1Cys2-domains and full-length PKC-γ also translocated from the cytosol to the plasma membrane in response to receptor or PMA stimuli, whereas significant plasma membrane translocation of Cys2–GFP was only observed in response to PMA addition. These studies introduce GFP-tagged Cys-domains as fluorescent diacylglycerol indicators and show that in living cells the individual Cys-domains can trigger a diacylglycerol or phorbol ester–mediated translocation of proteins to selective lipid membranes.
Cystein-rich domains (Cys-domains)1 are ∼50– amino acid–long lipid interaction domains that bind two Zn2+ atoms and share the consensus motif His X12 Cys X2 Cys X13 (14) Cys X2 Cys X4 His X2 Cys X7 Cys, referred to as the Cys6His2 motif (reviewed in Nishizuka 1988; Newton, 1995; Quest, 1996). Such Cys6His2 motifs are duplicated as a tandem domain in conventional protein kinase C isoforms (cPKC) and novel PKCs (nPKC) and are present as a single copy in atypical PKCs (aPKC; Nishizuka 1992). The same Cys6His2 motif has been identified in various other proteins involved in signal transduction processes such as chimaerin, Unc-13, DAG-kinase, Vav, Raf, and others (Ghosh et al., 1994; Gulbins et al., 1994; Kazanietz et al., 1995).
Cys-domains of cPKC and nPKC have been identified as intracellular phorbol ester receptors that require phospholipid as cofactors for activation (Ono et al., 1989). It has also been shown that the binding of phorbol ester to PKC can be competed by diacylglycerol, suggesting that Cys-domains can bind diacylglycerol generated in response to receptor activation (Castagna et al., 1982; Hannun et al., 1985). Therefore, it is likely that a main activation mechanism for PKC and other proteins with phorbol ester–sensitive Cys-domains (e.g., Unc-13 and chimaerin) is based on the binding of Cys-domains to membrane-bound diacylglycerol. Such a membrane translocation mechanism mediated by Cys-domains is also supported by the finding that receptor stimulation leads to the translocation of PKC from a soluble to an insoluble fraction (Ogawa et al. 1981).
Since the binding of Cys-domains to liposomes is dependent not only on the presence of diacylglycerol but also its phospholipid composition (Quest and Bell, 1994), it is suggestive to propose that a particular cellular membrane is a target for Cys-domains if diacylglycerol is produced within this same membrane and if the lipid composition of this membrane is suitable for high affinity binding. Thus, Cys-domains could be selectively targeted to different intracellular membranes by signal transduction pathways that locally produce diacylglycerol. Such a local production of diacylglycerol has been suggested from cell fractionation studies that showed that diacylglycerol can be produced preferentially in the plasma membrane, internal membranes or in the nucleus (Martin et al., 1990; Divecha et al., 1991; Nishizuka, 1992; Mazzotti, 1995). In addition, the targeting of Cys-domains could also be regulated by changes in the local lipid composition of membranes. For example, this could be achieved by increasing or decreasing the local charge density, since in vitro studies showed that Cys-domains preferentially bind reconstituted liposomes with negative charges (Quest and Bell, 1994).
The activity of PKC has been shown to be regulated not only by diacylglycerol but also by free fatty acids, ceramide, and other lipid messengers. Although different studies showed a role for ceramide in PKC regulation, it is likely that ceramide regulates PKC by an indirect mechanism (Jones and Murray, 1995; Venable et al., 1996; Abousalham et al., 1997). Cis-unsaturated fatty acids, such as arachidonic, oleic, linoleic, linolenic, and stearic acids, have also been shown in vivo and in vitro to regulate PKC activity. These effects of free fatty acids are likely the result of an indirect change in the membrane lipid environment (Khan et al., 1991, 1995; Yoshida et al., 1992; Nakamura and Nishizuka, 1994).
These considerations raise several fundamental questions: (a) Can GFP-tagged Cys-domains be used as fluorescent indicators to study receptor-mediated increases in the second messenger diacylglycerol? (b) Are individual Cys-domains sufficient for receptor-mediated membrane translocation of proteins in vivo? (c) Which intracellular membranes can be targeted by Cys-domains? (d) Do ceramide and free fatty acids regulate Cys-domain translocation? (e) And are Cys-domains targeted to the same intracellular membranes in response to receptor-stimulation when compared with the addition of phorbol ester or diacylglycerol analogues?
Here we address these questions by tagging the first Cys-domains from PKC-γ with green fluorescent proteins (Cys1–GFP) and expressing the fusion construct in a rat basophilic leukemia (RBL) model cell line by RNA transfection. We found that the activation of IgE- or platelet activation factor (PAF) receptors, which stimulate PLC-γ1 and PLC-β, respectively, both induce a transient translocation of individual Cys-domains from the cytosol to the plasma membrane. Extracellular addition of phorbol 12-myristate 13-acetate (PMA) or a short chain diacylglycerol analogue (DiC8) mimicked the receptor-mediated targeting to the plasma membrane. Photobleaching recovery studies showed that Cys-domains were immobilized within the membrane after addition of PMA. In contrast, Cys- domains readily diffused in the plasma membrane and were reversible bound in the presence of diacylglycerol. Interestingly, addition of phorbol dibuterate (PDBu), a smaller and less hydrophobic analogue of PMA, resulted in the translocation of Cys-domains preferentially to nuclear, as well as plasma membrane, suggesting that nuclear and plasma membranes can serve as selective targets for proteins with this type of Cys-domain. While ceramide had no significant effect on Cys-domains, addition of arachidonic acid led to the binding of Cys1–GFP to different internal membranes and suppressed the diacylglycerol- mediated translocation to the plasma membrane. A comparison of the GFP-tagged first Cys-domain to the GFP-tagged second Cys-domains, Cys1Cys2 tandem domains and full-length PKC-γ proteins showed that the latter three constructs translocate to the plasma membrane after PMA addition. However, while the first Cys-domain, tandem Cys-domain, or full-length PKC also translocated to the plasma membrane after receptor-stimulation, the same stimuli led to only a minimal or no plasma membrane translocation of the GFP-tagged second Cys-domain. When combined with the results of previous in vitro measurements of Cys-domain binding to lipid membranes, these in vivo studies give new insights into the subcellular signaling functions of diacylglycerol.
Materials and Methods
Cloning and In Vitro Transcription of GFP Fusion Constructs
The GFP tag used in this study was cycle3–GFP, a GFP mutant that has been shown to undergo minimal self-aggregation (Crameri et al., 1996) and minimal nonspecific binding interactions in the cytosol of mammalian cells (Yokoe and Meyer, 1996). An additional Ser65Thr mutation was introduced in cycle3 GFP to increase its brightness (Heim and Tsien, 1996; Subramanian and Meyer, 1997). The resulting pSHiro3 vector was obtained from pHiro1 vector by introducing a S65T mutation and the KpnI cloning site. This GFP variant is an ideal fusion tag for measurements of the cellular dynamics of signaling domains since it combines enhanced fluorescence emission with minimal unspecific binding interactions.
The first Cys-domain of PKC-γ was amplified by PCR using the Cys1Cys2–glutathione S transferase (GST) construct cloned in pGEX2T vector as a template (Quest and Bell, 1994). The resulting construct contained the amino acids 26–89 of PKC-γ and was cloned in the ApaI site of the pSHiro3 vector (Yokoe and Meyer, 1996), at the NH2 terminus of GFP. The second Cys-domain was amplified using PKC-γ pww40 plasmid as a template. The resulting construct contained the amino acids 98–154 cloned in the KpnI site of pSHiro3, at the NH2 terminus of GFP. The full-length PKC-γ and the Cys1Cys2-domain were also PCR amplified and cloned into the KpnI site of pSHiro3, at the NH2- terminal of GFP. The proline mutant first Cys-domain was obtained by using a 5′ oligonucleotide in which the Pro46 was mutated to Gly. This primer was used together with a corresponding 3′ oligonucleotide, by using the first Cys- domain previously cloned in the pSHiro3 vector as a template. The PCR product was cloned into the pSHiro3 vector at the ApaI site. The orientation of the Cys-domains and PKC-γ and the integrity of the reading frame were verified by restriction analysis and sequencing of the GFP fusion constructs.
In vitro transcription and RNA processing of the different constructs were performed according to the procedure described by Yokoe and Meyer (1996). In brief, the GFP fusion constructs cloned in pSHiro3 were linearized after the 3′ UTR with EcoRI, and in vitro transcription was performed with SP6 RNA polymerase using a mMESSAGE mMACHINE commercial kit (Ambion, Austin, TX) according to the manufacturer's protocol. The reaction was terminated by addition of 10 mM EDTA, and the RNA was purified by an RNeasy column (Qiagen Inc., Chatsworth, CA). Polyadenylation (addition of a poly(A) tail) was carried out at 37°C for 30 min in a 50-μl reaction mixture containing 40 mM Tris-HCl, pH 8.0, 10 mM MgCl2, 2.5 mM MnCl2, 250 mM NaCl, 0.25 mg/ml RNA, 250 mM ATP, and 5 units poly(A) polymerase (Life Technologies, Inc., Gaithersburg, MD). 20 mM EDTA was used to terminate this reaction, and the polyadenylated mRNA was purified using an RNeasy column. The eluent (purified mRNA) was dried and dissolved at 1 μg/μl in electroporation buffer (5 mM KCl, 125 mM NaCl, 20 mM Hepes, pH 7.4, 1.5 mM MgCl2, and 10 mM glucose).
The radiolabeled protein used for SDS-PAGE analysis as well as liposome binding assays was obtained from an in vitro translation reaction to which [35S]Met was added. A commercial kit was used for the reaction (Promega Corp., Madison, WI). After the reaction was terminated, the unincorporated [35S]Met was removed by using a QuickSpin Sephadex G-50 column (Boehringer Mannheim Corp., Indianapolis, IN).
Liposome Binding of [35S]Met-labeled Proteins
Solutions of 500 μg/ml total lipid concentration were prepared by drying the chloroform solutions with phosphatidylserine or phosphatidilserine and phosphatidylcholine mix (1:4 ratio) in a stream of N2. The lipid pellet was resuspended in water and sonicated three times in a bath sonicator for 15 s with intermittent cooling on ice. The prepared liposomes were stored on ice and used within 2 h. In a typical assay, 20 μl of liposomes were mixed with 20 μl of protein (containing ∼10,000 counts/min of [35S]Met), 10 μl of 1 mg/ml BSA, and 0 or 1 μl of 100 μM PDBu in DMSO. The reaction mixture was incubated for 30 min at room temperature and subsequently centrifuged at 500,000 g (Beckman TL-100 Ultracentrifuge; Beckman Instruments, Inc., Fullerton, CA) and 4°C for 15 min. The resulting pellet was resuspended in 100 μl Tris-EDTA buffer (pH 7.5) with 1% Triton X-100. The percentage of radiolabeled protein contained in the lipid pellet was quantified in a scintillation counter. The number of counts in each of the reactions in the presence or absence of PDBu were plotted as the percentage of the initial number of counts in the reaction mixture.
Cell Culturing and RNA Transfection
Rat basophilic leukemia 2H3 cells (a tumor mast cell line) were grown in DME with 20% fetal bovine serum (GIBCO BRL, Gaithersburg, MD), 1 mM l-glutamine and 5% penicillin/streptomycin at 37°C and 5% CO2. Cells were harvested and plated on glass coverslips at least 5 h before each experiment. Coverslips were washed three times with an extracellular buffer (5 mM KCl, 125 mM NaCl, 20 mM Hepes, pH 7.4, 1.5 mM CaCl2, 1.5 mM MgCl2, and 10 mM glucose). All added substances were dissolved or diluted in the same buffer. PMA, PDBu, and DAG were dissolved in DMSO and diluted to the final concentration with extracellular buffer shortly before the experiment (during the experiments the cells were not exposed to DMSO or ethanol concentrations higher than 1%). Free fatty acids were dissolved in ethanol. Oleic acid was neutralized in ethanol with NaOH to a pH of 7.0 and further diluted to appropriate concentrations in extracellular buffer (Khan et al., 1991).
The mRNA encoding GFP-tagged Cys-domains or full-length PKC-γ were electroporated into adherent cells at least 3 h before experiments using a 1-μl vol electroporation device for adherent cells (Teruel and Meyer, 1997). Electroporation was performed at 340 V/cm using three rectangular voltage pulses, each 30 ms long and 20 s apart. After electroporation the cells were placed in serum containing medium and left for 3–12 h at 37°C and 5% CO2.
Confocal Microscopy and Photobleaching
Fluorescence confocal microscopy was used to monitor the translocation of GFP-fusion constructs in response to different stimuli. The cells expressing GFP fusion proteins were imaged using a 488-nm laser line for excitation and a 515-nm-long pass filter for emission. Midsections of the cells are shown in all images. Time series of images were recorded before and after stimulation of cells. The bleach rate for each series of images was calculated and used to correct the fluorescent intensities of images. For the photobleaching experiments, a second 488-nm argon ion laser was focused to a small spot within the plane imaged by the confocal microscope. A short (typically 8 ms) pulse of this second laser was used to locally photobleach GFP (Subramanian and Meyer, 1997).
Diffusion and Dissociation Analysis by Fluorescence Photobleaching Recovery
The apparent membrane dissociation times and diffusion coefficients of Cys1–GFP were obtained from an analysis in which a small spot in the plasma membrane was photobleached using a Gaussian-shaped focused laser pulse. The subsequent change in the amplitude and radius of the one-dimensional Gaussian plasma membrane profile was monitored over time by capturing serial confocal images. The simultaneous loss in bleached Cys1–GFP and widening of the Gaussian beam profile was fit by the function:
 |
1 |
where B 0 is the initial fraction of bleached Cys1–GFP at the center of the spot; x 0 is the radius of the initial bleach spot; D is the lateral diffusion coefficient in the plasma membrane and τ is the membrane dissociation time constant.
This analysis assumed an initial Gaussian shape of the bleach profile. It was also assumed that all Cys-domains have a single bound state, that they are in an equilibrium between a plasma membrane–bound form and a cytosolic form, and that they can either diffuse laterally in the plasma membrane or dissociate away from the membrane into the cytosol. The diffusion in the z-direction within the membrane was not considered since it was assumed that a similar fraction of GFP is photobleached above and below the recorded image plane by the local bleach pulse. In combination, these simplified assumptions are likely to introduce errors into the analysis. Therefore, the interpretation of the results of this analysis was based mostly on the relative differences of the apparent diffusion coefficients and dissociation time constants and not on their absolute values.
The images from the photobleaching experiments were analyzed in several steps, first by using NIH Image software to obtain one-dimensional line scans of the plasma membrane fluorescence intensity profiles. In a second step, the fluorescent traces were corrected for the continuous photobleaching due to the imaging (typically 0.2% per image) and for the fraction of total cellular fluorescence that was photobleached by the local pulse (typically 5%). In a third step, Eq. 1 was used to simultaneously fit all the Gaussian profiles from a series of images. The fit parameters for D and τ were then averaged for several separate experiments. The average values and standard errors for D and τ were then determined.
The diffusion analysis in the cytosol (see Fig. 6) was based on fitting two-dimensional Gaussian distribution to sequential images before and after local photobleaching. This analysis was described earlier for the diffusion of GFP mutants in the cytosol (Yokoe and Meyer, 1996; Subramanian and Meyer, 1997).
Figure 6.

Plasma membrane translocation of Cys1-domains in the presence of ceramide and free fatty acids. (A) Cys1–GFP translocated to the plasma membrane in response to the addition of phorbol ester and diacylglycerol analogues, but not in response to the addition of ceramide or free fatty acids. The ability of DiC8 (100 μg/ml), PMA (1 μM), ceramide-C8 (10 μM), oleic acid (100 μM), and arachidonic acid (100 μM) to induce plasma membrane translocation was determined by recording confocal fluorescence images immediately before and 4 min after stimulation. The relative increase in plasma membrane fluorescence intensity was determined as described in Fig. 2 B. Only DAG and PMA were able to induce a significant relative increase in the plasma membrane fluorescence of Cys1–GFP. (B) Arachidonic acid prevented the DiC8-mediated translocation of Cys1–GFP to the plasma membrane. The same concentrations of the analogues were used as in A. Ceramide or free fatty acids were added to RBL cells expressing Cys1–GFP 5 min before the addition of 100 μg/ml of DiC8. The relative increase in the plasma membrane fluorescence intensity was again calculated as described in Fig. 2 B. Arachidonic acid significantly decreased the DiC8-induced plasma membrane localization of Cys1–GFP. (C) Fluorescence images of RBL cells treated with arachidonic acid and diacylglycerol. A series of images of RBL cells expressing Cys1–GFP were recorded before stimulation (left), 5 min after addition of arachidonic acid (100 μM; middle), and 5 min after adding DiC8 (100 μg/ml; right) to the arachidonic acid treated cells. The distribution of Cys1– GFP was markedly punctuate after arachidonic acid addition. The subsequent addition of DiC8 induced only minimal plasma membrane translocation but instead enhanced the particulate staining in the cytosol. (D) Diffusion analysis of cytosolic Cys1– GFP by photobleaching recovery experiments. A short laser pulse (8 ms) and sequential imaging were used for the analysis of cytosolic Cys–GFP diffusion (0.033 s between images). Two- dimensional Gaussian fits of the bleach profiles were used for the analysis (Subramanian and Meyer, 1997). The relative increase in the square radius is graphed as a function of time. As for the one-dimensional analysis, the diffusion coefficient is proportional to the slope of this curve.
Results
GFP-tagged First Cys-Domains of PKC-γ Expressed in RBL Cells by RNA Transfection
The conventional isoforms of PKC: PKC-α, PKC-β1, PKC-β2, and PKC-γ (cPKCs), each contain two Cys-domains in their regulatory region (Fig. 1 A). For PKC-γ, previous in vitro studies have shown that fusion constructs of glutathione S transferase (GST) with either the first or second Cys-domain bind to lipid vesicles in the presence of phorbol ester (i.e., Quest and Bell, 1994). To investigate the functions of diacylglycerol and phorbol ester in intact cells, we tagged the first Cys-domain of PKC-γ with GFP. In vitro translation showed that the protein encoded by the construct (Cys1–GFP) has the expected molecular mass (Fig. 1 B) and can bind to lipid vesicles in the presence of phorbol ester (Fig. 1 C). When a conserved proline residue within the Cys-domain (Pro 46) was replaced by a glycine residue (mCys1–GFP), the Cys-domain showed a markedly reduced ability to bind lipid vesicles in the presence of phorbol ester (Fig. 1 C). Such an important function of the conserved proline residue in phorbol ester binding has been predicted by a sequence comparison of all Cys-domains that bind phorbol ester in vitro (Kazanietz et al., 1994).
Figure 1.
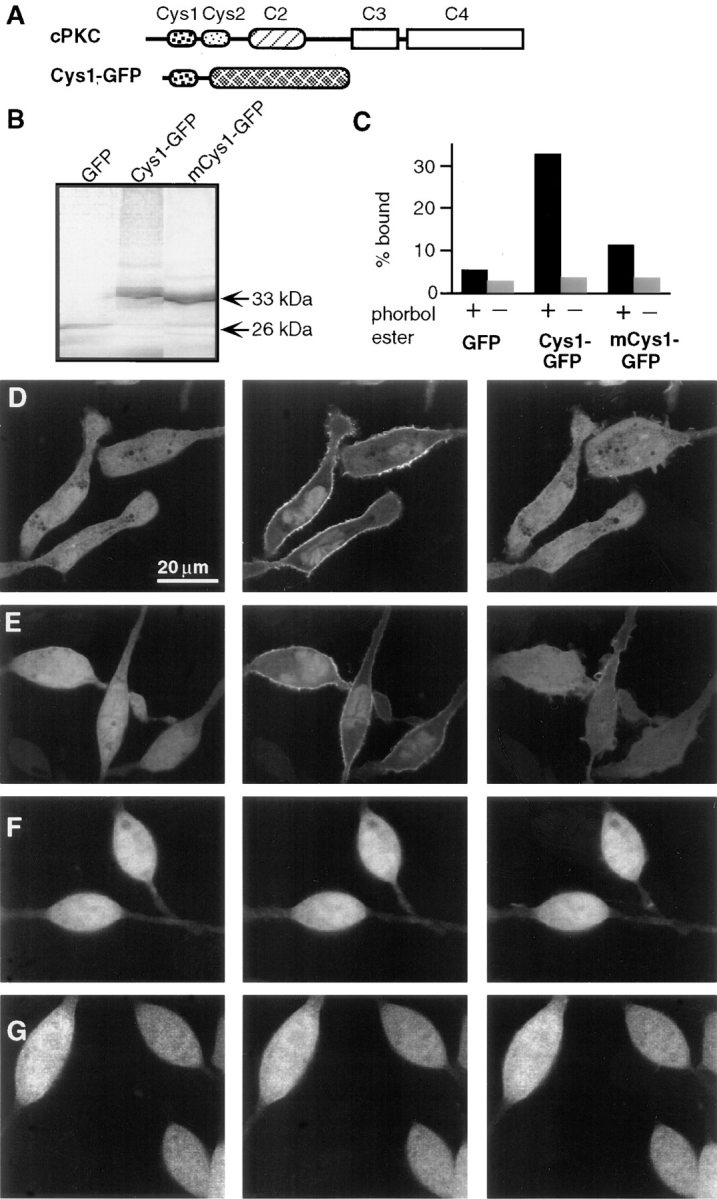
Receptor-mediated plasma membrane translocation of the GFP-tagged first Cys-domain from PKC-γ. (A) Schematic representation of the domain composition of conventional PKC and of the Cys1–GFP fusion construct used in the experiments. The Cys1–GFP construct consists of the first cysteine-rich domains of PKC-γ tagged with GFP at its COOH-terminal end. The protein was expressed in adherent RBL cells by microporation of in vitro transcribed RNA. After 3–12 h, cells were imaged using confocal fluorescence microscopy. (B) SDS-PAGE of expressed protein after in vitro translation of DNA encoding GFP, Cys1–GFP, and a Cys1GFP with a Pro 46 to Ala mutation (mCys1–GFP). (C) Binding of [35S]Met-labeled fusion protein to lipid vesicles in the presence or absence of the phorbol ester PDBu. The same labeled proteins as in B were used for the liposome binding assay. The amplitude of each bar represents an average of two samples from the same experiment with the number of counts in the vesicle fraction expressed as a percentage of total counts added (% bound). Two separate experiments with phosphatidylserine vesicles and one experiment with a phosphatidylserine/phosphatidylcholine mixture (1:4 ratio of lipids) gave similar results. (D) Series of three images of cells expressing RNA transfected Cys1–GFP. The images were taken immediately before and 90 s and 5 min after cross-linking of the IgE receptors by addition of 20 μg/ml DNP-BSA. Images were corrected by an average photobleaching rate. (E) The same translocation of the Cys1–GFP probe was observed in cells with stable transfected PAF receptors and activated with PAF (100 nM). The images shown were recorded immediately before, 60 s and 5 min after stimulation (images were not corrected for photobleaching). (F and G) No significant enhancement of the plasma membrane fluorescence was observed when cells expressing mCys1–GFP (F) or GFP alone (G) were stimulated with 100 nM PAF. The three images shown were recorded at the same time points before and after stimulation as those in D.
Cys1–GFP (Fig. 1, D and E), mCys1–GFP (Fig. 1 F), or GFP alone (Fig. 1 G) were expressed in RBL cells by transfection of in vitro transcribed and polyadenylated mRNA using a microporation device (Yokoe and Meyer, 1996; Teruel and Meyer, 1997). Measurements of the translocation of GFP-tagged Cys-domains were typically made within 3–12 h after RNA transfection.
Receptor-mediated Transient Translocation of Cys1–GFP from the Cytosol to the Plasma Membrane
When expressed in unstimulated cells, Cys1–GFP appeared homogeneously distributed across the cytosol and nucleus (Fig. 1, D and E, left column). To test the response to cell stimulation, two alternative receptor pathways were used to activate either PLC-γ or PLC-β. Cross-linking of the IgE receptors (FcεRI) in RBL cells by addition of DNP-BSA (Fig. 1 D) has been shown to activate PLC-γ1 (Schneider et al., 1992), whereas stimulation through transfected PAF receptor (Fig. 1 E) has been shown to activate PLC-β (Ali et al., 1995). In response to both receptor stimuli, Cys1–GFP translocated from the cytosol to the plasma membrane within <1 min (the middle images were taken after 1 min) and dissociated from the membrane after several minutes (the right images were taken after 5 min). The striking dynamics of this transient translocation process can be more clearly visualized in a movie of DNP-BSA–stimulated RBL cells (the movie can be viewed at http://note.cellbio.duke.edu/Faculty/∼Meyer/PKC ). As can be seen in Fig. 1, D and E (middle column), a variable smaller fraction of the Cys1–GFP did not participate in the translocation process but remained localized in the nucleoplasm and to a lesser extent in the cytoplasm.
When the same two stimulation protocols were applied to cells expressing the proline-mutated Cys1–GFP or GFP alone, no significant changes in the localization of mCys1– GFP and GFP could be observed (Fig. 1, F and G show the response to PAF activation). This suggests that the plasma membrane translocation of Cys1–GFP is likely mediated by the phorbol ester binding site of the Cys-domain.
Overall, these results demonstrate that an individual Cys-domain can act as a plasma membrane–targeting module in response to stimuli that activate either PLC-β or PLC-γ. In addition, these results show that the Cys- domain lacking the conserved proline residue is largely ineffective as a translocation module.
To determine the time course of the transient translocation of the Cys-domain to the plasma membrane more quantitatively, time series of confocal fluorescence images of cells expressing Cys1–GFP domains were recorded before and after receptor stimulation (Fig. 2 A). The relative change in the plasma membrane fluorescence intensity was determined in each image using line intensity profiles across each one of the cells (Fig. 2 B). The relative increase in the plasma membrane versus the cytosolic fluorescence intensity was calculated by measuring the amplitude of the fluorescence signal at the plasma membrane and dividing it by the average intracellular fluorescence intensity (I mb − I cyt)/I cyt. Fig. 2 C shows the average intensity ratio for each time point as a function of time. The time course for translocation significantly varied between cells, and a few cells did not exhibit a measurable translocation. This variability between cells is reminiscent of the cell-to-cell variability observed for IgE receptor–mediated calcium signaling (i.e., Millard et al., 1988).
Figure 2.

Comparison of the time course of plasma membrane translocation of Cys1–GFP in response to activation of IgE or PAF receptors. (A) Sequential images of RBL cells expressing Cys1–GFP taken immediately before and 40, 80, and 200 s after cross-linking of the IgE receptors with 20 μg/ml DNP-BSA. The images shown were not corrected for photobleaching. (B) For each cell in a given image, a line intensity profile across the cell was obtained. Typical intensity profiles are shown at each of the four time points. (C) Schematic representation of the method used to calculate a relative increase in plasma membrane staining. A relative increase in plasma membrane localization was calculated from the plasma membrane [I mb] and the average cytosolic fluorescence intensity [I cyt], respectively. (D) The plasma membrane translocation was represented as a relative increase in plasma membrane localization [R] and plotted as a function of time. The antigen or the PAF ligand were added at t = 0 s. The resulting curves represent the time course of plasma membrane translocation of Cys1–GFP in response to IgE receptor cross-linking and PAF receptor activation, respectively.
Whereas the activation of both receptor types induced a near uniform association of Cys1–GFP with the plasma membrane, the time course of translocation differed depending on whether cells were stimulated by activating IgE or PAF receptors. The beginning of Cys1–GFP translocation was typically delayed by 30 s after IgE receptor activation but started immediately after PAF receptor activation. The same difference in the delay time between PAF and IgE receptor–induced activation is also observed for the induction of calcium spikes after activation of the two receptors (data not shown). Taken together, these observations are consistent with the hypothesis that the initial membrane translocation of Cys1–GFP is mediated by the phospholipase C–mediated production of diacylglycerol.
PMA and DiC8 Mimic the Receptor-induced Plasma Membrane Translocation of Cys-Domains
As discussed in the introduction, PMA can potently activate cPKCs by directly binding to their Cys-domains. Therefore, we tested the effect of PMA on expressed Cys1–GFP. In response to extracellular addition of PMA, Cys1–GFP translocated from the cytosol to the plasma membrane (Fig. 3 A). The left panel in this figure shows a differential interference contrast (DIC) image of a group of RBL cells, the middle panel shows a confocal fluorescence image of the initially homogenous distribution of Cys1–GFP and the right panel shows the plasma membrane distribution of Cys1–GFP 5 min after PMA addition. As a control for the specificity of PMA-induced plasma membrane translocation, the addition of the bioinactive 4α isomer of PMA, instead of the bioactive 4β isomer, did not translocate Cys1–GFP to the plasma membrane (data not shown).
Figure 3.
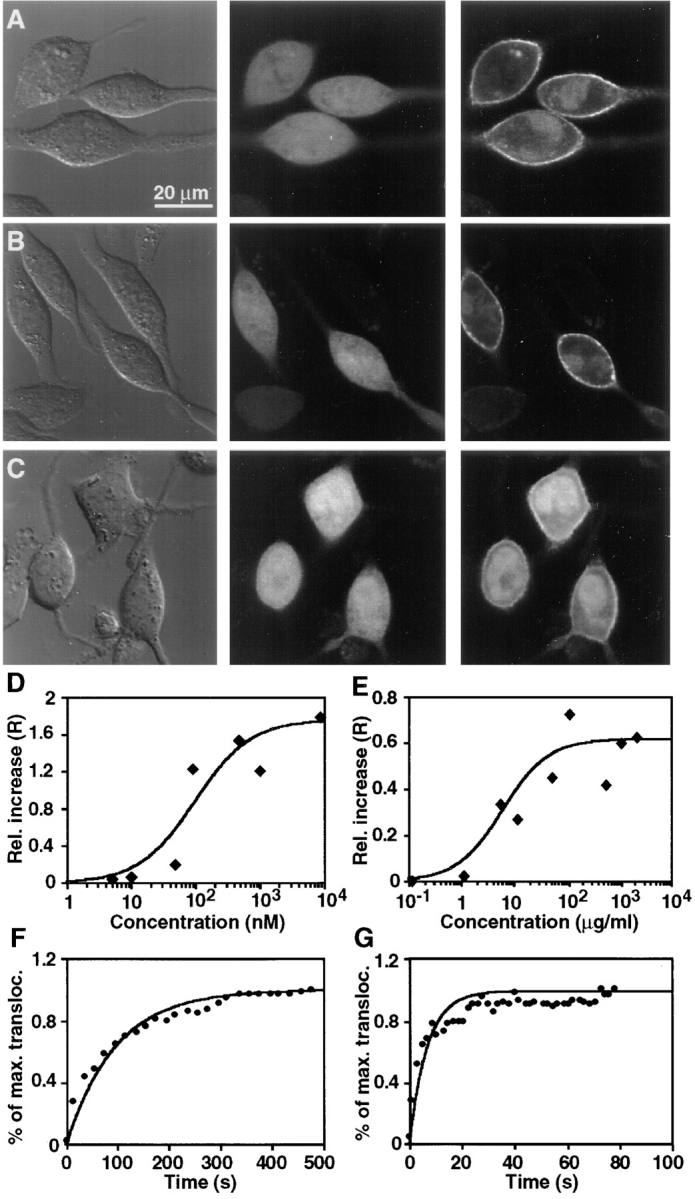
Translocation of Cys1–GFP in response to the addition of PMA or DiC8. Cells expressing Cys1–GFP were stimulated with either 1 μM PMA (A) or 100 μg/ml DiC8 (B). The left panels show DIC images of the cells before stimulation. The middle and right panels show fluorescent confocal fluorescence images recorded immediately before and 5 min after stimulation, respectively. Addition of PMA or DiC8 induced the translocation of most internal Cys1–GFP to the plasma membrane. The right images were corrected by an average photobleaching rate. (C) A less significant translocation was observed when cells expressing the proline mutant of Cys1 (mCys1–GFP) were stimulated with 1 μM PMA. D and E show the concentration dependence of the translocation of Cys1–GFP to the plasma membrane in response to the addition of different concentrations of PMA (D) and DiC8 (E). F and G show the time course of translocation of the Cys1– GFP probe upon addition of PMA (1 μM) or DiC8 (100 μg/ml). The translocation is shown as a relative increase in the plasma membrane fluorescence (R) as a function of time after PMA or DiC8 addition.
In addition to PMA, the extracellular addition of 1,2- dioctanoyl sn-glycerol (DiC8), a diacylglycerol analog with short fatty acid chains, also induced translocation of Cys1– GFP to the plasma membrane (Fig. 3 B). Again, the left panel shows a DIC image, the middle panel the Cys1–GFP distribution in unstimulated cells and the right panel the Cys1–GFP distribution after DiC8 addition. A similar translocation of Cys-domains to the plasma membrane was observed after addition of extracellular bacterial phosphatidylcholine phospholipase C (PC-PLC; data not shown). This enzyme generates diacylglycerol by cleaving phosphatidylcholine in the outer leaflet of the plasma membrane, with diacylglycerol exerting its biological function at the inner leaflet by randomization (Besterman et al., 1986).
Interestingly, addition of PMA to the Cys-domain mutated on the conserved proline residue led to a smaller but measurable translocation to the plasma membrane (Fig. 3 C). This residual plasma membrane translocation is consistent with the small phorbol ester mediated vesicle binding shown in Fig. 1 D.
A quantitative analysis of the concentration dependence of the plasma membrane translocation in response to PMA and DiC8 showed that half-maximal translocation occurred at 40 nM of PMA and 10 μg/ml of DiC8 (Figs. 3, D and E, respectively). Interestingly, an analysis of the kinetics of translocation showed that PMA-mediated translocation is much slower than that mediated by DiC8. While PMA-mediated translocation was half-maximal after ∼60 s (n = 14; Fig. 3 F), translocation in response to DiC8 only required ∼6 s (n = 12; Fig. 3 G).
How Tight Are the Plasma Membrane Binding Interactions of Cys1–GFP?
Whereas PMA, DiC8, and bacterial PC-PLC addition all led to a similar translocation of Cys1–GFP to the plasma membrane, photobleaching recovery measurements suggested that the dissociation time and the diffusion coefficient for the membrane-associated Cys1–GFP was markedly different for the three stimuli (Fig. 4). In these experiments, a small spot of plasma membrane localized Cys1–GFP was photobleached by a short laser pulse, and the recovery of fluorescence was monitored as a function of time using sequential imaging (Fig. 4 A shows an example of cells stimulated with PC-PLC). The plasma membrane–bound Cys1– GFP had recovery times of one second in cells stimulated by addition of PC-PLC or DiC8 (see Table I). In contrast, the recovery time after PMA-induced localization was typically 10 s and a variable fraction of the membrane-associated Cys1–GFP was completely immobile (examples of the recovery curves are shown in Fig. 4 B).
Figure 4.

Comparison of the apparent lateral membrane diffusion coefficient and apparent plasma membrane dissociation time of Cys1–GFP in response to the addition of PMA, PC-PLC, or DiC8. Fluorescence recovery after photobleaching was used to determine the diffusion coefficient and dissociation time of Cys1–GFP bound to the plasma membrane after either PMA, PC-PLC, or DiC8 addition. A small region of the plasma membrane was photobleached using a short laser pulse (8 ms), and sequential images were recorded every 330 ms for PC-PLC and DiC8 addition and every 1.5 s for PMA addition. (A) Example of four images of a cell expressing Cys1–GFP and stimulated with PC-PLC. The images shown were recorded immediately before and 0.33, 2, and 6 s after the photobleaching pulse. The plasma membrane bleach spot is indicated by the arrow. (B) Comparison of the recovery in fluorescence intensity of Cys1–GFP at the center of the bleach spot. (C) In each series of images, the one-dimensional fluorescence intensity profiles along the plasma membrane were measured as a function of time and each profile was fit by a Gaussian function. (D) Calculated relative increase in the square radius of each Gaussian profile as a function of time for three typical cells. Data for cells stimulated with PMA, PC-PLC, and DiC8 are shown. The apparent lateral plasma membrane diffusion coefficients are proportional to the slope of each linear fit (dy/dt = 4 × D). (E) Calculated membrane dissociation time courses for Cys1–GFP localized to the plasma membrane by PMA, PC-PLC or DiC8 addition.
Table I.
Apparent Plasma Membrane Diffusion Coefficients and Dissociation Times of Cys1–GFP
| Substance added | Halftime of recovery | Apparent lateral diffusion coefficient | Apparent dissociation time constant | |||
|---|---|---|---|---|---|---|
| s | μm2/s | s | ||||
| PC-PLC (n = 15) | 0.79 ± 0.02 | 1.19 ± 0.19 | 3.5 ± 0.5 | |||
| DiC8 (n = 18) | 1.3 ± 0.1 | 0.97 ± 0.14 | 8.0 ± 1.6 | |||
| PDBu (n = 10) | 6.4 ± 0.9 | 0.26 ± 0.01 | 35.9 ± 0.8 | |||
| PMA (n = 17) | 9.8 ± 0.6 | 0.15 ± 0.04 | 98.6 ± 19.0 |
Plasma membrane photobleaching recovery measurements of Cys1-GFP. The relative halftimes of recovery were compared after addition of different diacylglycerol analogues that induced plasma membrane translocation of Cys1–GFP. Apparent diffusion coefficients and dissociation time constants were calculated as described in Materials and Methods.
We separated a lateral membrane diffusion component of the recovery process from a membrane dissociation component by measuring one-dimensional line intensity profiles along the plasma membrane in each of a series of images. Since the laser used for photobleaching had an approximately Gaussian bleach profile, we fit the profiles in each of the images by Gaussian functions (Fig. 4 C; see Materials and Methods section). During the recovery process, the replacement of bleached Cys1–GFP with unbleached Cys1– GFP due to membrane diffusion is expected to lead to a widening of the Gaussian bleach profile, whereas the dissociation of bleached Cys1–GFP would not widen the bleach profile. Thus, the widening of the bleach profile as a function of time can be used to determine an apparent lateral diffusion coefficient of Cys1–GFP within the plasma membrane (Fig. 4 D). For PMA, an apparent membrane diffusion coefficient of D = 0.14 ± 0.04 μm2/s (n = 17) was calculated, whereas Cys1–GFP bound to the plasma membrane in response to DiC8 and PLC addition had a much faster apparent membrane diffusion coefficient: D = 0.97 ± 0.14 μm2/s (n = 18) for DiC8 and D = 1.19 ± 0.19 μm2/s (n = 15) for PC-PLC (see also Table I).
In a second analysis of the recovery process, an apparent dissociation time constant of Cys1–GFP from the plasma membrane was determined by subtracting the recovery component that results from membrane diffusion (see Materials and Methods). This analysis shows that Cys1–GFP bound to the plasma membrane by PMA has an apparent dissociation time of 98.6 ± 19 s (n = 17), whereas Cys1– GFP localized by DiC8 and by externally added PC-PLC has apparent dissociation times of 8.0 ± 1.6 s (n = 18) and 3.5 ± 0.5 s (n = 15), respectively (Fig. 4 E and Table I). It should be noted that the values for diffusion coefficients and dissociation times obtained in these analysis procedures can be affected by the particular cell geometry and are most useful as a means to compare membrane binding interactions within the same cell type.
Overall, this analysis suggests that Cys1–GFP is reversibly bound to the plasma membrane in response to increases in diacylglycerol concentration and can diffuse rapidly within the plasma membrane. However, the same Cys1–GFP probe not only has a much slower dissociation time in the presence of PMA but also shows a markedly reduced lateral membrane diffusion coefficient. As an additional result, these measurements suggest that short chain diacylglycerols (DiC8) are more effective in binding Cys1–GFP to the plasma membrane than diacylglycerol produced by extracellular addition of PC-PLC.
Identification of the Nuclear Membrane as a Second Target for Cys1–GFP
The studies described above have shown that the plasma membrane is a primary target of Cys1–GFP in response to IgE and PAF receptor–mediated production of diacylglycerol or addition of PMA, DiC8, or extracellular PC-PLC. PDBu is a smaller and less hydrophobic phorbol ester analogue than PMA that is expected to equilibrate more rapidly between the plasma membrane and internal membranes. These properties make PDBu an ideal tool to identify potential other intracellular membranes as targets for Cys-domains. Strikingly, extracellular addition of PDBu led to a rapid translocation of Cys1–GFP to the plasma as well as nuclear membranes (Fig. 5 A). The left panel shows the distribution of Cys1–GFP before, the middle image shows the distribution 1 min after, and the right panel shows the distribution 10 min after PDBu addition. A nuclear membrane localization of Cys1–GFP can be seen in the middle image. In RBL cells, the nucleus is typically bean shaped with distinct membrane invaginations (i.e., Subramanian and Meyer, 1997). Confocal analysis of a large number of cells showed that significantly less fluorescence was associated with other cytosolic membranes than with the nuclear or plasma membrane, suggesting that nuclear and plasma membrane are preferential targets for Cys1–GFP. Interestingly, several minutes after PDBu addition, the association of Cys1–GFP with the nuclear membrane was significantly reduced (i.e., Fig. 5 A, right).
Figure 5.

Addition of PDBu identifies the nuclear membrane as a selective target for Cys1–GFP translocation. (A) Series of three confocal fluorescence images of RBL cells expressing Cys1–GFP and stimulated by addition of PDBu (1 μM). The image on the left was recorded before PDBu addition, the middle image 1 min after PDBu addition, and the image on the right 10 min after PDBu addition. PDBu induced an initial localization of the Cys1–GFP to the nuclear membrane (middle). This nuclear localization became weaker in time, possibly due to the translocation of Cys1–GFP to the plasma membrane (right). Images were corrected for photobleaching. (B) PDBu concentration dependence of the plasma and nuclear membrane translocation of Cys1–GFP. Maximum translocation is reached at ∼40 nM PDBu for the plasma membrane and at 300 nM for the nuclear membrane. (C) Time course of translocation of Cys1–GFP to plasma and nuclear membrane in response to PDBu (1 μM). The relative increase in plasma membrane fluorescence reached a plateau after ∼60–120 s, whereas the relative increase in nuclear membrane fluorescence reached a maximum during a similar time period but then slowly decreased over time. (D–F) Analysis of plasma and nuclear membrane photobleaching recovery experiments. In D, the raw fluorescence recovery traces are shown. Interestingly, the recovery was faster for the nuclear membrane than for the plasma membrane. E shows a graph of the square radius of the bleach profile as a function of time for nuclear and plasma membrane. The apparent lateral diffusion coefficient of the Cys1–GFP in the two membranes was similar in both membranes. F shows the calculated time course of dissociation of Cys1–GFP away from the nuclear versus plasma membrane. The significantly faster apparent dissociation time from the nuclear membrane suggests that Cys1-domains have a lower affinity for the nuclear membrane compared with the plasma membrane.
An analysis of the concentration dependence of translocation showed that 30 nM PDBu induced half-maximal plasma membrane translocation, whereas 400 nM was required for half-maximal nuclear membrane translocation (Fig. 5 B). The time course of membrane translocation to the plasma membrane was as rapid as the one observed above for DiC8 (Fig. 5 C). For the nuclear membrane, a rapid nuclear translocation was typically followed by a slower reduction in nuclear membrane staining.
Photobleaching recovery measurements showed that the half-maximal recovery time was faster for nuclear membrane–bound Cys-domains compared with plasma membrane-bound Cys-domains (Fig. 5 D). While the apparent diffusion coefficients in the plasma and nuclear membrane (Fig. 5 E) were similar: D = 0.25 ± 0.02 μm2/s (n = 10) and D = 0.34 ± 0.05 μm2/s (n = 10), the apparent dissociation time at the plasma membrane (Fig. 5 F) was markedly slower than the one at the nuclear membrane: 35.9 ± 0.5 s for the plasma membrane dissociation time compared with 12.9 ± 3.6 s for the nuclear one (see also Table I for a comparison of the plasma membrane parameters). Thus, the titration with PDBu and the photobleaching recovery analysis both suggest that the affinity of Cys1– GFP for the nuclear membrane is lower than that for the plasma membrane. It is therefore conceivable that reversibly bound nuclear constructs will slowly diffuse away and bind to the plasma membrane, explaining the transient association of Cys1–GFP with the nuclear membrane.
Addition of PDBu was different from addition of PMA in that the concentration of initially homogeneously distributed nuclear Cys1–GFP rapidly decreased in parallel with an increase in the nuclear membrane staining (on a time scale of 10 s; Fig. 5 C). Thus, it is likely that the nuclear Cys1–GFP rapidly binds to the inner nuclear membrane after PDBu addition. The subsequent slow reduction in nuclear membrane staining may be a result of equilibration, since the nuclear membrane has likely a lower affinity than the plasma membrane.
Arachidonic Acid Prevents the Diacylglycerol-mediated Plasma Membrane Translocation of Cys-Domains
Previous studies have suggested that different protein kinase C isoforms can also be regulated by other lipid second messengers such as ceramide and free fatty acids. To investigate a potential effect of ceramide and free fatty acids on Cys-domains, the relative increase in plasma membrane fluorescence of Cys1–GFP was measured after addition of ceramide or free fatty acid. Using the analysis procedure shown in Fig. 2 B, DiC8 and PMA were found to induce a relative increase of plasma membrane fluorescence of ∼100 and 240%, respectively (Fig. 6 A). In contrast, ceramide, oleic acid, and arachidonic acid had little or no effect on the translocation of Cys1–GFP to the plasma membrane.
To investigate whether these messengers can suppress or enhance diacylglycerol induced localization of Cys1– GFP, different lipid second messengers were added 5 min before diacylglycerol addition. Ceramide and oleic acid had no significant effect on the diacylglycerol induced translocation of the probe. In contrast, 100 μM arachidonic acid almost completely abolished the ability of DiC8 to localize Cys1–GFP to the plasma membrane (Fig. 6 B).
Confocal imaging analysis of cells stimulated by arachidonic acid showed that this fatty acid induces an initial association of the Cys1–GFP probe with internal structures (Fig. 6 C). This is at least suggested from a less homogenous and punctuate distribution of Cys1–GFP after arachidonic acid addition. After the subsequent addition of DiC8, the probe became partially nuclear excluded and more prominently associated with nonuniform cytosolic structures. This suggests that Cys-domains are localized to internal membranes or other targets in response to a combined increase in diacylglycerol and arachidonic acid concentration.
To further test this hypothesis, we measured the mobility of Cys1–GFP in the cytosol before and after arachidonic acid and diacylglycerol addition (Fig. 6 D). Photobleaching recovery was used to determine the diffusion coefficient of Cys1–GFP in the cytosol. The apparent diffusion coefficient of the Cys1–GFP probe in the cytosol before stimulation was D = 7.0 ± 1.5 μm2/s. Addition of arachidonic acid (100 μM) led to a decrease of the diffusion coefficient to D = 4.2 ± 0.8 μm2/s. Addition of DiC8 to the arachidonic acid–treated cells led to a further decrease in the mobility of the probe in the cytosol to D = 2.9 ± 1.1 μm2/s. These results suggest that arachidonic acid enhances the binding interaction of Cys-domains with membranes and reduces the preferential plasma membrane localization of Cys1–GFP in response to diacylglycerol increases.
Receptor and PMA-induced Plasma Membrane Translocation of GFP-tagged Cys2-Domains, Cys1Cys2 Tandem Domains and Full-Length PKC-γ
In vitro studies have shown that the second Cys-domain of PKC-γ, the Cys1Cys2 tandem domains and the full-length PKC are also phorbol ester sensitive (Quest et al., 1994). Therefore, we tested whether these constructs can also be used as GFP-tagged probes to study diacylglycerol-mediated signal transduction (Fig. 7, A and B). As for the Cys1– GFP, the GFP-fusion constructs were expressed in RBL cells by RNA transfection (Fig. 7, C to E, left images). The expressed Cys2–GFP and Cys1Cys2–GFP were uniformly expressed in the cytosol and were in most cells enriched in the nucleoplasm (Fig. 7, C and D, left images). The expressed GFP-tagged full-length PKC-γ was largely cytosolically localized (Fig. 7 E, left image).
Figure 7.

Translocation of Cys2–GFP, Cys1Cys2–GFP, and full-length PKC-γ–GFP to the plasma membrane in response to receptor activation. (A) Schematic representation of the GFP-tagged constructs used in these experiments: Cys2–GFP, Cys1Cys2– GFP, and full-length PKC-γ–GFP. The proteins were expressed in RBL cells by microporation of in vitro transcribed RNA. (B) SDS-PAGE of [35S]Met-labeled proteins of in vitro transcribed GFP, Cys2–GFP, Cys1Cys2–GFP and PKC-γ–GFP. C–E represent series of three images of cells expressing the Cys2–GFP, Cys1Cys2–GFP and PKC-γ–GFP fusion proteins, respectively. The images were taken immediately before (left), 90 s after (middle), and 5 min after (right) stimulation with 100 nM PAF. Images were recorded at low laser intensity and were not corrected for photobleaching. A different plasma membrane translocation characteristic was observed for the three fusion proteins. Only a small fraction of the Cys2–GFP (D) translocated to the plasma membrane in response to receptor activation, while cytosolic Cys1Cys2–GFP (E) translocated more readily to the plasma membrane. Both, Cys2–GFP and Cys1Cys2–GFP, had also a typically higher concentration of the protein localized to the nucleus that was not significantly affected by receptor activation. (F) Full-length PKC-γ–GFP (E) showed significant nuclear exclusion in resting cells and a maximal transient localization to the plasma membrane in response to PAF receptor activation.
Activation of the PAF receptor led to a marked translocation of cytosolically localized Cys1Cys2–GFP and PKC-γ–GFP to the plasma membrane. A much smaller or no plasma membrane translocation was observed for Cys2– GFP. In Fig. 7 C, the cellular redistribution of the Cys2– GFP is shown 1 and 5 min after a maximal stimulation of PAF receptors. Fig. 7, D and E, show the plasma membrane translocation of Cys1Cys2–GFP and PKC-γ–GFP, respectively. Similar transient translocation events were observed for Cys1Cys2–GFP and PKC-γ–GFP after activation of IgE receptors, while no significant membrane translocation was observed for Cys2–GFP in response to IgE receptor activation (data not shown).
Nevertheless, in vitro translated Cys2–GFP, Cys1Cys2– GFP and PKC-γ–GFP all bound lipid vesicles in a phorbol ester-dependent manner (Fig. 8 A). Furthermore, all three constructs showed marked plasma membrane translocation in response to PMA (Fig. 8, B–D). Only the initially nuclear prelocalized Cys2–GFP and Cys1Cys2–GFP molecules was not significantly affected by the addition of PMA. In contrast, addition of PDBu induced a translocation of Cys2–GFP and Cys1Cys2–GFP to the plasma as well as nuclear membrane (data not shown, similar observations were made for Cys1–GFP in Fig. 6). No significant nuclear membrane localization of PKC-γ–GFP was observed after addition of PDBu, possibly because the full-length PKC-γ was largely nuclear excluded. While these measurements give additional insights into the function of the two Cys-domains in the context of the plasma membrane translocation of PKC-γ holoenzyme, they also suggest that the Cys1–GFP probe is better suited as a fluorescent indicator for studying diacylglycerol signaling.
Figure 8.

Phorbol ester sensitivity of Cys2–GFP, Cys1Cys2–GFP and full-length PKC-γ–GFP. (A) In vitro binding of Cys2–GFP, Cys1Cys2–GFP, and PKC-γ–GFP to lipid vesicles in the presence of phorbol ester. In vitro translated 35S labeled fusion proteins were used. The amplitude of each bar represents the percentage of total counts retrieved in the vesicle fraction. The amplitude of each bar represents an average of two samples from the same experiment with the number of counts in the vesicle fraction expressed as a percentage of total counts added (% bound). Two separate experiments with phosphatidylserine vesicles and one experiment with a phosphatidylserine/phosphatidylcholine mixture (1:4 ratio of lipids) gave similar results. (B–D) Series of three images of cells expressing the Cys2–GFP, Cys1Cys2–GFP, and PKC-γ–GFP fusion proteins respectively. The left panels show differential interference contrast images of the cells before stimulation. The middle and right panels show fluorescent confocal fluorescence images recorded immediately before and 5 min after stimulation with 1 μM PMA. All three fusion proteins show maximal translocation of the fusion proteins from cytosol to the plasma membrane in the presence of PMA. For Cys2–GFP and Cys1Cys2–GFP (B and C), the nuclear localized fusion proteins did not significantly redistribute after PMA addition. Images were not corrected for photobleaching.
Discussion
GFP-tagged Cys-Domains as Fluorescent Indicators for Diacylglycerol Signaling in Living Cells
Previous in vitro binding studies with Cys-domains from PKC-γ and other proteins showed that Cys-domains can be grouped into at least two classes: (a) Cys-domains which are phorbol ester sensitive (i.e., cPKCs, nPKCs, Unc-13, Chimaerin) and (b) Cys-domains that are not (Raf and aPKCs). A clear sequence relationship between the two classes has not yet been established. We have focused our study on the two Cys-domains from PKC-γ, which have both been shown to be phorbol ester sensitive by vesicle binding studies (Quest and Bell, 1994). The sequence homologies between the Cys-domains from PKC-α, PKC-β1, PKC-β2, and PKC-γ isoforms suggest that all can bind phorbol ester and are targeted to membranes by similar mechanisms. To obtain a mutant Cys-domain which is not phorbol ester sensitive, we mutated the conserved histidine 36 to alanine and cysteine 85 to alanine that are part of the Cys6His2-motif. However, both constructs failed to express fluorescent fusion proteins in living cells, possibly due to misfolding.
Interestingly, all Cys-domains that have been shown to bind phorbol ester have also a conserved proline in addition to the conserved Cys6His2-motif, while nonphorbol ester sensitive Cys-domains have different residues at the proline position. Specifically, PKC-ζ, which is not phorbol ester sensitive, has a glycine residue at this same position. Although it is likely that the proline residue is necessary for effective phorbol ester mediated membrane binding, it is not sufficient, since the mutation of this glycine to proline was not sufficient to make the PKC-ζ Cys-domain phorbol ester sensititve (Kazanietz et al., 1994). Nevertheless, we have mutated the conserved proline at position 46 of the first Cys-domain of PKC-γ to a glycine residue with the expectation to obtain a Cys-domain with reduced phorbol ester sensitivity. Indeed, the proline mutated construct expressed a fluorescent fusion protein had reduced phorbol ester sensitivity and could be used as a control in the translocation studies.
Using in vitro vesicle binding, we showed that GFP-tagged Cys1–GFP, Cys2–GFP, Cys1Cys2–GFP, and PKC-γ–GFP can bind to lipid vesicles in the presence of phorbol ester, suggesting that the GFP-fusion constructs have retained similar functional capabilities as previously characterized GST-fusion constructs with these same domains (Quest et al., 1996).
When expressed in RBL cells, Cys1–GFP was nearly uniformly distributed in the cytosol and nucleus, while Cys2–GFP and Cys1Cys2–GFP showed typically an elevated concentration in the nucleus. The full-length PKC-γ–GFP was nearly uniformly localized in the cytosol with only minimal nuclear staining. Strikingly, addition of PMA induced a significant translocation of all four constructs to the plasma membrane while a variable but typically smaller fraction of GFP remained internally localized. In contrast to the distinct plasma membrane translocation of these four constructs, only a minimal PMA-induced translocation was observed for the proline mutated mCys1–GFP and no translocation was observed for GFP alone. Taken together, these results suggest that the GFP-tag on these four PKC-γ constructs has not affected their ability to bind to lipids in the presence of phorbol ester in vitro and in vivo. The parallel findings that the proline mutated mCys1– GFP binds vesicles less effectively in vitro and also shows a markedly reduced plasma membrane translocation in vivo, supports the hypothesis that a direct membrane interaction of the Cys-domain is responsible for the PMA- or diacylglycerol-induced plasma membrane translocation.
When cells were stimulated by IgE and PAF receptor ligands that activate PLC-γ and PLC-β, respectively, we found that Cys1–GFP translocates most effectively to the plasma membrane when compared with the Cys2–GFP and Cys1Cys2–GFP. The full-length PKC-γ–GFP also showed near maximal plasma membrane translocation. While it is difficult to directly demonstrate that diacylglycerol is responsible for this receptor-induced plasma membrane translocation of Cys-domains, the similar results obtained after DiC8 and PMA addition as well as the transient time course of translocation further support the hypothesis that diacylglycerol acts as the mediator of the translocation step. Interestingly, since our measurements show that an individual Cys-domain can translocate to the membrane after receptor activation, it is suggestive to propose that the interaction of a single Cys domain with plasma membrane generated diacylglycerol can be sufficient to target a Cys-domain containing protein to the plasma membrane.
Since receptor-induced calcium signals are highly variable between individual RBL cells, it was not surprising that the time courses of the plasma membrane translocation of Cys1–GFP was also variable between individual cells. Fig. 2 showed an average time course compared for two receptor stimuli that activate either PLC-β or PLC-γ. Both stimuli led to a transient translocation of Cys1–GFP with a longer initial delay after activation of PLC-γ. The longer delay for the PLC-γ activation is also consistent with a similar delay for calcium signaling (i.e., Millard et al., 1988). In addition, the time course of IgE receptor–mediated translocation of Cys-domains also matched the first peak of diacylglycerol production measured earlier in biochemical studies (Lin et al., 1992). A second peak of diacylglycerol production in these cells lasts longer and is mediated by phospholipase D (PLD; Lin et al., 1994). Since an earlier study suggested that diacylglycerol produced by PLD activation is significantly localized to membranes different from the plasma and nuclear membrane (Martin et al., 1990), it is likely that Cys1–GFP cannot detect this second wave of diacylglycerol production. Alternatively, the expressed Cys-domain may act in a dominant negative fashion and lower the PLD-mediated diacylglycerol production.
Photobleaching Recovery Studies Identify Differences in the Binding Interaction of Cys1–GFP with the Plasma Membrane
Whereas in vitro binding studies suggested that phorbol ester mediates a tight binding interaction of Cys-domains with membranes, it was surprising that the phorbol ester Cys1–GFP complex was not only tightly bound but also showed a markedly reduced lateral diffusion in the plasma membrane. The apparent membrane diffusion coefficient of the complex was approximately 10-fold slower than that of DiC8 Cys1–GFP complexes, suggesting that phorbol ester targeted Cys-domains are anchored to the membrane either by forming larger lipid complexes or by binding to less immobile membrane proteins or other structural elements. In contrast to the immobilization of Cys1–GFP by PMA, DiC8-targeted Cys1–GFP remained mobile within the plasma membrane and had also a much shorter apparent dissociation time.
A faster apparent dissociation time was also observed for Cys1–GFP anchored by the longer chain diacylglycerol produced by external PC-PLC addition, when compared with the shorter chain DiC8. This suggests that not only the type of the head group but also the length of the fatty acid chain controls the binding interaction of Cys-domains. The slower apparent dissociation time for the short chain diacylglycerol could be a result of a deeper insertion of the Cys-domains into the plasma membrane, thereby enhancing hydrophobic interactions with the membrane and possibly surface charge interactions with lipid head groups (Zhang et al., 1995).
Overall, these studies suggest that the strength with which Cys-domain binds to the plasma membrane and their respective lateral mobility are strongly dependent not only on phorbol ester versus diacylglycerol analogs, but are also significantly dependent on the type of phorbol ester and the chain length of the produced diacylglycerol.
Preferential Targeting of Cys1–GFP to Plasma and Nuclear Membranes
An important finding of our study was that PDBu, a smaller and more hydrophilic phorbol derivative than PMA, induced a preferential translocation of Cys1–GFP not only to the plasma but also the nuclear membrane. Visual inspection of a large number of cells suggested that the localization of Cys1–GFP to plasma and nuclear membrane is not complete, and a smaller but measurable fraction of the Cys1–GFP remains in the cytosol or is localized to other internal membranes after PDBu addition (i.e., Fig. 6 A).
Is Cys1–GFP targeted to the inside or outside of the nuclear double membrane? Since addition of Cys1–GFP led to a parallel rapid reduction of the concentration of Cys1– GFP in the nucleoplasm and an increase in nuclear membrane staining (within 10 s), it is suggestive to propose that the part of the Cys1–GFP that is initially nuclear localized would directly bind to the inner leaflet of the nuclear double membrane.
The photobleaching recovery data and the higher PDBu concentration required for nuclear versus plasma membrane translocation, suggests that the binding to the nuclear membrane has a lower affinity than that to the plasma membrane. This difference in affinity could explain why a significant fraction of the nuclear membrane localized GFP will disappear over time, possibly by binding with higher affinity to the plasma membrane.
These observations suggest that diacylglycerol produced at the plasma membrane leads to the translocation of cytosolic localized PKC to the plasma membrane, whereas diacylglycerol that may be produced at the inner nuclear membrane would lead to the translocation of potential nuclear PKC to the nuclear membrane. Based on our observations, diacylglycerol produced at other membranes would be less effective in mediating Cys-domain translocation. While we have not yet identified a receptor stimulus that leads to a measurable translocation of Cys-domains to the nuclear membrane, the importance of the nuclear targeting mechanism of Cys-domains is supported by the earlier identification of phosphatidyl 4,5-bisphosphate and phospholipase C-β in the nucleus (Payrastre et al., 1992; Mazzotti et al., 1995). Furthermore, receptor-mediated increases in nuclear diacylglycerol concentration and PKC activation have been reported (Divecha et al., 1991, 1994; Leach et al., 1992). Taken together with the results in our studies, it is therefore conceivable that the activation of nuclear Cys-domain containing proteins could be mediated by diacylglycerol production in the nucleus.
Why Is the Plasma Membrane a Preferential Target for Cys-Domains?
Based on the in vitro data that showed that Cys-domains directly bind to lipid vesicles in the presence of phorbol ester, we have discussed our data as if the translocation to the plasma membrane is a direct interaction with plasma membrane diacylglycerol and phospholipids and not with either plasma membrane proteins or cortical cytoskeletal components. We tested a possible cortical cytoskeletal interaction by addition of cytochalasin D, which had no effect on the plasma membrane translocation of Cys1–GFP (incubation with 10 μM for 15 min at 37oC; data not shown). Nevertheless, the markedly reduced membrane diffusion of Cys1–GFP in the presence of PMA might be an indication for additional binding interactions of Cys1–GFP in the presence of PMA. Even though such additional interactions are possible, the in vitro evidence makes it likely that an interaction of Cys-domains with diacylglycerol and other lipids are a main determinant that defines the selective plasma membrane interaction of Cys-domains.
Thus, it is suggestive to propose that the plasma membrane has a distinct lipid composition that makes it a better target for Cys-domains. The basis for the selective targeting to the plasma membrane might be the result of a high concentration of negatively charged lipids in the inner leaflet of the plasma membrane (i.e., phosphatidyl serine). Such a mechanism for specificity is supported by in vitro studies that showed that anionic lipids are necessary in reconstituted vesicles for efficient membrane binding by Cys-domains (Quest and Bell, 1994). While the lipid composition of the plasma membrane has been investigated in the past, less is known about potential differences in the lipid composition of the nuclear membranes.
The targeting of PKC holoenzymes to the plasma membrane and other intracellular sites is mediated not only by Cys-domains but also by other interactions (Liao et al., 1994; Mochly-Rosen, 1995). For example, C2-domains of conventional PKCs have been proposed to be important for the selective targeting to the plasma membrane, a process which is likely mediated by calcium and phosphatidyl serine (Luo and Weinstein, 1993). The finding that Cys1– GFP as well as PKC-γ–GFP can be targeted to the plasma membrane by phorbol esters, suggests that a calcium- dependent step involving C2-domains may not always be necessary to translocate PKC to the plasma membrane. Furthermore, since the individual Cys-domains from PKC-γ showed a similar membrane translocation characteristics as the tandem Cys-domains, the role for the presence of two Cys-domains in cPKCs may be to enhance the membrane binding affinity of PKC in the presence of diacylglycerol. Further studies are needed to understand the function of the two Cys-domains in the context of the holoenzyme.
How Does Arachidonic Acid Affect the Localization of Cys-Domains?
The observation that ceramide was ineffective in altering Cys1–GFP localization may not be a general result for all Cys-domains, since experimental evidence has suggested that ceramide plays a role in regulating the function of Raf (Huwiler et al., 1996) and other Cys-domain containing proteins (Gulbins et al., 1994). However, the loss in preferential plasma membrane translocation of Cys1–GFP after arachidonic acid addition suggests that arachidonic acid, a lipid messenger produced by different receptor-stimuli, may have a regulatory role in Cys-domain translocation. In the presence of high arachidonic acid concentration (corresponding to 100 μM externally added arachidonic acid), diacylglycerol might then be able to target Cys-domains more effectively to internal membranes. Since arachidonic acid alone leads to a partial binding of Cys-domains to internal membranes as evidenced by a decrease in the diffusion coefficient of Cys-domains, it is conceivable that arachidonic acid can affect PKC function even in the absence of receptor-generated diacylglycerol.
While it is possible that the effect of arachidonic acid is the result of direct binding to Cys-domains, it is more likely that high arachidonic acid concentrations change the lipid environment within membranes and thereby indirectly alter the membrane binding of Cys-domains (Nakamura and Nishizuka, 1994). Independent of the mechanism of action, the effect of arachidonic acid on diacylglycerol-mediated membrane translocation shows that the specificity of membrane targeting of Cys-domains in vivo might be regulated by other factors than receptor-mediated increases in diacylglycerol concentration.
In summary, these studies have shown that GFP-tagged Cys-domain probes can be used to study the localized production of functionally significant diacylglycerol in individual cells. Similar to localized calcium measurements using fluorescent calcium indicators, these probes can provide insights into spatio-temporal differences of diacylglycerol signaling for different receptor-stimuli and cell types.
Acknowledgments
We acknowledge the contribution of Dr. Yusuf Hannun (Duke University) for his suggestions in designing several of the experiments and for his insightful comments. We also thank Drs. Lina Obeid and John York (Duke University) for critical reading of the manuscript. We acknowledge the experimental support of Hiroko Yokoe, Kang Shen, Ashish Bhimani, and Drs. Kala Subramanian and Thomas Stauffer.
Abbreviations used in this paper
- aPKC
atypical PKC
- cPKC
conventional PKC
- Cys-domains
cysteine-rich domains
- DAG
diacylglycerol
- DIC
differential interference contrast
- GFP
green fluorescent protein
- GST
glutathione S transferase
- Met
methionine
- nPKC
novel PKC
- PAF
platelet activation factor
- PC-PLC
phosphatidylcholine-phospholipase C
- PDBu
phorbol dibuterate
- PKC
protein kinase C
- PLD
phospholipase D
- RBL
rat basophilic leukemia
Footnotes
T. Meyer was supported by a fellowship from the David and Lucile Packard Foundation. This work was supported by National Institute of Health grants GM-48113 and GM-51457.
References
- Abousalham A, Liossis C, O'Brien L, Brindley DN. Cell-permeable ceramides prevent the activation of phospholipase D by ADP-ribosylation factor and RhoA. J Biol Chem. 1997;272:1069–1075. doi: 10.1074/jbc.272.2.1069. [DOI] [PubMed] [Google Scholar]
- Ali H, Richardson RM, Tomhave ED, DuBose RA, Haribabu B, Snyderman R. Regulation of stably transfected platelet activating factor receptor in RBL-2H3 cells. J Biol Chem. 1995;269:24557–24563. [PubMed] [Google Scholar]
- Besterman J, Duronio V, Cuatrecasas P. Rapid formation of diacylglycerol from phosphatidylcholine: a pathway for generation of a second messenger. Proc Natl Acad Sci USA. 1986;83:6785–6789. doi: 10.1073/pnas.83.18.6785. [DOI] [PMC free article] [PubMed] [Google Scholar]
- Castagna M, Takai Y, Kaibuchi K, Sano K, Kikkawa U, Nishizuka Y. Direct activation of calcium-activated, phospholipid-dependent protein kinase by tumor-promoting phorbol esters. J Biol Chem. 1982;257:7847–7851. [PubMed] [Google Scholar]
- Crameri A, Whitehorn EA, Tate E, Stemmer WPC. Improved green fluorescent protein by molecular evolution using DNA shuffling. Nature Biotech. 1996;14:315–319. doi: 10.1038/nbt0396-315. [DOI] [PubMed] [Google Scholar]
- Divecha N, Banific H, Irvine RF. The phosphoinositide cycle exists in the nuclei of Swiss 3T3 cells under the control of a receptor for IGF-I in the plasma membrane, and stimulation of the cycle increases nuclear diacylglycerol and apparently induces translocation of protein kinase C to the nucleus. EMBO (Eur Mol Biol Organ) J. 1991;10:3207–3214. doi: 10.1002/j.1460-2075.1991.tb04883.x. [DOI] [PMC free article] [PubMed] [Google Scholar]
- Divecha N, Banific H, Irvine RF. The nuclear phosphoinositide cycle—does it play a role in nuclear Ca2+ homeostasis? . Cell Calcium. 1994;16:297–300. doi: 10.1016/0143-4160(94)90093-0. [DOI] [PubMed] [Google Scholar]
- Ghosh S, Xie WQ, Quest AF, Mabrouk GM, Strum JC, Bell RM. The cysteine-rich region of raf-1 kinase contains zinc, translocates to liposomes, and is adjacent to a segment that binds GTP-ras. J Biol Chem. 1994;269:10000–10007. [PubMed] [Google Scholar]
- Gulbins E, Coggeshall KM, Baier G, Telford D, Langlet C, Baier-Biterlich G, Bonnefoy-Berard N, Burn P, Wittinghofer A, Altman A. Direct stimulation of Vav guanine nucleotide exchange activity for Ras by phorbol ester and diacylglycerides. Mol Cell Biol. 1994;14:4749–4758. doi: 10.1128/mcb.14.7.4749. [DOI] [PMC free article] [PubMed] [Google Scholar]
- Hannun YA, Loomis CR, Bell RM. Activation of protein kinase C by Triton X-100 mixed micelles containing diacylglycerol and phosphatidylserine. J Biol Chem. 1985;260:10039–10043. [PubMed] [Google Scholar]
- Hannun YA, Loomis CR, Bell RM. Protein kinase C activation in mixed micelles. Mechanistic implications of phospholipid, diacylglycerol, and calcium interdependencies. J Biol Chem. 1986;261:7184–7190. [PubMed] [Google Scholar]
- Heim R, Tsien RY. Engineering green fluorescent protein for improved brightness, longer wavelengths and fluorescence resonance energy transfer. Curr Biol. 1996;6:178–182. doi: 10.1016/s0960-9822(02)00450-5. [DOI] [PubMed] [Google Scholar]
- Huwiler A, Brunner J, Hummel R, Vervooldeldonk M, Stabel S, van den Bosch H, Pfeilschifter J. Ceramide-binding and activation defines protein kinase c-Raf as a ceramide -activated protein kinase. Proc Natl Acad Sci USA. 1996;93:6959–6963. doi: 10.1073/pnas.93.14.6959. [DOI] [PMC free article] [PubMed] [Google Scholar]
- Jones MJ, Murray AW. Evidence that ceramide selectively inhibits protein kinase C-alpha translocation and modulates bradykinin activation of phospholipase D. J Biol Chem. 1995;270:5007–5013. doi: 10.1074/jbc.270.10.5007. [DOI] [PubMed] [Google Scholar]
- Kazanietz MG, Bustelo XR, Barbacid M, Kolch W, Mischak H, Wong G, Pettit JD, Bruns JD, Blumberg PM. Zinc finger domains and phorbol ester pharmacophore. J Biol Chem. 1994;269:11590–11594. [PubMed] [Google Scholar]
- Kazanietz MG, Lewin NE, Bruns JD, Blumberg PM. Characterization of the cysteine-rich region of the Caenorhabditis elegans protein Unc-13 as a high affinity phorbol ester receptor. Analysis of ligand-binding interactions, lipid cofactor requirements, and inhibitor sensitivity. J Biol Chem. 1995;270:10777–11783. doi: 10.1074/jbc.270.18.10777. [DOI] [PubMed] [Google Scholar]
- Khan WA, Blobe GC, Hannun YA. Arachidonic acid and free fatty acids as second messengers and the role of protein kinase C. Cell Signal. 1995;7:171–184. doi: 10.1016/0898-6568(94)00089-t. [DOI] [PubMed] [Google Scholar]
- Khan, W., S. el Touny, and Y.A. Hannun. 1991. Arachidonic and cis-unsaturated fatty acids induce selective platelet substrate phosphorylation through activation of cytosolic protein kinase C. FEBS Lett. 292:98–102. [DOI] [PubMed]
- Leach KL, Ruff VA, Jarpe MB, Adams LD, Fabbro D, Raben DM. Alpha-thrombin stimulates nuclear diglycerides levels and differential nuclear localization of protein kinase C isozymes in IIC9 cells. J Biol Chem. 1992;267:21816–21822. [PubMed] [Google Scholar]
- Liao L, Hyatt SL, Chapline C, Jaken S. Protein kinase C domains involved in interactions with other proteins. Biochemistry. 1994;33:1229–1233. doi: 10.1021/bi00171a024. [DOI] [PubMed] [Google Scholar]
- Lin P, Fung W-JC, Gilfillan AM. Phosphatidylcholine-specific phospholipase D-derived 1,2-diacylglycerol does not initiate protein kinase C activation in RBL 2H3 mast-cell-line. Biochem J. 1992;287:325–331. doi: 10.1042/bj2870325. [DOI] [PMC free article] [PubMed] [Google Scholar]
- Lin P, Fung W-JC, Li S, Chen T, Repetto B, Husng K-S, Gilfillan AM. Temporal regulation of the IgE-dependent 1,2-diacylglycerol production by tyrosine kinase activation in a rat RBL 2H3 mast-cell line. Biochem J. 1994;299:109–114. doi: 10.1042/bj2990109. [DOI] [PMC free article] [PubMed] [Google Scholar]
- Luo JH, Weinstein IB. Calcium-dependent activation of protein kinase C. The role of C2 domain in divalent cation selectivity. J Biol Chem. 1993;268:23580–23584. [PubMed] [Google Scholar]
- Martin TFJ, Hsieh K-P, Porter BW. The sustained second phase of hormone-stimulated diacylglycerol accumulation does not activate protein kinase C in GH3 cells. J Biol Chem. 1990;265:7623–7631. [PubMed] [Google Scholar]
- Mazzotti G, Zini N, Rizzi E, Rizzoli R, Alanzi A, Ognibene A, Santi S, Matteucci A, Martelli AM, Maraldi NM. Immunocytochemical detection of phosphatidylinositol 4,5-bisphosphate localization sites within the nucleus. J Histochem Cytochem. 1995;43:181–191. doi: 10.1177/43.2.7822774. [DOI] [PubMed] [Google Scholar]
- Millard PJ, Gross D, Webb WW, Fewtrell C. Imaging asynchronous changes in intracellular Ca2+ in individual stimulated tumor mast cells. Proc Natl Acad Sci USA. 1988;85:1854–1858. doi: 10.1073/pnas.85.6.1854. [DOI] [PMC free article] [PubMed] [Google Scholar]
- Mochly-Rosen D. Localization of protein kinases by anchoring proteins: a theme in signal transduction. Science. 1995;268:247–251. doi: 10.1126/science.7716516. [DOI] [PubMed] [Google Scholar]
- Nakamura S, Nishizuka Y. Lipid mediators and protein kinase C activation for the intracellular signaling network. J Biochem. 1994;115:1029–1034. doi: 10.1093/oxfordjournals.jbchem.a124451. [DOI] [PubMed] [Google Scholar]
- Newton AC. Protein kinase C. Seeing two domains. Curr Biol. 1995;5:973–976. doi: 10.1016/s0960-9822(95)00191-6. [DOI] [PubMed] [Google Scholar]
- Nishizuka Y. The molecular heterogeneity of protein kinase C and its implications for cellular regulation. Nature. 1988;334:661–665. doi: 10.1038/334661a0. [DOI] [PubMed] [Google Scholar]
- Nishizuka Y. Intracellular signaling by hydrolysis of phospholipids and activation of protein kinase C. Science. 1992;258:607–614. doi: 10.1126/science.1411571. [DOI] [PubMed] [Google Scholar]
- Ogawa Y, Takai Y, Kawahara Y, Kimura S, Nishizuka Y. A new possible regulatory system for protein phosphorylation in human peripheral lymphocytes. I. Characterization of a calcium-activated, phospholipid- dependent protein kinase. J Immunol. 1981;127:1369–1374. [PubMed] [Google Scholar]
- Ono Y, Fujii T, Igarashi K, Kuno T, Tanaka C, Kikkawa U, Nishizuka Y. Phorbol ester binding to protein kinase C requires a cysteine-rich zinc-finger-like sequence. Proc Natl Acad Sci USA. 1989;86:4868–4871. doi: 10.1073/pnas.86.13.4868. [DOI] [PMC free article] [PubMed] [Google Scholar]
- Payrastre B, Nievers M, Boonstra J, Breton M, Verkleij AJ, Van Bergen PM en Henegouwen. A differential localization of phosphoinositide kinases, diacylglycerol kinase and phospholipase C in the nuclear matrix. J Biol Chem. 1992;267:5078–5084. [PubMed] [Google Scholar]
- Quest AF. Regulation of protein kinase C: a tale of lipids and proteins. Enzyme Protein. 1996;49:231–262. doi: 10.1159/000468635. [DOI] [PubMed] [Google Scholar]
- Quest AF, Bell RM. The regulatory region of protein kinase C gamma. Studies of phorbol ester binding to individual and combined functional segments expressed as glutathione S-transferase fusion proteins indicate a complex mechanism of regulation by phospholipids, phorbol esters, and divalent cations. J Biol Chem. 1994;269:20000–20012. [PubMed] [Google Scholar]
- Schneider H, Cohen-Dayag A, Pecht I. Tyrosine phosphorylation of phospholipase C gamma 1 couples the Fc epsilon receptor mediated signal to mast cells secretion. Int Immunol. 1992;4:447–453. doi: 10.1093/intimm/4.4.447. [DOI] [PubMed] [Google Scholar]
- Subramanian K, Meyer T. Calcium-induced restructuring of nuclear envelope and endoplasmic reticulum calcium stores. Cell. 1997;89:963–971. doi: 10.1016/s0092-8674(00)80281-0. [DOI] [PubMed] [Google Scholar]
- Teruel MN, Meyer T. Electroporation induced formation of individual calcium entry sites in cell body and processes of adherent cells. Biophys J. 1997;73:1785–1796. doi: 10.1016/S0006-3495(97)78209-2. [DOI] [PMC free article] [PubMed] [Google Scholar]
- Venable ME, Bielawska A, Obeid LM. Ceramide inhibits PLD in a cell-free system. J Biol Chem. 1996;271:24800–24805. doi: 10.1074/jbc.271.40.24800. [DOI] [PubMed] [Google Scholar]
- Yokoe H, Meyer T. Spatial dynamics of GFP-tagged proteins investigated by local fluorescence enhancement. Nat Biotechnol. 1996;14:1252–1256. doi: 10.1038/nbt1096-1252. [DOI] [PubMed] [Google Scholar]
- Yoshida K, Asaoka Y, Nishizuka Y. Platelet activation by simultaneous actions of diacylglycerol and unsaturated fatty acids. Proc Natl Acad Sci USA. 1992;89:6443–6446. doi: 10.1073/pnas.89.14.6443. [DOI] [PMC free article] [PubMed] [Google Scholar]
- Zhang G, Kazanietz MG, Blumberg PM, Hurley JH. Crystal structure of the Cys2 activator-binding domain of protein kinase Cd in complex with phorbol ester. Cell. 1995;81:917–924. doi: 10.1016/0092-8674(95)90011-x. [DOI] [PubMed] [Google Scholar]