

Abstract
Yeast cells mate by an inducible pathway that involves agglutination, mating projection formation, cell fusion, and nuclear fusion. To obtain insight into the mating differentiation of Saccharomyces cerevisiae, we carried out a large-scale transposon tagging screen to identify genes whose expression is regulated by mating pheromone. 91,200 transformants containing random lacZ insertions were screened for β-galactosidase (β-gal) expression in the presence and absence of α factor, and 189 strains containing pheromone-regulated lacZ insertions were identified. Transposon insertion alleles corresponding to 20 genes that are novel or had not previously been known to be pheromone regulated were examined for effects on the mating process. Mutations in four novel genes, FIG1, FIG2, KAR5/ FIG3, and FIG4 were found to cause mating defects. Three of the proteins encoded by these genes, Fig1p, Fig2p, and Fig4p, are dispensible for cell polarization in uniform concentrations of mating pheromone, but are required for normal cell polarization in mating mixtures, conditions that involve cell–cell communication. Fig1p and Fig2p are also important for cell fusion and conjugation bridge shape, respectively. The fourth protein, Kar5p/Fig3p, is required for nuclear fusion. Fig1p and Fig2p are likely to act at the cell surface as Fig1:: β-gal and Fig2::β-gal fusion proteins localize to the periphery of mating cells. Fig4p is a member of a family of eukaryotic proteins that contain a domain homologous to the yeast Sac1p. Our results indicate that a variety of novel genes are expressed specifically during mating differentiation to mediate proper cell morphogenesis, cell fusion, and other steps of the mating process.
The yeast mating response is an excellent model system for the study of receptor-activated cell differentiation in eukaryotes. Upon encountering appropriate mating pheromones, haploid yeast cells follow a programmed pattern of cell differentiation in preparation for later events of mating such as cell and nuclear fusion (Cross et al., 1988; Sprague and Thorner, 1992; Kurjan, 1993; Herskowitz, 1995). Vegetative cells exposed to pheromone stop their progression through the cell cycle and undergo polarized cell growth to form a specialized structure termed a mating projection. Polarized mating cells signal one another through their projections, and thereby direct growth to a mutual site of cell contact and fusion. Cell fusion usually occurs at the tips of the projections, forming a conjugation tube or bridge. Nuclear congression and fusion then take place within the conjugation bridge and the zygote enters the vegetative cell cycle, dividing the diploid nucleus between itself and its bud. Although the cytological events of yeast mating have been well described, the molecular components and mechanisms important for mating cell morphogenesis, cell fusion, and nuclear fusion are not well understood.
At the molecular level, mating differentiation is initiated by the activation of a receptor-coupled signal transduction cascade. Pheromones are bound by the STE2 and STE3 gene products, which are seven transmembrane segment receptors located on the surface of MAT a and MATα cells, respectively. These receptors are coupled to a heterotrimeric G protein complex and a cytoplasmic mitogen-activated protein (MAP)1 kinase cascade (Sprague and Thorner, 1992). Transduction of the signal by the MAP kinase cascade leads to activation of the transcription factor Ste12p, which, in turn, promotes the transcription of a set of genes involved in mating-specific functions. These functions include cell cycle arrest in G1, polarized morphogenesis, agglutination, cell fusion, karyogamy, and adaptation to the pheromone signal (Sprague and Thorner, 1992). Many components of the mating MAP kinase cascade, including the Ste12p transcription factor, have also been shown to be required in both haploid and diploid cells for the transition from the normal yeast form of growth to filamentous forms stimulated by nutrient deprivation conditions (Liu et al., 1993; Roberts and Fink, 1994). These filamentous forms of polarized growth and unipolar budding have been proposed to be a mechanism by which cells forage for more favorable nutrient-rich environments (Gimeno et al., 1992; Kron et al., 1994).
The mating projection produced by cells exposed to pheromone serves two important purposes. First, the projection allows the nonmotile yeast cell to extend towards its mate. The position of the mate is perceived through pheromone gradients emanating from mating partners. This perception, or partner selection, is accomplished through the differential activation of mating pheromone receptors on the surface of the mating cell (Jackson and Hartwell, 1990; Jackson et al., 1991; Segall, 1993). Second, growth of the mating projection is an actin-dependent process that has been shown to depend on several proteins that also participate in polarized growth during budding (e.g., Spa2p, Pea2p, Bem1p, Tpm1p, and Cdc42p) (Herskowitz et al., 1995; Pringle et al., 1995; Roemer et al., 1996). Recent studies have demonstrated a physical association between Cdc24p (the GTP exchange factor for Cdc42p), Bem1p, actin, and the heterotrimeric G proteins associated with the pheromone receptors, suggesting a mechanism for linking pheromone pathway activation to localized cell polarization (Leeuw et al., 1995). However, because these interactions are independent of the state of activation of the pheromone pathway, the specific mechanism of polarization to sites of pheromone receptor activation remains obscure (Leeuw et al., 1995; Roemer et al., 1996).
The second role of the mating projection is to concentrate components involved in cell adhesion (agglutinins), signaling (pheromones and pheromone receptors), and fusion (Fus1p and Fus2p) to the area of intended cell contact and fusion. High levels of mating pheromone are required for normal cell fusion, and several proteins that function specifically in these processes (a-factor, α-factor, Ste2p, Fus1p, and Fus2p) are all highly localized to projections or their tips (Trueheart and Fink, 1989; Jackson et al., 1991; Sprague and Thorner, 1992; Elion et al., 1995). Many cell polarity genes also function in the cell fusion pathway as indicated by the increase in cell fusion defects observed for mutants in a number of such genes (e.g., SPA2, PEA2, BNI1, RVS161) (Dorer et al., 1997). These observations suggest that efficient cell fusion is likely to depend on proper cell polarity to affect localization of the signaling and cell fusion components to the projection tip.
In contrast to our extensive knowledge of the components of the mating signal transduction cascade and their interactions, relatively few proteins are known to be specifically involved in the various downstream events of the mating process (Sprague and Thorner, 1992; Brill et al., 1994; Choi et al., 1994; Stevenson et al., 1995). For example, most of the polarity components known to affect mating cell shape and growth also participate in vegetative functions (Herskowitz et al., 1995; Pringle et al., 1995; Roemer et al., 1996). Thus, it is likely that certain mating-specific components remain undescribed that link general polarity proteins to specified sites of cell growth during mating. Some of these components would be expected to help direct the growth and shape of the mating projection. Understanding the downstream events of the mating process, including cell polarization, cell fusion, and nuclear fusion, is of general importance to elucidating these processes in higher eukaryotic cells. The limited number of downstream genes currently identified as functioning in these processes suggested that a search for new pheromone-regulated genes might yield additional components of the mating pathway, and thereby help determine the molecular and cellular mechanisms involved in mating cell differentiation.
We describe the results of an extensive screen for pheromone-regulated genes. The screen uses a recently developed method of random transposon tagging of yeast genes to monitor gene expression and investigate mutant phenotypes (Burns et al., 1994). From an initial bank of 189 pheromone-regulated transposon insertions, 45 new pheromone-regulated genes were identified. Among these 45 genes, 30 represent novel genes and 15 encode genes whose expression was previously unknown to be affected by pheromone. Furthermore, we find that a subset of pheromone-induced genes are also induced by conditions of nitrogen deprivation, suggesting a set of target genes is shared between the mating and pseudohyphal pathways. Four novel pheromone-induced genes designated Factor- Induced Gene FIG1, FIG2, KAR5/FIG3, and FIG4 were determined to be required for different steps of mating cell differentiation, including the control of mating cell polarity, cell fusion, and nuclear fusion.
Materials and Methods
Yeast Strains and General Methods
The yeast strains used in this study are listed in Table VIII. All strains are derivatives of Y800 (Burns et al., 1994) and in the S288c background. Y1406, the diploid strain used in the screen, was constructed by transforming strain Y1400 MAT a -cry1 ura3-52 leu2-Δ98 his3-Δ200 trp1-Δ1 with a PCR fragment (Baudin et al., 1993) containing the BAR1 gene, in which the entire protein coding sequence was substituted with the sequence of the HIS3 gene. The resulting strain, Y1402, was used to construct Y1405 (MAT a-cry1/MATα-CRY1 bar1::HIS3/bar1::HIS3) through backcrossing. A MAT a -cry1/MAT a -cry1 mitotic recombinant Y1406 was selected from Y1405 by growth on plates containing crytopleurorine and then confirmed to be a diploid by transformation of a MATα plasmid, sporulation, and tetrad analysis. Y1411, the MAT a bar1 haploid strain used for screening is an ascospore segregant derived in the construction of Y1405. General cloning procedures are described in Sambrook et al. (1989). Yeast media and methods are presented in Rose et al. (1990) and Sherman (1986).
Table VIII.
Strain List
| Strain | Genotype | |
|---|---|---|
| Y800 | MAT a cryr/MATα CRY ura3-52/ura3-52 leu2-Δ98/leu2-Δ98 HIS3/his3-Δ200 TRP1/trp1-Δ1 | |
| Y1400 | MAT a cryr ura3-52 leu2-Δ98 his3-Δ200 trp1-Δ1 | |
| Y1401 | MATα CRY ura3-52 leu2-Δ98 his3-Δ200 TRP1 | |
| Y1402 | MAT a cryr ura3-52 leu2-Δ98/leu2-Δ98 his3-Δ200 trp1-Δ1 bar1::HIS3 | |
| Y1405 | MAT a cryr/MATα CRY ura3-52/ura3-52 leu2-Δ98/leu2-Δ98 his3-Δ200/his3-Δ200 TRP1/trp1-Δ1 bar1::HIS3/bar1::HIS3 | |
| Y1406 | MAT a cryr/MAT a cryr ura3-52/ura3-52 leu2-Δ98/leu2-Δ98 his3-Δ200/his3-Δ200 TRP1/trp1-Δ1 bar1::HIS3/bar1::HIS3 | |
| Y1411 | MAT a cryr ura3-52 leu2-Δ98 his3-Δ200 trp1-Δ1 bar1::HIS3 | |
| Y1407 | MAT a ura3-52 his3-Δ200 TRP1 | |
| Y1408 | MATα ura3-52 HIS3 trp1-Δ1 | |
| Y1409 | MAT a his3-Δ200 TRP1 fig1::URA3 | |
| Y1410 | MATα ura3-52 HIS3 trp1-Δ1 fig1::URA3 | |
| Y1411 | MAT a ura3-52 his3-Δ200 TRP1 fig2::URA3 | |
| Y1412 | MATα ura3-52 HIS3 trp1-Δ1 fig2::URA3 | |
| Y1421 | MAT a ura3-52 his3-Δ200 TRP1 kar5/fig3::URA3 | |
| Y1422 | MATα ura3-52 HIS3 trp1-Δ1 kar5/fig3::URA3 | |
| Y1433 | MAT a ura3-52 his3-Δ200 TRP1 fig4::URA3 | |
| Y1434 | MATα ura3-52 HIS3 trp1-Δ1 fig4::URA3 | |
| Y1450 | MAT a sst2 | |
| Y1451 | MATα sst2 | |
All strains from the Snyder laboratory collection.
Identification of Pheromone-regulated Genes
The plate assay for detection of pheromone-induced genes was first optimized using two Y1406 strains: one containing a cik1::lacZ fusion carried on a YCp50 plasmid and the other a FUS1::lacZ fusion carried on a 2 μ-based plasmid (Trueheart et al., 1987; Page and Snyder, 1992). Cells were grown on yeast extract/peptone/dextrose medium (YPD) plates and then replica-plated to two 1-mm filters (Whatman Inc., Clifton, NY). The duplicate filters were incubated for an additional 6 h on YPD medium and then transferred to petri dishes containing 0.8 ml of liquid YPD medium, one of which contained 5 μg/ml of α-factor (Sigma Chemical Co., St. Louis, MO). After incubation at 30°C, the filters containing cells were exposed to chloroform vapors to permeabilize the cells, and then the filters were incubated on plates containing X-gal as described previously (Xie et al., 1993). In initial optimization experiments, cells were incubated for 6, 8, 10, and 12 h at 30°C, and then processed for β-gal activity. Optimal signals were observed using pheromone incubation times of 10–12 h, which were used in screening experiments.
A yeast lacZ fusion library (Burns et al., 1994) was transformed into strains Y1406 and Y1411. 55,000 Y1406 and 36,200 Y1411 Leu+ transformants were patched on 90-mm petri plates containing synthetic complete (SC) medium lacking leucine (100 transformants/plate). After growth for 2 or 3 d at 30°C, the cells were replica-plated to two filters and incubated on YPD plates for an additional 6–12 h. Filters were processed as described above and strains containing potential pheromone-regulated fusions were identified. Individual strains were then retested as single colonies to identify strains that contained reproducibly pheromone-regulated fusions. 14% of yeast strains expressed β-gal after vegetative growth for a total of ∼13,000 strains. Since there are ∼6,500 yeast genes in yeast (Mewes et al., 1997), this corresponds to 2.0 genome equivalents screened. Therefore, 158 out of 189 pheromone-regulated fusions corresponds to 1.7 genome equivalents analyzed.
The yeast sequence adjacent to the mTn3::lacZ insertion was determined using plasmid rescue procedures described previously (Burns et al., 1994, 1996). Briefly, either YIp5 or pRSQ plasmids were integrated into the mTn3 insertion, and the yeast sequences adjacent to lacZ were recovered as plasmids in Escherichia coli. A primer complementary to the end of the lacZ sequence was used to determine the sequences of the yeast DNA adjacent to the mTn3 insertions. The yeast sequences were compared to those in the GenBank database using the BLAST program (Altschul et al., 1990). These sequences (see Table I) are accessible in GenBank by a search using keywords Pheromone and the fusion number of interest (e.g., P158). Pheromone response element (PRE) sites were identified by searching sequences using the Fitconsensus program of the UWGCG package (Devereaux et al., 1984) and the sites described in (Kronstad et al., 1987).
Table I.
Summary of Pheromone-regulated Genes
| Strain # ‡ | Fu- sions§ | Gene | Function/comments | Codon/total‖ | Veg. exp. ¶ | Pher. exp. ¶ | Phenotypes** | Reference | ||||||||
|---|---|---|---|---|---|---|---|---|---|---|---|---|---|---|---|---|
| A. Known pheromone-induced genes | ||||||||||||||||
| P374A, P34B-1, P253B, P260B, P105A-2, ... | 26 | Ty1, Ty2 | Transposable elements; fusions in both TyA and TyB were identified | 163/TyA, 245/TyA, 335*/TyA, 633/TyB, 719/TyB | − | ++++ | Not tested | Boeke and Sandmeyer (1991) | ||||||||
| P5A, P17A, P50A-2, P56B, P108A, ... | 22 | Ty3/ Sigma | Transposable element | Not mapped | − | ++++ | Not tested | Boeke and Sandmeyer (1991) | ||||||||
| P103A, P105A-1, P161A, P225A, P606-A, P606-B, P643 | 7 | FUS2 | Cell fusion | 86/617, 343/617, 343/617, 327/617, 263*/617, 273/617 | − | ++++ | Not tested | Elion et al. (1995) | ||||||||
| P342A, P354B-2, P569A, P695A, P806 | 5 | PCL2 | Pho85 cyclin | 2/332, 181/332, 2/332,2/332, 2/332 | − | + | None | Measday et al. (1994) | ||||||||
| P6C | 1 | AFR1 | Polar growth, adaptation | 159/620 | ++ | +++ | Not tested | Konopka (1993) | ||||||||
| P763 | 1 | KAR4/ YCL055w | Karyogamy | 180/336 | ++ | ++++ | Not tested | Kurihara et al. (1996) | ||||||||
| P524B | 1 | CIK1 | Kar3 microtubule motor component | 537/594 | + | +++ | Not tested | Page and Sny- der (1992) | ||||||||
| P372B | 1 | STE6 | Mating factor transporter | 400/1290 | ++ | +++ | Not tested | Kuchler et al. (1989) | ||||||||
| P129B | 1 | 3′ to GPA1 | G protein, signaling | * | + | ++ | Not tested | Dietzel and Kurjan (1987); Miyajima et al. (1987) | ||||||||
| B. Previously characterized genes not known to be pheromone regulated | ||||||||||||||||
| P269B, P398A, P306A, P357A, P436A-2, ... | 19 | SPO11 | Meiosis, recombination | 50/398, 68/398, 175/398, 300/398, 322/398 | +++ | ++++ | Not tested | Atcheson et al. (1987) | ||||||||
| P50A-1, P59A, P61A, P97B, P105B, ... | 10 | HOG1 region | Osmotic stress response | * | − | +++ | Not tested | Brewster et al. (1993) | ||||||||
| P27B, P145B, P209B | 3 | 28S rRNA | Ribosomal RNA | * | ++ | +++ | Not tested | Valenzuela et al. (1977) | ||||||||
| P177A, P641 | 2 | Ty5 | Transposable element LTR; P177 adjacent to element but not in ORF; P641 lies between YHL048w and 231-bp Ty5 LTR | * | − | ++++ | Not tested | Voytas and Boeke (1992) | ||||||||
| P431B, P523C | 2 | RVS161 | Actin cytoskeleton | 54/265, 86/265 | ++ | +++ | None | Crouzet et al. (1992) | ||||||||
| P500A-2 | 1 | YCK3/ CK13 | Casein kinase III subunit | 504/525 | − | ++ | None | Stanford Geno- mic Database | ||||||||
| P33B | 1 | PMR2 | Plasma membrane Na+ Ion pump | 1020/1092 | − | ± | Not tested | Wieland, J. et al. (1995) | ||||||||
| P157B | 1 | RAP1 region | Chromatin/telomere function; fusion on opposite strand | 80/101 | +++ | ++++ | Not tested | Shore and Nasmyth (1987) | ||||||||
| P86B | 1 | TOP2 | Topoisomerase | 1181/1429 | +++ | ++++ | Not tested | Giaever et al. (1986) | ||||||||
| P7A | 1 | YL8B | Ribosomal protein YL8B | 144/244 | − | + | Not tested | Mizuta et al. (1995) | ||||||||
| C. Novel pheromone-regulated genes | ||||||||||||||||
| P299A, P315A, P452A, P487A, P796, P808 | 6 | YSC8010 region | All fusions lie in small ORF between YM8010.05 and YM8010.06 | 26/87, 16*/87, 72/87, 7*/87, 72/87, 26/87 | − | +++ | Not tested | |||||||||
| P403A-2, P332B, P221B-2, P358A | 4 | FIG4/ YNL325c | Required for efficient mating, SAC1 homology domain | 536/879, 536*/879 553/879, 604/879 | + | ++ | None | |||||||||
| continued | ||||||||||||||||
| P28A, P787 | 2 | YFL027c | ORF divergent from STE2 | 163/498, 50/498 | − | +++ | None | |||||||||
| P726A, P900 | 2 | KAR5/ FIG3 | Required for efficient mating, extensive coiled-coil domain | 258/504, 258/504 | − | +++ | Karyogamy defect | Kurihara et al. (1994), this study | ||||||||
| P158A | 1 | FIG1/ YBR040w | Required for efficient mating, 4 TM domains | 101/298 | − | ++ | EGTA sensitive for mating | This study | ||||||||
| P294A | 1 | FIG2/ YCR089w | Required for efficient mating, signal peptide/GPI anchor | 140/1609 | − | +++ | Cold sensi- tive for mating | This study | ||||||||
| P258B | 1 | YAR027w | Ycr7p homology, two predicted transmembrane domains, Sigma element upstream | 50/235 | ++ | +++ | None | |||||||||
| P290A-2 | 1 | YPL156c | Predicted transmembrane domain | 67*/284 | + | ++ | None | |||||||||
| P403A-1 | 1 | YER188w | 98/239 | − | ± | None | ||||||||||
| P411B-1 | 1 | ADP1/ YCR011c | Predicted member of ABC transporter superfamily | 874/1049 | + | ++ | None | |||||||||
| P9B | 1 | YGR111w | Probable lysine degradation enzyme, similarity to lysine N6-acetyl-transferases | 309/400 | ± | + | Not tested | |||||||||
| P510B | 1 | YIL083c | Adjacent to Sigma element | 133/365 | + | +/++ | Not tested | |||||||||
| P569B | 1 | YNL033w | 180/284 | − | + | Not tested | ||||||||||
| P50B | 1 | YKR090w region | Short ORF on opposite strand from YKR090w, adjacent fusion found in YKR091w | 32/39 | − | ++ | Not tested | |||||||||
| P353A | 1 | YKR091w region | * | − | + | Not tested | ||||||||||
| P313B | 1 | AFR1 region | ORF is divergent to AFR1 | 15/79 | ++ | +++ | Not tested | |||||||||
| P870 | 1 | 28S rRNA 3′ region | Short ORF | 15/25 | − | ++ | Not tested | |||||||||
| P390A-2 | 1 | YNL146w | Short ORF, divergent from MFA2 | 14*/100 | ± | ++ | None | |||||||||
| P359A | 1 | ALK1/ YGL021w region | Fusion in short ORF | 18/43 | + | +++ | None | |||||||||
| P346B | 1 | YKR106w region | Short ORF | 2/20 | − | ++ | Not tested | |||||||||
| P681 | 1 | YHR164c- YHR165c region | Short ORF | 9/17 | ++ | +++ | Not tested | |||||||||
| P914 | 1 | TIF5- YPR039C region | Short ORF | 11/12 | − | ++ | Not tested | |||||||||
| P160A, P187A | 2 | YNR062c- YNR063w region | Identical insertions | * | + | ++ | None | |||||||||
| P28B-2 | 1 | YSCP9584: P9584.4 | Large cluster of Ty and Delta elements 1,673-bp 3′ to indicated ORF | * | ++ | +++ | None | |||||||||
| P356B | 1 | CDC91 region | Downstream of CDC91 | * | + | +/++ | Not tested | |||||||||
| P430B | 1 | YLR057w | Within YLR057w, not in frame | * | − | ++ | Not tested | |||||||||
| P439B | 1 | CHRXV | Between ORFs PID:g600477 and PID:g600478 | * | +++ | +++/ ++++ | Not tested | |||||||||
| P482B | 1 | YNR069c-YNR- 070w region | * | ± | + | None | ||||||||||
| D. Pheromone-repressed genes | ||||||||||||||||
| P205B | 1 | PHO81 | Negative regulator of PCL –PHO85 complexes | 707/1177 | ++ | + | None | Ogawa et al. (1993) | ||||||||
| continued | ||||||||||||||||
| P591 | 1 | FOX2 | Peroxisome biogenesis, fusion located at 44-bp upstream of FOX2 ATG | * | ++ | ± | Not tested | Hiltunen et al. (1992) | ||||||||
| P323B | 1 | QOR1 | Predicted mitochondrial quinone oxidoreductase, fusion located within coding sequence, but not in frame | * | +++ | ++ | Not tested | |||||||||
| E. Pheromone and nitrogen-regulated genes†† | ||||||||||||||||
| P2B, P33A | 2 | PHD1 | Promoter of pseudohyphal growth | 159/367, 308/367 | ++ | +++ | None | Gimeno and Fink (1994) | ||||||||
| P274A, P319B-2, P520A, P534C | 4 | GAP1 | General amino acid permease, P319B-2 out of frame at indicated codon | 421/601, 392*/601, 466/601, 595/601 | ++ | ++++ | Not tested | Jauniaux and Grenson (1990) | ||||||||
| P809, P820 | 2 | DUR1,2 | Urea amidolyase | 83/1835 | ± | ++ | Not tested | Genbauffe and Cooper (1991) | ||||||||
| P713 | 1 | AMD1 | Putative amidase | 173/549 | + | ++ | Not tested | Chang and Abelson (1990) | ||||||||
| P104A | 1 | YFL056c | Aryl alcohol dehydrogenase homolog | 72/212 | ++ | +++ | None | Reiser et al. (1994) | ||||||||
In cases where there are more than seven fusions, five representative fusions were selected for inclusion.
Represents total number of fusions obtained in the screen, independent and non independent.
Fusions that either lie out of frame within or outside of open reading frames are denoted by
, for the case of GPA1 the fusion lies in a short ORF, 50 amino acids, and was assigned to the nearest large ORF.
Based on qualitative X-gal plate assays as depicted in Fig. 1; expression levels range from (−) not detectably expressed to (++++) very strongly expressed.
Mating phenotypes examined in this study as described in Materials and Methods.
A subset of the fusions as described in the text were examined by qualitative X-gal plate assays for induction by low nitrogen conditions. Low nitrogen induction of this group of fusions was confirmed by quantitative β-gal assays and/or previous studies (see text).
Quantitative β-galactosidase (β-gal) Assays
Cells of the indicated strains were grown to midlogarithmic phase (OD600 = 0.4) in SC medium lacking leucine and then divided into two 10-ml aliquots. To determine pheromone induction levels, cells were treated for 2 h in YPD or YPD + 5 μg/ml of α-factor, after which cell lysates were prepared and β-gal activities were measured. Low nitrogen induction levels were measured by comparison of activities in cell lysates of cells grown for 12 h in SC lacking leucine or SC lacking both leucine and (NH4)2SO4. Cells were harvested by centrifugation, washed once in Z buffer (60 mM Na2HPO4, 40 mM NaH2PO4, 10 mM KCl, 1 mM MgSO4, 50 mM β-mercaptoethanol, pH 7.0) and the cell pellet frozen at 70°C until use. Cells were prepared for lysis by resuspending the frozen cell pellet in 0.5 ml of Z buffer, and followed by the addition of 250 μg zymolyase 100T to spheroplast cells (30 min at 30°C). Lysates were made by the addition of ∼50 μl of glass beads (model G-8772; Sigma Chemical Co.), 15 μl of 100 mM PMSF, 7.5 μl of 20% SDS, and 25 μl of chloroform followed by vortexing for 2 min. Assays of β-gal activity were performed by the addition of 200 μl of the lysate to 0.8 ml of Z buffer and 200 μl of 4 mg/ml O-nitrophenol-β-d-galactopyranoside. Reactions were stopped with 250 μl of 2 M Na2CO3, and then the activities were determined as a function of sample absorbance at 420nm, reaction time, and protein concentration (determined by Bradford assays).
Disruption of FIG1, FIG2, KAR5/FIG3, and FIG4
Complete deletions of the FIG1, FIG2, KAR5/FIG3, and FIG4 genes were made using a PCR disruption procedure (Baudin et al., 1993). Oligonucleotides containing the 55 bp immediately upstream of the ATG and downstream of the termination codon of each gene were synthesized with ends corresponding to sequences A and B below, respectively. Sequences A and B are complementary to regions that flank the URA3 gene of pRS316 (Sikorski and Hieter, 1989). URA3 fragments containing FIG flanking sequences were amplified by PCR and then transformed into the diploid strain Y800. Strains containing the correct substitution at the genomic locus were identified by PCR analysis. The resulting heterozygotes were sporulated and then haploid segregants were analyzed for vegetative growth and mating defects. Growth rates of all figΔ strains were identical to those of wild-type strains at 16, 30 and 37°C. (A) 5′-...AGGCGCGTTTCGGTGATGACGGTG; (B) 5′-...AGGGTGATGGTTCACGTAGTGGGC.
Localization of Fig1::β-gal and Fig2::β-gal Proteins
MAT a cells of the indicated strains were grown to midlogarithmic phase (OD600 = 0.3–0.4) in YPD, divided into 10-ml cultures, and then incubated for 2 h in either the presence or absence of 5 μg/ml α-factor. Cells were harvested, fixed, and processed for immunofluorescence as described (Gehrung and Snyder, 1990; Pringle et al., 1991). To visualize β-gal fusion proteins, a rabbit anti–β-gal primary antibody (Cappel Laboratories, Malvern, PA) was used at 1:12, followed by a CY3-conjugated sheep anti–rabbit secondary antibody (Sigma Chemical Co.) used at 1:200. All antibodies were preadsorbed against fixed and spheroplasted yeast cells before use.
Analysis of Yeast Mating Defects
Haploid strains containing the lacZ fusion insertion mutations were recovered by transforming the heterozygous MAT a/MAT a diploid strain with a YCp50 plasmid containing the MATα gene (gift of F. Cross, Rockefeller University, NY) followed by sporulation of the transformants. MAT a segregants containing the transposon insertion mutation were recovered and mated to strain Y1402. MAT a and MATα segregants were then obtained and tested for mating defects. Unilateral matings were carried out between MAT a mutant strains and strain Y1408. Bilateral matings were performed between MAT a and MATα segregants carrying either the same transposon insertion mutation or deletion. Diploids from the matings were selected on SC medium lacking histidine and tryptophan. Liquid mating reactions were carried out as described in Gehrung and Snyder (1990); agents such as polyethylene glycol (PEG)3350, EGTA, α-factor, and polymyxin-B sulfate (Sigma Chemical Co.) were added to the tester strains immediately before addition of the strains whose mating efficiency was being measured. Relative mating efficiencies given in Table IV represent the mean of two separate assays and are normalized to wild-type levels (1.0% diploid formation). Filter mating assays were performed as described in Sprague (1991). Under these conditions, the wild-type frequency of diploid formation was 51.8 ± 1.3%; similar relative frequencies of mating were observed for fig1Δ and fig4Δ strains. fig2Δ strains exhibit a slight (1.5×) increase in cell number/OD600 of cells. However, this cannot account for the increase in mating efficiency of fig2Δ mutants in unilateral and bilateral matings under liquid conditions: experiments in which the density of cells in wild-type control matings similarly increased, or fig2Δ cells decreased, did not show comparable increases in mating efficiency (data not shown).
Table IV.
Relative Mating Efficiencies of Wild-type, fig1Δ, fig2Δ, kar5Δ/fig3Δ and fig4Δ Strains
| Strains | 30°C | 16°C | Filter | PEG | α factor | EGTA | Polymyxin B | |||||||||||
|---|---|---|---|---|---|---|---|---|---|---|---|---|---|---|---|---|---|---|
| 30°C | 6.7% | 33 μg/ml | 7.5 mM | 15 mM | 5 μg/ml | 10 μg/ml | ||||||||||||
| WT × WT | 1.0 ± 0.4 | 1.0 | 1.0 | 1.0 | 1.0 | 1.0 | 1.0 | 1.0 | 1.0 | |||||||||
| (−7.5×) | (+7.6×) | (−29.0×) | (−2.0×) | (−3.6×) | (−7.7×) | (−29.6×) | ||||||||||||
| fig1Δ × WT | −1.2 ± 0.0 | −1.0 | — | +0.7 | −0.8 | −1.0 | −1.0 | −0.7 | −1.7 | |||||||||
| fig1Δ × fig1Δ | −2.5 ± 0.2 | −1.4 | −3.3 | +1.1 | −0.8 | −1.8 | −3.1 | −3.4 | ⩾3.4‡ | |||||||||
| fig2Δ × WT | +7.2 ± 1.6 | −4.7 | — | +0.3 | −0.8 | −1.0 | −0.8 | −1.0 | −0.6 | |||||||||
| fig2Δ × fig2Δ | +3.2 ± 1.2 | −18.0 | −6.6 | 0.2 | −1.0 | −1.5 | −1.4 | −5.3 | −2.7 | |||||||||
| kar5Δ/fig3Δ × WT | −1.2 ± 0.2 | — | — | — | — | — | — | — | — | |||||||||
| kar5Δ/fig3Δ × kar5Δ/fig3Δ | −77.4 ± 15* | — | — | — | — | — | — | — | — | |||||||||
| fig4Δ × WT | −1.4 ± 0.25 | −1.0 | — | +1.0 | −1.4 | −0.8 | −0.6 | −1.0 | −0.8 | |||||||||
| fig4Δ × fig4Δ | −2.9 ± 1.2 | −0.8 | −2.5 | +1.7 | −1.2 | −0.6 | −1.0 | −0.7 | −0.4 | |||||||||
For each mating condition, the fold difference relative to wild-type matings (1.0) is presented. For wild strains, the values in parentheses are the differences in mating efficiency relative to 30°C. The relative mating efficiency at 34.5°C is similar to the results reported for 30°C.
The mating efficiency is estimated based on the number of large colonies. The mating defect is probably larger than this; see text.
This is a minimum estimate; no diploids were observed on one of the plates.
Projection formation was analyzed by two methods. To assess projection formation in the presence of isotropic pheromone, cultures of mutant strains were grown to OD600 = 0.3–0.5 and α-factor was then added to final concentrations of 0.5, 1.0, 2.5, and 5 μg/ml. Second, after incubation for 1, 2, and 4 h, cell morphologies were examined by phase-contrast microscopy. Under these conditions in our strain background, cell cycle arrest is observed at the lowest pheromone concentration and polarized cells with broad projections are formed at intermediate concentrations, whereas sharp mating projections are formed at the highest concentration.
Polarized projection formation and zygote morphologies were also analyzed for the figΔ strains by quantitation of different cell types present in mating mixes. For these assays, cultures of mutant strains were grown to OD600 = 0.5, and then 2 ml of each were mixed and pelleted by low-speed centrifugation. Mating cells were then resuspended in 5 ml of fresh YPAD and allowed to mate for either 8 h at 30°C or 16 h at 16°C without shaking. After incubation, cells were fixed by the addition of formaldehyde to a final concentration of 3.7% for ⩾1 h, sonicated briefly to disperse cells and zygotes, and then washed and stored in 1× PBS, 1 M sorbitol. Cell mixtures were prepared for microscopy by pelleting an aliquot of the mating mix and resuspending in mounting solution containing 4′,6-diamidino-Z-phenylindole (DAPI) (70% glycerol, 30% PBS, 2% wt/vol n-propyl gallate, 0.0225 μg/ml DAPI). The scoring of cell type (round, small, or large polarized) was done by placing an aliquot of the fixed cells in a haemocytometer to facilitate counting. Round cells were scored as unpolarized; polarized cells contained projections and were counted as small–medium (with an overall length less than that of a typical zygote), or large (equal to or larger in length than a typical zygote). Quantitation of projection tip shape was determined by scoring medium to large cells, as these cells have longer projections, the shape of which (pointed or blunt) are most clearly differentiated. When indicated, staining of cytoplasmic membranes and lipids was done after fixation by addition of FM4-64 (Molecular Probes, Inc., Eugene, OR) to 33 μM final concentration, followed by incubation of the cells on ice for 30 min. Cells were then washed once in 1× PBS, 1 M sorbitol before resuspending in mounting solution containing DAPI. Under these conditions (i.e., in formaldehyde-fixed cells) FM4-64 uniformly stains the cytoplasm and nucleus, but is absent from cell wall material as judged by both the reduced diameter of the staining region relative to the cell outline (as viewed by differential interference–contrast microscopy [DIC] optics), and by the absence of staining at sites of cytokinesis in budded cells. Measurements of zygotes comparing fusion bridge width to the mean width of the parental pair were performed using an intraocular micrometer at a magnification of 1600×. 50 zygotes were measured for each strain.
Electron microscopy of thin sections through zygotes was as described in Byers and Goetsch (1975), with the following differences. Zygotes were prepared by mating cells as described above; they were pelleted, washed once in 2 ml 0.1 M cacodylate buffer, pH 7.4, and then fixed in 0.1 M cacodylate, pH 7.4, containing fresh 3% glutaraldehyde for 30 min at room temperature. Cells and zygotes were then washed once in 0.1 M cacodylate buffer and then stained with 4% KMnO4, followed by dehydration through a series of ethanol washes, and then embedded in LR-White acrylic resin (Polysciences Inc., Warrington, PA) before sectioning. Sections were stained with uranyl acetate and lead citrate and then viewed on an electron microscope (model EM-109; Carl Zeiss, Inc., Thornwood, NY) at magnifications of 8–40,000×. Pheromone sensitivity of the different strains was assayed by the halo method using strains Y1450 and Y1451 (Sprague, 1991).
Results
Isolation of Pheromone-regulated Genes
To identify genes specifically regulated during yeast mating, a random lacZ insertional mutagenesis scheme was used. This method uses a library of yeast DNA fragments containing mini-Tn3::lacZ::LEU2 insertions (Burns et al., 1994). The lacZ gene lies near one end of the insertion and lacks an ATG initiator methionine codon; therefore, expression in yeast is primarily expected to occur because of in-frame insertion into yeast genes to produce yeast protein::β-gal fusions. The library was introduced into either a diploid MAT a/MAT a leu2Δ/leu2Δ bar1Δ/bar1Δ or a haploid MAT a leu2Δ bar1Δ yeast strain, and then transformants that exhibited enhanced or reduced expression of β-gal in the presence of the α-factor mating pheromone were identified. The use of a diploid strain allows for the isolation of pheromone-regulated genes that are essential for vegetative growth, whereas the use of strains that lack the Bar1 protease degrades α-factor increases the responsiveness of the cells to pheromone under our screening conditions. To facilitate screening large numbers of transformants, an X-gal plate assay for identifying pheromone regulated β-gal fusions was developed and then optimized using two yeast strains expressing β-gal fusions with known pheromone-induced proteins, Fus1p and Cik1p (refer to Materials and Methods; Trueheart et al., 1987; Page and Snyder, 1992).
55,000 transformants of a diploid strain and 36,200 transformants of a haploid strain were screened for β-gal expression in the presence and absence of α-factor. 186 strains were identified that reproducibly exhibited increased β-gal activity after pheromone treatment; three strains displayed decreased activity after treatment. Examples of the pheromone regulated–β-gal expression levels observed for lacZ fusions in the four novel FIG genes further characterized in this study, and an example of the class of pheromone-repressed genes are presented in Fig. 1.
Figure 1.

Examples of pheromone-regulated lacZ fusions. Seven yeast strains containing the lacZ fusions indicated were incubated in YPD medium in either the absence (left) or presence (right) of pheromone for 12 h. Examples are shown of strains with fusions in genes whose expression is dependent upon mating pheromone (FUS2, FIG1, FIG2, and FIG4), enhanced by pheromone (CIK1, KAR5/FIG3), or repressed by pheromone (FOX2).
To determine the identity of the pheromone-regulated yeast genes producing the β-gal fusion proteins, the yeast genomic DNA adjacent to the lacZ insertions was plasmid-rescued into E. coli and then sequenced for 158 fusion strains (Burns et al., 1994). A summary of these results and the relative levels of vegetative and pheromone-induced (or -repressed) expression for the different pheromone-regulated genes identified in this study is presented in Table I. Based on the combined criteria of expression pattern and sequence identity, the fusions occur in genes that can be classified into five major categories: (a) known pheromone-induced genes; (b) previously characterized genes not reported to be induced by pheromone; (c) novel pheromone-induced genes; (d) pheromone-repressed genes; and (e) pheromone- and nitrogen-regulated genes.
Comparison of the number of genes identified by our screen to the total number of reported pheromone- induced genes (∼22, Sprague and Thorner, 1992; Table I), along with the observation that many genes are represented by only one or two transposon fusions, indicates that our screen is not yet saturated. However, many genes are represented by multiple independent insertions. Extrapolating from the number of different genes identified, 54, and the 1.7 genome equivalents screened and analyzed (refer to Materials and Methods), we estimate there are ∼67 different pheromone-regulated genes in yeast. This number is probably an underestimate because our transposon mutagenesis procedures have certain biases as shown by the overrepresentation of fusions to SPO11 and HOG1 (Burns et al., 1994). A larger and probably more accurate figure of 132 genes is obtained if we extrapolate from the number of pheromone-induced genes identified in our screen, nine, with those already known. Thus, we conclude there are ∼67–132 pheromone-induced genes in yeast, thereby comprising 1–2% of all yeast genes.
Several Types of Genes Respond to Mating Pheromone
65 insertions reside in nine known pheromone-induced genes including STE6, FUS2, PCL2, CIK1, AFR1, KAR4, and Ty elements (see Table I for references). Ty1, Ty2, and Ty3 were previously known to be pheromone-induced (Boeke and Sandmeyer, 1991; Sprague and Thorner, 1992; Kurihara et al., 1996); our study indicates that the expression of Ty5 elements is also induced. Ty elements and their long terminal repeats (LTRs) are abundant in the genome (Olson, 1991), and comprise a large fraction (50 out of 158) of the pheromone-induced fusions identified in this screen. Additionally, some of the genes identified in this study are located adjacent to known pheromone-induced genes (see Table I). Examples include fusion P313B, which lies in an open reading frame (ORF) adjacent to AFR1, and the fusions in YFL027c (P28) and the HOG1 gene (P423A), which lie next to STE2 and a Ty LTR delta sequence, respectively. It is likely that the nearby regulatory sequences affect the expression of these genes as documented previously for Ty elements (Van Arsdell et al., 1987; Company et al., 1988). Some of these cross-regulated genes may also perform functions in the mating pathway.
In addition to known pheromone-induced genes, many genes (13) had been identified previously, but were not known to be pheromone-induced (Table I B). These include SPO11, HOG1, CKI3/YCK3, and RVS161. SPO11 is a sporulation-induced gene required in the early steps of meiosis. HOG1 is a MAP kinase homologue that regulates the osmotic stress response (Brewster et al., 1993). CKI3/ YCK3 is a homologue of the yeast casein kinase I–related genes YCK1, YCK2, and HRR25, and has recently been identified as a high copy suppressor of gcs1 mutants, which are defective in exit from stationary phase (Wang et al., 1996). RVS161, previously characterized as playing a role in actin cytoskeletal functions and cell polarity, has recently been described as important for efficient cell fusion and mating under certain conditions (Crouzet et al., 1991; Dorer et al., 1997). The induced expression of these genes during pheromone response suggests that many of these genes may function in the mating process.
A surprising subset of the pheromone-induced genes identified in this study include genes which are known, or can be expected to participate in pseudohyphal growth and/or in nitrogen metabolism, a determinant of pseudohyphal growth (Gimeno et al., 1992; Ljungdahl et al., 1992). These genes include PHD1, YFL056c, GAP1, AMD1, DUR1,2, and potentially YGR111w. PHD1 was originally isolated as a gene that, when present in multiple copies, promotes pseudohyphal growth (Gimeno and Fink, 1994). YFL056c encodes a protein with 57% amino acid identity over the first 174 of its 212 residues to an aryl alcohol dehydrogenase from the white-rot fungus Phanerochaete chrysosporium. In that organism, the gene is induced by nitrogen starvation conditions, and its product is implicated in lignin degradation (Reiser et al., 1994). The degradation of lignins, an important constituent of plant cell walls, facilitates fungal invasion into host plant tissues. GAP1 and AMD1 encode a general amino acid permease and AMD1 encodes a putative amidase. YGR111w encodes a probable lysine N6-acetyltransferase, an enzyme involved in the degradation of lysine. DUR1,2 encodes a urea amidolyase that converts urea to ammonia. The functions of these last four genes are likely to permit the efficient use of alternative nitrogen sources such as those provided by amino acids. PHD1, GAP1, AMD1, and DUR1,2 (Table I E) are each induced by nitrogen starvation (Table III), as has been shown previously for DUR1,2 and GAP1 (Jauniaux and Grenson, 1990; Stanbrough and Magasanik, 1995).
Table III.
Induction of Gene Expression by Low Nitrogen Medium
| Gene | Fusion | Low nitrogen induction | ||
|---|---|---|---|---|
| GAP1 | P534C | 276.8 | ||
| DUR1,2 | P809 | 35.7 | ||
| AMD1 | P713 | 27.8 | ||
| PHD1 | P33A | 13.5 | ||
| YFL056c | P104A | 3.0 |
Another class of pheromone-regulated genes display decreased expression in pheromone-treated cells. The three pheromone-repressed genes we identified include: PHO81, FOX2, and a novel gene, QOR1 (refer to Fig. 1 for the pheromone-dependent repression of FOX2 expression). PHO81 encodes a repressor of the Pho85 CDK–G1 kinase complex (Ogawa et al., 1995), FOX2 functions in peroxisome biogenesis (Kunau and Hartig, 1992), and QOR1 has strong similarity to quinone oxidoreductases, suggesting a function in oxidative respiration in mitochondria. The relatively limited number of pheromone-repressed genes identified may be the result of the long half-life (∼20 h) of β-gal in yeast (Bachmair et al., 1992); this could make many pheromone-repressed genes difficult to identify in the 12-h pheromone incubation used in our screen. Surprisingly, the FOX2 and QOR1 β-gal fusions are not in-frame. However, it is likely that these out-of-frame fusions reflect the normal regulation patterns of these genes. In a separate study, we have prepared an in-frame fusion in the QOR1 gene (Minehart, S., S. Erdman, and M. Snyder, unpublished data). Although the absolute levels of expression for the original out-of-frame fusion strain were lower, as expected, both the in- and out-of-frame fusions exhibited similar relative levels and kinetics of β-gal induction (expression of QOR1 is induced by carbon source changes at the diauxic shift) and pheromone repression. Interestingly, each of the pheromone-repressed genes is likely to be subject to glucose repression; possible mechanisms to explain their regulation by the pheromone pathway are presented in the Discussion.
A large number of novel genes was also identified, and further characterization of four of these genes, FIG1–4, is presented below. Some novel genes encode proteins that have homologues in higher eukaryotes, whereas others are predicted to encode proteins that lack extensive homology to other known proteins in the databases (Table I C). Nonetheless, many of the unique proteins have distinctive sequence features. For example, many of the novel pheromone-regulated proteins contain regions predicting their insertion into, or association with, cellular membranes (examples include Fig1p, Fig2p, Yar027wp, andYpl156cp).
Finally, in several cases the lacZ fusion resided either in short ORFs, out-of-frame, reverse orientation, or in regions flanking genes (although most fusions were found to be in-frame with ORFs). These results indicate that sequences in addition to long ORFs can be expressed as protein in vivo, and are corroborated both by our previous study that found that short ORFs outside of predicted coding sequences are often expressed, and by recent analyses of the yeast transcriptome using SAGE techniques (Burns et al., 1994; Velculescu et al., 1997). For two genes, FUS2 and GAP1, out-of-frame fusions were found in addition to several in-frame fusions. For both genes, in- and out- of-frame fusions were regulated similarly. Many of the insertions obtained in the HOG1 region are either out-of-frame, in reverse orientation, or in flanking regions; nonetheless, all exhibit similar levels of pheromone induction consistent with responses to the same regulatory elements in each case. Thus, we presume that in many, if not most, cases, the regulation that is observed for any particular lacZ fusion reflects the expression of the transcript for the ORF into which the lacZ is inserted, an interpretation supported by our studies with QOR1 insertions. One mechanism to account for the expression of out-of-frame fusions is translational frameshifting.
Pheromone-regulated Gene Expression
Based on the results of quantitative β-gal assays presented in Table II, the levels of induced expression upon pheromone treatment are ∼1.3–>700-fold for most of the pheromone-induced fusions. In cases where these levels have been measured, the figures reported here agree closely with those found previously (e.g., FUS2 and CIK1; Page and Snyder, 1992; Elion et al., 1995).
Table II.
Induction of Gene Expression by α-Factor
| Gene | Fusion | Fold induction by pheromone | ||
|---|---|---|---|---|
| FIG1 | P158A | 36.9 | ||
| FIG2 | P294A | 268.1 | ||
| KAR5/FIG3 | P900 | 67.9 | ||
| FIG4 | P403A-2 | 44.7 | ||
| TY element | P105A-2 | 69.1 | ||
| FUS2 | P105A-1 | 798.9 | ||
| STE6 | P372B | 6.2 | ||
| AFR1 | P313B | 59.3 | ||
| CIK1 | P524B | 19.4 | ||
| PCL2 | P342A | 35.0 | ||
| RVS161 | P532C | 6.5 | ||
| SPO11 | P436A-2 | 6.0 | ||
| ALK1 | P359A | 70.2 | ||
| HOG1 | P423A | 56.6 | ||
| PHD1 | P2B | 7.0 | ||
| GAP1 | P534C | 5.4 | ||
| AMD1 | P713 | 2.2 | ||
| YFL056c | P104A | 1.32 | ||
| YGR111w | P9B | 2.1 | ||
| YLR057w | P430B | 196.6 | ||
| YNR069c-YNR070w | P482B | 25.7 | ||
| YFL027c | P28A | 28.3 | ||
| YSC8010 | P452A | 15.1 | ||
| CHRXV | P439B | 6.8 | ||
| YSCP9584.4 | P28B-2 | 1.93 |
An upstream regulatory element termed the PRE has been identified as mediating the pheromone-induced transcription of a number of genes involved in the mating response (e.g., FUS2, CSH1, MFA2, STE6, STE2, BAR1, Ty elements and CIK1) (Van Arsdell et al., 1987). These sequences represent potential binding sites for Ste12p, the transcription factor that mediates pheromone-induced transcription, and are generally found upstream of pheromone-induced protein coding sequences (Kronstad et al., 1987; Errede and Ammerer, 1989; Page and Snyder, 1992). We searched the regions immediately upstream of the four novel FIG genes characterized in this study and found sequences matching the PRE consensus (Fig. 2). Since several of these genes are pheromone dependent for their expression yet contain only PRE sites that differ from the consensus, these results indicate that variant PRE sites are likely to be important for Ste12p-dependent regulation of some genes (e.g., FIG1 and FIG4, Fig. 2). An additional search for Mcm1p binding sites, which can be found near PRE sites of a subset of pheromone-induced genes such as FUS1 (Herskowitz et al., 1992), failed to identify sequences in the upstream regions of the FIG1-4 genes closely matching the consensus binding site.
Figure 2.

Sequences similar to the consensus Ste12p binding site in the upstream regions of the FIG1, FIG2, KAR5/FIG3, and FIG4 genes. Sites preceded by an asterisk indicate they occur on the opposite strand. Underlined sequences represent exact matches to the PRE consensus sequence.
Mating pheromone treatment of cells causes cell cycle arrest in G1, and it has been proposed that this arrest may influence the expression of some genes that would be indirectly controlled by activation of the mating pathway (Stetler and Thorner, 1984; Price et al., 1991). We tested whether the pheromone-induced expression of the four FIG genes characterized in the present study is a consequence of direct or indirect regulation by the pheromone– response pathway. MAT a strains carrying lacZ fusions of the four FIG genes were crossed to a MATα cdc28-1 strain, and MAT a cdc28-1 fig::lacZ progeny were tested for induction of gene expression after cell cycle arrest in the absence of mating pheromone treatment (cdc28-1 strains shifted to the restrictive temperature arrest in G1). No increase in gene expression was observed for any of the four genes in the absence of pheromone treatment, nor was any expression observed in a/α cells (data not shown). In addition, mating-induced expression of the four genes was observed in both a and α cell types as monitored by the mating of strains of either cell type carrying lacZ fusions in these genes to yeast strains of the opposite mating type. These data, combined with the presence of upstream sites similar to the PRE consensus sequence in the four FIG genes, strongly suggest that the pheromone-induced expression of these genes in haploid cells of both mating types is because of direct regulation by Ste12p.
Four Novel Pheromone-induced Genes Are Important for Yeast Mating
To begin the characterization of the pheromone-regulated genes identified from our screen, the mating phenotypes of 20 haploid mutant strains carrying different transposon insertions were analyzed (Table I). Haploid strains containing the lacZ insertions were derived from MAT a/MAT a diploid parental insertion strains and examined for defects in (a) viability; (b) cell cycle arrest and polarized growth in response to pheromone; (c) pheromone sensitivity and adaptation; (d) pheromone production in each cell type; and (e) mating efficiency in both unilateral and bilateral matings (i.e., a lacZ insertion strain × α wild-type or a lacZ insertion strain × α lacZ insertion strain, respectively). No defects in viability, cell cycle arrest, polarized projection formation, adaptation, or pheromone production were detected for the strains that were examined. Evaluation of mating efficiencies under conditions of reduced cell densities, however, did identify three mutant strains, fig1::lacZ, fig2::lacZ, and fig3::lacZ that were each altered in mating efficiency relative to a wild-type strain.
The roles of FIG1, FIG2, and KAR5/FIG3 in yeast mating were investigated in detail using a variety of mating conditions. Because of its striking pheromone-induced expression pattern and its homology to the yeast Sac1p, a known effector of actin cytoskeletal dynamics (Cleves et al., 1989; Novick et al., 1989), the role of FIG4 in mating was also examined. Although initial studies failed to reveal a mating defect in fig4::lacZ strains, it is possible that the transposon insertion allele that was tested, P403A-2, may encode a fusion protein that retains some level of Fig4p activity, as it contains 90% of the Sac1p homology domain (see below). To ensure that null phenotypes were analyzed, strains in which the entire protein coding sequence of each of these genes was substituted with URA3 were constructed by PCR (Baudin et al., 1993). The fig1Δ, fig2Δ, kar5Δ/fig3Δ, and fig4Δ strains grew at rates identical to those of wild-type cells, and no vegetative growth defects were apparent at 16°, 25°, 30°, and 37°C.
As observed with the transposon insertion alleles, fig1Δ, fig2Δ, kar5Δ/fig3Δ, and fig4Δ mutants appeared normal for cell cycle arrest and recovery, pheromone sensitivity, and projection formation at all pheromone concentrations tested (Fig. 3 for mating projection results; refer to Materials and Methods). However, the figΔ strains each exhibited quantitative mating defects, and the severity of the defect differed depending upon the mating condition (Table IV). At 30°C, absence of Fig1p, Kar5/Fig3p, or Fig4p results in a bilateral mating defect that reduces mating efficiency 2.5-, 77.4-, and 2.9-fold, respectively, relative to that of a wild-type strain. In contrast, loss of Fig2p reproducibly increases the mating efficiency 3.2–7.2-fold in both unilateral and bilateral matings. Increased mating efficiency through the loss of a gene product in otherwise wild-type cells is a novel phenotype for a gene that functions in mating. The increased mating efficiency for fig2Δ strains is likely because of their enhanced agglutination relative to wild-type cells (see below). The mating phenotypes of the fig1Δ, fig2Δ, and kar5Δ/fig3Δ strains were the same as their respective transposon insertion mutants. We also tested the relative mating efficiencies of fig1Δ, fig2Δ, and fig4Δ mutants using mating conditions that concentrate cells on filters (Sprague, 1991). Under these conditions, the relative mating efficiencies of fig 1Δ and fig4Δ were similar to those observed by liquid conditions. The increased mating efficiency of fig2Δ strains was no longer observed; instead we observed a 6.6-fold decrease in mating efficiency relative to wild-type strains. We presume that in contrast to liquid mating conditions that require cells to agglutinate to mate efficiently (Kurjan, 1993), the close packing of cells caused by collection on filters reduces or eliminates the need for agglutination in the filter-mating assays. As noted below, the increased mating efficiency of fig2Δ strains in liquid assays is likely due to the hyperagglutination activity of these cells; this activity is no longer expected to be important in filter-mating assays.
Figure 3.
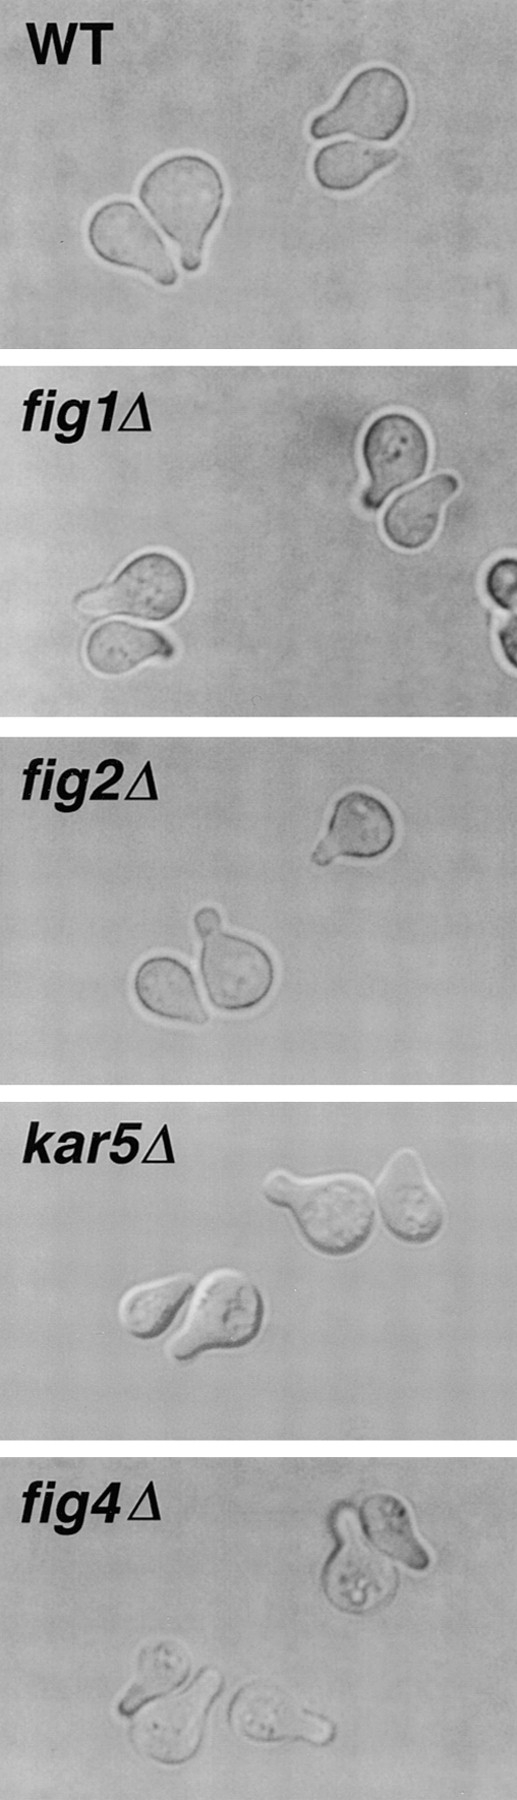
Mating projection formation by MAT a wild-type and figΔ cells in the presence of isotropic mating pheromone. Cells shown were treated for 2 h with α-factor mating pheromone at a concentration of 5 μg/ml. figΔ cells treated with reduced concentrations of pheromone and/or examined at additional timepoints (i.e., 1, 4, 6 h after treatment) also appeared normal in the shape, number, and rate of appearance of mating projections relative to wild-type cells.
We also investigated the effects of different conditions on the mating efficiencies of fig 1Δ, fig2Δ, and fig4Δ mutants (Table IV); the severe effect of the kar5Δ/fig3Δ mutation on mating efficiency precluded its accurate measurement under these conditions. At 16°C, the mating efficiencies of both fig1Δ and especially fig2Δ bilateral matings are impaired relative to wild-type strains (1.4- and 18-fold, respectively). The bilateral matings involving fig1Δ and fig2Δ mutants are also inhibited more strongly than wild type by polymyxin B sulfate, a membrane-disrupting agent. The effects of PEG and EGTA on the mutant matings revealed additional differences between the fig1Δ and fig2Δ strains. While PEG is a potent (5.2–7.6-fold) enhancer of mating efficiency for wild-type, fig1Δ, and fig4Δ strains, it has a much smaller effect on the mating efficiency of fig2Δ strains. Interestingly, the mating efficiency of fig1Δ bilateral matings is more sensitive to EGTA, exhibiting a 3.1-fold decrease relative to wild-type strains. The relative mating efficiency of fig4Δ mutants was affected to similar degree as the mating efficiency of wild-type strains by the different conditions. In summary, the differing effects of the conditions of cold temperature, PEG, and EGTA on the mating efficiencies of fig 1Δ, fig2Δ, and fig4Δ strains suggest that Fig1p, Fig2p, and Fig4p play distinct roles in mating, and may provide insights into their molecular functions (see Discussion).
fig2Δ and kar5/fig3Δ Mating Cells Hyperagglutinate and Form Small Colonies, Respectively
After the discovery that figΔ mutants exhibit altered mating efficiencies, we sought to determine the phenotypic basis of these effects. Two macroscopic phenotypes were observed in matings involving fig2Δ and kar5/fig3Δ mutants. During mating, wild-type cells gather into clusters through agglutination. fig2Δ strains exhibit a hyperagglutination phenotype in which mating cells aggregate to a greater extent than wild-type cells. This phenotype is observed by both uni- and bilateral crosses using settling assays (Fig. 4 A), and microscopic examination of mating cells (data not shown). Hyperagglutination caused by the fig2Δ mutation is an interaction specific to mixtures of mating cells; fig2Δ mutant strains of either mating type do not aggregate during vegetative growth or when mixed with cells of the same mating type. Hyperagglutination of fig2Δ strains during mating was observed at both 30° and 16°C, indicating that the cold sensitivity of fig2Δ mutant matings is caused by a defect independent of agglutination.
Figure 4.
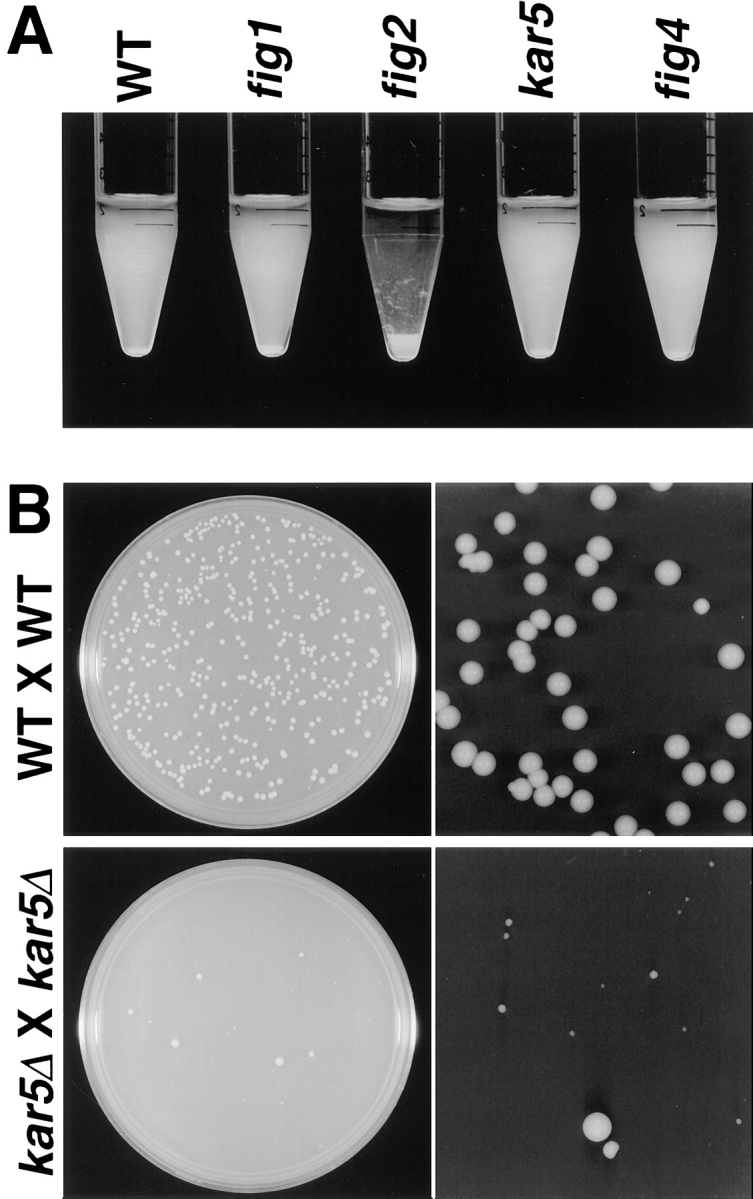
Hyperagglutination and small colony phenotypes observed in matings of fig2Δ and kar5Δ/fig3Δ strains. (A) Unilateral and bilateral matings involving fig2Δ strains cause hyperagglutination, observable as rapid sedimentation of extensive cell clusters. Depicted are bilateral matings of wild-type and figΔ strains. (B) Bilateral matings of MAT a kar5Δ/fig3Δ and MATα kar5Δ/ fig3Δ cells often produce very small colonies. The left panels are magnifications of sections of the plates shown on the right. Plates were incubated for 36 h. The large colonies are visible after 1 d. Both large and small colonies from the kar5Δ/fig3Δ matings contain abnormal cells as described in the text.
The second macroscopic mating phenotype occurs in bilateral crosses of kar5/fig3Δ mutants. Matings of wild-type and all other figΔ mutant strains gave rise to uniformly-sized diploid colonies after 1.5 d of incubation at 30°C. In contrast, matings of kar5/fig3Δ mutants produced many small, irregular colonies as shown in Fig. 4 B. The number of smaller colonies approximates that of the total number of colonies formed in matings involving wild-type cells. Cells from both large and small colonies were fixed and then stained with Hoechst to examine their nuclear contents. Budding cells, cells with mating projections, anucleate and multinucleate cells, and zygotes were observed in each case. Progeny from both classes of colonies mated with both MAT a and MATα tester strains. These phenotypes are consistent with nuclear fusion failures in kar5Δ/ fig3Δ prezygotes (see below). Such failures would be expected to lead to unstable heterokaryons, which, in turn, produce haploid progeny.
fig1Δ, fig2Δ, and fig4Δ Strains Exhibit Defects in Mating Cell Morphology
The mating properties of the figΔ mutant strains were investigated further by examining the morphology and distribution of nuclei in cells and zygotes in wild-type and bilateral figΔ mating mixtures (Fig. 5). Cell shape and degree of polarization (unpolarized, small–medium polarized, and large polarized cells and zygotes) were quantified (Table V). Three of the figΔ mutations, fig1Δ, fig2Δ, and fig4Δ, each alter the morphologies of mating projections and zygotes in distinct ways.
Figure 5.
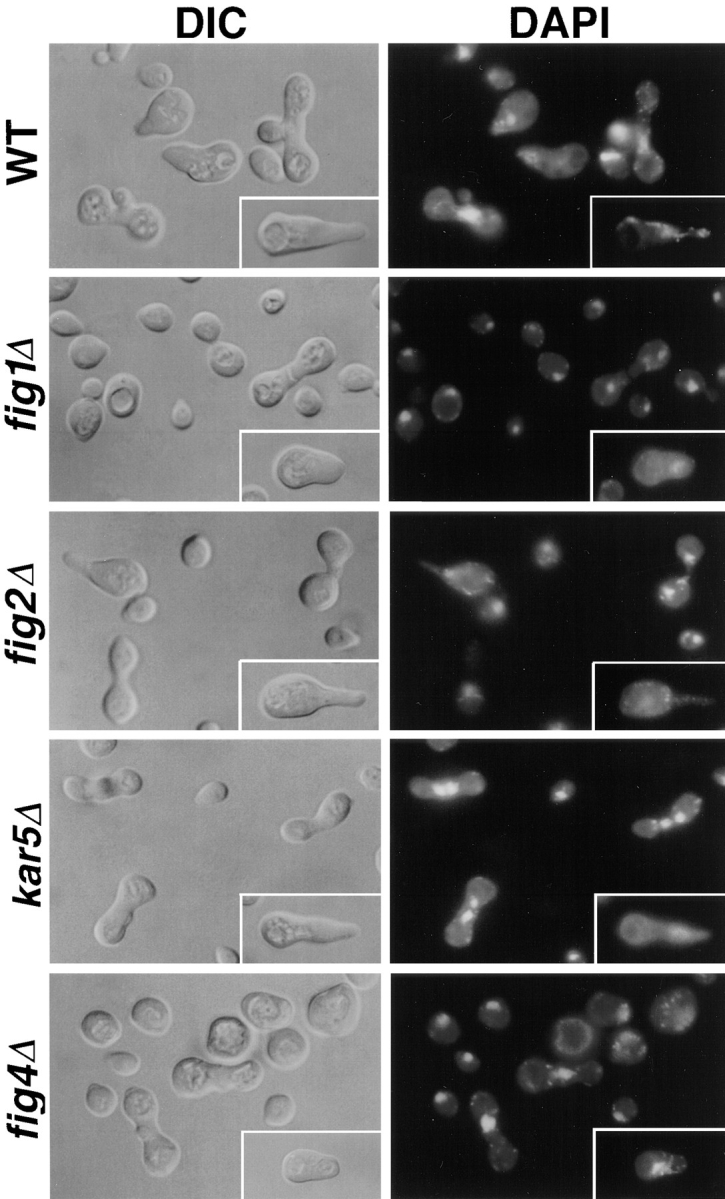
Mating mixtures of wild-type and figΔ cells reveal cell polarization and zygote formation defects. Bilateral matings are shown. The inset shows a typical polarized mating cell. Note the fig 1Δ prezygote has a septum indicative of a failure in cell fusion. fig2Δ zygotes have a narrow bridge. kar5Δ zygotes have two unfused nuclei in close proximity.
Table V.
Morphologies of Cells in Wild-type and figΔ Mutant Mating Mixtures

|
||||||||||
|---|---|---|---|---|---|---|---|---|---|---|
| Wild-type | 9.0 | 44.1 | 42.4 | 3.1 | 64.2 | |||||
| fig1Δ | 5.0 | 69.3 | 24.5 | 1.1 | 29.5 | |||||
| fig2Δ | 2.9 | 55.3 | 40.0 | 2.0 | 70.1 | |||||
| fig3Δ | 4.8 | 50.7 | 40.8 | 3.7 | 59.1 | |||||
| fig4Δ | 6.1 | 54.2 | 36.5 | 3.1 | 24.1 | |||||
At least 500 cells were scored to determine the percentage of each class of cells. Quantitation of the percentage of pointed projection tips of large polarized cells was based on observations of ⩾250 cells.
fig1Δ, and to a lesser extent fig4Δ, mating mixtures have fewer medium and large polarized cells than wild-type or fig3Δ matings (Fig. 5; Table V). Many of the fig1Δ and fig4Δ cells that are polarized possess mating projections with tips that are broader and less focused than those of wild-type cells; for these strains the percentage of large cells with pointed projections was less than half that of wild-type cells or other figΔ mutants (Fig. 5, insets; Table V). In addition, in the case of fig4Δ cells, we often observe multiple bumps around the cell periphery of unpolarized but enlarged cells, suggestive of failures in the intial establishment of mating cell polarity. We also examined the distribution of actin in these strains by rhodamine conjugated–phalloidin staining (Fig. 6). The pattern of actin staining at the mating projection tip is typically less intense and more dispersed in both fig1Δ and fig4Δ cells compared to that of wild-type cells, whereas actin polarization remains normal in fig2Δ cells. Thus, whereas FIG1 and FIG4 are dispensible for forming normal projections in isotropic levels of mating pheromone, in mating mixtures these genes are important both for the execution of cell polarization and the development of mating projection shape (see Discussion). Although the effects of the fig 1Δ and fig4Δ mutations on cell polarization are similar, differences in zygote morphologies between these two mutants suggest they perform different functions in the mating process; fig 1Δ, but not fig4Δ, zygotes display cell fusion defects (Fig. 5, and see below).
Figure 6.
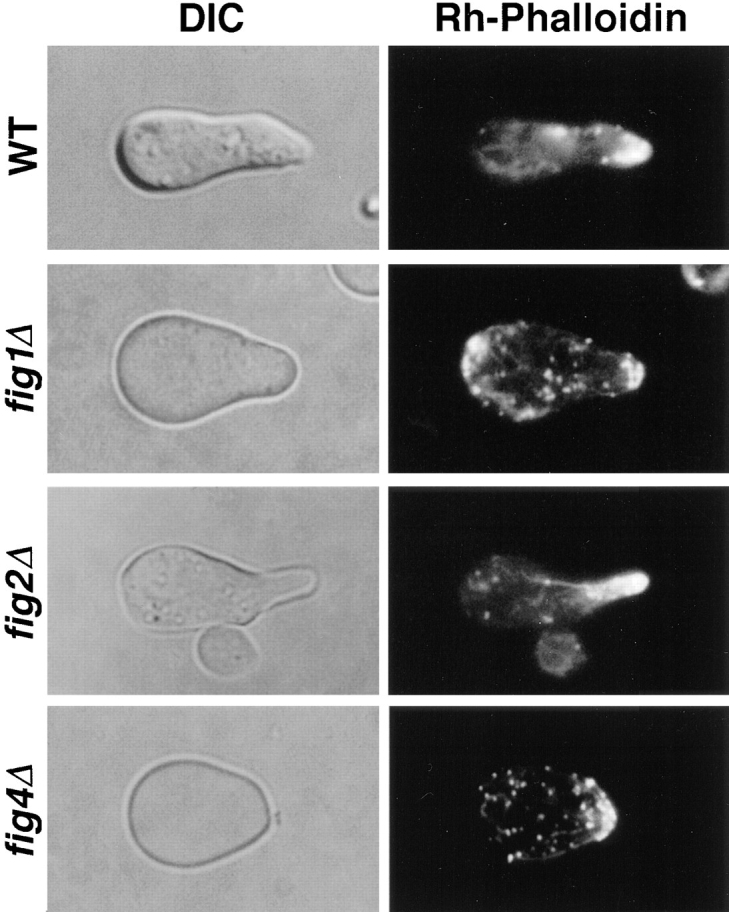
Actin distribution in wild-type, fig1Δ, fig2Δ and fig4Δ polarized cells containing mating projections. Cells shown are derived from mating mixtures stained with rhodamine-conjugated phalloidin after fixation. fig1Δ and fig4Δ cells typically contain less actin at the growing tip of the mating projection, whereas actin distribution in fig2Δ appears similar to that of wild-type cells.
The morphological alterations in mating projection formation caused by the fig2Δ mutation are distinct from those generated by the fig1Δ and fig4Δ mutations. fig2Δ cells form hyperpolarized mating projections that are often narrower and longer than those of wild-type cells (Fig. 5). A consequence of the hyperpolarization of the fig2Δ mating projection is the formation of zygotes possessing narrow fusion bridges (the central portion of zygotes formed by fusion between the polarized tips of mating cells) (Fig. 5). Measurement of the ratio of fusion bridge width/average parental cell pair width for 50 wild-type, fig1Δ, and fig2Δ zygotes supports this observation; for wild-type and fig1Δ zygotes these ratios are 0.52 and 0.51, respectively, whereas for fig2Δ zygotes the value is 0.30. Thus, FIG2 is important for mating cell projection shape and conjugation bridge diameter.
While preparing this manuscript, we learned that FIG3 corresponds to the previously identified KAR5 gene, whose molecular characterization has not been reported. Analysis of cell polarization and zygote formation in fig3Δ mutant cells indicated that cell polarization and zygote morphology is normal, unlike that of fig1Δ, fig2Δ, and fig4Δ mating cells. Instead, kar5Δ/fig3Δ zygotes displayed nuclear fusion defects in which nuclei lie within close proximity but fail to fuse (Fig. 5). This result is consistent with that reported previously for kar5 mutant alleles (Kurihara et al., 1994; Fig. 5, this study).
FIG1 and FIG2 Function in Cell Fusion and Nuclear Migration
To help understand the functions of FIG1 and FIG2 in the differentiation of wild-type mating cells, we examined the cell morphologies and nuclear positions of prezygotes and zygotes formed by wild-type, fig1Δ, and fig2Δ strains mated at 16°C; this condition enhances the mating defects of the mutant strains. As observed for fig1Δ strains at 30°C, fig1Δ and fig2Δ zygotes formed at 16°C display cell fusion defects. These defects were quantified by examining prezygotes and zygotes using DIC microscopy, DAPI staining (to examine nuclear fusion and morphology), and staining with the lipophilic dye FM4-64 which decorates lipids and membranes, but not cell wall material (Fig. 7). As shown in Table VI, the incidence of partial and complete failures in cell fusion is increased markedly in fig1Δ zygotes (ninefold), and more modestly in fig2Δ zygotes (approximately twofold).
Figure 7.
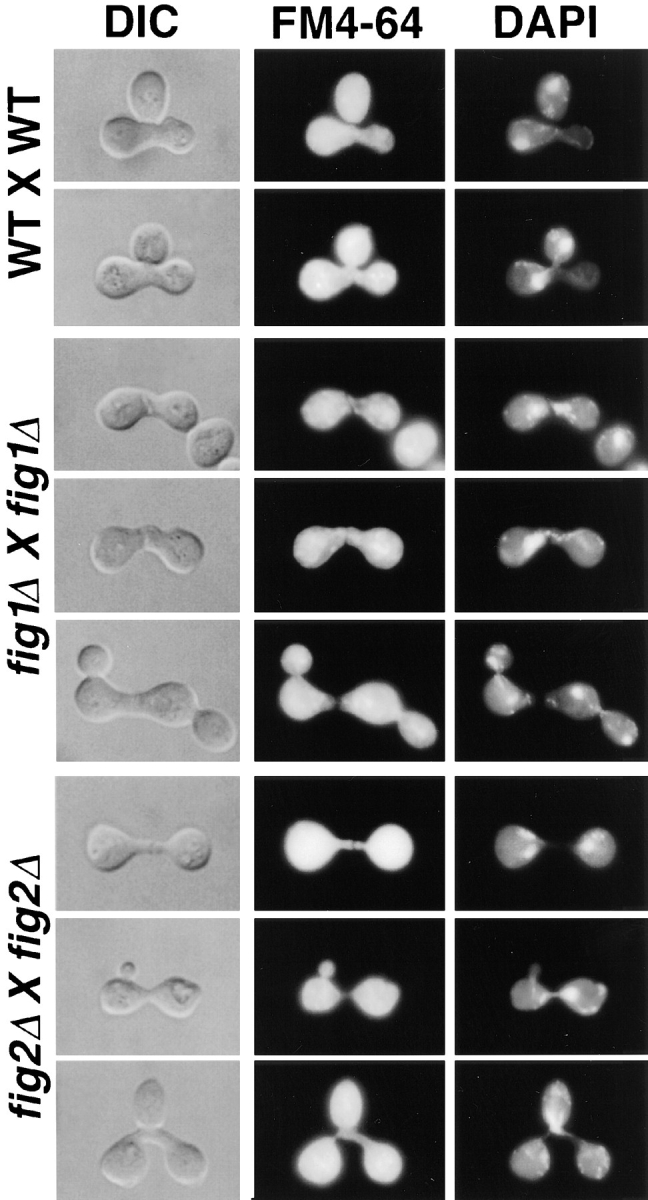
Cell fusion and nuclear morphology defects in fig1Δ and fig2Δ zygotes incubated at 16°C. Left panels are zygotes as viewed by DIC. Center panels show the same zygotes stained with the lipophilic dye FM4-64; the dye stains lipids and membrane, but not cell wall material. Panels at right show DAPI staining of nucleic acids within zygotes. fig1Δ zygotes often display complete (top and bottom rows) or partial (middle row) fusion defects. fig2Δ zygotes have narrow conjugation bridges, and often have cell fusion defects (top two rows) or nuclear migration/segregation defects (bottom two rows).
Table VI.
Cell Fusion and Nuclear Morphology Defects in Wild-type, fig1Δ and fig2Δ Zygotes
| 30° |
|
|||||||||||||
|---|---|---|---|---|---|---|---|---|---|---|---|---|---|---|
| WT × WT | 95 | 0.5 | 2.5 | 0.5 | 0 | 1.5 | 200 | |||||||
| fig1Δ × fig1Δ | 77 | 0.4 | 14 | 9 | 0 | 0 | 231 | |||||||
| fig2Δ × fig2Δ | 15 | 0.5 | 3.3 | 2.9 | 59 | 20 | 208 | |||||||
| 16° | ||||||||||||||
| WT × WT | 95 | 0.9 | 1.4 | 2.3 | 0 | 0 | 217 | |||||||
| fig1Δ × fig1Δ | 45 | 0.5 | 33 | 21 | 0 | 0 | 204 | |||||||
| fig2Δ × fig2Δ | 8 | 2 | 3.9 | 4 | 52 | 30 | 212 | |||||||
Values represent percentages of the total number of zygotes examined (N).
When fig2Δ strains mate at both 30° and 16°C, a high frequency (84%) of zygotes show the hyperpolarization/ narrow fusion bridge phenotype. As shown in Fig. 7, a number of defects appear to be caused by the narrow fusion bridge phenotype of fig2Δ mutants. The most prevalent phenotype, observed in ∼80% of fig2Δ zygotes, is a novel nuclear morphology that suggests a failure to comple the late steps of nuclear fusion. Normally, nuclear fusion proceeds by the microtubule-dependent congression of nuclei, followed by nuclear membrane fusion (Kurihara et al., 1994). The fused haploid nuclei then form a contiguous, elliptical or quasispherical diploid nucleus. In wild-type zygotes possessing a bud, the nucleus is often located near the site of bud emergence, or can be seen to be segregating or to have segregated between the zygote and bud (Fig. 7; top two rows). In fig2Δ zygotes, the newly fused nucleus nearly always has an abnormal shape, and in zygotes possessing a bud it is frequently observed to lie in abnormal positions, suggesting difficulties in nuclear migration to the bud site or in subsequent segregation events (Fig. 5; Fig. 7, bottom two rows; Table VI). fig2Δ zygotes appear delayed in rounding up of the nucleus, as judged by the presence of contiguous DAPI staining material across the fusion bridge region (Fig. 7, Table VI). In the majority of these nuclear configurations, two interconnected DAPI staining regions are observed on either side of the fusion bridge, whereas less frequently a single DAPI staining region is observed to be contiguous with nuclear material remaining in the fusion bridge (Table VI). For each of these cases, the majority of these altered nuclear configurations occur in fig2Δ zygotes displaying the narrow bridge phenotype shown in Figs. 5 and 7.
To further examine the cell and nuclear fusion defects visualized by light microscopy, we performed electron microscopic analysis on thin section preparations of wild-type, fig1Δ, and fig2Δ zygotes (Fig. 8). Inspection of micrographs of the fig1Δ zygotes confirms the presence of undissolved cell wall materials and membrane causing both partial and complete fusion defects (Fig. 8, B and C; this is particularly evident in higher magnification micrographs; data not shown). Moreover, examination of the partial fusion defects by both fluorescent microscopic techniques and electron microscopy indicates that nuclear fusion is a robust process, capable of being executed through very small regions of cytoplasmic continuity (for example, Fig. 7, fig1Δ center panel; Fig. 8 C; and Table VI, partial fusion defect column). Analysis of fig2Δ zygotes revealed elongated nuclear morphologies consistent with those visualized by DAPI staining of whole zygotes. In summary, these different data demonstrate that fig1Δ and fig2Δ zygotes exhibit both cell fusion and nuclear morphology defects.
Figure 8.

Electron micrographs of thin sections through zygotes formed from bilateral matings. (A) wild-type; (B) fig1Δ mutant, complete fusion defect; (C) fig1Δ mutant, partial fusion defect; and (D) fig2Δ mutant, note narrow fusion bridge. n indicates the nucleus.
FIG1, FIG2, and FIG4 Function in at Least Two Different Mating Cell Differentiation Pathways Required for Cell Shape and Polarity
The different effects of nonoptimal mating conditions on the mating efficiencies of fig1Δ, fig2Δ, and fig4Δ strains suggested that these mutants are defective in different pathways involved in mating cell differentiation (Table IV). To investigate this further, we examined the epistatic relationships of the figΔ mutations by characterizing the mating cell projection and zygote morphologies of double mutant strains mated at 30° and 16°C; bilateral matings of MAT a and MATα fig1Δfig2Δ, fig1Δfig4Δ, and fig2Δfig4Δ mutant strains were examined (Fig. 9). For most of the double mutant strains, the phenotype of any single mutation was never completely epistatic to that of another (Table VII). All double mutants carrying the fig1Δ mutation displayed reductions in the fraction of cells producing pointed mating projections and increases in the rate of cell fusion defects. Similarly, double mutants involving the fig2Δ mutation displayed a narrow conjugation bridge and the aberrant nuclear morphology phenotypes; these mutants also hyperagglutinated at both 30° and 16°C. All double mutants involving the fig4Δ mutation displayed a reduction in the percentage of cells with pointed projections. Thus, the morphological phenotypes of the fig1Δfig2Δ and fig2Δfig4Δ double mutants represent a combination of those observed in each of the corresponding single mutants, suggesting that Fig2p functions in a distinct pathway from that of either Fig1p or Fig4p (Table VII).
Figure 9.

Phenotypes of double figΔ mutants affecting mating projection and zygote morphology. A typical polarized cell (Mating Projection) and zygote from bilateral matings of fig1Δ fig2Δ cells (top), fig1Δ fig4Δ cells (middle) and fig2Δ fig4Δ cells (bottom) is shown.
Table VII.
Morphologies of Cells in Wild-Type and figΔ Double-Mutant Mating Mixtures

|
||||||||||
|---|---|---|---|---|---|---|---|---|---|---|
| Pointed projections | Cell fusion defects | Narrow bridge | ||||||||
| 30°C | 30°C | 16°C | 30°C | 16°C | ||||||
| Wild-type | 64 | 2 | 3 | 1 | 1 | |||||
| fig1Δ | 20 | 15 | 66 | 2 | 0 | |||||
| fig2Δ | 65 | 15 | 11 | 98 | 100 | |||||
| fig4Δ | 20 | 2 | 4 | 1 | 5 | |||||
| fig1Δ fig2Δ | 45 | 56 | 48 | 84 | 99 | |||||
| fig1Δ fig4Δ | 16 | 13 | 13 | 0 | 4 | |||||
| fig2Δ fig4Δ | 29 | 22 | 22 | 32 | 91 | |||||
At least 50 zygotes were scored to determine the percentage of zygotes possessing cell fusion defects and/or a narrow conjugation bridge morphology. Quantitation of the percentage of polarized cells with pointed projection tips was based on observations of ⩾100 cells.
There are exceptions to these independent epistasis relationships. The fig1Δ and fig4Δ mutations did not produce additive effects in cell polarization, suggesting that these mutants may function in the same or significantly overlapping pathways for this particular process (Table VII; however, see Discussion). In addition, the fraction of cells with a pointed projection tip in the fig1Δfig2Δ and fig2Δfig4Δ mutants was reduced relative to that of fig2Δ mutants alone (Table VII). This suggests that hyperpolarization caused by the absence of Fig2p function may partly require the function of the polarization pathway(s) in which Fig1p and Fig4p function. We are cautious, however, in interpreting this relationship as one that applies to normal mating cell polarization, since hyperpolarization is a consequence of the loss of FIG2 function and not a polarization event normally occurring in wild-type mating cells. In summary, these results indicate that the FIG1, FIG2, and FIG4 genes encode proteins that are components of at least two distinct mating cell differentiation pathways required for projection shape and polarity.
Fig1p and Fig2p Localize to the Cell Periphery
To gain further insight into the function of the different pheromone-regulated genes, the subcellular localizations of β-gal fusion proteins in 14 strains carrying lacZ fusions to different genes, including fig1::lacZ, fig2::lacZ, fig3::lacZ, and fig4::lacZ, were analyzed using anti–β-gal antibodies and indirect immunofluorescence. Fusion proteins encoded by fig3::lacZ and fig4::lacZ, along with those from 10 other strains, failed to localize in a discrete pattern or at a level above background. Presumably, some of these fusion proteins may lack sequences required for their stability or subcellular localization. Two strains, fig1::lacZ and fig2::lacZ, were, however, found to exhibit strong β-gal staining at discrete sites in pheromone-treated cells (Fig. 10). In each case the β-gal fusion proteins appeared to be abundant, based on staining intensity, and localized to the cell periphery in 100% of the cells (n > 400). The Fig1::β-gal and Fig2::β-gal fusion proteins were often slightly polarized toward the projection tips, but did not appear to be as sharply concentrated at the tips as reported previously for the Fus1 and Fus2 proteins (Trueheart et al., 1987; Elion et al., 1995). For both Fig1::β-gal and Fig2::β-gal fusions (∼10%), in a small fraction of cells perinuclear staining was observed (Fig. 10). Such staining was also observed in rare cells (<3%) that were not treated with pheromone and the staining was very weak (Fig. 10). This perinuclear staining may represent low levels of the fusion proteins contained in the endoplasmic reticulum. The localization of Fig1p and Fig2p suggests they may perform their functions at the cell periphery.
Figure 10.

Localization of Fig1::β-gal and Fig2::β-gal fusion proteins. Cells were incubated in the absence or presence of mating pheromone for 2 h and then stained with anti-β::gal antibodies by indirect immunofluorescence. Staining was not detected in control strains that lacked β-gal fusions (data not shown). Hoechst 33258 was used to visualize DNA in the cells (bottom rows).
The FIG1, FIG2, KAR5/FIG3, and FIG4 Proteins Contain Distinct Sequence Features
The four genes characterized in detail in this study, FIG1, FIG2, KAR5/FIG3, and FIG4, are predicted to encode proteins of 298-, 1609-, 504-, and 879-amino acids, respectively. Each of these proteins is predicted to contain domains suggestive of a structure, localization, or function of the proteins. (Fig. 11 A).
Figure 11.

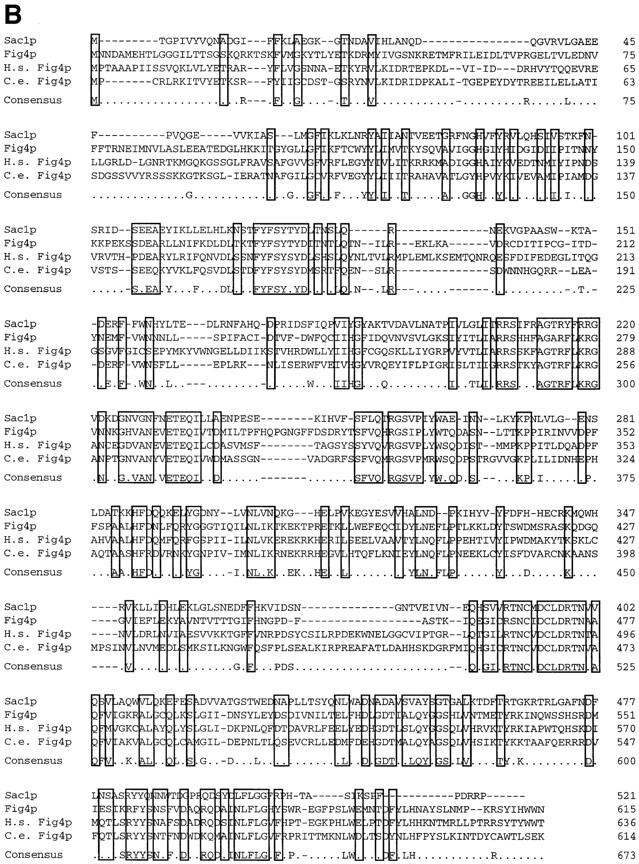
(A) Predicted structural features of the Fig1, Fig2, Kar5/Fig3, and Fig4 proteins. Putative transmembrane domains (TMDs) are indicated by vertical wavy lines. Potential N-linked glycosylation sites are indicated by circles. These occur within a predicted extracellular loop between TMD1 and TMD2 of Fig1p and in the Ser/Thr rich region of Fig2p. The predicted signal peptide (SP) and GPI anchor of Fig2p are indicated. The putative coiled-coil regions of Kar5/Fig3p are depicted by wavy horizontal lines. The Sac1p homology domain of Fig4p is indicated by a striped region. (B) Alignments of protein sequences corresponding to the Sac1p homology domain present in family members displaying highest similarity to Fig4p with Sac1p. Identities and conservative sequence changes are boxed.
FIG1 and FIG2 are predicted to encode membrane- associated proteins. Fig1p contains four predicted transmembrane (TM) domains with a loop between the first and second TM segments that is expected to be extracellular and contain several potentially glycosylated residues (Fig. 11 A). The protein has several features in common with members of the four transmembrane (4TM) superfamily of proteins (Wright and Tomlinson, 1994), including the transmembrane segments, the potential extracellular glycosylated loop, and the location of polar and charged residues at conserved points within two of the TM domains (N23 in TMD1 and D255 in TMD4) (Wright and Tomlinson, 1994). Fig2p contains a predicted signal peptide at its amino terminus and potential glycosyl phosphatidylinositol (GPI) anchor sequence at its carboxy terminus. The protein is serine/threonine rich (44.5% serine or threonine) as are many extracellular proteins, and contains many potential N-linked glycosylation sites (Klis, 1994; Cid et al., 1995).
The sequence of KAR5/FIG3 is predicted to encode a protein capable of containing several long coiled-coil domains (i.e., α helical regions with heptad repeats of hydrophobic residues) in the center of the protein. A protein of 577 amino acids in length and possessing limited sequence, but high structural similarity is also present in the Schizosaccharomyces pombe genome (EMBL/GenBank/DDBJ accession number D87337).
FIG4 encodes a protein that belongs to a family of proteins characterized by a domain that is similar in sequence to the yeast Sac1 protein. Mutations in SAC1 affect actin cytoskeletal and secretory functions, possibly through alterations in phospholipid metabolism (Cleves et al., 1989; Novick et al., 1989; Whitters et al., 1993). The alignment of the protein sequences of selected members of this multigene family is shown in Fig. 11 B. In S. cerevisiae there are five genes encoding proteins that belong to this multigene family, SAC1, FIG4, YNL106c, YOR3231w, and YIA2, and several members also exist in other organisms (Majerus, 1996; McPherson et al., 1996; Mewes et al., 1997). Fig4p and Sac1p share 25% identity over 530 amino acids, including three highly conserved domains of 14/17, 9/13, and 10/12 identical amino acids (Fig. 11 B). Interestingly, Fig4p displays highest sequence identity within the Sac1 domain (29–34%) to a subgroup of the Sac1 domain–containing proteins that includes a Caenorhabditis elegans and human homologue of Fig4p. This subgroup of proteins is distinguished, in part, by a 19–amino acid extension of the region of homology shared by the proteins past the carboxy-terminal border of the domain of Sac1p similarity (Fig4p residues 596–614, Fig. 11 B). Since each of the proteins contains a unique carboxy terminus, it is possible that the carboxy-terminal domains confer different specificities on the proteins toward the execution of their cellular functions.
Discussion
Identification of Pheromone-regulated Genes
In this study, a lacZ transposon insertion screen was used to identify genes whose expression is regulated in response to mating pheromone. We recovered fusions in known pheromone-regulated genes, previously characterized genes not known to be pheromone regulated, and many novel genes. Based on the frequency with which pheromone-regulated lacZ fusions were found, we estimate that 1–2% of all yeast genes are pheromone regulated.
At least two earlier attempts to identify pheromone-regulated sequences in yeast have been made using differential hybridization screens (Stetler and Thorner, 1984; McCaffrey et al., 1987). Specific genes were not reported in one study, and the other was limited to the description of a single gene, FUS1. One advantage of the lacZ insertion approach is that it allows the direct identification of pheromone-regulated genes and permits rapid further analysis of multiple target genes.
Previously Characterized Genes and Novel Genes Provide Additional Insights into the Mating Process and Gene Function
Whereas our screen isolated an expected group of known pheromone-induced genes, a set of previously characterized genes was also found to be under pheromone regulation. The most frequently identified pheromone-regulated gene of this class was SPO11. SPO11 is induced in meiosis, and Spo11p is found covalently attached to the ends of meiotic double-strand beaks in genomic DNA (Atcheson et al., 1987; Keeney et al., 1997). Our data suggests that SPO11 is expressed in haploids and exhibits enhanced expression upon pheromone treatment. Consistent with pheromone regulation is the presence of two consensus PRE sites upstream of the SPO11 coding sequence. SPO11 does not promote recombination during mating, as matings of MAT a spo11Δhis4-280 cells to MATα spo11Δhis4-260 cells did not reveal any change in the number of His+ prototrophs relative to control matings with wild-type cells (data not shown). Spo11p, which localizes to the nucleus (Burns et al., 1994), might play a role in the organization of the diploid nucleus after nuclear fusion. This organization may occur soon after nuclear fusion as homologous chromosomes appear associated during vegetative growth (Weiner and Kleckner, 1994).
Several other pheromone-regulated genes that may function in mating were also identified by our screen. Two genes encoding proteins that might function in the cell cycle regulatory events that mediate pheromone-induced arrest and recovery are HOG1 and CKI3/YCK3. A recent study has found that the HOG1 osmoregulatory MAP–kinase pathway negatively regulates the activity of the mating pathway, based in part on the finding that pheromone sensitivity was greater in a hog1Δ strain than in a wild-type strain (Hall et al., 1996). CKI3/YCK3 encodes one of the four casein kinase I homologous proteins found in S. cerevisiae (Robinson et al., 1992; Wang et al., 1996). CKI3/ YCK3 has recently been identified as a high copy suppressor of gcs1 mutants that fail to reenter the cell cycle from stationary phase (Wang et al., 1996). Thus, CKI3/YCK3 encodes a pheromone-induced protein that has activity as a cell cycle regulator.
Our study also found the cell polarity gene RVS161 to be pheromone regulated. Rvs161p has recently been shown to be important for proper cell fusion and mating under certain conditions (Dorer et al., 1997). Mutations in the RVS161 gene affect actin-dependent processes including diploid bud site selection and endocytosis (the gene is allelic to END6), and a mammalian homologue of Rvs161p, amphiphysin, has been predicted to be involved in synaptic vesicle recycling (Crouzet et al., 1991; David et al., 1994; Munn et al., 1995; McPherson et al., 1996). Perhaps Rvs161p acts to maintain the proper positioning and/or organization of the actin cytoskeleton to directly or indirectly control the local regulation of cell surface membranes and receptors. A possible role for Rvs161p in the regulation of pheromone receptors is particularly interesting in light of the common requirement for the function of these proteins in the process of cell fusion (see below; Brizzio et al., 1996; Elia and Marsh, 1996; Dorer et al., 1997).
Another interesting group of genes that we found to be regulated by mating pheromone are the pheromone- repressed genes. The novel gene QOR1, as well as FOX2 and PHO81, have been suggested or demonstrated to be subject to glucose repression (Minehart, S., S. Erdman, and M. Snyder, unpublished data; Johnston and Carlson, 1992; Kunau and Hartig, 1992; Timblin et al., 1996). The common property of glucose regulation suggests that the decreased expression levels of these genes in cells exposed to pheromone may occur through a common mechanism. Activation of the pheromone pathway may curb the expression of these genes directly by affecting a common regulator, as would be the case if glucose repression is established and/or maintained at the G1 phase of the cell cycle. Arrest of the cell cycle in G1 by pheromone would, in turn, reduce expression of these genes. Alternatively, repression by the pheromone pathway might work indirectly by altering the expression of upstream genes that participate in the sensing of nutrient levels, which then regulate the expression of the pheromone-repressed genes (Johnston and Carlson, 1992).
Some Pheromone-induced Genes Such as PHD1 Are Induced by Both Mating and Pseudohyphal Differentiation Signals
We found that several genes are induced by both pheromone and pseudohyphal growth-promoting conditions (Tables I), suggesting that a common set of target genes may be involved in both processes. One of these genes is PHD1, whose overexpression enhances pseudohyphal growth in yeast, and whose product is a transcription factor capable of activating the expression of at least five potential target genes (Gimeno, 1994; Gimeno and Fink, 1994). A potential PHD1 target, CDC91, was found in our screen, and a second target corresponds to the DAL81 gene, which, like several of the genes identified in our screen (i.e., GAP1, DUR1,2, AMD1, and YGR111w), is involved in nitrogen metabolism (Magasanik, 1992). Thus, induction of Phd1p by low nitrogen conditions or pheromone may, in turn, activate a common set of target genes important for the processes of pseudohyphal growth and mating under certain conditions (see below).
The reason why induction of genes involved in nitrogen metabolism might be advantageous for mating is unclear. Perhaps the induction of these genes is a fortuitous vestige of their common activation mechanism. Previous studies have shown that several components of the Ste20p MAP– kinase signaling pathway (Ste20p, Ste11p, Ste7p) and the transcription factor, Ste12p, are used by both the mating and pseudohyphal pathways (Liu et al., 1993; Roberts and Fink, 1994). Nonetheless, the common induction of several genes by both pathways suggests they may share some common features and mechanisms. Consistent with this hypothesis, we have recently found that yeast cells exposed to low levels of mating pheromone form filamentous arrays similar to pseudohyphal cells (Erdman, S., and M. Malczynski, unpublished results). Similarly, the pheromone induction of genes that permit the use of alternative nitrogen sources may enable mating cells to grow through different environments in search of mates.
Although our work suggests a specific group of target genes shared by the pseudohyphal and pheromone- responsive pathways, others are unique to either of the two pathways. A previous study has shown that FUS1 is not activated in cells undergoing haploid invasive growth and FUS2, AFR1, ADP1, FIG1, FIG2, and KAR5/FIG3 are only induced by mating pheromone (Erdman, S., unpublished data; Roberts and Fink, 1994). Furthermore, a recent study has identified a gene, TEC1, whose product, along with Ste12p, appears to mediate the transcriptional induction of genes specific to pseudohyphal differentiation (Madhani and Fink, 1997). Thus, there remain many genes that are induced only during pseudohyphal growth or mating, presumably contributing to the unique aspects of these processes.
FIG1, FIG2, KAR5/FIG3, and FIG4 Identify New Components and Steps of the Yeast Mating Pathway
Four novel pheromone-regulated genes characterized in this study play distinct roles in yeast mating. Strains in which the FIG genes are deleted display vegetative growth properties identical to those of wild-type strains, consistent with their specific involvement in the mating process. Analyses of the cell polarization behavior in mating mixtures of mutants revealed that Fig1p, Fig2p, and Fig4p are each necessary for normal mating projection formation; Kar5p/Fig3p is important for nuclear fusion.
Thus far, two major classes of proteins have been shown to be required for normal mating cell polarization: (a) general polarity components common to both budding and mating processes; and (b) pheromone-regulated components such as the pheromone receptor (Ste2p), Far1p, and Afr1p (Konopka et al., 1988; Konopka, 1993; Herskowitz et al., 1995; Konopka et al., 1995; Pringle et al., 1995; Roemer et al., 1996). Fig1p, Fig2p, and Fig4p, like the latter group of proteins, are induced by mating pheromone and appear to function in the specification and/or organization of pheromone receptor-dictated sites of polarized growth. However, a significant difference exists between the phenotypes of mutants in the FIG1, FIG2, and FIG4 genes and those in STE2, FAR1, and AFR1. The fig mutants arrest and polarize normally in the presence of uniform concentrations of mating pheromone, but exhibit polarization defects only in mating mixtures; ste2, far1, and afr1 mutants exhibit defects under both conditions (Konopka et al., 1988; Chang and Herskowitz, 1990; Konopka, 1993; Chenevert et al., 1994; Dorer et al., 1995; Konopka et al., 1995; Valtz et al., 1995). One principal difference between these two conditions is that in the presence of isotropic concentrations of pheromone, cells use axial and distal bud site polarity landmarks to specify sites of mating projection formation, whereas in mating mixtures cells choose projection sites on the basis of the pheromone receptors detecting gradients of mating pheromones that emanate from potential mating partners (Jackson and Hartwell, 1990; Madden and Snyder, 1992; Segall, 1993; Valtz et al., 1995). These different conditions also produce distinct cell morphologies and may reveal differing aspects of the mating process (Figs. 3 and 5; Madden and Snyder, 1992; Rose and Marsh, 1997). Interestingly, strains lacking either FIG1 or FIG2 also possess cell fusion defects; the cell fusion process has also been speculated to be regulated by cell–cell contact (Rose and Marsh, 1997). Thus, from the specific requirements for FIG1, FIG2, and FIG4 for normal mating cell projection polarization and shape in mating mixtures, we conclude that the products of these genes perform cell polarity functions associated with polarized growth sites that are dictated by cell–cell communication events.
The mating projection defects of the fig mutants provide three important insights into the process of mating projection formation. First, a number of proteins in distinct pathways participate in cell polarity events governing mating projection growth. Differences observed in the sensitivities of fig1Δ, fig2Δ, and fig4Δ mutants in the genes to specific mating conditions suggests that the Fig1, Fig2, and Fig4 genes function primarily in distinct pathways. Phenotypic analyses of the mating cell polarization and cell fusion properties of double mutants clearly indicate that FIG2 functions in a different pathway from that of FIG1 and FIG4. Genetic arguments suggest that FIG1 and FIG4 function in the same or extensively overlapping pathways based on their lack of additive effects on projection tip shape. However, mutants in these genes display a number of distinct properties (e.g., EGTA sensitivity and cell fusion defects in fig1Δ mating cells), suggesting they may contribute to cell polarization in different ways. The epistatic relationship of the FIG1 and FIG4 genes will be ascertained more precisely after additional molecular characterization of the functions of these genes.
Second, although a number of gene products participate in cell polarity events that form the mating projection, only a subset of these polarity components also function in cell fusion. FIG1 and FIG4 are both required for mating projection polarization, whereas only FIG1 has a role in cell fusion. A recent study has also found that many general polarity components (e.g., Spa2p, Pea2p, Rvs161p, and Bni1p) are required for cell fusion, whereas another (Bem1p) is not (Dorer et al., 1997). Perhaps fusion-specific polarity components recruit and localize cell signaling components (i.e., pheromones, receptors, and transporters), which, in turn, target cell fusion proteins (Brizzio et al., 1996; Elia and Marsh, 1996; Dorer et al., 1997). Alternatively, cell polarity components might directly localize both signaling and cell fusion components to cell–cell contact sites.
Finally, the defects observed in fig2Δ zygotes possessing narrow conjugation bridges reveal a prerequisite of proper conjugation bridge shape for the efficient execution of subsequent events of nuclear fusion and segregation. This requirement further emphasizes the importance of components that regulate the spatial control of mating projection morphogenesis, which, in turn, determines the shape of the conjugation bridge. Since the mating defect of fig2Δ strains is normally revealed only by quantitative mating assays and low temperature conditions (conditions not commonly used in genetic screens), it will be interesting to examine mutants in other cell wall components for similar morphological phenotypes.
FIG1p Is a Novel Transmembrane Protein That Functions in Cell Polarization and Fusion
A number of lines of evidence suggest that Fig1p functions in organization of polarized growth sites during mating. Analysis of the mating morphology of fig1Δ mutant cells indicates a role for Fig1p in cell polarization. fig1Δ mutants are also defective in cell fusion, which depends upon pheromone signaling and actin-interacting proteins (Brizzio et al., 1996; Elia and Marsh, 1996; Dorer et al., 1997). Fig1p could participate in pheromone receptor-directed or cell fusion-targeted polarity functions in a number of different ways. Fig1p might directly or indirectly associate with known components of signaling or fusion complexes located at growth sites initially established by activated pheromone receptors (Madden and Snyder, 1992; Valtz et al., 1995). Alternatively, Fig1p might act by controlling ion flux (see below), which, in turn, affects organization of the actin cytoskeleton. Finally, fig1Δ mutants share many properties (e.g., cold sensitivity, EGTA supersensitivity, bilateral cell fusion defects) with mutants defective in FUS1, which encodes a type I transmembrane protein (McCaffrey et al., 1987; Trueheart et al., 1987; Elion et al., 1995). Thus, Fig1p and Fus1p may function in the same pathway(s).
The Fig1p is a predicted 4 TM domain–containing protein, and localization of a Fig1::β-gal fusion protein shows that it is likely to reside in the plasma membrane within close proximity to other membrane-associated polarity and cell fusion components, such as the Ste2p and Ste3p transmembrane pheromone receptors, the G-protein subunits, and Fus1p (for review see Sprague and Thorner, 1992). Fig1p also possesses similarities to the mammalian 4 TM superfamily of proteins. Members of this superfamily have been implicated in cell polarity functions in the mammalian immune system (Wright and Tomlinson, 1994). Some of these proteins have been shown to act as effector molecules, coupling G-proteins to their cognate receptors (Wright and Tomlinson, 1994). Fig1p may act in a similar manner by helping recruit general polarity components to sites of activated G-proteins (Leeuw et al., 1995; Madden and Snyder, 1992; Valtz et al., 1995).
Features of the Fig1p sequence suggest it may act as an ion transporter or channel. The presence of charged amino acids at conserved locations within their transmembrane segments has led to speculation that 4 TM superfamily proteins may function as ion transporters (Wright and Tomlinson, 1994). A second 4 TM superfamily of genes, the connexins, also possess such charged domains within their transmembrane segments (Goodenough et al., 1996). Connexins and ductins, a structurally related group of proteins, function as ion transporters at gap junctions, which are sites of cell–cell contact and communication in higher eukaryotes (Finbow et al., 1994; Goodenough et al., 1996; Bryant, 1997). Fig1p contains charged residues within two predicted transmembrane segments and mating of fig1Δ mutants is supersensitive to the addition of EGTA, a chelator of calcium ions. The quantitative mating defect of fig1Δ mutants is also rescued by Ca2+ supplementation of the medium (Erdman, S., unpublished data). It is known that yeast cells exposed to mating pheromone undergo a large calcium influx (Ohsumi and Anraku, 1985). Thus, Fig1p might serve a role in mediating or coupling this ion influx to the activity of other morphogenetic proteins (e.g., Cdc24p; Miyamoto et al., 1987). Although the exact mechanism of its function in mating cell polarization and fusion is not known, Fig1p represents the first component specific to mating cells involved in both these processes. Further study of Fig1p will likely yield significant insights into the nature of the link between cell polarization and fusion during mating.
Fig2p Is a Putative GPI–anchored Cell Surface Protein That Affects Cell Adhesion and Shape
The sequence of Fig2p predicts it to be an extensively glycosylated protein that is GPI-anchored to the cell surface. The protein is also rich in serine and threonine, similar to many cell surface proteins of yeast (Klis, 1994; Cid et al., 1995). These properties suggest that Fig2p, like other pheromone-regulated cell wall components such as chitin synthase I and a subunit of 1,3-β-d-glucan synthase (encoded by CHS1 and FKS2, respectively), probably function to provide structural support to the newly deposited cell wall of the growing mating projection (Appeltauer and Achstetter, 1989; Mazur et al., 1995).
The role of Fig2p in mating cells provides insights into how cell surface components are coupled to polarized growth processes in the underlying cell cortex and how these components affect cell–cell communication events. Loss of Fig2p function removes a component of the cell wall and produces enhanced apical growth of the mating projection. Thus, disruptions in extracellular components can influence the spatial program of polarized growth in the underlying cell cortex. Perhaps the absence of Fig2p activates a checkpoint monitoring projection growth, analogous to that described for bud morphogenesis (Lew and Reed, 1995). Loss of Fig2p function also causes a novel mating phenotype of hyperagglutination and increased mating efficiency at 30°C under liquid mating conditions. Two hypotheses to account for these effects are either that the absence of Fig2p alters cell wall structure such that agglutinins become more exposed on the cell surface, increasing their effectiveness, or that the pool of GPI anchors or pathway components attaching them to these proteins is limiting so that the absence of one (Fig2p) increases the number of other proteins (e.g., Aga1p or Agα1p) receiving anchors.
Despite their increased efficiency of mating at 30°C, fig2Δ mutants are still cold sensitive for mating (18-fold reduced relative to wild-type cells). These mutants also hyperagglutinate during mating at 16°C, indicating their mating defect lies in a cellular process other than agglutination. A striking property of fig2Δ mutant cells is their narrow mating projections relative to wild-type cells, and consequently, an unusually narrow conjugation bridge formed between mating cells. Presumably this long and narrow bridge impedes the movement(s) of nuclei within the zygote. The nuclear movements involved in migration and segregation are dependent upon microtubules making contact with appropriate cortical sites; these sites may be less accessible in fig2Δ zygotes (Palmer et al., 1992; Farkasovsky and Kuntzel, 1995). Taken together, these phenotypes of fig2Δ zygotes reveal a requirement for proper mating projection shape (and thus fusion bridge shape) for the normal execution of later steps of mating, including nuclear migration and segregation.
Fig4p Belongs to a Gene Family Whose Members Possess Homology to Sac1p and Regulate Actin-dependent Processes
Like fig1Δ mutants, fig4Δ mutants are also impaired in mating cell morphogenesis. Fig4p displays extensive sequence similarity to the yeast Sac1p. Mutations in SAC1 alter actin cytoskeletal and secretory pathway dynamics and cause auxotrophy for inositol (Whitters et al., 1993). Loss of Sac1p function suppresses growth defects caused by certain conditional actin mutations and bypasses secretory defects imposed by mutations in the SEC14 gene (Cleves et al., 1989). These effects in sac1Δ mutants are thought to be the result of altered levels of phosphitidylinositol derivatives, which, in turn, may influence the activity of actin regulatory proteins responsive to inositol triphosphate (InsP3) (Whitters et al., 1993; De Camilli et al., 1996). Thus, one potential role for Fig4p in pheromone-induced morphogenesis is in the regulation of effector molecules of the actin cytoskeleton. Such a role for Fig4p is supported by the observation that the distribution of actin in mating projection tips of fig4Δ cells is usually dispersed and less intense relative to that in wild-type cells.
Although both proteins play roles in actin-dependent processes, an important issue that remains is whether Fig4p is performing Sac1p-related functions in mating cells or carries out a novel function. At least some conservation of biological activity exists between the two diverged proteins, since multiple copies of FIG4 are capable of suppressing some phenotypes of a sac1Δ mutant (Kearns et al., 1997; Gedvilaite, A., and V. Bankiatis, personal communication). Although Fig4p does not appear to be present in vegetative cells, Sac1p is likely to still be present in fig4Δ cells during mating, and may, thus, functionally overlap with Fig4p under these circumstances. We are currently examining the mating properties of sac1Δ mutants and fig4Δ sac1Δ mutants to address this issue.
Fig4p belongs to a growing family of proteins whose members contain a Sac1p homology domain; based on sequence comparisons this family is composed of several distinct groups (this study; Majerus, 1996). Two Sac1p family members, a human and a C. elegans protein, display the highest identity to Fig4p and are likely to be orthologues. Other mammalian members of the Sac1p family have been found to localize to neuronal synapses, which are highly polarized structures (McPherson et al., 1996). These proteins are thought to participate in the actin-dependent endocytosis of membranes from the nerve terminus (De Camilli et al., 1996). The activity performed by the Sac1p homology domain in any of these proteins remains undetermined. Further study of Fig4p and the family of Sac1p- related proteins should yield important insights into the functions of a large family of proteins that are conserved throughout eukaryotes and play key roles in cell polarity.
KAR5/FIG3 Encodes a Pheromone-regulated Protein Functioning in Nuclear Fusion
Mutations in KAR5/FIG3 display the strongest quantitative mating defect of the four genes characterized in this study. This defect was also distinct from those of fig1Δ, fig2Δ, and fig4Δ in that a large number of small and irregularly shaped colonies were generated from the kar5Δ/fig3Δ × kar5Δ/fig3Δ bilateral matings. These small colonies contain unstable heterokaryons that arise though failures in nuclear fusion. This observation is consistent with the finding that FIG3 corresponds to the KAR5 gene (Beh et al., 1997). KAR5 was identified in a screen for bilateral mating mutants (Kurihara et al., 1994).
The biochemical activity of Kar5p/Fig3p during nuclear fusion is not known. Kar5p contains extended coiled-coil regions, suggesting it either associates with itself or another protein to function in nuclear membrane fusion. Since many structural proteins such as intermediate filaments contain large coiled-coil segments (Steinert and Roop, 1988), Kar5p may play some structural role during nuclear fusion. Kar5p might act in conjunction with the previously described KAR2/BiP gene product, which is also involved in nuclear fusion and has mutant phenotypes very similar to kar5 (Rose et al., 1989). Like Kar2p/BiP, an epitope-tagged Kar5p localizes in an endoplasmic reticulum–like pattern in yeast (Erdman, S., and M. Snyder, unpublished data). Unlike KAR5, KAR2/BiP is not induced by pheromone (Rose et al., 1989). The process of nuclear membrane fusion, however, displays a requirement for pheromone stimulation (Rose et al., 1986). Kar5p may thus represent the component of the process of nuclear membrane fusion that confers its pheromone requirement.
Expression-based Screens and the Identification of Gene Function
Although many pheromone-induced genes were identified in this screen, mating phenotypes were not observed for most of the insertion mutant strains. A number of recently described pheromone-regulated components incur only subtle defects upon loss of function (Konopka, 1993; Iida et al., 1994; Gammie et al., 1995; Konopka et al., 1995). Additionally, mutations in many of the genes characterized in this study (e.g., FIG1, FIG2, and FIG4) caused relatively mild quantitative mating defects while producing significant morphological defects. Thus, the failure to identify requirements for the other genes tested in our study through measurements of mating efficiency and halo assays of pheromone sensitivity may not be surprising. The functions performed by many of these genes may also be partially or completely overlapped by other genes within the pheromone response pathway or in related parallel pathways that function in mating-specific processes. Identification of such redundant genes by expression-based methods, nonetheless, provides a valuable first step in the determination of the function of these genes. Further analysis of many of these types of genes will be necessary to obtain a complete understanding of the components and mechanisms that function in yeast mating.
Acknowledgments
We are grateful to F. Cross for the MATα plasmid and B. Andrews for the sst2 strains. We thank A. Gedviliate and V. Bankaitis; and C. Beh and M. Rose for communication of results before publication. The technical support of A. Sheehan and especially L. Umansky is gratefully acknowledged. B. Piekos provided expert assistance with electron microscopic techniques. We thank Y. Barral, B. Manning, P. Ross-Macdonald, and S. Vidan for critical comments on the manuscript and members of the Snyder lab for useful discussions. S. Minehart prepared the in-frame QOR1:: β-gal fusion.
Abbreviations used in this paper
- β-gal
β-galactosidase
- DAPI
4′,6-diamidino-Z-phenylindole
- DIC
differential interference-contrast microscopy
- FIG
factor-induced gene
- MAP
mitogen-activated kinase
- ORF
open reading frame
- PEG
polyethylene glycol
- PRE
pheromone response element
- SC
synthetic complete medium
- TM
transmembrane
- TMD
transmembrane domain
- YPD
yeast extract/peptone/dextrose medium
Note Added in Proof
The molecular characterization of KAR5 has recently been reported: Beh, C., V. Brizzio, and M.D. Rose. 1997. KAR5 encodes a novel pheromone-inducible protein required for homotypic nuclear fusion. J. Cell Biol. 139:1063–1076.
Footnotes
S. Erdman was supported by an American Cancer Society Postdoctoral Fellowship. This research was supported by National Institutes of Health grants (HD32637 and GM36494).
Address all correspondence to Michael Snyder, Dept. of Biology, PO Box 208103, Yale University, New Haven, CT 06520-8103. Tel.: (203) 432-6139. Fax: (203) 432-6161. E-mail: michael.snyder@yale.edu
References
- Altschul SF, Gish W, Miller W, Meyers EW, Lipman DJ. Basic local alignment search tool. J Mol Biol. 1990;215:403–410. doi: 10.1016/S0022-2836(05)80360-2. [DOI] [PubMed] [Google Scholar]
- Appeltauer U, Achstetter T. Hormone-induced expression of the CHS1 gene from Saccharomyces cerevisiae. . Eur J Biochem. 1989;181:243–247. doi: 10.1111/j.1432-1033.1989.tb14718.x. [DOI] [PubMed] [Google Scholar]
- Atcheson CL, DiDomenico B, Frackman S, Esposito RE, Elder RT. Isolation, DNA sequence, and regulation of a meiosis-specific eukaryotic recombination gene. Proc Natl Acad Sci USA. 1987;84:8035–8039. doi: 10.1073/pnas.84.22.8035. [DOI] [PMC free article] [PubMed] [Google Scholar]
- Bachmair A, Finley D, Varshavsky A. In vivo half-life of a protein is a function of its amino-terminal residue. Science. 1992;234:179–186. doi: 10.1126/science.3018930. [DOI] [PubMed] [Google Scholar]
- Baudin A, Ozier-Kalogeropoulos O, Denouel A, Lacroute F, Cullin C. A simple and efficient method for direct gene deletion in Saccharomyces cerevisiae. . Nucl Acids Res. 1993;21:3329–3330. doi: 10.1093/nar/21.14.3329. [DOI] [PMC free article] [PubMed] [Google Scholar]
- Boeke, J.D., and S.B. Sandmeyer. 1991. Yeast Transposable Elements. In The Molecular and Cellular Biology of the Yeast Saccharomyces: Genome Dynamics, Protein Synthesis, and Energetics. J.R. Broach, J.R. Pringle, and E.W. Jones, editors. Cold Spring Harbor Laboratories, Cold Spring Harbor, NY. 193–262.
- Brewster J, de Valoir T, Dwyer N, Winter E, Gustin M. An osmosensing signal transduction pathway in yeast. Science. 1993;259:1760–1763. doi: 10.1126/science.7681220. [DOI] [PubMed] [Google Scholar]
- Brill J, Elion E, Fink G. A role for autophosphorylation revealed by activated alleles of FUS3, the yeast MAP kinase homolog. Mol Biol Cell. 1994;5:297–312. doi: 10.1091/mbc.5.3.297. [DOI] [PMC free article] [PubMed] [Google Scholar]
- Brizzio V, Gammie AE, Nijbroek G, Michaelis S, Rose MD. Cell fusion during yeast mating requires high levels of a-factor mating pheromone. J Cell Biol. 1996;135:1727–1739. doi: 10.1083/jcb.135.6.1727. [DOI] [PMC free article] [PubMed] [Google Scholar]
- Bryant P. Junction genetics. Dev Genet. 1997;20:75–90. doi: 10.1002/(SICI)1520-6408(1997)20:2<75::AID-DVG1>3.0.CO;2-5. [DOI] [PubMed] [Google Scholar]
- Burns N, Grimwade B, Ross-Macdonald PB, Choi E-Y, Finberg K, Roeder GS, Snyder M. Large-scale characterization of gene expression, protein localization and gene disruption in Saccharomyces cerevisiae. . Genes Dev. 1994;8:1087–1105. doi: 10.1101/gad.8.9.1087. [DOI] [PubMed] [Google Scholar]
- Burns, N., P. Ross-Macdonald, G.S. Roeder, and M. Snyder. 1996. Generation, screening and analysis of lacZ fusions in yeast. Microb. Genome Meth. 61–79.
- Byers B, Goetsch L. Behavior of the spindle plaques in the cell cycle and conjugation of Saccharomyces cerevisiae. . J Bacteriol. 1975;124:511–523. doi: 10.1128/jb.124.1.511-523.1975. [DOI] [PMC free article] [PubMed] [Google Scholar]
- Chang F, Herskowitz I. Identification of a gene necessary for cell cycle arrest by a negative growth factor of yeast: FAR1 is an inhibitor of a G1 cyclin, CLN2. Cell. 1990;63:999–1011. doi: 10.1016/0092-8674(90)90503-7. [DOI] [PubMed] [Google Scholar]
- Chang TH, Abelson J. Identification of a putative amidase gene in the yeast Saccharomyces cerevisiae. . Nuc Acids Res. 1990;18:7180. doi: 10.1093/nar/18.23.7180. [DOI] [PMC free article] [PubMed] [Google Scholar]
- Chenevert J, Valtz N, Herskowitz I. Identification of genes required for normal pheromone-induced cell polarization in Saccharomyces cerevisiae. . Genetics. 1994;136:1287–1297. doi: 10.1093/genetics/136.4.1287. [DOI] [PMC free article] [PubMed] [Google Scholar]
- Choi K, Satterberg B, Lyons D, Elion E. Ste5 tethers multiple protein kinases in the MAP kinase cascade required for mating in S. cerevisiae. . Cell. 1994;78:499–512. doi: 10.1016/0092-8674(94)90427-8. [DOI] [PubMed] [Google Scholar]
- Cid V, Duran A, del Rey F, Snyder M, Nombela C, Sanchez M. Molecular basis of cell integrity and morphogenesis in Saccharomyces cerevisiae. . Microbiol Rev. 1995;59:345–386. doi: 10.1128/mr.59.3.345-386.1995. [DOI] [PMC free article] [PubMed] [Google Scholar]
- Cleves AE, Novick PJ, Bankaitis VA. Mutations in the SAC1gene suppress defects in yeast Golgi and yeast actin function. J Cell Biol. 1989;109:2939–2950. doi: 10.1083/jcb.109.6.2939. [DOI] [PMC free article] [PubMed] [Google Scholar]
- Company M, Adler C, Errede B. Identification of a Ty1 regulatory sequence responsive to STE7 and STE12. . Mol Cell Biol. 1988;8:2545–2554. doi: 10.1128/mcb.8.6.2545. [DOI] [PMC free article] [PubMed] [Google Scholar]
- Cross F, Hartwell LH, Jackson C, Konopka JB. Conjugation in Saccharomyces cerevisiae. . Annu Rev Cell Biol. 1988;4:429–457. doi: 10.1146/annurev.cb.04.110188.002241. [DOI] [PubMed] [Google Scholar]
- Crouzet M, Urdaci M, Dulau L, Aigle M. Yeast mutant affected for viability upon nutrient starvation: characterization and cloning of the RVS161 gene. Yeast. 1991;7:727–743. doi: 10.1002/yea.320070708. [DOI] [PubMed] [Google Scholar]
- David C, Solimena M, De Camilli P. Autoimmunity in stiff-Man syndrome with breast cancer is targeted to the C-terminal region of human amphiphysin, a protein similar to the yeast proteins, Rvs167 and Rvs161. FEBS (Fed Eur Biochem Soc) Lett. 1994;351:73–79. doi: 10.1016/0014-5793(94)00826-4. [DOI] [PubMed] [Google Scholar]
- De Camilli P, Emr S, McPherson P, Novick P. Phosphoinositides as regulators in membrane traffic. Science. 1996;271:1533–1539. doi: 10.1126/science.271.5255.1533. [DOI] [PubMed] [Google Scholar]
- Devereaux J, Haeberli P, Smithies O. A comprehensive set of sequence analysis programs for the VAX. Nucl Acids Res. 1984;12:387–395. doi: 10.1093/nar/12.1part1.387. [DOI] [PMC free article] [PubMed] [Google Scholar]
- Dietzel C, Kurjan J. The yeast SCG1 gene: a G alpha-like protein implicated in the a- and alpha-factor response pathway. Cell. 1987;50:1001–1010. doi: 10.1016/0092-8674(87)90166-8. [DOI] [PubMed] [Google Scholar]
- Dorer R, Boone C, Kimbrough T, Kim J, Hartwell LH. Genetic analysis of default mating behavior in Saccharomyces cerevisiae. . Genetics. 1997;146:39–55. doi: 10.1093/genetics/146.1.39. [DOI] [PMC free article] [PubMed] [Google Scholar]
- Dorer R, Pryciak PM, Hartwell LH. Saccharomyces cerevisiaecells execute a default pathway to select a mate in the absence of pheromone gradients. J Cell Biol. 1995;131:845–861. doi: 10.1083/jcb.131.4.845. [DOI] [PMC free article] [PubMed] [Google Scholar]
- Elia L, Marsh L. Role of the ABC transporter Ste6 in cell fusion during yeast conjugation. J Cell Biol. 1996;135:741–751. doi: 10.1083/jcb.135.3.741. [DOI] [PMC free article] [PubMed] [Google Scholar]
- Elion EA, Trueheart J, Fink GR. Fus2 localizes near the site of cell fusion and is required for both cell fusion and nuclear alignment during zygote formation. J Cell Biol. 1995;130:1283–1296. doi: 10.1083/jcb.130.6.1283. [DOI] [PMC free article] [PubMed] [Google Scholar]
- Errede B, Ammerer G. STE12, a protein involved in cell-type specific transcription and signal transduction in yeast is part of protein-DNA complexes. Genes Dev. 1989;3:1349–1361. doi: 10.1101/gad.3.9.1349. [DOI] [PubMed] [Google Scholar]
- Farkasovsky M, Kuntzel H. Yeast Num1p associates with the mother cell cortex during S/G2 phase and affects microtubular functions. J Cell Biol. 1995;131:1003–1014. doi: 10.1083/jcb.131.4.1003. [DOI] [PMC free article] [PubMed] [Google Scholar]
- Finbow M, Harrison M, Jones P. Ductin-a proton pump component, a gap junction channel and a neurotransmitter release channel. Bioessays. 1994;17:247–254. doi: 10.1002/bies.950170311. [DOI] [PubMed] [Google Scholar]
- Gammie AE, Kurihara LJ, Vallee RB, Rose MD. DNM1, a dynamin-related gene, participates in endosomal trafficking in yeast. J Cell Biol. 1995;130:553–566. doi: 10.1083/jcb.130.3.553. [DOI] [PMC free article] [PubMed] [Google Scholar]
- Gehrung S, Snyder M. The SPA2 gene of Saccharomyces cerevisiaeis important for pheromone-induced morphogenesis and efficient mating. J Cell Biol. 1990;111:1451–1464. doi: 10.1083/jcb.111.4.1451. [DOI] [PMC free article] [PubMed] [Google Scholar]
- Genbauffe FS, Cooper TG. Induction and repression of the urea amidolyase gene in Saccharomyces cerevisiae. . Mol Cell Biol. 1986;6:3954–3964. doi: 10.1128/mcb.6.11.3954. [DOI] [PMC free article] [PubMed] [Google Scholar]
- Gimeno, C.J. 1994. Characterization of Saccharomyces cerevisiae pseudohyphal development. Ph.D. thesis. Massachusetts Institute of Technology, Cambridge, MA.
- Gimeno CJ, Fink GR. Induction of pseudohyphal growth by overexpression of PHD1, a Saccharomyces cerevisiaegene related to transcriptional regulators of fungal development. Mol Cell Biol. 1994;14:2100–2112. doi: 10.1128/mcb.14.3.2100. [DOI] [PMC free article] [PubMed] [Google Scholar]
- Gimeno CJ, Ljungdahl PO, Styles CA, Fink GR. Unipolar cell divisions in the yeast S. cerevisiae lead to filamentous growth: regulation by starvation and RAS. . Cell. 1992;68:1077–1090. doi: 10.1016/0092-8674(92)90079-r. [DOI] [PubMed] [Google Scholar]
- Goodenough D, Golinger J, Paul D. Connexins, connexons, and intercellular communication. Annu Rev Biochem. 1996;65:475–502. doi: 10.1146/annurev.bi.65.070196.002355. [DOI] [PubMed] [Google Scholar]
- Hall J, Cherkasova V, Elion E, Gustin M, Winter E. The osmoregulatory pathway represses mating pathway activity in Saccharomyces cerevisiae: isolation of a FUS3mutant that is insensitive to the repression mechanism. Mol Cell Biol. 1996;16:6715–6723. doi: 10.1128/mcb.16.12.6715. [DOI] [PMC free article] [PubMed] [Google Scholar]
- Herskowitz I. MAP kinase pathways in yeast: for mating and more. Cell. 1995;80:187–197. doi: 10.1016/0092-8674(95)90402-6. [DOI] [PubMed] [Google Scholar]
- Herskowitz, I., H.-O. Park, S. Sanders, N. Valtz, and M. Peter. 1995. Programming of cell polarity in budding yeast by endogenous and exogenous signals. Cold Spring Harbor Symp. Quant. Biol. [DOI] [PubMed]
- Herskowitz, I., J. Rine, and J. Strathern. 1992. Mating-type Determination and Interconversion. In The Molecular and Cellular Biology of the Yeast Saccharomyces: Vol. 2, Gene Expression. E.W. Jones, J.R. Pringle, and J.R. Broach, editors. Cold Spring Harbor Press, Plainview, NY. 583–656.
- Hiltunen J K, Wenzel B, Beyer A, Erdmann R, Fossa A, Kunau W H. Peroxisomal multifunctional beta-oxidation protein of Saccharomyces cerevisiae.Molecular analysis of the Fox2 gene and gene product. J Biol Chem. 1992;267:6646–6653. [PubMed] [Google Scholar]
- Iida H, Nakamura H, Ono T, Okumura M S, Anraku Y. MID1, a novel Saccharomyces cerevisiae gene encoding a plasma membrane protein, is required for Ca2+influx and mating. Mol Cell Biol. 1994;14:8259–8271. doi: 10.1128/mcb.14.12.8259. [DOI] [PMC free article] [PubMed] [Google Scholar]
- Jackson CL, Hartwell LH. Courtship in Saccharomyces cerevisiae: an early cell-cell interaction during mating. Mol Cell Biol. 1990;10:2202–2213. doi: 10.1128/mcb.10.5.2202. [DOI] [PMC free article] [PubMed] [Google Scholar]
- Jackson CL, Konopka JB, Hartwell LH. S. cerevisiaeα-pheromone receptors activate a novel signal transduction pathway for mating partner discrimination. Cell. 1991;67:389–402. doi: 10.1016/0092-8674(91)90190-a. [DOI] [PubMed] [Google Scholar]
- Jauniaux JC, Grenson M. GAP1, the general amino acid permease gene of Saccharomyces cerevisiae.Nucleotide sequence, protein similarity with the other bakers yeast amino acid permeases, and nitrogen catabolite repression. Eur J Biochem. 1990;190:39–44. doi: 10.1111/j.1432-1033.1990.tb15542.x. [DOI] [PubMed] [Google Scholar]
- Johnston, M., and M. Carlson. 1992. Regulation of Carbon and Phosphate Utilization. In The Molecular Biology of the Yeast Saccharomyces. J.R. Broach, J.R. Pringle, and E.W. Jones, editors. Cold Spring Harbor Laboratory, Cold Spring Harbor, NY. 193–282.
- Kearns B, McGee T, Mayinger P, Gedvilaite A, Phillips S, Kagiwada S, Bankaitis V. Essential role for diacylglycerol in protein transport from the yeast Golgi complex. Nature. 1997;387:101–105. doi: 10.1038/387101a0. [DOI] [PMC free article] [PubMed] [Google Scholar]
- Keeney S, Giroux C, Kleckner N. Meiosis-specific DNA double-strand breaks are catalyzed by Spo11, a member of a widely conserved protein family. Cell. 1997;88:375–384. doi: 10.1016/s0092-8674(00)81876-0. [DOI] [PubMed] [Google Scholar]
- Klis FM. Cell wall assembly in yeast. Yeast. 1994;10:851–869. doi: 10.1002/yea.320100702. [DOI] [PubMed] [Google Scholar]
- Konopka JB. AFR1 acts in conjunction with the α-factor receptor to promote morphogenesis and adaptation. Mol Cell Biol. 1993;13:6876–6888. doi: 10.1128/mcb.13.11.6876. [DOI] [PMC free article] [PubMed] [Google Scholar]
- Konopka JB, DeMattei C, Davis C. AFR1 promotes polarized apical morphogenesis in Saccharomyces cerevisiae. . Mol Cell Biol. 1995;15:723–730. doi: 10.1128/mcb.15.2.723. [DOI] [PMC free article] [PubMed] [Google Scholar]
- Konopka JB, Jenness DD, Hartwell LH. The C-terminus of the S. cerevisiaeα-pheromone receptor mediates an adaptive response to pheromone. Cell. 1988;54:609–620. doi: 10.1016/s0092-8674(88)80005-9. [DOI] [PubMed] [Google Scholar]
- Kron SJ, Styles CA, Fink GR. Symmetric cell division in pseudohyphae of the yeast Saccharomyces cerevisiae. . Mol Biol Cell. 1994;5:1003–1022. doi: 10.1091/mbc.5.9.1003. [DOI] [PMC free article] [PubMed] [Google Scholar]
- Kronstad JW, Holly JA, MacKay VL. A yeast operator overlaps an upstream activation site. Cell. 1987;50:369–377. doi: 10.1016/0092-8674(87)90491-0. [DOI] [PubMed] [Google Scholar]
- Kunau WH, Hartig A. Peroxisome biogenesis in Saccharomyces cerevisiae. . Antonie Leeuwenhoek. 1992;62:63–78. doi: 10.1007/BF00584463. [DOI] [PubMed] [Google Scholar]
- Kurihara LJ, Beh CT, Latterich M, Schekman R, Rose MD. Nuclear congression and membrane fusion: two distinct events in the yeast karyogamy pathway. J Cell Biol. 1994;126:911–923. doi: 10.1083/jcb.126.4.911. [DOI] [PMC free article] [PubMed] [Google Scholar]
- Kurihara LJ, Stewart BG, Gammie AE, Rose MD. Kar4p, a karyogamy-specific component of the yeast pheromone response pathway. Mol Cell Biol. 1996;16:3990–4002. doi: 10.1128/mcb.16.8.3990. [DOI] [PMC free article] [PubMed] [Google Scholar]
- Kurjan J. The pheromone response pathway in Saccharomyces cerevisiae. . Annu Rev Genet. 1993;27:147–179. doi: 10.1146/annurev.ge.27.120193.001051. [DOI] [PubMed] [Google Scholar]
- Leeuw T, Fourest-Lieuvin A, Wu C, Chenevert J, Clark K, Whiteway M, Thomas DY, Leberer E. Pheromone response in yeast: association of Bem1p with proteins of the MAP kinase cascade and actin. Science. 1995;270:1210–1213. doi: 10.1126/science.270.5239.1210. [DOI] [PubMed] [Google Scholar]
- Lew DJ, Reed SI. A cell cycle checkpoint monitors cell morphogenesis in budding yeast. J Cell Biol. 1995;129:739–749. doi: 10.1083/jcb.129.3.739. [DOI] [PMC free article] [PubMed] [Google Scholar]
- Liu H, Styles CA, Fink GR. Elements of the yeast pheromone response pathway required for filamentous growth of diploids. Science. 1993;262:1741–1744. doi: 10.1126/science.8259520. [DOI] [PubMed] [Google Scholar]
- Ljungdahl PO, Gimeno CJ, Styles CA, Fink GR. SHR3: a novel component of the secretory pathway specifically required for localization of amino acid permeases in yeast. Cell. 1992;71:463–478. doi: 10.1016/0092-8674(92)90515-e. [DOI] [PubMed] [Google Scholar]
- Madden K, Snyder M. Specification of sites of polarized growth in Saccharomyces cerevisiaeand the influence of external factors on site selection. Mol Biol Cell. 1992;3:1025–1035. doi: 10.1091/mbc.3.9.1025. [DOI] [PMC free article] [PubMed] [Google Scholar]
- Madhani H, Fink GR. Combinatorial control required for the specificity of yeast MAPK signaling. Science. 1997;275:1314–1317. doi: 10.1126/science.275.5304.1314. [DOI] [PubMed] [Google Scholar]
- Magasanik, B. 1992. Regulation of Nitrogen Utilization. In The Molecular and Cellular Biology of the Yeast Saccharomyces. J.R. Broach, J.R. Pringle, and E.W. Jones, editors. Cold Spring Harbor Press, Cold Spring Harbor, NY. 283–318.
- Majerus PW. Inositols do it all. Genes Dev. 1996;10:1051–1053. doi: 10.1101/gad.10.9.1051. [DOI] [PubMed] [Google Scholar]
- Mazur P, Morin N, Baginsky W, El-Sherbeini M, Clemas J, Nielsen J, Foor F. Differential expression and function of two homologous subunits of yeast 1,3-β-d-glucan synthase. Mol Cell Biol. 1995;15:5671–5681. doi: 10.1128/mcb.15.10.5671. [DOI] [PMC free article] [PubMed] [Google Scholar]
- McCaffrey G, Clay FJ, Kelsay K, Sprague GF., Jr Identification and regulation of a gene required for cell fusion during mating of the yeast Saccharomyces cerevisiae. . Mol Cell Biol. 1987;7:2680–2690. doi: 10.1128/mcb.7.8.2680. [DOI] [PMC free article] [PubMed] [Google Scholar]
- McPherson PS, Garcia E, Slepnev V, David C, Zhang X, Grabs D, Sossin W, Bauerfeind R, Nemoto Y, Camilli PD. A presynaptic inositol-5-phosphatase. Nature. 1996;379:353–357. doi: 10.1038/379353a0. [DOI] [PubMed] [Google Scholar]
- Measday V, Moore L, Ogas J, Tyers M, Andrews B. The PCL2 (ORFD)-PHO85 cyclin dependent kinase complex: a cell cycle regulator in yeast. Science. 1994;266:1391–1395. doi: 10.1126/science.7973731. [DOI] [PubMed] [Google Scholar]
- Mewes, H. et al. 1997. The yeast genome directory. Nature. 387 (Suppl.):7–8.
- Michaelis S. STE6, the yeast a-factor transporter. Semin Cell Biol. 1993;4:17–27. doi: 10.1006/scel.1993.1003. [DOI] [PubMed] [Google Scholar]
- Miyajima I, Nakafuku M, Nakayama N, Brenner C, Miyajima A, Kaibuchi K, Arai K, Kaziro Y, Matsumoto K. GPA1, a haploid-specific essential gene, encodes a yeast homolog of mammalian G protein which may be involved in mating factor signal transduction. Cell. 1987;50:1011–1019. doi: 10.1016/0092-8674(87)90167-x. [DOI] [PubMed] [Google Scholar]
- Miyamoto S, Ohya Y, Ohsumi Y, Anraku Y. Nucleotide sequence of the CLS4 (CDC24) gene of Saccharomyces cerevisiae. . Gene. 1987;54:125–132. doi: 10.1016/0378-1119(87)90354-4. [DOI] [PubMed] [Google Scholar]
- Mizuta K, Hashimoto T, Otaka E. The evolutionary relationships between homologs of ribosomal YL8 protein and YL8-like proteins. Curr Genet. 1995;28:19–25. doi: 10.1007/BF00311877. [DOI] [PubMed] [Google Scholar]
- Munn A, Stevenson B, Geli M, Riezman H. end5, end6, and end7: mutations that cause actin delocalization and block the internalization step of endocytosis in Saccharomyces cerevisiae. . Mol Biol Cell. 1995;6:1721–1742. doi: 10.1091/mbc.6.12.1721. [DOI] [PMC free article] [PubMed] [Google Scholar]
- Novick P, Osmond BC, Botstein D. Suppressors of yeast actin mutations. Genetics. 1989;121:659–674. doi: 10.1093/genetics/121.4.659. [DOI] [PMC free article] [PubMed] [Google Scholar]
- Ogawa N, Noguchi K, Sawai H, Yamashita Y, Yompakdee C, Oshima Y. Functional domains of Pho81p, an inhibitor of Pho85p protein kinase, in the transduction pathway of Pi signals in Saccharomyces cerevisiae. . Mol Cell Biol. 1995;15:997–1004. doi: 10.1128/mcb.15.2.997. [DOI] [PMC free article] [PubMed] [Google Scholar]
- Ohsumi Y, Anraku Y. Specific induction of Ca2+ transport activity in MATa cells of Saccharomyces cerevisiaeby a mating pheromone, α-factor. J Biol Chem. 1985;260:10482–10486. [PubMed] [Google Scholar]
- Olson, M.V. 1991. Genome Structure and Organization in Saccharomyces cerevisiae. In The Molecular and Cellular Biology of the Yeast Saccharomyces: Genome Dynamics, Protein Synthesis, and Energetics. J.R. Broach, J.R. Pringle, and E.W. Jones, editors. Cold Spring Harbor Laboratories, Cold Spring Harbor, NY. 1–39.
- Page BD, Snyder M. CIK1: a developmentally regulated spindle pole body-associated protein important for microtubule functions in Saccharomyces cerevisiae. . Genes Dev. 1992;6:1414–1429. doi: 10.1101/gad.6.8.1414. [DOI] [PubMed] [Google Scholar]
- Palmer RE, Sullivan DS, Huffaker T, Koshland D. Role of astral microtubules and actin in spindle orientation and migration in the budding yeast, Saccharomyces cerevisiae. . J Cell Biol. 1992;119:583–593. doi: 10.1083/jcb.119.3.583. [DOI] [PMC free article] [PubMed] [Google Scholar]
- Price C, Nasmyth K, Schuster T. A general approach to the isolation of cell cycle-regulated genes in the budding yeast, Saccharomyces cerevisiae. . J Mol Biol. 1991;218:543–556. doi: 10.1016/0022-2836(91)90700-g. [DOI] [PubMed] [Google Scholar]
- Pringle, J., A.E.M. Adams, D.G. Drubin, and B.K. Haarer. 1991. Immunofluorescence Methods for Yeast. In Guide to Yeast Genetics and Molecular Biology. C. Guthrie and G.R. Fink, editors. Academic Press, NY. 565–601.
- Pringle J, Bi E, Harkins H, Zahner J, Devirgilio C, Chant J, Corado K, Fares H. Establishment of cell polarity in yeast. Cold Spring Harbor Symp Quant Biol. 1995;60:729–744. doi: 10.1101/sqb.1995.060.01.079. [DOI] [PubMed] [Google Scholar]
- Reiser J, Muheim A, Hardegger M, Frank G, Fiechter A. Aryl- alcohol dehydrogenase from the white-rot fungus Phanerochaete chrysosporium.Gene cloning, sequence analysis, expression, and purification of the recombinant enzyme. J Biol Chem. 1994;269:28152–28159. [PubMed] [Google Scholar]
- Roberts R, Fink GR. Elements of a single MAP kinase cascade in Saccharomyces cerevisiaemediate two developmental programs in the same cell type: mating and invasive growth. Genes Dev. 1994;8:2974–2985. doi: 10.1101/gad.8.24.2974. [DOI] [PubMed] [Google Scholar]
- Robinson L, Hubbard E, Graves P, DePaoli-Roach A, Roach P, Kung C, Haas D, Hagedorn C, Goebl M, Culbertson M, et al. Yeast casein kinase I homologues: an essential gene pair. Proc Natl Acad Sci USA. 1992;89:28–32. doi: 10.1073/pnas.89.1.28. [DOI] [PMC free article] [PubMed] [Google Scholar]
- Roemer T, Vallier L, Snyder M. Selection of polarized growth sites in yeast. Trends Cell Biol. 1996;6:434–441. doi: 10.1016/s0962-8924(96)10039-8. [DOI] [PubMed] [Google Scholar]
- Rose, M.D., and L. Marsh. 1997. The Pathway of Cell and Nuclear Fusion during Mating in S. cerevisiae. Cell Cycle and Cell Biology. Vol. 3. J.R. Pringle, J.R. Broach, and E.W. Jones, editors. Cold Spring Harbor Laboratory Press, Plainview, NY. 583–656.
- Rose MD, Misra LM, Vogel JP. KAR2, a karyogamy gene, is the yeast homolog of the mammalian BiP/GRP78 gene. Cell. 1989;57:1211–1221. doi: 10.1016/0092-8674(89)90058-5. [DOI] [PubMed] [Google Scholar]
- Rose MD, Price BR, Fink GR. Saccharomyces cerevisiaenuclear fusion requires prior activation by α factor. Mol Cell Biol. 1986;6:3490–3497. doi: 10.1128/mcb.6.10.3490. [DOI] [PMC free article] [PubMed] [Google Scholar]
- Rose, M.D., F. Winston, and P. Hieter. 1990. Methods in Yeast Genetics: A Laboratory Course Manual. Cold Spring Harbor Laboratories, Cold Spring Harbor, NY. 198 pp.
- Sambrook, J., E.F. Fritsch, and T. Maniatis. 1989. Molecular Cloning: A Laboratory Manual. Cold Spring Harbor Laboratory, Cold Spring Harbor, NY.
- Schwiebert EM, Egan ME, Hwang TH, Fulmer SB, Allen SS, Cutting GR, Guggino WB. CFTR regulates outwardly rectifying chloride channels through an autocrine mechanism involving ATP. Cell. 1995;81:1063–1073. doi: 10.1016/s0092-8674(05)80011-x. [DOI] [PubMed] [Google Scholar]
- Segall JE. Polarization of yeast cells in spatial gradients of α-factor. Proc Natl Acad Sci USA. 1993;90:8332–8336. doi: 10.1073/pnas.90.18.8332. [DOI] [PMC free article] [PubMed] [Google Scholar]
- Sherman, F., G.R. Fink, and J. Hicks 1986. Methods in Yeast Genetics. Cold Spring Harbor Laboratories, Cold Spring Harbor, NY.
- Sikorski R, Hieter P. A system of shuttle vectors and yeast host strains designed for efficient manipulation of DNA in Saccharomyces cerevisiae. . Genetics. 1989;122:19–27. doi: 10.1093/genetics/122.1.19. [DOI] [PMC free article] [PubMed] [Google Scholar]
- Sprague, G.F, Jr., and J. Thorner. 1992. Pheromone Response and Signal Transduction during the Mating Process of Saccharomyces cerevisiae. In The Molecular Biology of the Yeast Saccharomyces. J.R. Broach, J.R. Pringle, and E.W. Jones, editors. Cold Spring Harbor Laboratory, Cold Spring Harbor, NY. 657–744.
- Sprague GF., Jr Assay of yeast mating reaction. Meth Enzymol. 1991;194:77–93. doi: 10.1016/0076-6879(91)94008-z. [DOI] [PubMed] [Google Scholar]
- Stanbrough M, Magasanik B. Transcriptional and posttranslational regulation of the general amino acid permease of Saccharomyces cerevisiae. . Proc Natl Acad Sci USA. 1995;177:94–102. doi: 10.1128/jb.177.1.94-102.1995. [DOI] [PMC free article] [PubMed] [Google Scholar]
- Steinert PM, Roop R. The molecular and cellular biology of intermediate filaments. Annu Rev Biochem. 1988;57:593–625. doi: 10.1146/annurev.bi.57.070188.003113. [DOI] [PubMed] [Google Scholar]
- Stetler GL, Thorner J. Molecular cloning of hormone-responsive genes from the yeast Saccharomyces cerevisiae. . Proc Natl Acad Sci USA. 1984;81:1144–1148. doi: 10.1073/pnas.81.4.1144. [DOI] [PMC free article] [PubMed] [Google Scholar]
- Stevenson B, Ferguson B, De Virgilio C, Bi E, Pringle J, Ammerer G, Sprague GF., Jr Mutation of RGA1, which encodes a putative GTPase-activating protein for the polarity-establishment protein Cdc42p, activates the pheromone-response pathway in the yeast Saccharomyces cerevisiae. . Genes Dev. 1995;9:2949–2963. doi: 10.1101/gad.9.23.2949. [DOI] [PubMed] [Google Scholar]
- Timblin B, Tatchell KK, Bergman LW. Deletion of the gene encoding the cyclin-dependent protein kinase Pho85 alters glycogen metabolism in Saccharomyces cerevisiae. . Genetics. 1996;143:57–66. doi: 10.1093/genetics/143.1.57. [DOI] [PMC free article] [PubMed] [Google Scholar]
- Trueheart J, Boeke JD, Fink GR. Two genes required for cell fusion during yeast conjugation: evidence for a pheromone-induced surface protein. Mol Cell Biol. 1987;7:2316–2328. doi: 10.1128/mcb.7.7.2316. [DOI] [PMC free article] [PubMed] [Google Scholar]
- Trueheart J, Fink GR. The yeast cell fusion protein FUS1 is O-glycosylated and spans the plasma membrane. Proc Natl Acad Sci USA. 1989;86:9916–9920. doi: 10.1073/pnas.86.24.9916. [DOI] [PMC free article] [PubMed] [Google Scholar]
- Valenzuela P, Bell GI, Venegas A, Sewell ET, Masiarz FR, Degennaro LJ, Weinberg F, Rutter WJ. Ribosomal rna genes of Saccharomyces cerevisiae: ii. Physical map and nucleotide sequence of the 5S ribosomal rna gene and adjacent intergenic regions. J Biol Chem. 1977;252:8126–8135. [PubMed] [Google Scholar]
- Valtz N, Peter M, Herskowitz I. FAR1is required for oriented polarization of yeast cells in response to mating pheromones. J Cell Biol. 1995;131:863–873. doi: 10.1083/jcb.131.4.863. [DOI] [PMC free article] [PubMed] [Google Scholar]
- Van Arsdell SW, Stetler GL, Thorner J. The yeast repeated element sigma contains a hormone-inducible promoter. Mol Cell Biol. 1987;7:749–759. doi: 10.1128/mcb.7.2.749. [DOI] [PMC free article] [PubMed] [Google Scholar]
- Velculescu VE, Zhang L, Zhou W, Vogelstein J, Basrai MA, Bassett DE, Jr, Hieter P, Vogelstein B, Kinzler KW. Characterization of the yeast transcriptome. Cell. 1997;88:243–251. doi: 10.1016/s0092-8674(00)81845-0. [DOI] [PubMed] [Google Scholar]
- Voytas DF, Boeke JD. Yeast retrotransposon revealed. Nature. 1992;358:717. doi: 10.1038/358717a0. [DOI] [PubMed] [Google Scholar]
- Wang X, Hoekstra MF, DeMaggio AJ, Dhillon N, Vancura A, Kuret J, Johnston GC, Singer RA. Prenylated isoforms of yeast casein kinase I, including the novel Yck3p, suppress the gcs1 blockage of cell proliferation from stationary phase. Mol Cell Biol. 1996;16:5375–5385. doi: 10.1128/mcb.16.10.5375. [DOI] [PMC free article] [PubMed] [Google Scholar]
- Weiner B, Kleckner N. Chromosome pairing via multiple interstitial interactions before and during meiosis in yeast. Cell. 1994;77:977–991. doi: 10.1016/0092-8674(94)90438-3. [DOI] [PubMed] [Google Scholar]
- Whitters EA, Cleves AE, McGee TP, Skinner HB, Bankaitis VA. SAC1p is an integral membrane protein that influences the cellular requirement for phospholipid transfer protein function and inositol in yeast. J Cell Biol. 1993;122:79–94. doi: 10.1083/jcb.122.1.79. [DOI] [PMC free article] [PubMed] [Google Scholar]
- Wieland J, Nitsche AM, Strayle J, Steiner H, Rudolph HK. The PMR2 gene cluster encodes functionally distinct isoforms of a putative Na+pump in the yeast plasma membrane. EMBO (Eur Mol Biol Organ) J. 1995;14:3870–3882. doi: 10.1002/j.1460-2075.1995.tb00059.x. [DOI] [PMC free article] [PubMed] [Google Scholar]
- Wright MD, Tomlinson MG. The ins and outs of the transmembrane 4 superfamily. Immunol Today. 1994;15:588–594. doi: 10.1016/0167-5699(94)90222-4. [DOI] [PubMed] [Google Scholar]
- Xie K, Lambie E, Snyder M. Nuclear dot antigens may specify transcriptional domains in the nucleus. Mol Cell Biol. 1993;13:6170–6179. doi: 10.1128/mcb.13.10.6170. [DOI] [PMC free article] [PubMed] [Google Scholar]