

Abstract
The contribution of noncadherin-type, Ca2+-independent cell–cell adhesion molecules to the organization of epithelial tissues is, as yet, unclear. A homophilic, epithelial Ca2+-independent adhesion molecule (Ep-CAM) is expressed in most epithelia, benign or malignant proliferative lesions, or during embryogenesis. Here we demonstrate that ectopic Ep-CAM, when expressed in cells interconnected by classic cadherins (E- or N-cadherin), induces segregation of the transfectants from the parental cell type in coaggregation assays and in cultured mixed aggregates, respectively. In the latter assay, Ep-CAM–positive transfectants behave like cells with a decreased strength of cell–cell adhesion as compared to the parental cells. Using transfectants with an inducible Ep-CAM–cDNA construct, we demonstrate that increasing expression of Ep-CAM in cadherin-positive cells leads to the gradual abrogation of adherens junctions. Overexpression of Ep-CAM has no influence on the total amount of cellular cadherin, but affects the interaction of cadherins with the cytoskeleton since a substantial decrease in the detergent-insoluble fraction of cadherin molecules was observed. Similarly, the detergent-insoluble fractions of α- and β-catenins decreased in cells overexpressing Ep-CAM. While the total β-catenin content remains unchanged, a reduction in total cellular α-catenin is observed as Ep-CAM expression increases. As the cadherin-mediated cell–cell adhesions diminish, Ep-CAM–mediated intercellular connections become predominant. An adhesion-defective mutant of Ep-CAM lacking the cytoplasmic domain has no effect on the cadherin-mediated cell–cell adhesions. The ability of Ep-CAM to modulate the cadherin-mediated cell–cell interactions, as demonstrated in the present study, suggests a role for this molecule in development of the proliferative, and probably malignant, phenotype of epithelial cells, since an increase of Ep-CAM expression was observed in vivo in association with hyperplastic and malignant proliferation of epithelial cells.
Tissue and organ morphogenesis can be viewed as the result of interactions of various cell populations. One important type of intercellular interaction involved in the processes of tissue morphogenesis, morphogenetic movements of cells, and segregation of cell types, are adhesions mediated by cell adhesion molecules (Steinberg and Pool, 1982; Edelman, 1986; Cunningham, 1995; Takeichi, 1995; Gumbiner, 1996). Except for their direct mechanical role as interconnectors of cells and connectors of cells to substrates, cell adhesion molecules are also believed to be responsible for a variety of dynamic processes including cell locomotion, proliferation, and differentiation. There is also evidence that the adhesion systems within a cell may act as regulators of other cell adhesions, thereby offering a means of signaling that is relevant for rearrangements in cell or tissue organization (Edelman, 1993; Rosales et al., 1995; Gumbiner, 1996).
In many tissues, a critical role in the maintenance of multicellular structures is assigned to cadherins, a family of Ca2+-dependent, homophilic cell–cell adhesion molecules (Takeichi, 1991, 1995; Gumbiner, 1996). In epithelia this critical role belongs to E-cadherin, which is crucial for the establishment and maintenance of epithelial cell polarity (McNeil et al., 1990; Näthke et al., 1993), morphogenesis of epithelial tissues (Wheelock and Jensen, 1992; Larue et al., 1996), and regulation of cell proliferation and programmed cell death (Hermiston and Gordon, 1995; Hermiston et al., 1996; Takahashi and Suzuki, 1996; Wilding et al., 1996; Zhu and Watt, 1996). Expression of different types of classic cadherin molecules (Nose et al., 1988; Friedlander et al., 1989; Daniel et al., 1995), and even quantitative differences in the levels of the same type of cadherin (Steinberg and Takeichi, 1994), may be responsible for segregation of cell types in epithelial tissues. The phenotype of epithelial cells may be modulated by expression of combinations of different types of cadherins (Marrs et al., 1995; Islam et al., 1996). However, cadherins represent only one of the intercellular adhesion systems that are present in epithelia, along with adhesion molecules of the immunoglobulin superfamily, such as carcinoembryonic antigen (Benchimol et al., 1989), and others. The actual contribution of Ca2+-independent nonjunctional adhesion molecules to the formation and maintenance of the epithelial tissue architecture and epithelial cell morphology is not clear.
We have recently demonstrated that a 40-kD epithelial glycoprotein, which we have designated epithelial cell adhesion molecule (Ep-CAM)1 (Litvinov et al., 1994a ), may perform as a homophilic, Ca2+-independent intercellular adhesion molecule, capable of mediating cell aggregation, preventing cell scattering, and directing cell segregation. This type I transmembrane glycoprotein consists of two EGF-like domains followed by a cysteine-poor region, a transmembrane domain, and a short (26-amino acid) cytoplasmic tail, and is not structurally related to the four major types of CAMs, such as cadherins, integrins, selectins, and the immunoglobulin superfamily (for review see Litvinov, 1995). Ep-CAM demonstrates adhesion properties when introduced into cell systems that are deficient in intercellular adhesive interactions (Litvinov et al., 1994a ). However, the participation of the Ep-CAM molecule in supporting cell–cell interactions of epithelial cells was not evident (Litvinov et al., 1994b ).
Most epithelial cell types coexpress E-cadherin (and sometimes other classic cadherins) and Ep-CAM (for review see Litvinov, 1995) during some stage of embryogenesis. In adult squamous epithelia, which are Ep-CAM negative, de novo expression of this molecule is associated with metaplastic or neoplastic changes. Thus, in ectocervical epithelia, expression of Ep-CAM occurs in early preneoplastic lesions (Litvinov et al., 1996); most squamous carcinomas of the head and neck region are Ep-CAM positive (Quak et al., 1990), and basal cell carcinomas are Ep-CAM positive in contrast to the normal epidermis (Tsubura et al., 1992).
In many tumors that express Ep-CAM heterogeneously, an Ep-CAM–positive cell population may be found within an Ep-CAM–negative cell population, with both cell types expressing approximately equal levels of cadherins, as illustrated in Fig. 1 A by a case of basal cell carcinoma. In glandular tissues such as gastric epithelium, which are low/ negative for Ep-CAM, expression of Ep-CAM is related to the development of early stages of intestinal metaplasia (our unpublished observation). Even in tissues with relatively high Ep-CAM expression, such as colon, the development of polyps is accompanied by an increase in Ep-CAM expression (Salem et al., 1993). In intestinal metaplasia one may observe Ep-CAM–positive cells bordering morphologically identical normal cells that are Ep-CAM–negative (as illustrated in Fig. 1 B) Ep-CAM–positive cells bordering Ep-CAM–negative epithelial cells may also be found in some normal tissues such as hair follicles (Tsubura et al., 1992).
Figure 1.
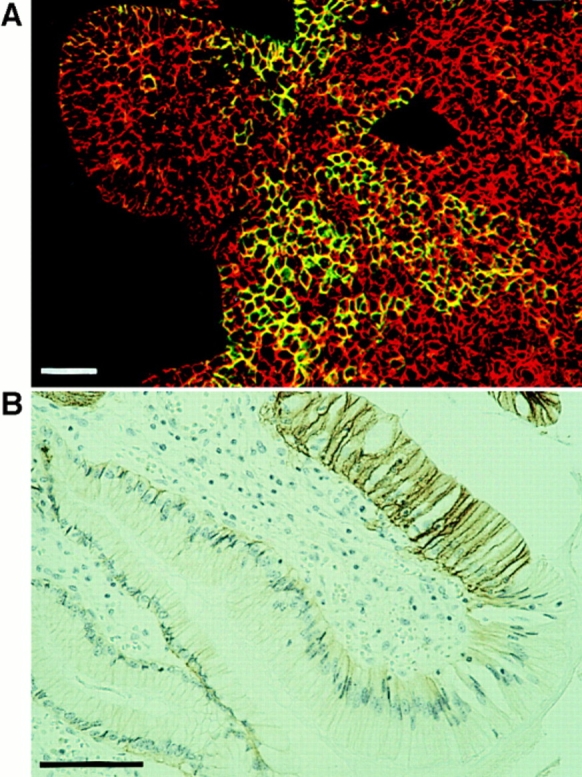
Examples of Ep-CAM expression by some cells within the E-cadherin–positive cell population. (A) Heterogeneous expression of Ep-CAM in a basal cell carcinoma, as detected by immunofluorescent staining with mAb 323/A3 to Ep-CAM (green fluorescence); the red fluorescence indicates the expression of E-cadherin (mAb HECD-1). (B) The de novo expression of Ep-CAM in gastric mucosa in relation to the development of intestinal metaplasia; immunohistochemical staining with mAb 323/A3. Note the bordering Ep-CAM–positive and –negative cells. Bars, 30 μM.
From the examples presented, an increased or de novo expression of Ep-CAM is often observed in epithelial tissues in vivo. Expression of an additional molecule that may participate in cell adhesion in the context of other adhesion systems may have certain effects on the cell–cell interactions. Therefore, we have investigated whether the increased/de novo expression of Ep-CAM in epithelial cells (a) has any impact on interactions of positive cells with the parental Ep-CAM–negative cells, and (b) modulates in any way intercellular adhesive interactions of cells interconnected by E-cadherin, which is the major morphoregulatory molecule in epithelia.
Here we demonstrate that expression of Ep-CAM by some cells in a mixed cell population expressing classical cadherins induces segregation of the Ep-CAM–positive cells from the parental cell population due to a negative effect on cadherin junctions caused by expression of Ep-CAM. The cadherin-modulating properties observed for Ep-CAM suggest a role for this molecule in the development of a proliferative and metaplastic cell phenotype, and probably in the development and progression of malignancies.
Materials and Methods
DNA Constructs
The SmaI–BglII fragment of human Ep-CAM cDNA was used for the wild-type Ep-CAM expression constructs, as reported earlier (Litvinov et al., 1994a ). Mutant Ep-CAM with a truncated cytoplasmic tail (Mu1) was generated by PCR amplification of the fragment of Ep-CAM cDNA corresponding to amino acids 1–289. The wild-type and mutant Ep-CAM cDNAs were cloned into pCEP4 and pMEP4 vectors (Invitrogen BV, Leek, The Netherlands) under the control of cytomegalovirus or metallothionein II promotors, respectively. Both vectors used contain the Epstein-Barr virus's origin of replication and the EBNA-1 gene, which allow both episomal replication and self-support of the plasmid to copy large numbers of human cells. In murine cells, both vectors integrate into the cellular DNA.
Cells and Transfections
The murine E–cadherin transfected L (LEC) cells (clone LUN.6), and the HCA clonal cell line isolated from the SV-40 immortalized normal mammary epithelial cell line HBL-100 were recloned in our laboratory before transfections (provided by J. Hilkens, The Netherlands Cancer Institute, Amsterdam, The Netherlands). L cells (L929), colon carcinoma cell line (LS180), mammary carcinoma cells (MCF-7), and the pancreatic carcinoma cell line (CAPAN) were obtained from American Type Culture Collection (Rockville, MD). The normal human mammary epithelium-derived cell line RC-6 and the squamous carcinoma cell line (U2) were cultured in DME with 10% FCS (provided by E. Schuuring, Leiden University, Leiden, The Netherlands) as were all cell lines. Cells were transfected using the DOTAP reagent (Boehringer Mannheim Corp., Mannheim, Germany) as described earlier (Litvinov et al., 1994a ). For murine cells, the stable clones obtained were either grown as isolated clones or were pooled; human transfected cell lines were continuously cultured in the presence of the selection marker (hygromycin, 1 mg/ml; Boehringer Mannheim Corp.). 48 h before the experiments, cells were passaged into medium without hygromycin. To induce the expression of constructs under the control of the metallothionein promotor (pMEP4 vector), CdCl2 was added to the culture medium at concentrations of 2–50 μM depending on the cell line.
Cell Aggregation Assay
Cell aggregation assays were performed as described earlier (Litvinov et al., 1994a ). The cells were detached with either TC treatment (Hank's buffer with 0.01% trypsin and 1 mM CaCl2), or by 0.2% EDTA in Hank's buffer. The degree of cell aggregation was calculated as D = (No − Nt)/No, where Nt is the number of remaining particles at the incubation time point t, and No is the initial number of particles corresponding to the total number of cells.
Labeling of Cells and Cell Sorting Experiments
For cell sorting experiments, the cells were labeled according to the manufacturer's protocol with fluorescent dyes (PKH-2 [green fluorochrome] or PKH-26 [red fluorochrome]; Zynaxis Cell Science Inc., Malvern, PA), that incorporate the membrane's lipid bilayer. These fluorochromes provide a stable labeling of living cells and do not interfere with either cell surface proteins or with the cell's behavior and interactions (Horan et al., 1990; Litvinov et al., 1994a ). Cell sorting/patterning experiments were performed as described elsewhere (Nose et al., 1988; Litvinov et al., 1994). Briefly, cells were dissociated with TC, washed three times in Dulbecco's PBS, labeled with one of the fluorochromes, washed three times in 50% FCS in DME, resuspended in DME containing 0.8% FCS and 1 mg/ml DNase (Boehringer Mannheim Corp.), mixed at various ratios depending on the experiment, and allowed to aggregate as described for the aggregation assay. After 1–2 h of aggregation, the suspension of aggregates was analyzed under a confocal microscope (model BRC-600; Bio-Rad Laboratories, Carlsbad, CA). Images from different areas of the preparation were taken, and the number of cells of each color in the aggregates was determined. To study the segregation/patterning of cells in aggregates, the two cell types labeled with different fluorescent dyes were mixed at equal ratios, spun down, and allowed to aggregate in the pellet during the next 2 h at 37°C. The large aggregate formed was mechanically dispersed into smaller fragments, which were further cultured in suspension on a rotating platform (at 140 rpm). After 30 min and 24 h of culture, respectively, samples of the aggregates were fixed with 4% formaldehyde in PBS/1 mM CaCl2, and analyzed with a confocal microscope.
Antibodies
Anti–Ep-CAM antibodies were 323/A3 (against human Ep-CAM; Litvinov et al., 1994) and G8.8 (against murine Ep-CAM; Nelson et al., 1996). The antibodies against epitopes in extracellular domains of human E-cadherin and human P-cadherin were obtained from Thamer Diagnostica BV (clones HECD-1 and NCC-CAD-299, respectively; Uithoorn, The Netherlands). A mAb against an epitope in the extracellular domain of N-cadherin (clone GC-4) was obtained from Sigma Chemical Co. (St. Louis, MO). Antibody to the cytoplasmic domain of classical cadherins (clone CH-19; Sigma Chemical Co.), strongly reactive with N-cadherin and weak with other cadherin types, was used for immunoblotting experiments. Two mAbs against murine E-cadherin were used: one reactive with an epitope in the cytoplasmic domain (clone 36; Transduction Laboratories, Lexington, KY), and one reactive with the extracellular domain of the molecule (ECCD-2; Takara Shuzo Co., Shiga, Japan). Antibodies to α-catenin (clone αCAT-7A4; Zymed Laboratories, South San Francisco, CA) and β-catenin (clone 14; Transduction Laboratories) both had cross-species reactivity. For immunoblotting experiments on immunoprecipitates, a polyclonal rabbit antiserum to α-catenin was used (gift of J. Behrens, Max Delbrueck Center for Molecular Medicine, Berlin, Germany).
Immunofluorescence Microscopy
Cells growing on either glass slides or in multiwell chamber slides (Nunc, Naperville, IL) were fixed for 10 min in −20°C MeOH, rinsed quickly in −20°C acetone, and allowed to dry. The preparations were blocked in 5% skim milk solution in PBS for 30 min at 37°C, and indirect immunofluorescent staining was performed using a specific mAb and a goat anti–mouse IgG–FITC conjugate (Southern Biotechnologies, Birmingham, AL). The preparations were analyzed with a confocal microscope (model BRC-600; Bio-Rad Laboratories).
Reflection Contrast Microscopy and Electron Microscopy
Both were performed as described (Prins et al., 1993). Cell aggregates were fixed with 2% paraformaldehyde/1.25% glutaraldehyde, postfixed with 1% osmium tetroxide, embedded into Epon, and ultrathin sectioned. The preparations were examined, respectively, with a microscope equipped for epi-illumination (model Orthoplan; Leithz, Wetzlar, Germany), and an electron microscope (model CM10; Philips Electron Optics, Eindhoven, The Netherlands).
Flow Cytometry
The expression of Ep-CAM was detected on living cells by using F(ab) fragments of mAb 323/A3 directly conjugated with 5(6)-Carboxy-fluorescein-N-hydroxysuccinimide ester (FLUOS), a FITC-like fluorochrome. The conjugation was performed according to the manufacturer's protocol (Boehringer Mannheim Corp.). To detect the cell surface expression of murine E-cadherin or human N-cadherin the mAbs ECCD-2 and GC-4 were used. The bound mAb was detected with an appropriate species-specific anti–IgG-FITC conjugate (Southern Biotechnologies).
Cell Lysis and Cell Extraction with Detergents
Cells of various transfected cell lines were seeded at equal density on 10-cm Petri dishes 48 h before lysis and cultured during the last 24 h in either the presence or absence of Cd2+ cations in the medium. To prepare total cell lysates, cells on dishes were rinsed twice with ice-cold PBS (pH 7.4), and lysed in 1 ml of hot (100°C) 1% SDS/10 mM EDTA. The extraction of detergent-soluble cadherins and catenins was performed as described by Hinck et al. (1994). Cells were rinsed three times with cold PBS, and 2 ml of cold extraction buffer (50 mM Tris/HCl, pH 7.0, 50 mM NaCl, 3 mM MgCl2, 0.5% Triton X-100, 300 mM sucrose, and protease inhibitor [complete; Boehringer Mannheim Corp.]) were added to the cells. Cells were incubated for 45 min on a shaker at 4°C, detached with a scraper, collected, and spun down in a centrifuge for 10 min at 15,000 rpm (5415C; Eppendorf Scientific, Inc., Hamburg, Germany). The pellet was lysed with hot (100°C) 1% SDS, 10 mM EDTA and then boiled for 5 min. The lysates obtained with hot SDS were spun through a spin column (QiaShredder; QUIAGEN Inc., Hilden, Germany) to reduce the viscosity caused by DNA, and the preparations obtained were used for gel electrophoresis. The protein content was determined for each sample by measuring the optical density at 224 nm of a sample aliquot prediluted with 4% SDS.
Immunoprecipitation and Immunoblotting
Cells were lysed with extraction buffer (as described above), the lysates were clarified by centrifugation in a centrifuge for 10 min at 15,000 rpm (5415C; Eppendorf Scientific, Inc.), and used for immunoprecipitation. 5 μg of a specific mAb was added to a lysate from 5 × 10⁶ cells in 1 ml and incubated at 4°C in an end-to-end rotator for 1 h (RKIOVS; Emergo BV, Landsmeer, The Netherlands). 100 μl of 50% Protein G–Sepharose slurry (Pharmacia Biotech, Inc., Uppsala, Sweden) was then added to each tube, and the tubes were further incubated for 1 h. The immunoadsorbent beads were washed four times with 1 ml of the extraction buffer, and the precipitates were dissolved in Laemmli's sample buffer (1% SDS, 10% glycerol, 10 mM EDTA, 125 mM Tris-HCl, pH 6.8) containing 2% β-mercaptoethanol, boiled for 10 min, and used for further immunoblotting experiments. Immunoblotting was performed as described earlier (Litvinov et al., 1994a ), using the Alkaline-Phosphatase Protoblot System (Promega Corp., Madison, WI), or the enhanced chemiluminescent detection system (Amersham Intl., Little Chalfont, UK).
Results
Ep-CAM Directs Segregation within E-cadherin–positive Cells
To investigate to what extent the expression of Ep-CAM in epithelia modulates the interactions of Ep-CAM–positive cells with neighboring Ep-CAM–negative cells, we have established a simple model: murine fibroblast L cells transfected with murine E-cadherin, and a derived cell line additionally supertransfected with Ep-CAM. The murine L cell fibroblasts have previously been used to demonstrate the adhesion properties of both E-cadherin (Nagafuchi et al., 1987), and Ep-CAM (Litvinov et al., 1994); these cells are able to support the functional activity of both molecules and do not express endogenous cadherins or murine Ep-CAM (as was tested with a mAb specific to murine Ep-CAM; data not shown).
LEC cells demonstrated all morphological changes related to E-cadherin expression reported for other E-cadherin transfectants of L cells (Nagafuchi et al., 1987; Chen and Öbrink, 1991; Wesseling et al., 1996). LEC cells were supertransfected with either Ep-CAM cDNA under the control of the constitutive cytomegalovirus promotor (LEC-Ep cells), or with the blank pCEP4 expression vector (LEC-C cells). These transfected cell lines were established without clonal isolation and represented a mix of >200 individual clones from each transfection. Additionally, L cells transfected only with the Ep-CAM cDNA were established (LEp cells).
When mixed in suspension, neither LEC nor LEp cells interacted with the parental L cells. The LEC and LEp cells also did not interact with one another, as was tested in coaggregation assays performed to exclude possible heterotypic interactions between Ep-CAM and E-cadherin (Fig. 2). LEC-C and LEC-Ep cells, when mixed, showed segregation in suspension coaggregation assays (Fig. 2). Although some aggregates contained cells of both types, and the segregation could be described as partial only, the two cell types did show a clear preference for independent aggregation.
Figure 2.


Cell segregation directed by Ep-CAM. L cells were transfected with cDNA for E-cadherin (LEC) or Ep-CAM (LEp), and the E-cadherin transfectants were additionally supertransfected with either Ep-CAM cDNA (LEC-Ep) or the blank vector (LEC-C). (A) Pairs of transfected cells were tested in coaggregation assays: dispersed cells of two types (Type1 + Type2), each labeled with a different fluorescent dye, were mixed at equal concentrations. After 2 h of culturing in suspension, cell aggregates consisting of >10 cells were analyzed for the presence of cells of each type. The data is presented as percentage of aggregates (y-axis) containing the respective percentage of the Type 2 cells (x-axis). (B) Expression of E-cadherin and Ep-CAM in the transfectants, as determined by immunoblotting in total cell lysates using antibodies to E-cadherin (36) and to human Ep-CAM (323/A3), respectively.
Immunoblotting revealed that LEC-C and LEC-Ep cells expressed approximately equal levels of E-cadherin molecules (Fig. 2 B). Since even relatively minor differences in the levels of cadherin expression may affect cell–cell interaction (Steinberg and Takeichi, 1994), we repeated this experiment with five pairs of cell lines obtained from several independent transfections. The degree of cell segregation varied (as estimated by the relative proportion of mixed aggregates formed), and correlated positively with the level of Ep-CAM expression at the surface of double transfectants (not shown).
When mixed as monocellular suspensions and sedimented together, LEC-C and LEC-Ep cells were able to establish connections in the pellet. The resulting large aggregate, formed by randomly distributed cells of both types, was mechanically dispersed into a number of smaller aggregates. After 24 h of culturing these aggregates in suspension, it was found that the LEC-C cells formed the tight core of the aggregates, with LEC-Ep cells forming the external layer. This structure was observed for all aggregates irrespective of their size, with the latter ranging from 100 to more than 1,000 cells (Fig. 3). When either LEC-C or LEC-Ep cells were mixed with the differentially labeled cells of self-type, no cell patterning was observed, indicating that segregation was unrelated to the labeling and other experimental procedures.
Figure 3.
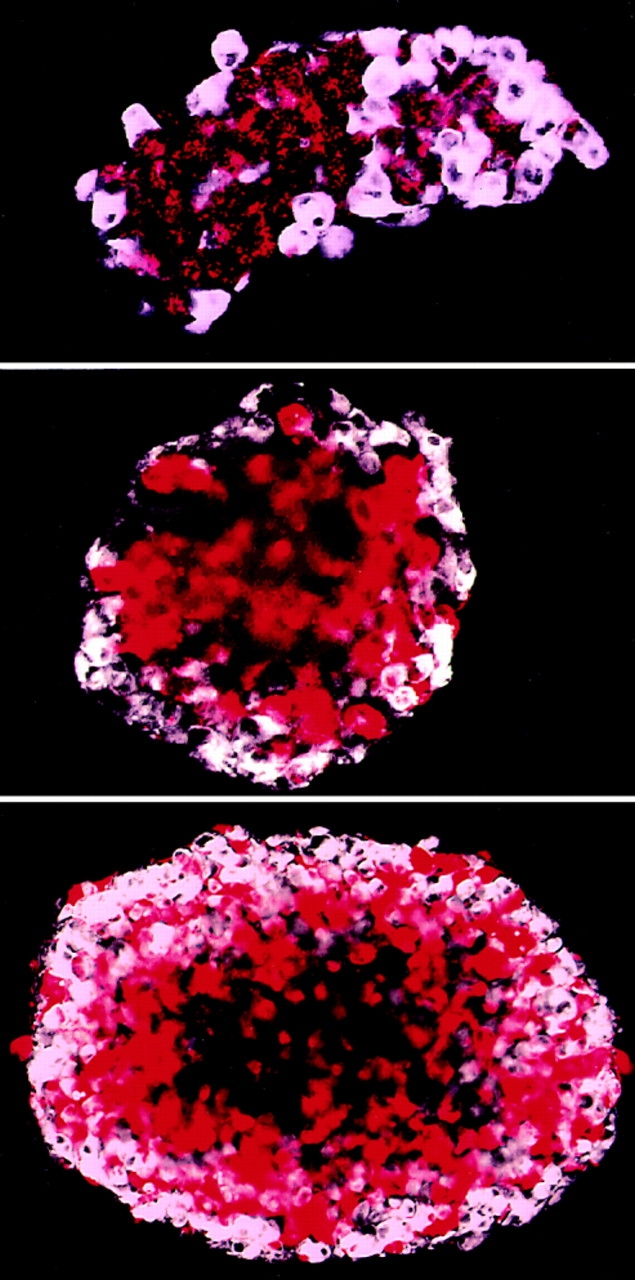
Segregation of Ep-CAM–positive LEC cell transfectants from the parental cells in multicellular aggregates. LEC-C and LEC-Ep cells, labeled with fluorescent dyes PKH-26 and PKH-2, respectively, were mixed at a 1:1 ratio, sedimented, and allowed to form an aggregate. This aggregate, in which both cell types were represented in a random pattern, was mechanically dispersed, and the smaller aggregates obtained were further cultured in suspension for 24 h, fixed, and analyzed. The micrographs present optical cross sections at the equatorial area of the aggregates after 24 h, as seen with a confocal microscope. The artificial colors were assigned to the cells depending on the color of the fluorochrome and the cell type: LEC-C (red); LEC-Ep (white) cells. The figures show similar cell patterning in different size aggregates in the range of <100 to ∼1,000 cells. A dark area in the middle of some aggregates is an optically nontransparent zone.
The positioning of cells in mixed structures (to the inner or outer layer, respectively) is determined by the relative strength of intercellular connections between the cells of each type (Steinberg and Pool, 1982; Foty et al., 1996). In this respect, the Ep-CAM transfectants of E-cadherin– positive cells interacted with the parental cells as did cells with a relatively decreased strength of cell–cell adhesion. In contrast to what could be expected from the expression of an additional intercellular adhesion molecule, the overall strength of intercellular adhesion among LEC cells seemed to become reduced upon the expression of Ep-CAM. Since Ep-CAM is a relatively weak adhesion molecule compared to E-cadherin (Litvinov et al., 1994a ), it is highly suggestive that the E-cadherin–mediated cell–cell adhesions in LEC-Ep cells were negatively affected because of expression of Ep-CAM.
Expression of Ep-CAM Suppresses the E-Cadherin–mediated Cell Aggregation
Ep-CAM–mediated aggregation in suspension is rather slow, with ∼40% of aggregation reached in 120 min for L cells with high levels of Ep-CAM expression (Litvinov et al., 1994a ). In contrast, E-cadherin–mediated cell aggregation is relatively fast, as L cell transfectants expressing E-cadherin reach the plateau level of aggregation (50-80%) within 30 min, at which time the aggregation mediated by Ep-CAM is hardly noticeable (not shown). If Ep-CAM is indeed able to negatively affect the E-cadherin–mediated cell–cell adhesion, the aggregation rates of E-cadherin/Ep-CAM transfectants should inversely correlate with the levels of Ep-CAM expression.
To investigate this, LEC cells with inducible Ep-CAM expression (LEC-MEp) were established by introducing the Ep-CAM cDNA under the control of an inducible metallothionein promotor. This promotor can give high levels of expression upon induction, but is leaky, with the construct being expressed to a certain level without induction with heavy metal ions. We selected two individual clones (LEC-MEp.6 and LEC-MEp.2) with different basal levels of Ep-CAM expression. Both the total number of Ep-CAM molecules (Fig. 4 A), as well as Ep-CAM expressed at the cell surface (Fig. 4 B), could be gradually induced in cells of isolated clones by increasing the Cd2+ concentrations in the medium ⩽10 μM. A control cell line was prepared by transfecting a blank pMEP vector into LEC cells (LEC-MC cells).
Figure 4.


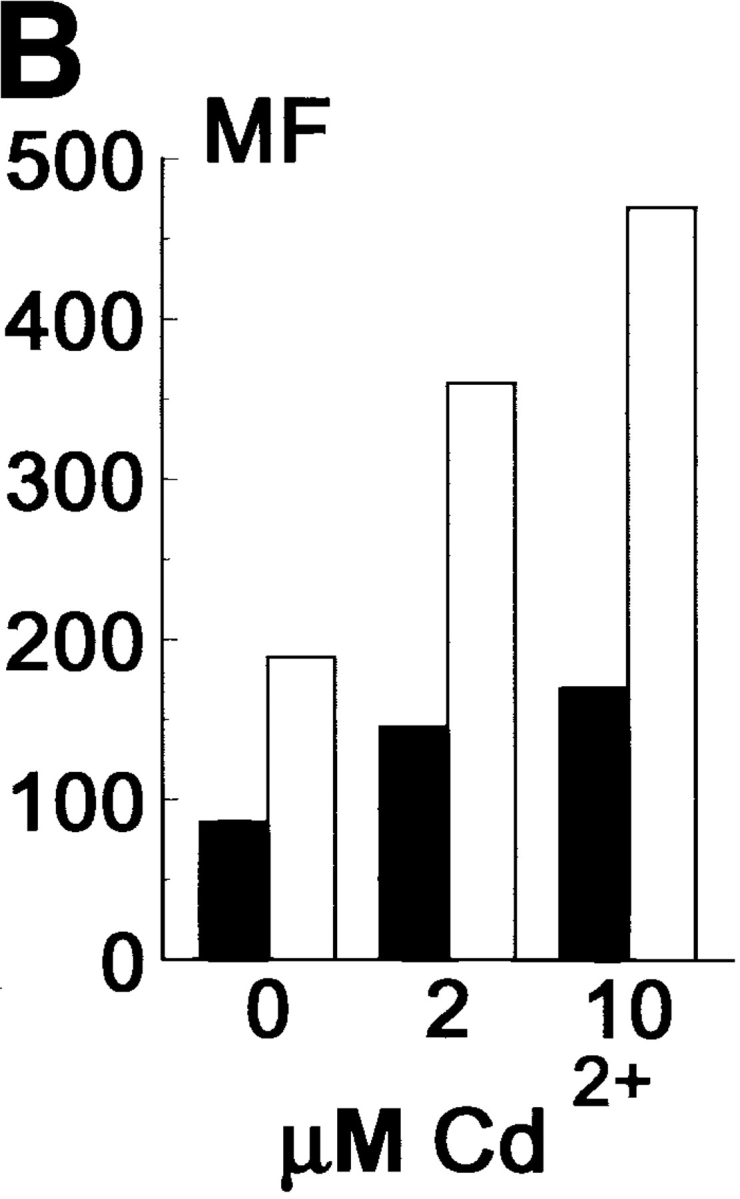

Effect of increasing expression of Ep-CAM on cell–cell interactions in L cell E-cadherin transfectants (LEC). LEC cells were supertransfected with Ep-CAM cDNA under the control of the metallothionein promotor (clones LEC-MEp.2 and LEC-MEp.6), or with blank vector (LEC-MC). Induction of Ep-CAM expression with CdCl2 for 24 h resulted in an increased total Ep-CAM (A, immunoblot of total cell lysates) and in an increased presence of Ep-CAM molecules at the cell surface (B, flow cytometry with anti–Ep-CAM F(ab)-FLUOS conjugate). Cells detached with TC treatment were allowed to aggregate in suspension for 30 min in the presence of Ca2+, and the degree of cell aggregation was determined (C). The statistical significance of the observed differences in aggregation rates was determined using the Student's t-test (p). Where indicated, cells were cultured for 24 h before the assay in the presence of CdCl2 in culture medium. (D) The morphology of aggregates formed in 30 min by LEC-MC and LEC-MEp.6 cells (the latter noninduced and induced with 10 μM CdCl2).
After being cultured for 24 h at different concentrations of Cd2+ , the cells were detached with EDTA and subjected to the aggregation assay in the presence of Ca2+ to allow both Ep-CAM and E-cadherin adhesion systems to participate in cell aggregation. The results showed that prior culturing in the presence of CdCl2 had no effect on the aggregation rate of the control LEC-MC cells, whereas the aggregation of the Ep-CAM transfectants decreased in direct proportion to the levels of Ep-CAM expressed (Fig. 4 C). The differences in aggregation were reproducible in independent experiments and were highly significant (P < 0.01, Student's t test).
Not only were the aggregation rates for cells expressing Ep-CAM reduced, but also the morphology of the aggregates was different from those formed by the control cells. Thus, most of the LEC-MC cells produced tight, large aggregates, whereas LEC-MEp.6 cells mainly formed small aggregates (Fig. 4 D). This was clearly related to the levels of Ep-CAM expressed by the cells, as the aggregates formed by LEC-MEp.6 cells after induction of Ep-CAM expression were loosely interconnected and even smaller than those formed by the noninduced cells.
Over time (⩽24 h of suspension culture), even the induced LEC-MEp.6 cells were able to form some larger multicellular aggregates. However, the internal structure of these aggregates differed substantially as compared to aggregates of LEC-MC cells, with the latter consisting of tightly interconnected cells, whereas the cells in LEC-MEp.6 aggregates had only sporadic connections (Fig. 5). This argues against the hypothesis that the expression of Ep-CAM simply delayed, rather than inhibited, the E-cadherin–mediated cell aggregation, as the loose interconnection of cells in LEC-Mep.6 aggregates clearly points to a reduction in the number of the E-cadherin–mediated intercellular adhesions.
Figure 5.

The internal structure of the large aggregates formed by LEC-MC and LEC-MEp.6 cells in 24 h of suspension culture. The expression of Ep-CAM in LEC-MEp.6 cells was induced with 10 μM CdCl2 for 24 h before the aggregation assay (+). The aggregates were fixed with 2% paraformaldehyde/1.25% glutaraldehyde, embedded into Epon, and ultrathin sectioned. Sections were analyzed by reflection contrast microscopy. Bar, 25 μm.
As was revealed by immunoblotting, the total number of cadherin molecules in transfectants was not affected by Ep-CAM expression or CdCl2 treatment, remaining approximately at the same level in LEC-MC and LEC-MEp cells of both clones. Also, the surface expression of E-cadherin, as measured by flow cytometry, was almost identical (Fig. 6).
Figure 6.


Expression of E-cadherin in blank vector (−MC) and Ep-CAM transfectants (clones −MEp.2 and −MEp.6) of LEC cells. The cells were cultured for 24 h in the presence or absence of 10 μM CdCl2 in culture medium. Cells were either (A) detached from the substrate with EDTA and analyzed in flow cytometry after staining with mAb ECCD-2 to murine E-cadherin, or (B) lysed with 1% SDS, and E-cadherin was detected in total cell lysates (5 μg protein/sample) by immunoblotting with mAb 36.
Ep-CAM Affects the Morphology of E-cadherin–transfected L Cells
When seeded at low density, both Ep-CAM–positive clones LEC-MEp.2 and LEC-MEp.6 did not differ in morphology from the parental or control LEC-MC cells. However, when the cells were seeded at high density to form a monolayer culture, some morphological differences, which were especially pronounced between LEC-MC and LEC-MEp.6 cells, appeared after 24 h. By that time, >50% of all control cells had acquired an epithelioid morphology, with a clear interconnection of the lateral domains of neighboring cells (Fig. 7). In contrast, in cultures of LEC-Mp.6 cells, when cultured at the same high density in the absence of Cd2+, <10% of all cells had the morphology observed in control cultures (as was estimated from direct counting). When cultured in the presence of 10 μM CdCl2, no cells with epithelial-like morphology were observed in LEC-MEp.6 cultures (Fig. 7). Interactions among the cells seemed to be reduced to sporadic contacts, mainly involving filopodia-like structures.
Figure 7.
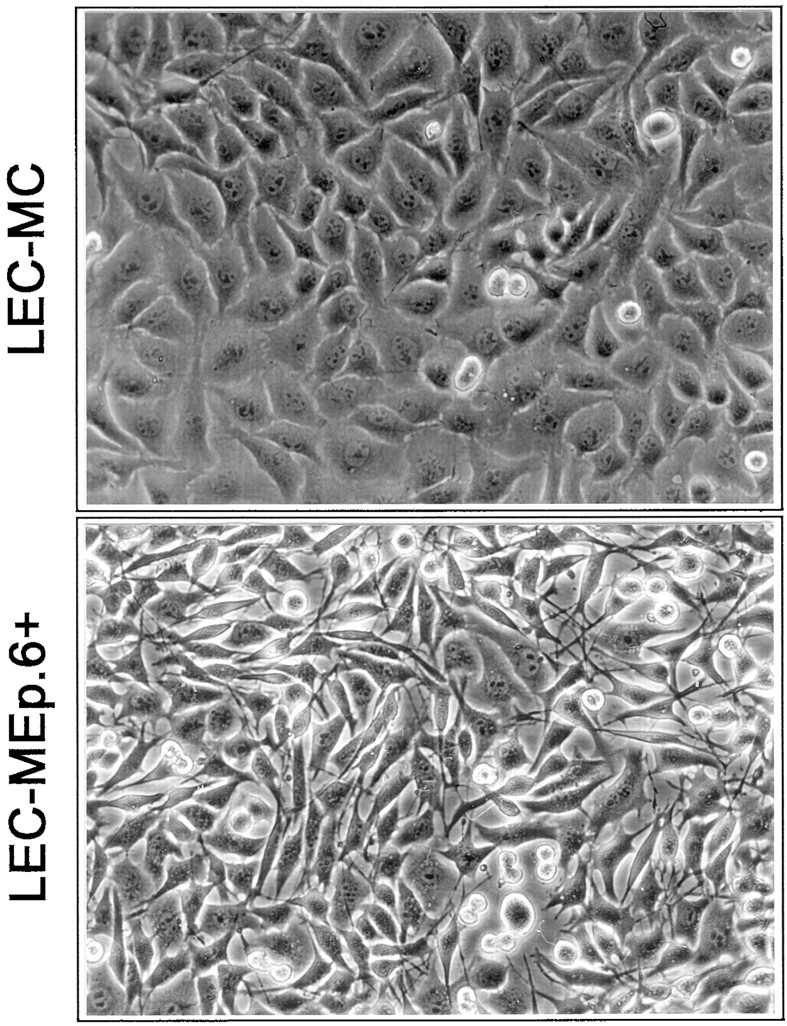
The morphology of LEC-MC and LEC-MEp.6 cells (the latter shown after induction with 10 μM CdCl2, marked by +). Note the groups of the epithelial-like cells interconnected along their lateral domains in the culture of LEC-MC cells, which are absent in the LEC-MEp.6 cell culture.
The presence of Cd2+ in the culture medium had no effect on the morphology of the control LEC-MC cells. The LEC-MEp.2 cells demonstrated a somewhat intermediate morphology when compared to the other two cell lines (not shown).
Expression of Ep-CAM Disturbs the Association of E-cadherin with the Cytoskeleton
The data presented so far suggest that expression of Ep-CAM does not affect the number of E-cadherin molecules in cells but does affect the ability of these molecules to form stable adhesions.
As the differences between LEC-MC and LEC-MEp.6 cell lines were most clearly pronounced, we further investigated the changes of cadherin junctions in LEC-MEP.6 cells upon expression of Ep-CAM. Immunofluorescent staining revealed that in dense cultures of LEC-MC cells, most of the cell surface E-cadherin molecules were present in typical cadherin-type intercellular junctions and were absent from the free domains of the cell membrane (Fig. 8). However, at the basal level of Ep-CAM expression in LEC-MEp.6 cells, only a fraction of the E-cadherin molecules was present in junctions, with some E-cadherin being located on the free domains of the cell membrane. Induction of Ep-CAM for 24 h resulted in redistribution of E-cadherin, which was now found all over the cell surface, and in a substantial reduction of structurally recognizable E-cadherin junctions (Fig. 8). As was previously shown (Fig. 6) by flow cytometry analysis and immunoblotting, both the total number of E-cadherin molecules and the cell surface fraction of E-cadherin were not changed upon induction of Ep-CAM, suggesting that the latter did not cause either internalization or enhanced degradation of the E-cadherin molecules, or suppression of their transportation to the cell surface. Rather, the observed changes in subcellular distribution of E-cadherin suggest some disturbance in the association of the E-cadherin molecules with the cytoskeleton, an association required for the E-cadherin junction formation (Nagafuchi and Takeichi, 1988). Indeed, the cytoskeleton-anchored (Triton X-100– insoluble) fraction of cadherins was decreased upon the induction of Ep-CAM in LEC-MEp.6 cells, as can be seen in immunoblotting for E-cadherin in detergent-extracted cells (Fig. 9 A).
Figure 8.

Subcellular localization of E-cadherin in LEC-MC cells and in LEC-MEp.6 cells. Ep-CAM in LEC-MEp.6 was induced by 10 mM CdCl2 for 24 h before cell fixation. Immunofluorescent staining of methanol-fixed cells was performed as described in Materials and Methods using mAb ECCD-2 to murine E-cadherin. Bar, 10 μm.
Figure 9.
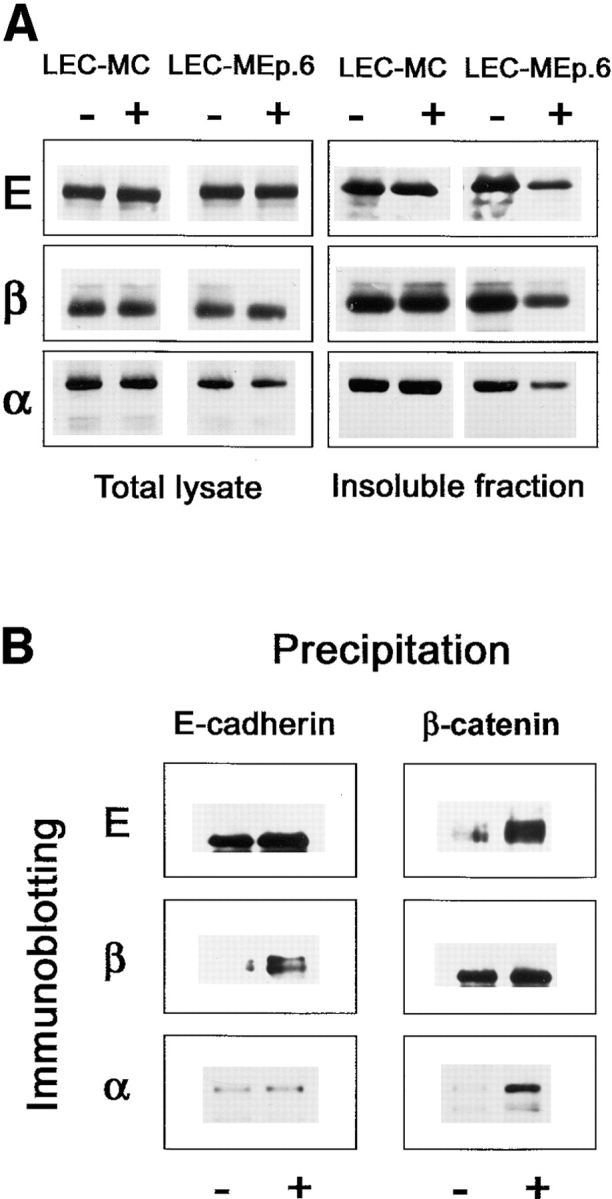
E-cadherin and catenins in LEC cells and the derived Ep-CAM transfectants (MEp-6). (A) Cells were cultured in the absence (−) or presence (+) of CdCl2 for 24 h, and lysed in 1% SDS either directly (Total lysate), or after extraction with 0.5% Triton X-100 (Insoluble fraction). Samples of cell lysates, equalized by protein content, were analyzed by immunoblotting with antibodies to E-cadherin (mAb 36), β-catenin (mAb 14), or α-catenin (mAb 7A4). 5× more protein was taken for the extracted cell preparations. (B) LEC-MEp.6 cells cultured in the absence (−) or presence (+) of CdCl2 were lysed in buffer with 0.5% Triton X-100, and immunoprecipitations were performed from the soluble fraction. The immunoprecipitates were analyzed in Western blotting with antibodies to E-cadherin (E) or catenins (α- and β-, respectively). A rabbit polyclonal serum was used for α-catenin detection. The precipitations were performed from an excess of the lysate; therefore, the total amount of an antigen precipitated by an antibody remains equal.
Interaction of E-cadherin molecules with the cytoskeleton is mediated by β- and α-catenins (Ozawa and Kemler, 1992; Jou et al., 1995), which are absent in L cells but appear upon the transfection of E-cadherin (Nagafuchi et al., 1994). We compared the total content and detergent solubility of both catenins in LEC-MC and LEC-MEp.6 cells. Approximately similar levels of β-catenin were observed in control cells, and in LEC-MEp.6 cells regardless of the level of Ep-CAM expression in the latter. The detergent-insoluble fraction of β-catenin was, however, reduced in the induced LEC-MEp.6 cells.
In contrast to β-catenin, a reduction in both detergent-insoluble and total cellular fractions of α-catenin molecules was observed in induced LEC-MEp.6 cells (Fig. 9 A).
Apparently, the expression of Ep-CAM leads to a decrease in the cytoskeleton-anchored fraction of E-cadherin molecules. To investigate whether some catenins were still associated with the detergent-soluble fraction of the E-cadherin molecules, the induced and noninduced LEC-MEp.6 cells were extracted with 0.5% Triton X-100, and immunoprecipitations were performed from the extracts using antibodies specific to E-cadherin or β-catenin (Fig. 9 B). Upon the induction of Ep-CAM in LEC-MEp.6 cells, there was a clear increase in the amount of β-catenin coprecipitating with the detergent-soluble E-cadherin molecules (Fig. 9 B). The reverse precipitations with anti–β-catenin mAb produced similar results, with increased coprecipitation of E-cadherin upon induction of Ep-CAM. However, when the immunoprecipitates of soluble E-cadherin were probed with anti–α-catenin antibody, no increased presence of α-catenin associated with this fraction of E-cadherin molecules was observed. The latter result was consistent with the observation of the decrease in total α-catenin content in the cells. Additionally, a certain increase in α-catenin molecules coprecipitating with β-catenin was observed upon the induction of Ep-CAM (Fig. 9 B).
These results show that expression of Ep-CAM in cells results in accumulation of non–cytoskeleton-anchored E-cadherin/β-catenin complexes and in a reduction of the α-catenin molecules available for the formation of E-cadherin junctions. Since the observations were made after induction of Ep-CAM for 24 h, these soluble E-cadherin/ β-catenin complexes may originate from either (a) dissociation of the preexisting cadherin junctional complexes, or (b) may represent newly produced E-cadherin molecules that had formed a complex with β-catenin, but for which further anchorage to the cytoskeleton was not possible because of the nonavailability of α-catenin. Experiments with short-time induction of Ep-CAM in LEC-Mep.6 cells (2,4, and 6 h) provided no clear support to either of these options, since the levels of cellular Ep-CAM after 6 h of induction were only slightly higher than in uninduced cells, and were substantially lower than in cells induced for 24 h. After the short-time induction, no substantial changes in either solubility of cadherins or in the level of cellular α-catenin were observed (data not shown).
Ep-CAM Affects the Cadherin-mediated Junctions in Epithelial Cells
To investigate whether the expression of Ep-CAM in human epithelial cells affects cadherin junctions in a way similar to what has been observed for E-cadherin transfectants of L cells, we have chosen the immortalized mammary epithelial cell line HBL-100. This cell line expresses low levels of E- and P-cadherin, and relatively high levels of N-cadherin (as was tested in immunoblotting and flow cytometry with mAbs specific to each cadherin), and, in contrast to all other cell lines of epithelial origin tested, contains no endogenous Ep-CAM. Transfectants of a clonal cell line derived from HBL-100 origin, HCA, were obtained using episomal vectors that do not integrate into the genome and support themselves in transfected cells at high copy numbers. The results obtained with HCA/C (blank pCEP4 vector transfectants) and HCA/CEp (pCEP4/Ep-CAM transfectants) cells in coaggregation assays were similar to those obtained with LEC cell transfectants, with the HCA/CEp segregating partially from the parental cells. In mixed two-cell type aggregates, the cell patterning was similar to that observed in the LEC cell model (not shown).
Transfection with Ep-CAM affected the aggregation from monocellular suspensions of HCA cells. After 30 min of aggregation in the presence of Ca2+ , 50 ± 4% aggregation was reached by HCA/C cells, and only 24 ± 3% by HCA/CEp cells. However, after 90 min the degree of aggregation for both cell lines was approximately equal, reaching 55%. This may be due to the formation of Ep-CAM–mediated cell–cell interconnections, since after 90 min in the absence of Ca2+ (allowing mainly the Ep-CAM–mediated cell aggregation), the degree of aggregation for HCA/CEp cells was approximately the same, 47 ± 4% (only 8.3% for the control HCA/C cells).
Despite the fact that after 90 min no substantial differences in aggregation extent were observed between the control and the Ep-CAM transfectants, the structure of the aggregates formed by these two cell lines differed substantially. As can be seen on cross sections, the HCA/C aggregates were composed of tightly interconnected cells, in contrast to HCA/CEp aggregates, which were formed by loosely interconnected cells (Fig. 10). In the internal layers of the HCA/C aggregates, the membranes of the cells were interconnected by multiple adherence junctions (Fig. 10), whereas in HCA/CEp cell aggregates the cell–cell contacts were rare and often did not contain morphologically distinguishable adherens junctions. The membranes of neighboring cells in these aggregates were mainly not in close proximity. In these intercellular spaces, microvilli were often observed (Fig. 10), which were present in HCA/C aggregates at the outer surface of the external layer of cells only.
Figure 10.
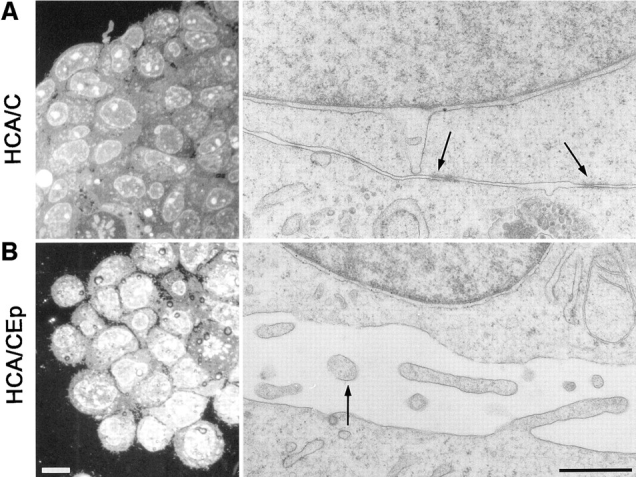
Ultrastructure of the aggregates formed by HCA/C and HCA/CEp cells. Reflection contrast micrographs of cross sections through the aggregates formed in 90 min by each cell type reveals a tight organization of the HCA/C aggregates and loosely interconnected cells forming the HCA/CEp aggregates. (A) Electron microscopy on the preparations shows the abundant presence of the adherens junctions between HCA/C cells (arrows). In contrast, microvilli (B, arrow) were found at the intercellular space between the cells of internal layers of HCA/CEp cells. In HCA/C cells, microvilli were present almost exclusively at the apical membrane of the outer layer of cells in the aggregate and not on the surface of the cells from internal layers. Bars: (left) 10 μm; (right) 0.25 μm.
To further investigate the effect of Ep-CAM on cell–cell contacts of HCA cells, the cells were also transfected with Ep-CAM cDNA under the control of the metallothionein promotor (Wt cells; Wt indicates wild-type Ep-CAM molecule). This regulated the levels of Ep-CAM expression from ∼50% to 350% of the levels observed in HCA/CEp transfectants (estimated by flow cytometry on living cells, data not shown).
At the basal level of Ep-CAM expression, the morphology of Ep-CAM transfectants in cell culture was quite similar to the control cells transfected with the blank vector. However, induction of high levels of Ep-CAM resulted in loss of the polygonal morphology and in a more scattered phenotype, although the cells still remained attached to one another (Fig. 11). This change in morphology was observed for the entire cell population only at the highest (50 μM) concentration of Cd2+ tested, although some of these changes could be observed for some cells or groups of cells at lower concentrations of Cd2+ (2–5 μM), with changes increasing proportionally to the Ep-CAM levels. The effect was reversible, and within 3 d of culture in the absence of the Cd2+ in the medium, the cells regained their original morphology, consistent with the decrease of Ep-CAM levels back to that of noninduced cells (flow cytometry data, not shown).
Figure 11.
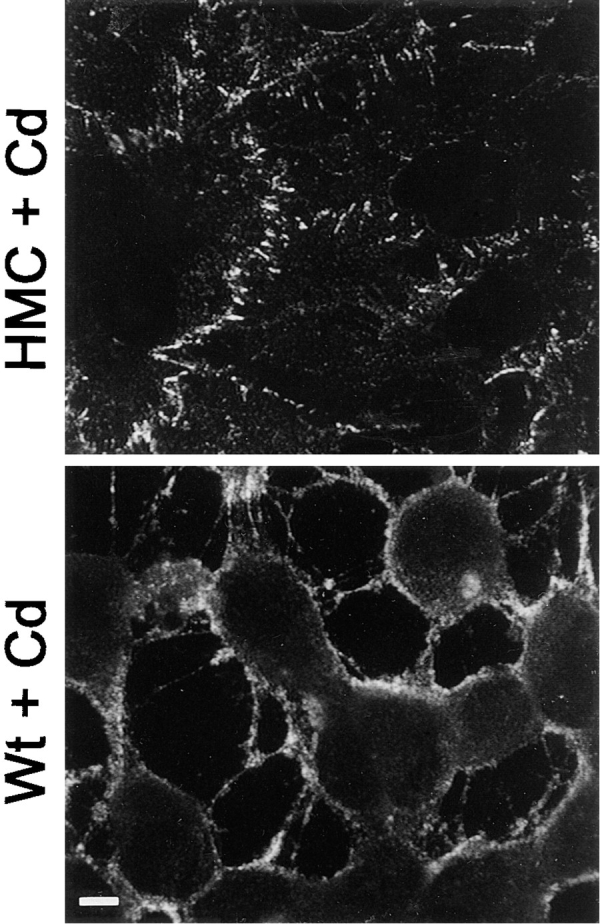
Changes in subcellular distribution of cadherins in HCA cells upon expression of Ep-CAM. HCA cells transfected with inducible pMEp4 vector, either blank (HMC) or containing the Ep-CAM cDNA (Wt), were induced with 50 μM CdCl2 24 h before fixation, fixed, and stained with anti-pan cadherin mAb CH-19 (reacts mainly with N-cadherin, the major cadherin of HCA cells). Note the redistribution of cadherins from adherens junctions to free domains of cell membrane in Wt Ep-CAM transfectants, and a general shift of the cell phenotype to a more scattered one. Bar, 5 μm.
Induction of Ep-CAM in cells did not affect either the total level of cell cadherins (as was detected with immunoblotting with pancadherin antibody, (see Fig. 13), or the surface expression of N-cadherin (as was detected with flow cytometry, not shown). The surface expression of E- and P-cadherins in HCA cells was too low to be measured by flow cytometry. However, upon induction of Ep-CAM, the subcellular distribution of cadherins was changed: the typical junctional structures, including cadherins that were present in HCA cells (or control transfectants), were absent in induced (Fig. 11) but not in noninduced Ep-CAM transfectants. The disturbance of cadherin's subcellular localization suggested that the effect of Ep-CAM was similar to that observed for LEC cells. Indeed, the detergent solubility of the cadherins in HCA cells was increased after 24 h of Ep-CAM (see Fig. 13). Induction of Ep-CAM had no effect on total level of cellular β-catenin, but it negatively affected the level of total α-catenin (Fig. 12); the detergent-insoluble fraction for both molecules was reduced in relation to the expression of Ep-CAM (Fig. 12). All observations are based on 24-h induction of Ep-CAM.
Figure 13.


The role of the cytoplasmic domain in the effect of Ep-CAM on cadherins. (A) The structural maps of the wild-type (wild-type) and mutant (Mu1) Ep-CAM molecules. The leader peptide (L), EGF-like domains (EGF-I, EGF-II) cysteine-poor region (CPR), the transmembrane domain (TM), and cytoplasmic domain (CYT) are marked. The cytoplasmic domain is deleted in the Mu1 molecule. (B) HCA cells were transfected with either blank vector (HMC), or the wild-type Ep-CAM (Wt), or Mu1, under the control of a metallothionein promotor. Where indicated (+Cd), the cells were cultured in the presence of 50 μm CdCl2 for 24h before lysis. Aliquots of total cell lysates equalized by protein were probed in immunoblotting using the Ep-CAM–specific mAB. Content of N-cadherin in whole cell lysates and after the extraction of cells with 0.5% Triton X-100 was analyzed with anti-pan cadherin mAb CH-19. Note that expression of Wt Ep-CAM, but not of an approximately equal level of Mu1, affects the detergent solubility of cadherins.
Figure 12.

Detergent extractability of catenins in HCA cells and Wt Ep-CAM transfectants. Immunoblotting was performed on total cell lysates and on lysates of cells preextracted with 0.5% Triton X-100. The + indicates induction of cells with 50 μM CdCl2 for 24 h before lysis.
The Cytoplasmic Domain of Ep-CAM Molecule Is Required to Affect the Cadherin-mediated Junctions
In both L and HCA cell models, we observed a decrease in cadherin-mediated adhesion and a reduction in cellular α-catenin upon the expression of Ep-CAM. Such changes in adherens junctions suggest that Ep-CAM induced certain intracellular effects, and we therefore investigated whether an Ep-CAM mutant lacking the cytoplasmic domain would be able to negatively affect cadherin-mediated adhesions. This mutated form of Ep-CAM (Mu1) was generated as shown in Fig. 13. When transfected into L or HCA cells, Mu1 was expressed at the cell surface, similar to the wild-type Ep-CAM, and was then capable of mediating weak homotypic binding, but was not able to form stable adhesions (investigated in more detail in Balzar M., H.A.M. Bakker, I.H. Briaire, G.J. Fleuren, S.O. Warnaar, and S.V. Litvinov, manuscript submitted for publication). No effects produced by the wild-type Ep-CAM were observed in LEC cells transfected with Mu1 with respect to cell morphology, cell aggregation, and the number and extractability of the cadherin and catenin molecules (not shown). However, the transfections of Mu1 construct into LEC cells never gave rise to a clonal cell line with the levels of Mu1 expression comparable to the wild-type Ep-CAM expression in LEC-MEp.6 cells, although the expression levels comparable to LEC-MEp.2 cells were achieved. This makes strict interpretation of the effects of Mu1 on E-cadherin in LEC cells difficult.
In contrast, when transfected into HCA cells under the control of an inducible promotor, Mu1 expression could reach levels similar to those of wild-type Ep-CAM expression in these cells (Fig. 13). Nevertheless, no effects on cell morphology nor on the internal structure of aggregates formed by the transfectants were observed upon expression of Mu1 in HCA cells, as compared to nontransfected cells or cells transfected with the blank pMEP4 vector (HMC cells). Expression of Mu1 did not affect the total level of cadherins in HCA cells or their solubility, as did the wild-type molecule expressed at the same level (Fig. 13).
Discussion
Ca2+-independent cell–cell adhesion molecules are present in epithelial and carcinoma cells along with the classic cadherins, and, although the data is scarce, it suggests a possible influence of the noncadherin cell–cell adhesion molecules on cadherin mediated cell–cell adhesion. Thus, the expression of noncadherin adhesion molecules, such as protein Zero (Doyle et al., 1995) or N-CAM (Michalides et al., 1994), may cause an augmentation of the cadherin-mediated adhesions.
In contrast to these observations, we demonstrate here that expression of Ep-CAM in cells interconnected by classic cadherins results in abrogation of the cadherin-mediated junctions in a direct correlation to the levels of Ep-CAM expressed. Despite the fact that Ep-CAM, being an adhesion molecule, provides additional intercellular connections to the cells, its expression leads to an overall decrease in the strength of intercellular interactions for cells interconnected by the classic E- and N-cadherins, as shown in this study. In modulating cadherin adhesions, Ep-CAM acted to some extent as an antiadhesion molecule, if the overall strength of the intercellular adhesion in transfected cells is considered. This effect, however, differs from the previously demonstrated antiadhesion effects of N-CAM– bearing polysialic acid (Rutishauser, 1992; Yang et al., 1992), since polysialylated N-CAM does not bear an adhesion function, and its action is more similar to the antiadhesion effects of some other sialoglycoproteins, such as episialin (Wesseling et al., 1996) or CD43 (Ardman et al., 1992), which inhibit intercellular adhesion by not allowing the membranes of interacting cells to reach a proximity necessary to form adhesions. Ep-CAM not only weakens/ abrogates the cadherin-mediated adhesions, but replaces them with Ep-CAM adhesions becoming predominant (as was seen with HCA/CEp cell aggregation) to some extent.
The observed effects more likely originate from a possible existing coordination between the two adhesion systems rather than a simple antiadhesion effect of Ep-CAM. In epithelial cells a certain coordination between different adhesion systems was demonstrated for keratinocytes, where an increase in E-cadherin induces downregulation of β1-integrin (Hodivala and Watt, 1994). A similar coordination may exist between other systems involved in intercellular adhesion, such as Ep-CAM and cadherins, with E-cadherin in particular.
The molecular mechanism behind the observed effect is not quite clear. Expression of Ep-CAM did not affect the expression nor the number of the cadherin molecules but did affect the formation of the cytoplasmic junctional complex of the cadherin molecules. In both murine fibroblast and in human epithelial cells tested, a reduction in the total level of the cellular α-catenin and an increased detergent solubility of cadherins were seen upon the expression of Ep-CAM. Cadherins that lost their connection to the cytoskeleton were mainly present as complexes with β-catenin. This argues against involvement of β-catenin in the modulating effect of Ep-CAM on cadherins, in contrast to the role suggested for β-catenin in regulation of cadherin junctions (for review see Gumbiner et al., 1993). However, v-src expression may shift cell–cell adhesion mediated by cadherins from a strong to a weak state without involvement of β-catenin (Takeda et al., 1995), which suggests the existence of an alternative mechanism for regulating the cadherin junctions. Our observations indicate that the modulation of cadherin adhesions by Ep-CAM involves α-catenin, since the observed dissociation of cadherin junctions would require dissociation of α-catenin from its connections within the complex, anchoring E-cadherin molecule to the actin cytoskeleton. α-Catenin was shown to be a link between the E-cadherin–β-catenin complex (Nagafuchi et al., 1991; Hirano et al., 1992; Hinck et al., 1994) and actin filaments, interacting with β-catenin on one side and with α-actinin (Knudsen et al., 1995) and probably actin filaments on the other side (Rimm et al., 1995).
We have recently demonstrated that Ep-CAM interacts with the actin based cytoskeleton via α-actinin without involvement of α- or β-catenins (Balzar et al., manuscript submitted for publication). A mutant Ep-CAM lacking its cytoplasmic domain did not affect the cadherin junctions. Therefore, the connection between Ep-CAM and α-actinin seems to be related to the negative effect on cadherin junctions. It is conceivable that overexpression of Ep-CAM may result in redistribution towards Ep-CAM of α-actinin molecules involved in the formation of cadherin junctions. It is not clear, however, to what extent or how the availability of α-actinin regulates the cellular levels of α-catenin, which become reduced upon induction of Ep-CAM. An alternative way by which E-cadherin junctions may be affected is through active signaling via the cytoplasmic domain of Ep-CAM, leading to downregulation of α-catenin since the connection of Ep-CAM to cytoskeleton via α-actinin is very similar to that of ICAM-1 (Carpen et al., 1992). The signal transduction via ICAM-1, resulting in phosphorylation of cortactin, was recently demonstrated (Durieu-Trautmann et al., 1994).
E-cadherin is involved in regulation of epithelial cell polarity (McNeil et al., 1990; Näthke et al., 1993), in morphogenesis of epithelial tissues (Wheelock and Jensen, 1992; Larue et al., 1996), and in regulation of cell proliferation and programmed cell death in epithelia (Hermiston and Gordon, 1995; Hermiston et al., 1996; Takahashi and Suzuki, 1996; Wilding et al., 1996; Zhu and Watt, 1996). In carcinomas, this molecule clearly acts as a suppressor of carcinoma cell invasion (Behrens et al., 1989; Chen and Öbrink, 1991; Frixen et al., 1991; Vlemnickx et al., 1991). The cadherin-modulating properties of Ep-CAM, as reported here, may play a role in epithelial cell proliferation, and possibly in tumor progression. This hypothesis is supported by the observed association of Ep-CAM expression with actively proliferating or premalignant cell populations, respectively, such as proliferating cells in hair follicles (Tsubura et al., 1992), cells of preneoplastic lesions in the uteral cervix (Litvinov et al., 1996), colonic polyps (Salem et al., 1993), or in intestinal metaplasia in gastric mucosa (this article). The previously reported association of Ep-CAM expression with a poor prognosis in breast carcinoma patients (Tandon et al., 1990), and our recent similar observations in patients with head and neck cancer (Takes et al., 1997) as well as the increase in Ep-CAM expression from low to high grade bladder carcinomas (Zorzos et al., 1995), indicate a possible role for Ep-CAM in tumor progression.
The data presented in this paper demonstrate an interaction between the Ep-CAM and classic cadherin-based adhesion systems and suggest a cross-talk between adhesion systems as a mechanism through which the strength of the intercellular adhesion among epithelial cells may be regulated.
Acknowledgments
This study was supported by a grant from the Dutch Cancer Foundation (RUL 95-1107), and a research grant from Centocor Inc. (Malvern, PA).
Abbreviations used in this paper
- Ep-CAM
epithelial cell adhesion molecule
- LEC
murine E-cadherin-transfected L cells
Footnotes
Address all correspondence to S.V. Litvinov, Department of Pathology, Leiden University, Rijnsburgerweg 10, Building 1, LI-Q, P.O. Box 9600, 2300RC Leiden, The Netherlands. Tel.: 31.71.524.8158. Fax: 31.71.526. 6628. E-mail: slitvinov@pathology.medfac.leidenuniv.nl
References
- Ardman B, Sikorski MA, Staunon DE. CD43 interferes with T-lymphocyte adhesion. Proc Natl Acad Sci USA. 1992;89:5001–5005. doi: 10.1073/pnas.89.11.5001. [DOI] [PMC free article] [PubMed] [Google Scholar]
- Behrens J, Mareel MM, van Roy FM, Birchmeier W. Dissecting tumor cell invasion: epithelial cells acquire invasive properties after loss of uvomorulin-mediated cell–cell adhesion. J Cell Biol. 1989;108:2435–2447. doi: 10.1083/jcb.108.6.2435. [DOI] [PMC free article] [PubMed] [Google Scholar]
- Benchimol S, Fuks A, Jothy S, Beauchemin N, Shirota K, Stanners CP. Carcinoembryonic antigen, a human tumor marker, functions as an intercellular adhesion molecule. Cell. 1989;57:327–334. doi: 10.1016/0092-8674(89)90970-7. [DOI] [PubMed] [Google Scholar]
- Carpen O, Pallai P, Staunton DE, Springer TA. Association of intercellular adhesion molecule-1 (ICAM-1) with actin-containing cytoskeleton and alpha-actinin. J Cell Biol. 1992;118:1223–1234. doi: 10.1083/jcb.118.5.1223. [DOI] [PMC free article] [PubMed] [Google Scholar]
- Chen W, Öbrink B. Cell–cell contacts mediated by E-cadherin (uvomorulin) restrict invasive behavior of L cells. J Cell Biol. 1991;114:319–327. doi: 10.1083/jcb.114.2.319. [DOI] [PMC free article] [PubMed] [Google Scholar]
- Cunningham BA. Cell adhesion molecules as morphoregulators. Curr Opin Cell Biol. 1995;7:628–633. doi: 10.1016/0955-0674(95)80103-0. [DOI] [PubMed] [Google Scholar]
- Daniel CW, Strickland P, Friedman Y. Expression and functional role of E- and P-cadherins in mouse mammary ductal morphogenesis and growth. Dev Biol. 1995;169:511–519. doi: 10.1006/dbio.1995.1165. [DOI] [PubMed] [Google Scholar]
- Doyle JP, Stempak JG, Cowin P, Colman DR, D'Urso D. Protein zero, a nervous system adhesion molecule, triggers epithelial reversion in host carcinoma cells. J Cell Biol. 1995;131:465–482. doi: 10.1083/jcb.131.2.465. [DOI] [PMC free article] [PubMed] [Google Scholar]
- Durieu-Trautmann O, Chaverot N, Cazaubon S, Strosberg AD, Courard P-O. Intercellular adhesion molecule 1 activation induces tyrosine phosphorylation of the cytoskeleton-associated protein cortactin in brain microvessel endothelial cells. J Biol Chem. 1994;269:12536–12540. [PubMed] [Google Scholar]
- Edelman GM. Cell adhesion molecules in the regulation of animal form and tissue pattern. Annu Rev Cell Biol. 1986;2:81–116. doi: 10.1146/annurev.cb.02.110186.000501. [DOI] [PubMed] [Google Scholar]
- Edelman GM. A golden age for adhesion. Cell Adhes Commun. 1993;1:1–7. doi: 10.3109/15419069309095677. [DOI] [PubMed] [Google Scholar]
- Foty RA, Pfleger CM, Forgacs G, Steinberg MS. Surface tensions of embryonic tissues predict their mutual envelopment behavior. Development (Camb) 1996;122:1611–1620. doi: 10.1242/dev.122.5.1611. [DOI] [PubMed] [Google Scholar]
- Friedlander DR, Mege R-M, Cunningham BA, Edelman GM. Cell sorting-out is modulated by both the specificity and amount of different cell adhesion molecules (CAMs) expressed on cell surfaces. Proc Natl Acad Sci USA. 1989;86:7043–7047. doi: 10.1073/pnas.86.18.7043. [DOI] [PMC free article] [PubMed] [Google Scholar]
- Frixen UH, Behrens J, Sachs M, Eberle G, Voss B, Warda A, Lochner D, Birchmeier W. E-cadherin–mediated cell–cell adhesion prevents invasiveness of human carcinoma cells. J Cell Biol. 1991;113:173–185. doi: 10.1083/jcb.113.1.173. [DOI] [PMC free article] [PubMed] [Google Scholar]
- Gumbiner BM. Proteins associated with the cytoplasmic surface of adhesion molecules. Neuron. 1993;11:551–564. doi: 10.1016/0896-6273(93)90068-3. [DOI] [PubMed] [Google Scholar]
- Gumbiner BM. Cell adhesion: the molecular basis of tissue architecture and morphogenesis. Cell. 1996;84:345–357. doi: 10.1016/s0092-8674(00)81279-9. [DOI] [PubMed] [Google Scholar]
- Hermiston ML, Gordon JI. In vivo analysis of cadherin function in the mouse intestinal epithelium: essential roles in adhesion, maintenance of differentiation, and regulation of programmed cell death. J Cell Biol. 1995;129:489–506. doi: 10.1083/jcb.129.2.489. [DOI] [PMC free article] [PubMed] [Google Scholar]
- Hermiston ML, Wong MH, Gordon JI. Forced expression of E-cadherin in the mouse intestinal epithelium slows cell migration and provides evidence for nonautonomous regulation of cell fate in a self-renewing system. Genes Dev. 1996;10:985–996. doi: 10.1101/gad.10.8.985. [DOI] [PubMed] [Google Scholar]
- Hinck L, Nathke IS, Papkoff J, Nelson WJ. Dynamics of cadherin/catenin complex formation: novel protein interactions and pathways of complex assembly. J Cell Biol. 1994;125:1327–1340. doi: 10.1083/jcb.125.6.1327. [DOI] [PMC free article] [PubMed] [Google Scholar]
- Hirano S, Kimoto N, Shimoyama Y, Hirohashi S, Takeichi M. Identification of a neural α-catenin as a key regulator of cadherin function and multicellular organisation. Cell. 1992;70:293–301. doi: 10.1016/0092-8674(92)90103-j. [DOI] [PubMed] [Google Scholar]
- Hodivala KJ, Watt FM. Evidence that cadherins play a role in the downregulation of integrin expression that occurs during keratinocyte terminal differentiation. J Cell Biol. 1994;124:589–600. doi: 10.1083/jcb.124.4.589. [DOI] [PMC free article] [PubMed] [Google Scholar]
- Horan PK, Melnikoff MJ, Jensen BD, Slezak SE. Fluorescent cell labeling for in vivo and in vitro cell tracking. Methods Cell Biol. 1990;33:469–490. doi: 10.1016/s0091-679x(08)60547-6. [DOI] [PubMed] [Google Scholar]
- Islam S, Carey TE, Wolf GT, Wheelock MJ, Johnson KR. Expression of N-cadherin by human squamous carcinoma cells induces a scattered fibroblastic phenotype with disrupted cell–cell adhesion. J Cell Biol. 1996;135:1643–1654. doi: 10.1083/jcb.135.6.1643. [DOI] [PMC free article] [PubMed] [Google Scholar]
- Jou TS, Stewart DB, Stappert J, Nelson WJ, Marrs JA. Genetic and biochemical dissection of protein linkages in the cadherin–catenin complex. Proc Natl Acad Sci USA. 1995;92:5067–5071. doi: 10.1073/pnas.92.11.5067. [DOI] [PMC free article] [PubMed] [Google Scholar]
- Knudsen KA, Soler AP, Johnson KR, Wheelock MJ. Interaction of α-actinin with the cadherin/catenin cell–cell adhesion complex via α-catenin. J Cell Biol. 1995;130:67–77. doi: 10.1083/jcb.130.1.67. [DOI] [PMC free article] [PubMed] [Google Scholar]
- Larue L, Antos C, Butz S, Huber O, Delmas V, Dominis M, Kemler R. A role for cadherins in tissue formation. Development (Camb) 1996;122:3185–3194. doi: 10.1242/dev.122.10.3185. [DOI] [PubMed] [Google Scholar]
- Litvinov SV. Ep-CAM: a homophilic cell–cell adhesion molecule with EGF-like domains. Trends Glycosci. . Glycotechn. 1995;7:375–384. [Google Scholar]
- Litvinov SV, Velders MP, Bakker HAM, Fleuren GJ, Warnaar SO. Ep-CAM: a human epithelial antigen is a homophilic cell–cell adhesion molecule. J Cell Biol. 1994a;125:437–446. doi: 10.1083/jcb.125.2.437. [DOI] [PMC free article] [PubMed] [Google Scholar]
- Litvinov SV, Bakker HAM, Gourevitch MM, Velders MP, Warnaar SO. Evidence for a role of the epithelial glycoprotein 40 (Ep-CAM) in epithelial cell–cell adhesion. Cell Adhes Commun. 1994b;2:417–428. doi: 10.3109/15419069409004452. [DOI] [PubMed] [Google Scholar]
- Litvinov SV, van Driel W, van Rhijn CM, Bakker HAM, van Krieken H, Fleuren GJ, Warnaar SO. Expression of Ep-CAM in cervical squamous epithelia correlates with an increased proliferation and the disappearance of markers for terminal differentiation. Am J Pathol. 1996;148:865–875. [PMC free article] [PubMed] [Google Scholar]
- Marrs JA, Andersson-Fisone C, Jeong MC, Cohen-Gould L, Zurzolo C, Nabi IR, Rodriguez-Boulan E, Nelson WJ. Plasticity in epithelial cell phenotype: modulation by expression of different cadherin cell adhesion molecules. J Cell Biol. 1995;129:507–519. doi: 10.1083/jcb.129.2.507. [DOI] [PMC free article] [PubMed] [Google Scholar]
- McNeil H, Ozawa M, Kemler R, Nelson WJ. Novel function of the cell adhesion molecule uvomorulin as an inducer of cell surface polarity. Cell. 1990;62:309–316. doi: 10.1016/0092-8674(90)90368-o. [DOI] [PubMed] [Google Scholar]
- Michalides R, Volberg T, Geiger B. Augmentation of adherens junction formation in mesenchymal cells by coexpression of N-CAM or short-term stimulation of tyrosine-phosphorylation. Cell Adhes Commun. 1994;2:481–490. doi: 10.3109/15419069409014212. [DOI] [PubMed] [Google Scholar]
- Nagafuchi A, Takeichi M. Cell binding function of E-cadherin is regulated by the cytoplasmic domain. EMBO (Eur Mol Biol Organ) J. 1988;7:3679–3684. doi: 10.1002/j.1460-2075.1988.tb03249.x. [DOI] [PMC free article] [PubMed] [Google Scholar]
- Nagafuchi A, Shirayoshi Y, Okazaki K, Yasuda K, Takeichi M. Transformation of cell adhesion properties by exogenously introduced E-cadherin cDNA. Nature (Lond) 1987;329:341–343. doi: 10.1038/329341a0. [DOI] [PubMed] [Google Scholar]
- Nagafuchi A, Takeichi M, Tsukita S. The 102-kD cadherin-associated protein: similarity to vinculin and posttranscriptional regulation and expression. Cell. 1991;65:849–857. doi: 10.1016/0092-8674(91)90392-c. [DOI] [PubMed] [Google Scholar]
- Nagafuchi A, Ishihara S, Tsukita S. The roles of catenins in the cadherin-mediated cell adhesion: functional analysis of E-cadherin–α-catenin fusion molecules. J Cell Biol. 1994;127:235–145. doi: 10.1083/jcb.127.1.235. [DOI] [PMC free article] [PubMed] [Google Scholar]
- Näthke, I.S., L.E. Hinck, and W.J. Nelson. 1993. Epithelial cell adhesion and development of cell surface polarity: possible mechanisms for modulation of cadherin function, organization, and distribution. J. Cell Sci. 17(Suppl.):139– 145. [DOI] [PubMed]
- Nelson WJ. Regulation of cell adhesion and development of epithelial cell polarity. Curr Top Membr. 1994;41:123–142. [Google Scholar]
- Nose A, Nagafuchi A, Takeichi M. Expressed recombinant cadherins mediate cell sorting in model systems. Cell. 1988;54:993–1001. doi: 10.1016/0092-8674(88)90114-6. [DOI] [PubMed] [Google Scholar]
- Ozawa M, Kemler R. Molecular organization of the uvomorulin-catenin complex. J Cell Biol. 1992;116:989–996. doi: 10.1083/jcb.116.4.989. [DOI] [PMC free article] [PubMed] [Google Scholar]
- Prins FA, van Diemen-Steenvoorde R, Bonnet J, Cornelese-ten Velde I. Reflection contrast microscopy of ultrathin sections in immunohistochemical localization studies: a versatile technique bridging electron microscopy with light microscopy. Histochemistry. 1993;99:417–425. doi: 10.1007/BF00274094. [DOI] [PubMed] [Google Scholar]
- Quak JJ, van Dongen G, Brakkee JG, Hayashida DJ, Balm AJ, Snow GB, Meijer CJ. Production of a monoclonal antibody (K931) to a squamous cell carcinoma associated antigen identified as the 17-1A antigen. Hybridoma. 1990;9:377–387. doi: 10.1089/hyb.1990.9.377. [DOI] [PubMed] [Google Scholar]
- Rimm DL, Koslov ER, Kebriaei P, Cianci CD, Morrow JS. α1(E)-catenin is actin-binding and -bundling protein mediating the attachment of F-actin to the membrane adhesion complex. Proc Natl Acad Sci USA. 1995;92:8813–8817. doi: 10.1073/pnas.92.19.8813. [DOI] [PMC free article] [PubMed] [Google Scholar]
- Rosales C, O'Brien V, Kornberg L, Juliano R. Signal transduction by cell adhesion receptors. Biochem Biophys Acta. 1995;1242:77–98. doi: 10.1016/0304-419x(95)00005-z. [DOI] [PubMed] [Google Scholar]
- Rutishauser, U. 1992. NCAM and its polysialic acid moiety: a mechanism for pull/push regulation of cell interaction during development. Development (Camb). (Suppl.):99–104. [PubMed]
- Salem RR, Wolf BC, Sears HF, Lavin PT, Ravikumar TS, DeCoste D, D'Emilia JC, Herlin M, Scholm M. Expression of colorectal carcinoma-associated antigens in colonic polyps. J Surg Res. 1993;55:249–255. doi: 10.1006/jsre.1993.1136. [DOI] [PubMed] [Google Scholar]
- Steinberg, M.S., and T.J. Pool. 1982. Cellular adhesive differentials as determinants of morphogenetic movements and organ segregation. In Developmental Order: Its Origin and Regulation. Alan R. Liss, Inc., N.Y. p. 351–378.
- Steinberg MS, Takeichi M. Experimental specification of cell sorting, tissue spreading, and specific spatial patterning by quantitative differences in cadherin expression. Proc Natl Acad Sci USA. 1994;91:206–209. doi: 10.1073/pnas.91.1.206. [DOI] [PMC free article] [PubMed] [Google Scholar]
- Takahashi K, Suzuki K. Density-dependent inhibition of growth involves prevention of EGF receptor activation by E-cadherin–mediated cell– cell adhesion. Exp Cell Res. 1996;226:214–222. doi: 10.1006/excr.1996.0221. [DOI] [PubMed] [Google Scholar]
- Takeda H, Nagafuchi A, Yonemura S, Tsukita S, Behrens J, Birchmeier W, Tsukita S. V-src kinase shifts the cadherin-based cell adhesion from the strong to the weak state and β-catenin is not required for the shift. J Cell Biol. 1995;131:1839–1847. doi: 10.1083/jcb.131.6.1839. [DOI] [PMC free article] [PubMed] [Google Scholar]
- Takeichi M. Cadherin cell adhesion receptors as a morphogenetic regulator. Science (Wash DC) 1991;251:1451–1455. doi: 10.1126/science.2006419. [DOI] [PubMed] [Google Scholar]
- Takeichi M. Morphogenic roles of classic cadherins. Curr Opin Cell Biol. 1995;7:619–627. doi: 10.1016/0955-0674(95)80102-2. [DOI] [PubMed] [Google Scholar]
- Takes RP, Baatenburg de Jong RJ, Schuuring E, Hermans J, Vis AA, Litvinov SV, van Krieken HJM. Markers for assessment of nodal metastasis in laryngeal carcinoma. Arch Otolaryngol Head Neck Surg. 1997;123:412–419. doi: 10.1001/archotol.1997.01900040048008. [DOI] [PubMed] [Google Scholar]
- Tandon AK, Clark GM, Chamness GC, McGuire WL. Association of the 323/A3 surface glycoprotein with tumor characteristics and behavior in human breast cancer. Cancer Res. 1990;50:3317–3321. [PubMed] [Google Scholar]
- Tsubura A, Senzaki H, Sasaki M, Hilgers J, Morii S. Immunohistochemical demonstration of breast-derived and/or carcinoma-associated glycoproteins in normal skin appendages and their tumors. J Cutaneous Pathol. 1992;19:73–79. doi: 10.1111/j.1600-0560.1992.tb01562.x. [DOI] [PubMed] [Google Scholar]
- Vleminckx K, Vakaet L, Jr, Mareel M, Fiers W, Van Roy F. Genetic manipulation of E-cadherin expression by epithelial tumor cells reveals an invasion suppressor role. Cell. 1991;66:107–119. doi: 10.1016/0092-8674(91)90143-m. [DOI] [PubMed] [Google Scholar]
- Wesseling J, van der Valk S, Hilkens J. A mechanism for inhibition of E-cadherin–mediated cell–cell adhesion by membrane-associated mucin episialin/MUC1. Mol Biol Cell. 1996;7:565–577. doi: 10.1091/mbc.7.4.565. [DOI] [PMC free article] [PubMed] [Google Scholar]
- Wheelock MJ, Jensen PJ. Regulation of keratinocyte intercellular junction organization and epidermal morphogenesis by E-cadherin. J Cell Biol. 1992;117:415–425. doi: 10.1083/jcb.117.2.415. [DOI] [PMC free article] [PubMed] [Google Scholar]
- Wilding J, Vousden KH, Soutter WP, McCrea PD, Del Buono R, Pignateli M. E-cadherin transfection downregulates the epidermal growth factor receptor and reverses the invasive phenotype of human papilloma virus-transfected keratinocytes. Cancer Res. 1996;15:5285–5292. [PubMed] [Google Scholar]
- Yang P, Yin X, Rutishauser U. Intercellular space is affected by the polysialic acid content of NCAM. JCell Biol. 1992;116:1487–1496. doi: 10.1083/jcb.116.6.1487. [DOI] [PMC free article] [PubMed] [Google Scholar]
- Zhu AJ, Watt FM. Expression of a dominant negative cadherin mutant inhibits proliferation and stimulates terminal differentiation of human epidermal keratinocytes. J Cell Sci. 1996;109:3013–3023. doi: 10.1242/jcs.109.13.3013. [DOI] [PubMed] [Google Scholar]
- Zorzos J, Zizi A, Bakiras A, Pectasidis D, Skarlos DV, Zorzos H, Elemenoglou J, Likourinas M. Expression of a cell surface antigen recognized by the monoclonal antibody AUA1 in bladder carcinoma: an immunohistochemical study. Eur Urol. 1995;28:251–254. doi: 10.1159/000475060. [DOI] [PubMed] [Google Scholar]