Abstract
The Golgi complex is a dynamic organelle engaged in both secretory and retrograde membrane traffic. Here, we use green fluorescent protein–Golgi protein chimeras to study Golgi morphology in vivo. In untreated cells, membrane tubules were a ubiquitous, prominent feature of the Golgi complex, serving both to interconnect adjacent Golgi elements and to carry membrane outward along microtubules after detaching from stable Golgi structures. Brefeldin A treatment, which reversibly disassembles the Golgi complex, accentuated tubule formation without tubule detachment. A tubule network extending throughout the cytoplasm was quickly generated and persisted for 5–10 min until rapidly emptying Golgi contents into the ER within 15–30 s. Both lipid and protein emptied from the Golgi at similar rapid rates, leaving no Golgi structure behind, indicating that Golgi membranes do not simply mix but are absorbed into the ER in BFA-treated cells. The directionality of redistribution implied Golgi membranes are at a higher free energy state than ER membranes. Analysis of its kinetics suggested a mechanism that is analogous to wetting or adsorptive phenomena in which a tension-driven membrane flow supplements diffusive transfer of Golgi membrane into the ER. Such nonselective, flow-assisted transport of Golgi membranes into ER suggests that mechanisms that regulate retrograde tubule formation and detachment from the Golgi complex are integral to the existence and maintenance of this organelle.
The Golgi complex is responsible for net transport of protein and lipid from the ER to more distal compartments (including lysosomes and the plasma membrane) and recycling of membrane components back to the ER. It also is involved in important biochemical processes (i.e. glycosylation of proteins and biosynthesis of lipids) that enable the cell to tailor its biosynthetic and secretory products for specific needs. The characteristic structural elements of the Golgi complex responsible for these properties include polarized stacks of flattened cisternae enriched in glycoprotein and glycolipid processing enzymes, and vesicles and tubules associated with the rims of stacks (Rambourg and Clermont, 1990; Mellman and Simons, 1992; Tanaka, 1996). How these distinct elements organize and maintain themselves and act to efficiently transport secretory and membrane components arriving from the ER is of widespread interest.
The standard view of Golgi traffic is that it is mediated primarily by vesicles that pinch off from one cisterna and then target to and fuse with a different cisterna (Rothman and Wieland, 1996). Unidirectional transport of protein and lipid is thus achieved with no intermixing of donor and acceptor compartments. The role of tubules in Golgi traffic has been given less attention, despite their prominence. Both the cis- and trans-most cisternae of the Golgi complex are composed of extensive membrane tubule (50– 100-nm diameter) networks (Rambourg et al., 1979; Saraste and Kuismanen, 1984; Sasaki et al., 1984; Ladinsky et al., 1994; Clermont et al., 1995), and tubule connections between Golgi stacks frequently are observed in electron micrographs (Tanaka et al., 1986; Rambourg and Clermont, 1990; Sesso et al., 1994). Tubules can be rapidly generated by Golgi membranes in vivo and in vitro under various conditions (Cluett et al., 1993; Weidman et al., 1993; Banta et al., 1995; de Figueiredo and Brown, 1995), and time-lapse recordings of the Golgi complex labeled with a fluorescent lipid analog, NBD-ceramide, have revealed tubule processes emerging from Golgi elements (Cooper et al., 1990). These observations indicate that tubule formation is an inherent property of Golgi membranes.
Tubules could act as discrete carriers in Golgi traffic, resembling elongated vesicles that migrate within the cytoplasm or translocate along microtubules to their target membranes, unidirectionally and without causing mixing. Alternatively, tubules could establish connections/linkages between the same or different compartments. In the latter case, mechanisms would be needed to explain how maintenance of the chemical distinctions between compartments and directed transport of protein and lipid is achieved.
Membrane traffic has been shown to be mediated by tubules extending between organelles in cells treated with the drug brefeldin A (BFA).1 BFA blocks membrane export out of the ER in vivo (Fujiwara et al., 1988; Lippincott-Schwartz et al., 1989; Doms et al., 1989) and inhibits vesicle formation both in vivo (Donaldson et al., 1991) and in vitro (Orci et al., 1991). This is likely due to BFA's inhibition of nucleotide exchange onto ADP-ribosylation factor (ARF), a low–molecular weight GTP binding protein (Helms and Rothman, 1992; Donaldson et al., 1992b ), which prevents assembly of cytosolic coat proteins (including COP I components) onto target membranes (Orci et al., 1991; Klausner et al., 1992). At the same time, extensive retrograde transport of Golgi components to the ER mediated by growth of Golgi tubules occurs with BFA, leading to the complete loss of Golgi structure (Lippincott-Schwartz et al., 1990). Since a normal retrograde pathway from the Golgi back to the ER exists (Pelham, 1991; Jackson et al., 1993; Stinchcombe et al., 1995), it has been suggested that transport into the ER induced by BFA represents enhanced trafficking through this retrograde pathway as a result of nonselective transport into it of Golgi protein and lipid (Klausner et al., 1992; Lippincott-Schwartz, 1993). How trafficking in BFA-treated cells differs from normal retrograde traffic, what role tubules play in mediating such traffic, and how its perturbation by BFA leads to Golgi disassembly are important unanswered questions.
In this study we exploit previously developed and characterized green fluorescent protein (GFP)-Golgi chimeric proteins (Cole et al., 1996a ) to examine the dynamics of the Golgi complex in vivo and how it is perturbed by BFA. The GFP chimeras provide useful probes of Golgi membrane morphology and dynamics: they localize almost exclusively to Golgi membranes and their diffusional mobility is rapid. By imaging Golgi membranes over time, we show that thin membrane connections between adjacent Golgi elements continuously remodel Golgi structure and that membrane tubules readily pull out along microtubules and detach from Golgi rims. In BFA-treated cells, tubules formed at a more rapid rate and failed to detach from Golgi structures. A dynamic tubule network was generated and persisted for 5–10 min until rapidly emptying protein and lipid contents into the ER within 15–30 s with no Golgi structure remaining. The directionality of the redistribution process implied Golgi membranes to be at a higher free energy state than ER membranes, while its speed (too fast to be explained by simple diffusion) was consistent with tension-driven membrane flow.
Flows are common in fluid systems having free energy differences either across or along their surfaces (Finkelstein, 1987; Bloom et al., 1991) and result in rapid and unidirectional fluid transport (Batchelor, 1967). Spreading of a film on an air–water interface, wetting of a dry solid substrate by a film, or osmotically driven solvent flow through channels that exclude solute are typical examples of flow (de Gennes, 1985; Probstein, 1994). In the context of membranes, flow results from forces either chemically or mechanically produced, which in the context of membranes are conviently expressed as surface tension gradients (force/area) (Probstein, 1994). The existence of tension-driven membrane flow between Golgi and ER compartments suggested by our findings raises fundamental questions about the basic physical–chemical parameters of the Golgi–ER membrane system and the role and regulation of membrane tubules.
Materials and Methods
Materials
Brefeldin A was purchased from Epicenter Technologies (Madison, WI) and was used at concentrations of 2–5 μg/ml. Nocodazole was purchased from Sigma Chemical Co. (St. Louis, MO) and used at concentrations between 1 and 5 μg/ml. When nocodazole was added to cells on ice for 20 min, subsequent incubation at 37°C resulted in the complete depolymerization of all microtubules as detected by immunofluorescence microscopy of fixed specimens. N-ethylmaleimide (NEM) was purchased from Sigma Chemical Co. Rabbit polyclonal antibody N10 against human milk galactosyltransferase (GalTase) was kindly provided by Dr. E. Berger (University of Zurich, Zurich, Switzerland). Rhodamine-labeled goat anti–rabbit IgGs were purchased from Southern Biotechnology (Birmingham, AL).
DNA Constructs
The GFP chimeras used in this study (GFP-GalTase and GFP-KDELR) are the same as those described in Cole et al. (1996a) and used the S65T variant of GFP (Heim et al., 1995). Briefly, the GFP coding region was placed downstream of coding sequences containing human galactosyltransferase or a mutant form of the human homologue of the yeast ERD2 protein, ELP1 (Hsu et al., 1992), also known as KDELR. GFP-GalTase contains amino acids 1–60 of galactosyltransferase, including the NH2-terminal cytoplasmic tail, transmembrane domain, and 17 amino acids of the luminal domain fused to full-length GFP. The mutant form of KDELR-GFP used in this study was generated by mutagenizing the aspartic acid to an asparagine residue at position 195 of ELP1 (analogous to the mutation at position 193 in ERD2 described in Townsley et al., 1993). This mutation caused KDELR-GFP to be more tightly localized to the Golgi complex, with less ER staining compared with the wild-type protein.
Cells
HeLa and CHO cells from the American Type Culture Collection (Rockville, MD) were grown in flasks with DME supplemented with 10% FCS, 2 mM glutamine, and 150 μg/ml penicillin/streptomycin at 37°C in 5% CO2. Cells replated onto No. 1 glass coverslips were transiently transfected with GFP chimera cDNAs by CaPO4 precipitation for 16 h, washed once in PBS, and then incubated in complete medium for an additional 24 h before viewing. Cells were imaged live on a temperature-controlled microscope at 37°C. CHO cells were used in the immunogold labeling experiment. All other experiments were performed using HeLa cells.
BODIPY-ceramide labeling of cells to visualize Golgi membranes was performed as follows. Cells were incubated for 10 min at either 4 or 37°C in serum-free Eagles Minimum Essential Medium (EMEM) and 25 mM Hepes, pH 7.0, with 2–5 μM of BODIPY-ceramide (BODIPY FL C5-Cer/ C5-DMB-Cer; Molecular Probes Inc., Eugene, OR) (1,000× stock dissolved in methanol). Cells were then rinsed and incubated with EMEM containing 0.68 mg/ml defatted-BSA (Sigma Chemical Co.) at 37°C for ∼30–60 min before imaging with the 488-nm line of the confocal microscope or with a fluorescein filter set of a conventional fluorescent microscope as described below.
Electron Microscopy
Cryoimmunoelectron microscopy was according to Liou et al. (1996). CHO cells expressing GFP-GalTase were fixed in the culture dishes by adding 1 vol of 4% formaldehyde and 0.2% glutaraldehyde to the culture medium for 10 min at room temperature. Fixation was continued for an additional 90 min after diluting the above solution with fresh medium 1:1. Cells were carefully scraped from the dish with a rubber policeman, rinsed in phosphate buffer/0.15 M glycine, and embedded in 10% gelatin. Gelatin blocks were infused with 2.3 M sucrose overnight and then frozen in liquid nitrogen. A cryoultramicrotome (Reichert Ultracut S) was used to cut thin cryosections (60 nm) that were collected on pyoloform-coated nickel grids. Immunogold labeling on the grids was performed using a rabbit polyclonal antibody to GFP (CLONTECH Laboratories, Palo Alto, CA) at 1:500 dilution, and protein A conjugated with 15-nm gold particles (Biocell Labs, Carson, CA). An electron microscope (model CM10; Phillips Electronic Instruments, Mahwah, NJ) was used to examine and photograph specimens.
Immunofluorescence Microscopy
Cells were fixed in 2% formaldehyde in PBS for 10 min at room temperature and then washed in PBS solution containing 10% FCS. The cells were then incubated in a PBS solution containing primary antibody, 0.15% saponin, and 10% FCS for ∼45 min. The primary antibody solution was rinsed off and then replaced by rhodamine-labeled secondary antibody solution for 60 min. The coverslips were then washed in PBS serum. Coverslips were mounted on glass slides in Fluoromount G (Southern Biotechnology) for viewing on a fluorescence microscope.
Time-Lapse Imaging and Microscopy
HeLa cells grown on glass coverslips were sealed into a chamber fashioned out of silicon rubber (Ronsil; North American Reiss, Blackstone, VA) placed on a glass slide and containing buffered medium with Oxyrase (Oxyrase, Inc., Ashland, OH). The cells in Figs. 3 C and 4 were viewed with a scanning confocal attachment (model MRC 600; Bio-Rad Labs, Hercules, CA) attached to a microscope (model Axioplan; Carl Zeiss, Inc., Thornwood, NY) with a 63× planapochromat lens (NA 1.4; Carl Zeiss, Inc.). The 488-nm line of a krypton-argon laser was used with a 1 or 3% neutral density filter. Digital output was routed through a time and date generator (model WJ-810; Panasonic Corp., New York), and single frames were recorded on an optical memory disk recorder (model 3031F; Panasonic). Cells in Figs. 2; 3, A and B; and 11, A and B, were viewed on a confocal laser scanning microscope (model LSM 410; Carl Zeiss, Inc.) equipped with a Kr/Ar laser and a 100× 1.4 NA planapochromat oil immersion objective. The GFP molecule was excited with the 488 line of the laser and imaged with a 515–540 bandpass filter. The time-lapse sequence in Fig. 11 B was recorded using macros programmed with the Zeiss LSM software package. In all other experiments, cells were viewed with a custom built inverted wide field microscope (model Eikoscope; Yona Microscopes, Columbia, MD). This microscope was equipped with a 63×, 1.4 NA objective and a cooled charge-coupled device (Photometrics, Tucson, AZ) with a KAF 1400 pixel Kodak chip (Rochester, NY) for 12-bit image detection. A 100-W mercury lamp was used as the light source. Neutral density filters, excitation (485 nm band pass), emission (515 nm long pass), and dichroic filters (fluorescence set XF32; Omega Optical Inc., Brattleboro, VT) were used to select the appropriate spectra for imaging GFP and BODIPY-ceramide. Biological Detection Systems imaging software (version 1.6, now Oncor imaging, Oncor Instruments, San Diego, CA) or IPlab Spectrum was used to control image acquisition (Macintosh Quadra 800; Apple Computer Co., Cupertino, CA). Images were manipulated using IPlab Spectrum (Signal Analytics, Vienna, VA), NIH-Image software (Wayne Rasband, Research Services Branch, National Institutes of Health, Bethesda, MD), and Adobe Photoshop (San Jose, CA). Images were printed with a Fujix Pictrography 3000 Digital Printer (Fuji Photofil Co., Tokyo, Japan). None of the cooled CCD images collected and displayed had any saturated pixels. The dynamic range was 0–4,095 gray levels for the cooled CCD images. For the confocal images, the range was 0–255 gray levels. There was no overexposure in those confocal images (Fig. 11, A and B), which were used to analyze Golgi blinkout and to fit a diffusion constant since it clearly would have spoiled the quantitation.
Figure 3.
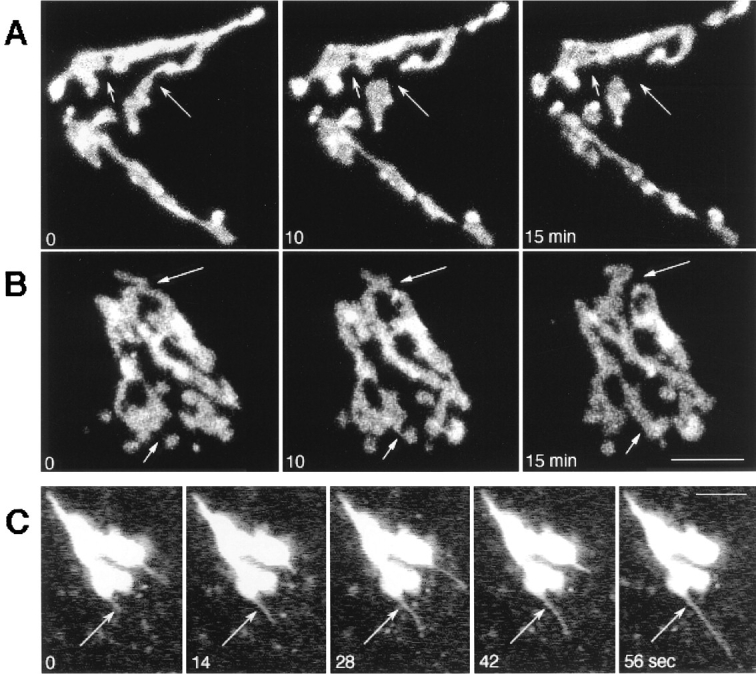
Tubule connections and extensions of the Golgi complex. (A and B) A time series of images from HeLa cells expressing GFP-GalTase (A) or GFP-KDELR (B) were collected at 0, 10, and 15 min at 37°C on a confocal microscope. Each image represents an overlay of a set of confocal slices extending the depth of the cell. Short arrows point to thin membrane connections initiating more stable membrane continuities between Golgi elements, while long arrows point to areas of detachment. (C) Single images with the confocal pinhole wide open were collected at 7-s time intervals in GFP-KDELR– expressing cells. Arrows point to thin tubule that rapidly extended off of Golgi rim. Bars, 3 μm.
Figure 4.
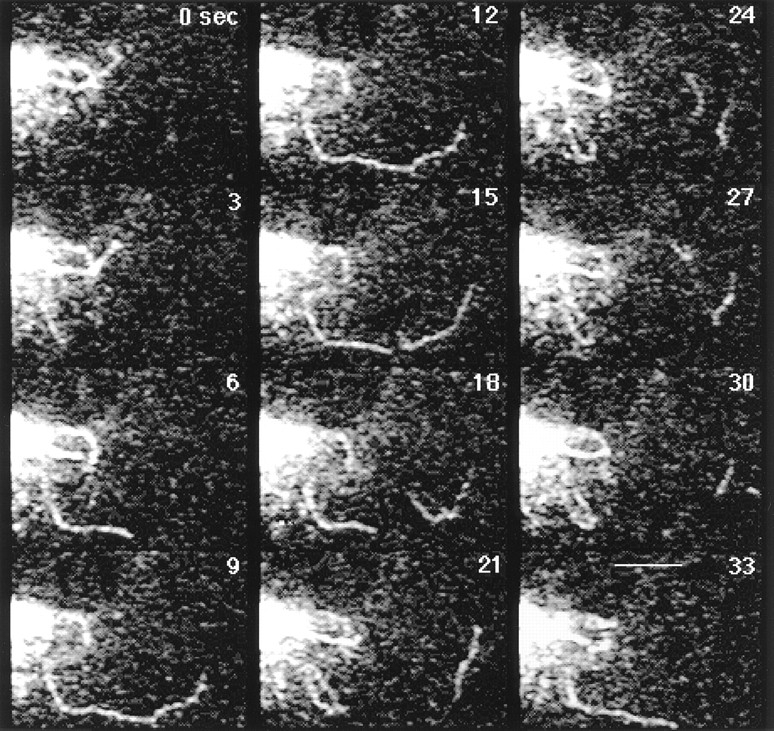
Formation and detachment of Golgi tubules in untreated cells. GFP-KDELR– expressing HeLa cells were imaged at 3-s time intervals at 37°C on a confocal microscope with the pinhole partly closed and brightness level increased for optimal imaging of tubules (at this brightness level GFP intensity within Golgi elements was saturated). Tubules pulled off from Golgi rims, extended into the cell periphery, and often detached from Golgi elements. Detached Golgi tubules continued to move peripherally. Bar, 3 μm. See Quicktime movie sequence at http://dir.nichd.nih. gov/CBMB/pb4labob.htm.
Figure 2.
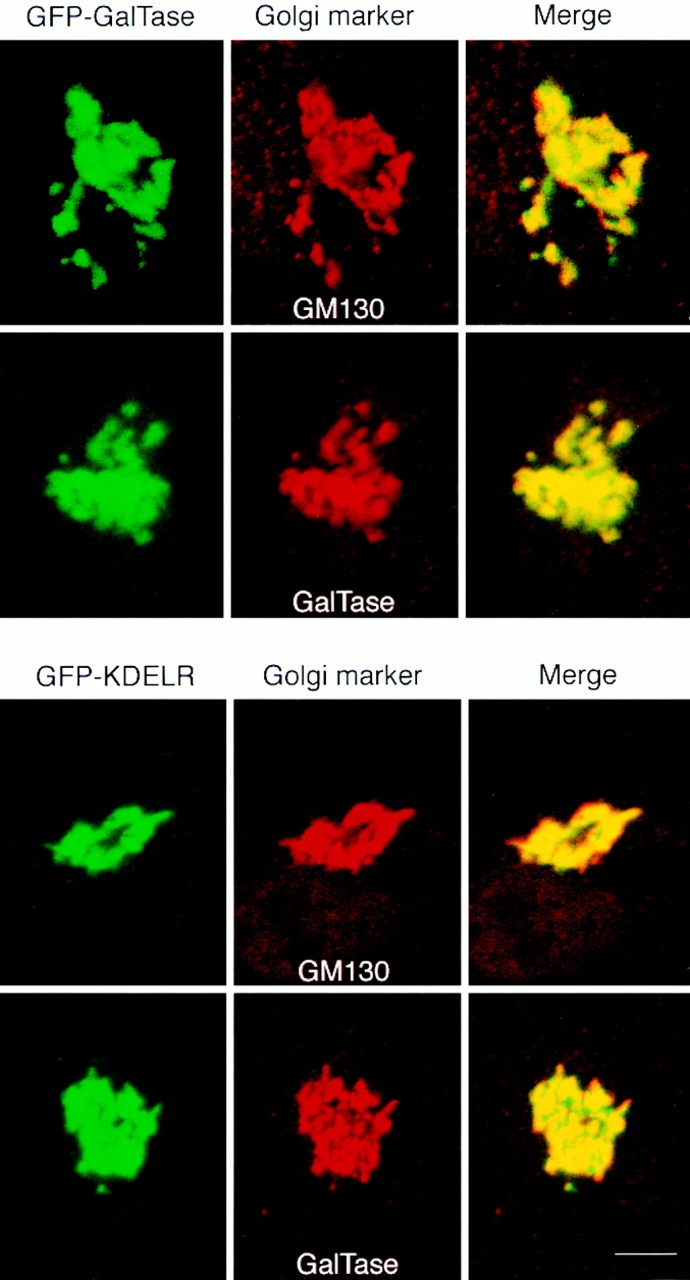
Double labeling of GFP chimeras with Golgi markers using immunofluorescence microscopy. GFP-GalTase or GFP-KDELR expressing HeLa cells were fixed, permeabilized, and labeled with antibodies to the indicated Golgi proteins followed by secondary antibodies coupled to rhodamine. GFP fluorescence is shown on the left, rhodamine labeling in the middle, and the merged images in the right panels. Yellow indicates regions of overlap. Bar, 3 μm.
Figure 11.
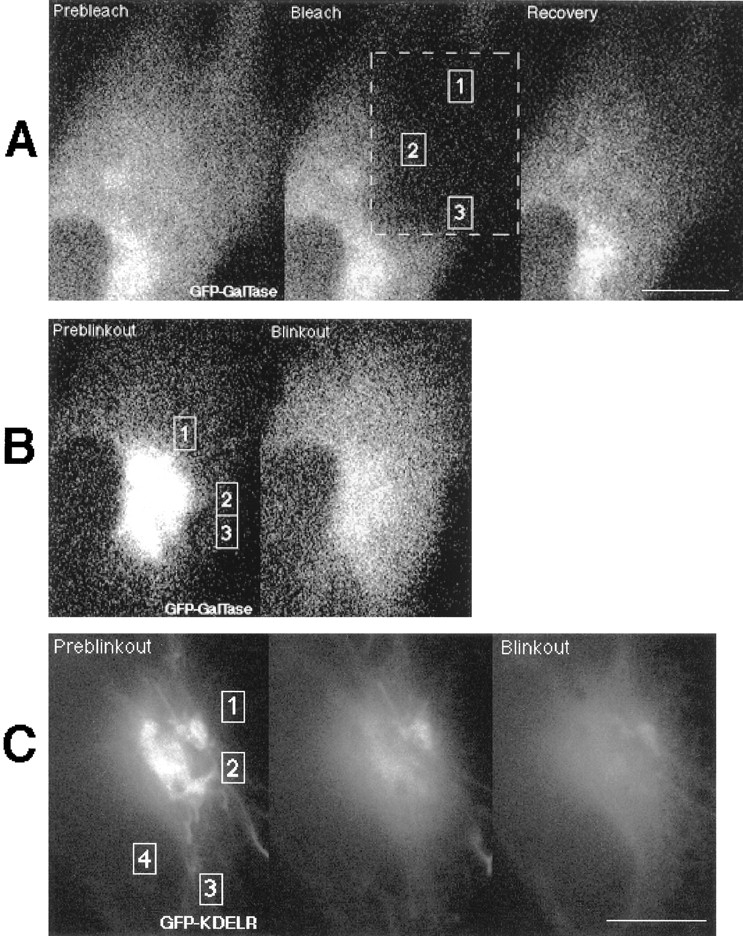
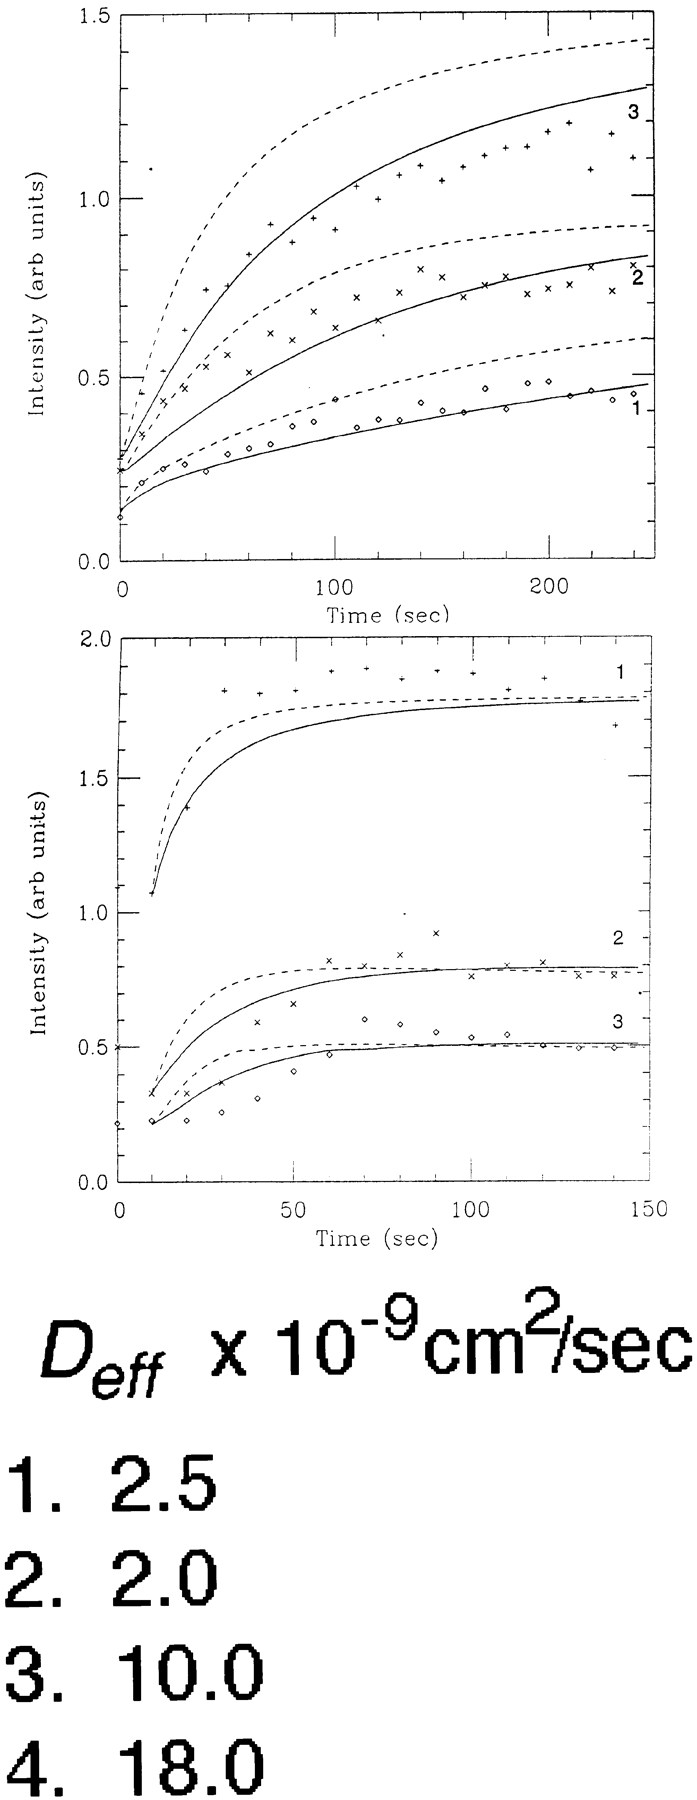
Evidence for membrane flow from Golgi to ER: diffusive recovery from photobleach contrasted with the time course of Golgi blinkout. (A) Three confocal images showing photobleaching and recovery of GFP-GalTase in the ER in cells treated with BFA for 1 h. The left panel is the prebleach image, the middle panel is just after the bleach, and the right panel is after recovery. The bleached region is outlined in dashed lines. The fluorescent intensities within the boxed ROIs labeled 1, 2, and 3 during recovery are plotted as symbols to the right (diamonds, crosses, and pluses, respectively). The smooth curves are simulations with D eff of 2.5 × 10⁻⁹cm2/s as explained in the text and A. The dashed curves are the same simulation assuming D eff of 5.0 × 10⁻⁹cm2/s. Note that even though each ROI displayed a different recovery curve, a single D eff of 2.5 × 10⁻⁹cm2/s in the simulations could effectively account for all the experimental data. (B) The same cell as in A was imaged during Golgi blinkout after addition of BFA. The two confocal images correspond to onset of Golgi blinkout and after the redistribution into the ER is complete. The fluorescent intensities within the boxed ROIs labeled 1, 2, and 3 during Golgi blinkout are plotted to the right as symbols (pluses, crosses, and diamonds, respectively). Numerical simulations began with the fluorescent density field shown in the left panel and assumed diffusive transport toward the field in the right panel. The smooth curves in the graph show the simulated intensity assuming D eff of 2.5 × 10⁻⁹cm2/s, whereas the dashed curves show the simulated intensity assuming D eff of 5.0 × 10⁻⁹cm2/s. Note the latency period of the experimental data in relation to the simulated curves and the more sigmoidal rise. (C) Three cooled CCD images of a GFP-KDELR–expressing cell at the beginning of Golgi blinkout (left), 7.4 s later (middle), and the final time point 37 s later (right). Fluorescent intensity values of the four ROIs shown were plotted as a function of time in BFA. Numerical simulations ran from the first panel toward the third as in B. Diffusion constants for each ROI that best fit the data are shown. Bars (A and C), 10 μm.
Computer Simulation and Analysis of Diffusive Transport
Fluorescence recovery after photobleaching (FRAP) was performed on a Zeiss LSM 410 using the 488-nm line of a Kr/Ar laser (Cole et al., 1996a ). The outlined box was photobleached at full laser power (100% power, 100% transmission), and recovery of fluorescence was monitored by scanning the entire cell at low laser power (30% power, 0.3% transmission) in 10-s intervals. Negligible bleaching occurred while imaging the recovery process at low laser power.
Diffusion was modeled assuming a random tubular network of variable density that was defined by the measured fluorescence in a so-called reference state (i.e., long times after Golgi blinkout in BFA-treated cells, or before bleach in the FRAP experiments). The fluorescence in the cell was assumed to evolve diffusively from an initial state (i.e., before blinkout in BFA-treated cells, or immediately after bleach after FRAP) towards the reference image. The initial and reference images, and background intensities to subtract, were supplied to a simulation program written in Fortran, which could produce output curves of fluorescence versus time for any desired regions of interest. The basic principles used by this program are all described in A. The time used in the simulation is converted to physical units by supplying the pixel size and an assumed D eff. Curves using different trial values of D eff could then be plotted together with actual data.
We have extensively tested this method under conditions where diffusive transport could be assumed (i.e., FRAP experiments) and values for D eff could also be obtained from a dedicated FRAP instrument (Cole et al., 1996a ). In another study performed in this lab (Ellenberg et al., 1997), diffusion of ER proteins was analyzed using a traditional FRAP approach in which a thin strip was bleached across the cell. D eff was determined for large numbers of cells both by the traditional approach of fitting to an equation describing one-dimensional diffusion and by matching predicted curves produced by the simulation program with actual data. The resulting D eff determined in the same cell using the two methods were extremely similar.
Results
Localization of the GFP-Golgi Chimeras
Galactosyltransferase is a Golgi resident enzyme that functions in the remodeling of N-linked oligosaccharides attached to proteins moving through the secretory pathway. By contrast, KDEL receptor is an itinerant Golgi protein, which recycles KDEL-containing ligands passing through the Golgi back to the ER (Lewis and Pelham, 1992). Previous work has demonstrated that addition of the GFP tag to these proteins does not interfere with Golgi targeting of these proteins or with ligand-induced recycling of KDELR (Cole et al., 1996a ). GFP-tagged galactosyltransferase (GFP-GalTase) and KDEL receptor (GFP-KDELR) were both shown to reside predominantly in juxtanuclear Golgi-like structures, with GFP-KDELR also found in small amounts in the ER (Cole et al., 1996a ). To further analyze the Golgi location of these chimeras, we used immunogold electron microscopy, and confocal microscopy of double-labeled specimens. Immunoelectron microscopy using thin, frozen sections labeled with polyclonal antibodies to GFP followed by secondary antibodies coupled to 15-nm gold revealed the ultrastructural distribution of the chimeras. As shown in Fig. 1, A–C, for GFP-GalTase, nearly all of the gold particles were restricted to the Golgi complex and were mostly found associated with stacked cisternae. No significant gold labeling of plasma membrane or nuclear envelope was detected. In cells expressing GFP-KDELR (Fig. 1 D), a similar localization of gold particles to Golgi stacks was observed, but occasional gold particles were also found over the ER.
Figure 1.
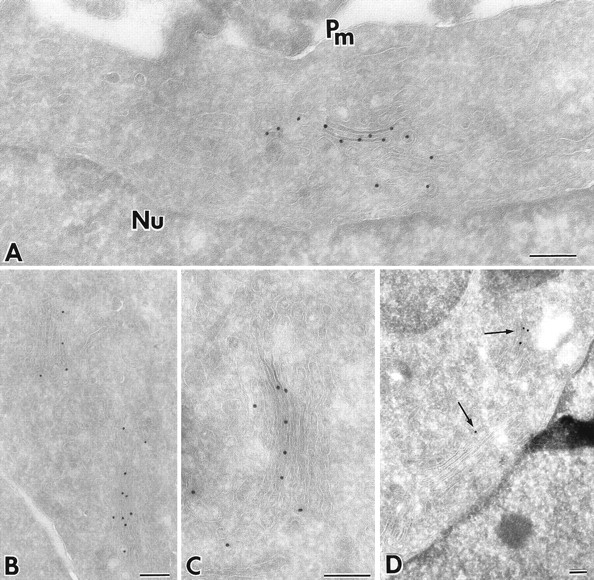
Localization of GFP-GalTase by immunogold microscopy. Gallery of images from cryosections of CHO cells expressing GFP-GalTase (A–C) or GFP-KDELR (D) that were immunostained with anti-GFP antibody and 15-nm colloidal gold protein A. Note that multiple cisternae within Golgi stacks are specifically labeled with gold particles. Nu, nucleus; Pm, plasma membrane. Bars, 0.2 μm.
Confocal microscopy was used to compare the location of GFP-GalTase and GFP-KDELR with other well-characterized Golgi markers, including GM130, a cis-Golgi matrix protein (Nakamara et al., 1995) and GalTase, a Golgi enzyme enriched in medial-trans cisternae of Golgi stacks (Berger et al.) (Fig. 2). Cells expressing the GFP-chimeras were fixed and then labeled with primary antibodies to GM130 or GalTase followed by rhodamine-conjugated secondary antibodies. When such cells were imaged using a confocal microscope, significant overlap in the distribution of green (GFP-chimera) and red (antibody) fluorescence was observed, giving rise to a merged yellow signal. The subtle difference in staining pattern observed for some of the proteins (for example, GFP-KDELR overlapped more with GM130 than with GalTase) is likely to reflect differences in localization of these proteins to different sets of Golgi cisternae, as suggested in previous studies comparing the distribution of Golgi markers using confocal microscopy (Antony et al., 1992; Nilsson et al., 1993; Shima et al., 1997). Altogether, the above results suggest that the majority of GFP-tagged GalTase and KDELR molecules expressed within HeLa or CHO cells reside within Golgi stacks and that they exhibit overlapping distributions among Golgi cisternae.
Morphology and Dynamics of Golgi Membranes Labeled with GFP Chimeras in Living Cells
To analyze the dynamic properties of Golgi membranes in living cells, time-lapse recordings of HeLa cells expressing the GFP-Golgi fusion proteins were performed. In Fig. 3, A and B, each time point was composed of a set of confocal slices extending the depth of the cell so that the complete three-dimensional structure of the Golgi could be visualized. The data showed that the overall arrangement of Golgi elements within the cytoplasm was relatively stable over 15 min of imaging. However, local remodeling of Golgi elements constantly occurred and involved the formation and/or detachment of thin tubule processes that interconnected adjacent Golgi elements. Many of the tubules appeared to initiate more stable and thicker membrane connections between Golgi elements (Fig. 3, arrows) and were reminiscent of the tubules observed in electron microscopic studies that connect Golgi stacks into a continuous network (Tanaka et al., 1986; Rambourg and Clermont, 1990).
The large scale stability of Golgi structures contrasted with the considerable plasticity of Golgi rims observed in time-lapse sequences captured at high speed. Thin tubular processes were found to extend rapidly, break off, or detach from the rims of Golgi stacks during any 5-min interval of imaging at 7-s intervals (Fig. 3 C). Tubule extension and retraction frequently lasted 30–60 s and were a ubiquitous and prominent feature of Golgi dynamics.
Tubule activity of Golgi membranes labeled with GFP-Golgi proteins resembled in many respects those previously reported for the fluorescent lipid analogue NBD-ceramide (Cooper et al., 1990), which localizes to Golgi stacks and the TGN (Lipsky and Pagano, 1987; Pagano et al., 1989). Imaging of living cells with the lipid analogue additionally revealed, however, submicron particles (previously described as secretory vesicles leaving the TGN) that moved outward from the Golgi region to the plasma membrane (Cooper et al., 1990). GFP-tagged KDELR and GalTase described here were never observed in outward moving particles or vesicles (only tubules) and never appeared on the plasma membrane. Instead, these proteins remained predominantly localized to Golgi membranes with small amounts found in detached tubules and the ER.
Characteristics of Golgi Tubule Processes in Untreated Cells
Time-lapse sequences captured at high speeds from cells expressing GFP-KDELR revealed Golgi tubules to extend rapidly, break off, and to continue to move out to the cell periphery (Fig. 4 and Quicktime movie sequences at http://dir.nichd.nih.gov/CBMB/pb4labob.htm). Analysis of the sequences showed Golgi tubules moved along curvilinear tracks at average rates of 0.6 μm/s (Table I). They frequently extended 4–6 microns before retracting back or detaching from Golgi elements on a time scale ranging from 9–120 s. Detached tubules continued to move peripherally at rates of 0.6 μm/s before changing shape and direction. On some occasions, detached tubules curled up into a ball and remained in this state until they disappeared from view (perhaps as a result of fusion with the peripheral ER membrane system). Since detached tubules could be followed out to the periphery of the cell where they remained visible for significant lengths of time and were observed on either a confocal or conventional microscope system sampling a full depth of field, they were not an artifact arising from imaging thin sections. Those tubule processes containing GFP chimeras that did not detach from Golgi elements sometimes initiated stable membranous connections with adjacent Golgi elements, as shown in Fig. 3, A and B.
Table I.
Properties of Golgi Tubules in HeLa Cells Expressing GFP-KDELR
| Untreated cells | BFA-treated cells | |||
|---|---|---|---|---|
| Length | 4.3 ± 1.7 μm (n = 16) | 4–20 μm (n = 15) | ||
| Velocity of extension | 0.6 ± 0.2 μm/s (n = 16) | 0.6 ± 0.2 μm/s (n = 15) | ||
| Range of duration | 9–120 s (n = 16) | 3–9 min (n = 15) | ||
| Tubule number | 0–8 (n = 7) | 20–30 (n = 5) | ||
| in 1-min interval |
Golgi tubules extending from the rims of Golgi elements were analyzed in untreated cells or in cells treated with BFA (2 μg/ml) at 37°C from digitized images collected on a confocal microscope. n, number of cells observed.
The curvilinear path and rate of movement of Golgi tubules suggested they were transported along microtubules. Consistent with this, Golgi tubule processes were not observed in cells treated with the microtubule-disrupting agent nocodazole (not shown). Since Golgi tubules appeared to move peripherally along microtubules, a plus end–directed microtubule motor, possibly kinesin (Vale et al., 1985; Lippincott-Schwartz et al., 1995), could be associated with their membranes to power such movement.
Proliferation of Golgi Tubules during BFA Treatment
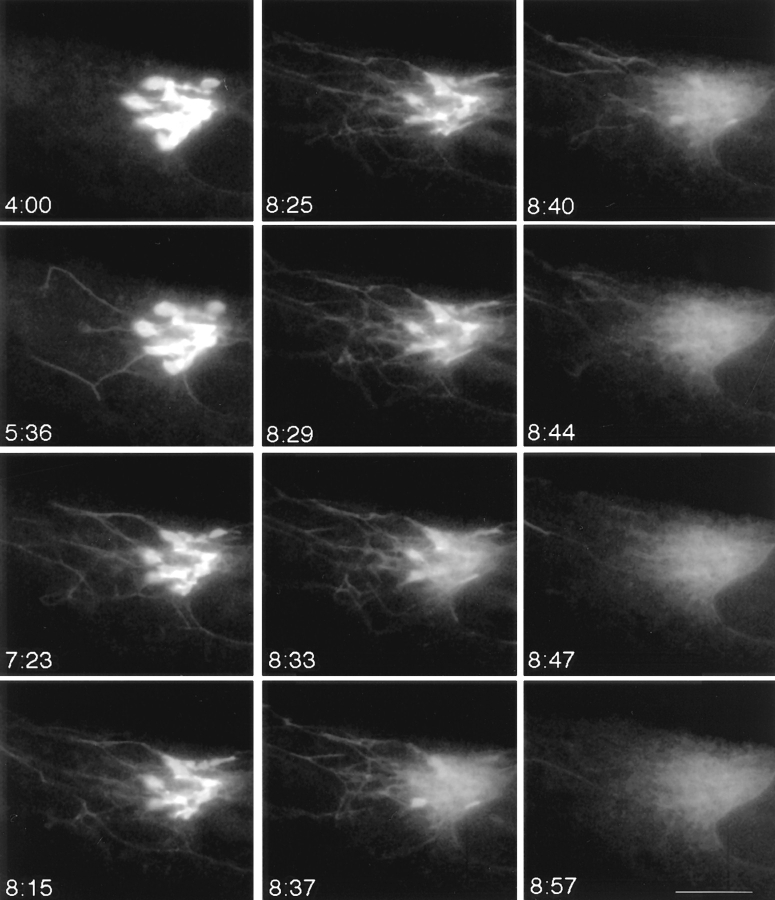
The steady-state dynamics of Golgi membranes containing GFP chimeras described above was profoundly altered upon treatment of cells with BFA. BFA prevents the binding of peripheral COP I proteins onto Golgi membranes and results in Golgi membrane tubulation and redistribution into the ER (Klausner et al., 1992). Time-lapse imaging of BFA-treated cells revealed that the rate of tubule formation dramatically increased within 4–5 min after adding the drug (Fig. 5 and Table I). BFA-induced Golgi tubules were motile, extending/retracting and sometimes appearing to bifurcate (Fig. 5). Their overall appearance and properties were similar to those found in normal cells (Table I), except that they did not detach from the Golgi and extended enormous lengths (up to 20 μm) into the cytoplasm. That GalTase and the fluorescent Golgi lipid analogue BODIPY-ceramide (Pagano et al., 1991) colocalized within the same tubules in BFA-treated cells (Fig. 6) suggested extensive mixing of Golgi lipids and proteins within these structures.
Figure 5.
Tubulation and explosive disassembly of the Golgi complex in BFA-treated cells. GFP-GalTase– expressing HeLa cells treated with BFA were imaged at 4-s time intervals using a cooled CCD microscope system at 37°C. Images shown begin after 4 min (4:00) of BFA treatment and extend until 8 min 57 s (8:57). Tubule formation was accentuated in these cells without tubule detachment. GFP-GalTase rapidly emptied from the Golgi tubular system into the ER over a period of about 14 s beginning at 8 min 33 s (8:33). Thereafter, the GFP label remained dispersed in ER membranes leaving no identifiable Golgi structures behind. Bar, 5 μm. See Quicktime movie sequence at http://dir.nichd.nih.gov/CBMB/pb4labob.htm.
Figure 6.
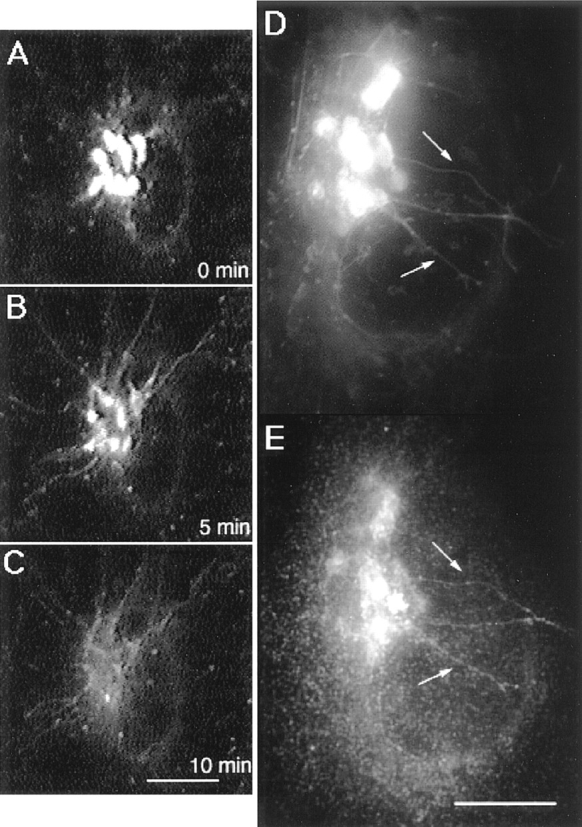
Tubules containing BODIPY-ceramide in BFA-treated cells and their codistribution with GalTase. (A–C) Golgi membranes were labeled with BODIPY-ceramide and then treated with BFA before imaging at 37°C with a cooled CCD microscope system. Images were collected at 0 min (A), 5 min (B), and 10 min (C) after BFA treatment. Note that juxtanuclear Golgi structures labeled by the fluorescent lipid analog tubulated in response to BFA and then dispersed. (D and E) Cells plated on gridded coverslips were labeled with BODIPY-ceramide and imaged 5 min after BFA treatment. The cells were fixed, permeabilized, and then prepared for immunofluorescence using rabbit anti–mouse GalTase antibody followed by rhodamine-labeled goat anti–rabbit IgG. Cells previously imaged in fluorescein optics were located and then reimaged in rhodamine optics to compare the distribution of the two labels. Arrows point to staining of GalTase (E) and BODIPY-ceramide (D) colocalized to the same Golgi tubules in BFA-treated cells. Bars, 10 μm.
Delayed and Rapid Redistribution of Golgi Membranes into the ER in BFA-treated Cells
The Golgi tubule network generated during BFA treatment persisted for several minutes. Then, very abruptly, the network disappeared and GFP chimera fluorescence redistributed into the ER (Fig. 5 and Quicktime movie sequence at http://dir.nichd.nih.gov/CBMB/pb4labob.htm.). Emptying of GFP chimera fluorescence into the ER in some cases took only 15 s. In the cell shown in Fig. 5, for example, fluorescence within the Golgi tubule network at 8 min 33 s was completely redistributed into the ER (including the nuclear envelope) by 8 min 57 s. Although redistribution of Golgi into the ER during BFA-treatment is well known (Doms et al., 1989; Lippincott-Schwartz et al., 1989), the two step process of Golgi tubule network formation followed by sudden, rapid delivery of Golgi membrane into the ER was unexpected.
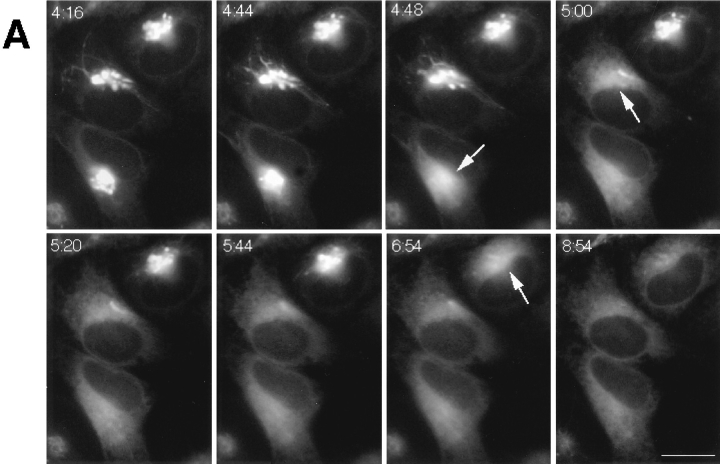
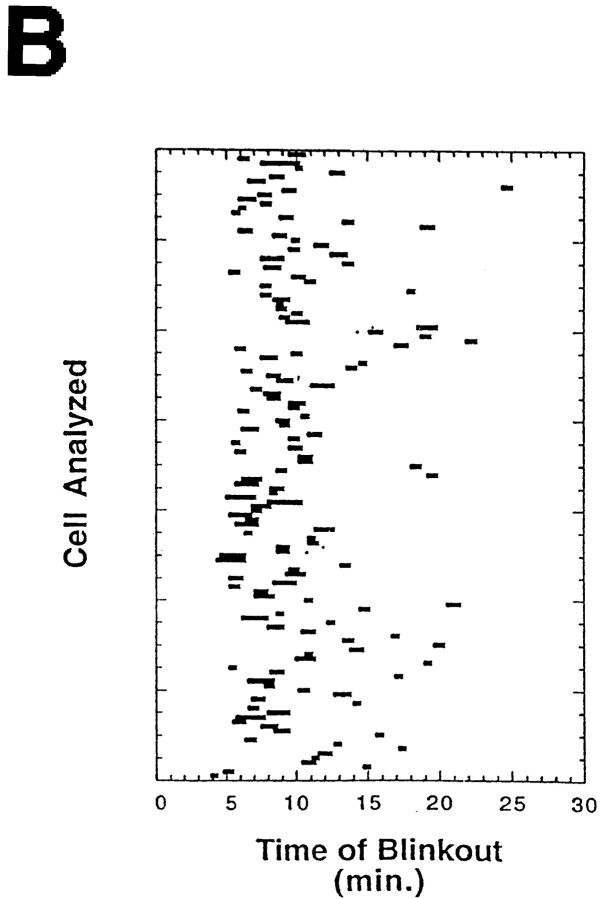
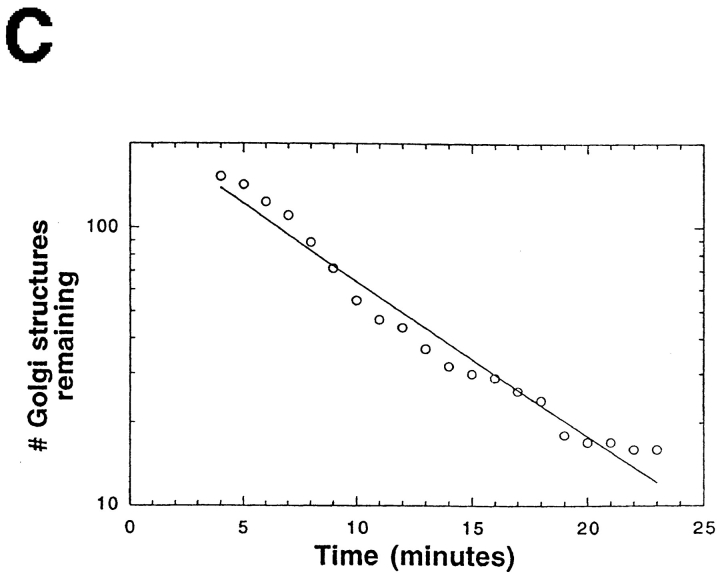
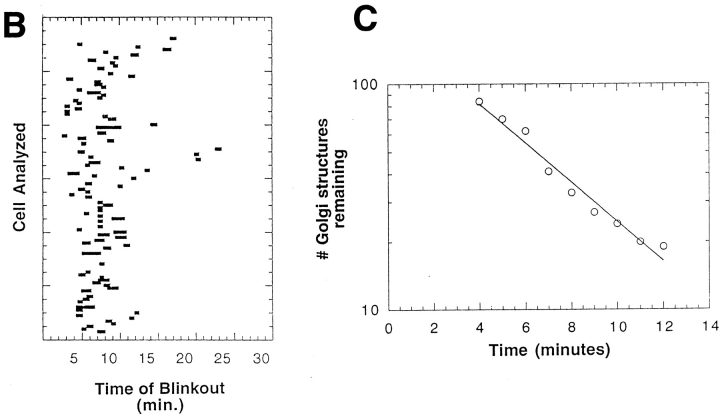
Golgi redistribution into the ER occurred at different times in different cells (Fig. 7 A) but was always a sudden, explosive event that we called Golgi “blinkout.” Within a population of over one hundred cells, Golgi blinkout usually occurred 4 to 8 min after BFA was added and had a duration of 15–60 s during which Golgi-localized fluorescence dispersed into the ER (Fig. 7 B). Significantly, the number of Golgi structures in a population of cells treated with BFA decreased exponentially in time (after a latency period of about 4 min) (Fig. 7 C), resembling a first-order process (i.e., radioactive decay). This suggested that entry of BFA-treated Golgi membranes into the ER system is likely to involve a unique fusion event or entry site rather than targeting and fusion of a mass of tubules or vesicles.
Figure 7.
Time-course and kinetics of Golgi disassembly in a population of cells treated with BFA. Cells expressing GFP-GalTase were treated with BFA and imaged with a cooled CCD microscope system at 37°C. (A) A field of cells showing redistribution of GFP-GalTase into the ER. Arrows point to Golgi structures undergoing blinkout. Note that Golgi blinkout occurred at different times in different cells. Images shown begin at 4 min 16 s (4:16) of BFA treatment and extend until 8 min 54 s (8:54). (B) Time-lapse sequences were taken as described above with images taken at 13.5-s intervals. Bars show duration (start to finish) of Golgi blinkout. Start of blinkout was the first frame showing spreading of fluorescence. The end was the last frame to show change. (C) The data set in B was replotted to show the number of Golgi structures remaining as a function of time in BFA. The best fit exponential function to the numbers is the line shown on the graph, indicating that the kinetics of Golgi blinkout in a cell population is a first order process. Bar, 10 μm.
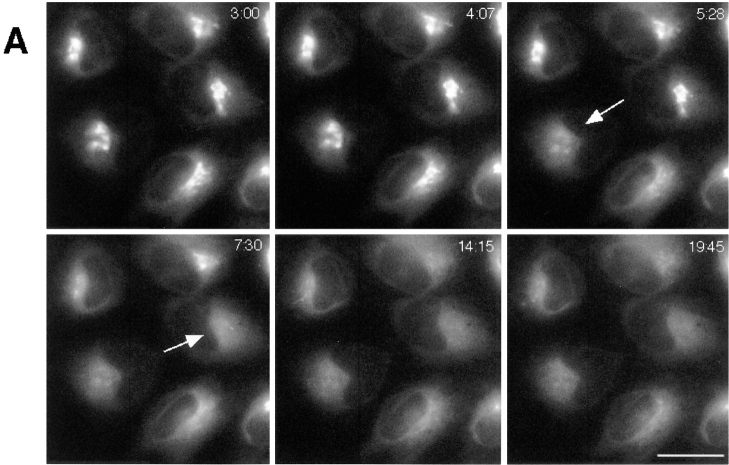
Golgi membranes labeled with BODIPY-ceramide also redistributed into the ER in BFA-treated cells by a rapid and discrete process (Fig. 8 A). The onset and duration of Golgi blinkout in these cells was indistinguishable from that of cells expressing the GFP-Golgi protein chimeras. For both, blinkout usually occurred between 4 and 8 min after adding BFA and lasted only 15–60 s (Fig. 8 B). In addition, Golgi structures in the population of cells disappeared exponentially in time, consistent with a unique fusion event triggering the redistribution process (Fig. 8 C). As found for the GFP-Golgi protein chimeras, very little BODIPY label was left concentrated in Golgi structures after this redistribution (Fig. 8 A), with the label instead found distributed throughout the ER system. In cells stained with higher concentrations of BODIPY-ceramide, however, a Golgi remnant sometimes remained and presumably corresponded to the trans-Golgi network, which does not redistribute its membranes into the ER with BFA (Lippincott-Schwartz, 1991). These results suggest that both Golgi lipid and protein are delivered at equivalent rapid rates into the ER upon initiation of a distinct event (possibly fusion of a single Golgi tubule with the ER) in BFA-treated cells.
Figure 8.
Kinetics of disassembly of BODIPY-ceramide–labeled Golgi structures in BFA-treated cells. Cells were labeled with BODIPY-ceramide and treated with BFA. They were then imaged at 37°C using a cooled CCD microscope system. (A) Image sequences of a field of cells from 3 min (3:00) to 19 min 45 s (19:45) of BFA treatment showing redistribution of BODIPY-ceramide from juxtanuclear Golgi structures into the ER. Arrows point to cells that have just undergone blink out. (B) Time-lapse sequences were taken as described above with images collected at 13.5-s intervals. Bars show duration (start to finish) of Golgi blinkout for 110 cells. Start of blinkout was the first frame showing spreading of fluorescence. The end was the last frame to show change. Onset and duration of Golgi blinkout in BODIPY-ceramide– labeled Golgi membranes was indistinguishable from GFP-GalTase–labeled Golgi membranes. (C) The data set in B was replotted to show the number of Golgi structures remaining as a function of time in BFA. The best fit exponential function to the numbers is the line shown on the graph, indicating that the kinetics of Golgi blinkout in a cell population is a first order process. Bar, 10 μm.
Golgi blinkout was temperature dependent and NEM sensitive. At temperatures below 30°C tubules proliferated, but Golgi redistribution into the ER rarely occurred within 30 min of imaging (data not shown). In the presence of NEM (2 μg/ml added 2 min after BFA), tubules formed but quickly lost their ability to move, and no redistribution of Golgi membrane into the ER occurred (data not shown).
Effects of Microtubule Disruption and Golgi Fragmentation on the Process of Golgi Blinkout
Cells treated with nocodazole before addition of BFA showed no induction of Golgi tubules (Fig. 9), consistent with a microtubule requirement for peripheral extension and movement of these elements. In addition, the interval of time preceding Golgi blinkout dramatically increased and occurred anytime between 10 and 50 min of BFA treatment. The duration of individual Golgi blinkouts, however, was unchanged. This is illustrated in Fig. 9 (see also Quicktime movie sequence at http://dir.nichd.nih.gov/CBMB/pb4labob.htm.), where GFP-GalTase fluorescence associated with the Golgi complex was relatively constant for 36 min of BFA treatment and then completely redistributed into the ER during the next 1 min. This result suggests that extension of Golgi tubules along microtubules serves to increase the probability of fusion between Golgi and ER membranes. Once fusion between these two organelles is initiated (which can occur in the absence of Golgi tubule extension since ER membranes are distributed throughout the cytoplasm), the Golgi rapidly and completely empties into the ER.
Figure 9.
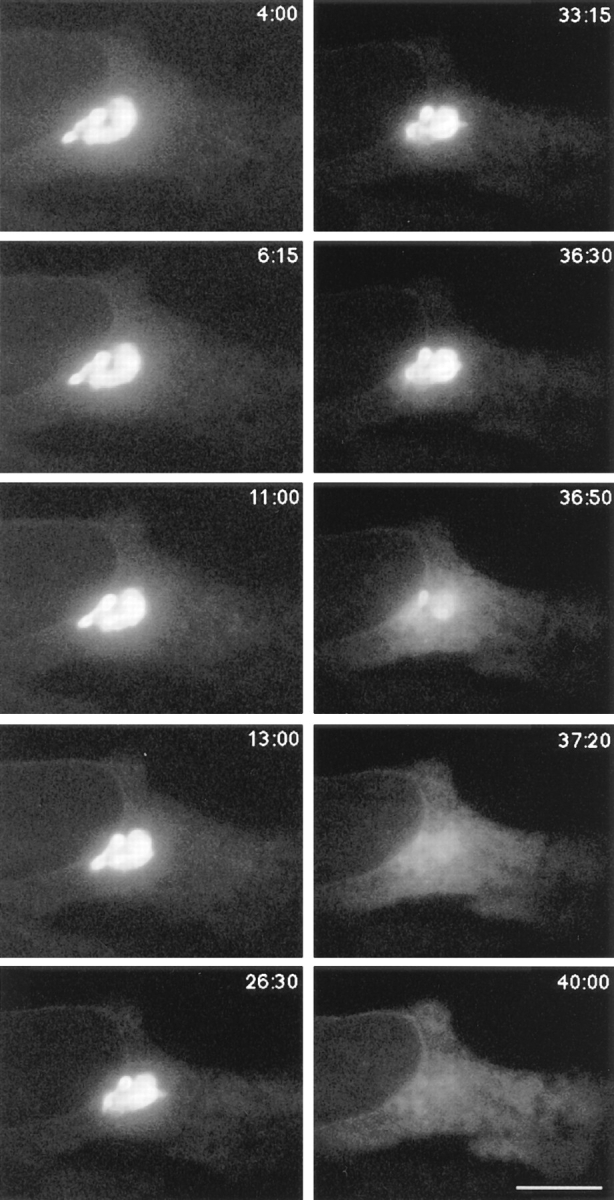
Microtubule depolymerization delays onset but not the kinetics of Golgi blinkout in BFA-treated cells. GFP-GalTase– expressing cells were placed on ice for 20 min, and nocodazole (1 μg/ml) was added to depolymerize microtubules (Cole et al., 1996b ). Cells were warmed to 37°C in the presence of BFA. Cells were then imaged at 37°C using a cooled CCD microscope system. Images shown begin at 4 min (4:00) after warm-up and extend until forty min (40:00). Very little change in Golgi morphology at the light microscope level occurred during the first 30 min of BFA treatment, with no tubules observed. Beginning at 36 min 30 s (36:30), however, GFP-GalTase redistributed into the ER, spreading throughout this compartment within 50 s (37:20). Thus, microtubule disruption delays onset of Golgi blinkout but does not affect its rapid kinetics. Bar, 5 μm . See Quicktime movie sequence at http://dir.nichd.nih.gov/CBMB/pb4labob.htm.
Within single cells whose Golgi elements were scattered/ fragmented and not obviously interconnected, distinct BODIPY-ceramide or GFP-GalTase containing Golgi elements disappeared at different time points after BFA treatment. This is shown for BODIPY-ceramide in the cell shown in Fig. 10, where 22 images (comprising the time course of BFA-induced Golgi blinkout) were analyzed. The distribution of Golgi elements at the start of the experiment is shown schematically on top. The three panels on the bottom show three time series (direction of time is left to right, 2:40–6:09 min) correlating to three vertical line scans through the data set. The intensity of the BODIPY-ceramide during the time series was mapped to a color lookup table shown at the upper right, with the most intense signal colored purple and blue, and least intense colored red and yellow. Bright BODIPY-ceramide structures (correlating to discrete Golgi elements) disappeared suddenly at different time points upon BFA treatment, suggesting that multiple Golgi blinkouts occur within a single cell when membranes from one Golgi element either fail to connect or are unable to connect to others (i.e., during microtubule disruption).
Figure 10.
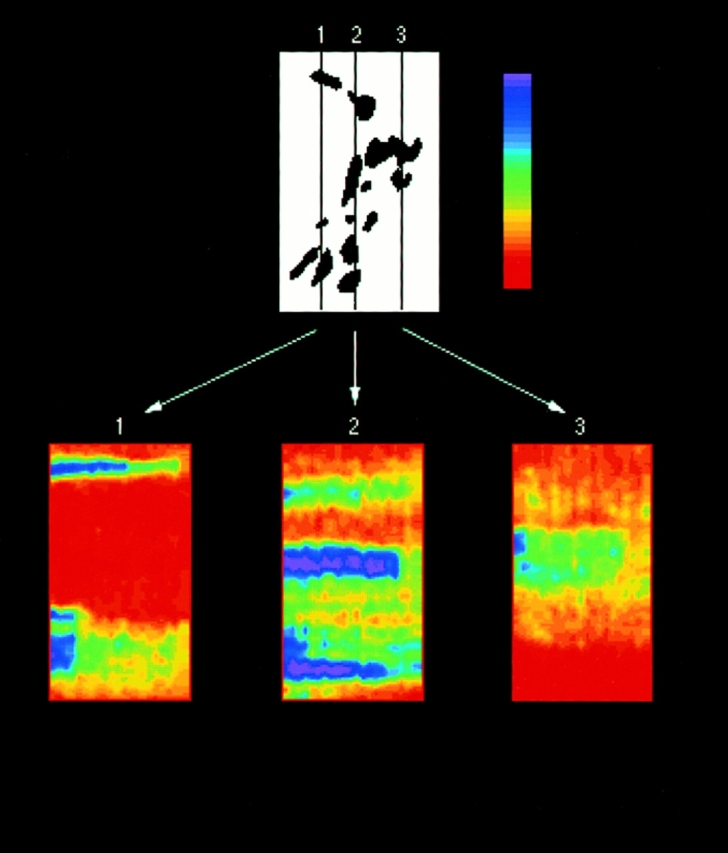
Separate BODIPY-ceramide–labeled Golgi elements in the same cell disassemble at different times during BFA treatment. BFA-induced redistribution of Golgi membranes labeled with BODIPY-ceramide were visualized in individual cells using a cooled CCD microscope system. The images were digitized and analyzed on a computer. The entire image set of 22 images (each image 9-s apart) was used to construct three time series (bottom panels 1, 2, and 3) correlating to three vertical line scans through the data set. The distribution of Golgi elements at the start of the experiment is shown in the top panel. The three vertical lines (1, 2, and 3) in this panel show the position of the vertical line scans used to construct the time series shown in color below it. The direction of time in the vertical line series is left to right from 2:40 to 6:09 min. The intensity of the BODIPY-ceramide label was mapped to a color lookup table (upper right) with highest intensities labeled purple and lowest intensities orange. From these images it is evident that distinct BODIPY-ceramide–containing elements (purple) disassemble abruptly and with unique kinetics in cells treated with BFA.
Evidence that a Tension-driven Membrane Flow Drives Golgi Redistribution into the ER
The finding that BFA-treated Golgi membranes are rapidly delivered into the ER over a 30-s to 1-min time interval in a probabilistic manner and that microtubules increase the probability (but not the speed) of redistribution is consistent with blinkout being initiated by a single fusion event between a Golgi tubule and the ER, rather than by massive budding and fusion of vesicles. Redistribution of Golgi membrane under this model would occur by lateral membrane movement across the newly formed site of ER–Golgi continuity and then spreading of Golgi membrane across the ER. The unidirectionality of this process, with the entire Golgi body absorbed into the ER rather than the two compartments mixing while retaining their respective areas, indicates that free energy is lost upon Golgi membrane redistribution. This finding, together with the observation that lipid and protein move at identical rapid rates into the ER (despite the fact that lipid typically diffuses 10 times faster than protein) raises the question whether Golgi material moves into the ER diffusively or is carried by a tension-driven flow. The latter process is common in many continuous fluid systems having free energy differences. A typical example is the spreading of detergent on an air–water interface. In that case, a lateral tension gradient (force/area) arising from unequal concentration of detergent at the air–water interface causes a flow that spreads the detergent much faster than diffusion (Probstein, 1994).
To address whether tension-driven membrane flow contributes to the Golgi redistribution process required quantitative analysis of digitized images of the GFP-protein chimeras collected during blinkout. An effective diffusion constant D eff for the GFP-protein chimeras during the redistribution process can be calculated from such images (A). This D eff can then be compared with the D eff measured from photobleaching experiments of the same protein species in the ER when only diffusive transport is occurring. If flow into the ER were occurring during the redistribution process, then D eff for the spread of GFP-protein chimeras through the ER at blinkout should be greater than D eff measured during recovery after photobleaching performed with the chimera equilibrated within the ER (after long-term BFA treatment).
A method was developed for calculating D eff from photobleaching and Golgi redistribution experiments that accounts for the relative density and geometry of the ER in the actual cell being imaged. The mathematics and theory for this approach are discussed in A, and its application is outlined in Materials and Methods. It is instructive to contrast our methodology with the conventional method for determining D eff using FRAP. In FRAP, a narrow (∼2-μm) strip is rapidly bleached across a fluorescent sample, and fluorescence recovery into the strip is fit to an analytically derived function describing one- dimensional diffusion from an infinite medium into a hole. Here, we simulated the diffusive recovery of the optical intensity profile within the entire cell after photobleaching and made no assumptions about the shape and size of the bleached region or whether partial recovery occurred during the course of the bleach. The experimental image at any time point was evolved forward under the assumption that it was relaxing diffusively towards the prebleach intensity pattern. Assuming lateral diffusion alone is governing the fluorescence recovery in the experiment, a single D eff should describe all experimental regions of interest (ROIs) that are plotted from the experiment. This provides an immediate internal check on the quality of the algorithm used to simulate diffusive transport. During Golgi redistribution into the ER in BFA-treated cells, if fluorescence transfer was occurring by lateral diffusion then simulations using D eff obtained from photobleaching recovery experiments should reproduce it as well as for the photobleaching recovery experiment.
The above method was first used to calculate D eff from photobleach recovery experiments in cells with GFP-GalTase completely redistributed into the ER by BFA well after blinkout, where only diffusive transport should be occurring. To obtain a D eff for diffusional recovery in this experiment, theoretical curves were simulated assuming a diffusive process and matched to the experimental data by adjusting only the diffusion constant used in the simulation. As shown in Fig. 11 A, a single D eff (2.5 × 10⁻⁹ cm2/s ± 0.5) reasonably fit the experimental data for all ROIs in the cell shown, even though each ROI displayed a different recovery curve reflected by the density of ER in that region. This D eff fit experimental photobleaching data obtained from numerous cells using hundreds of different ROIs and was close to the same D eff measured previously for GFP-GalTase in the ER by conventional FRAP methods (e.g., 2.1 × 10⁻⁹cm2/s ± 0.2) (Cole et al., 1996a ). For comparison, simulated curves for the ROI in Fig. 11 A using D eff of 5 × 10⁻⁹cm2/s are shown as dashed lines in the graph. We have used this algorithm extensively to model diffusive recovery in another study and found good matches to diffusion coefficients generated using more traditional slit photobleaching approaches (Ellenberg et al., 1997).
Fig. 11 B shows a similar analysis after fluorescence redistribution into the ER of GFP-GalTase in the same cell as in Fig. 11 A at the time of Golgi blinkout. The time course of the redistribution was followed by plotting the intensity averages over several strategically placed ROIs. Shown on the same graph are curves from computer simulations using D eff of 2.5 × 10⁻⁹cm2/s or 5 × 10⁻⁹cm2/s, which start from the first time shown and model the redistribution as diffusion (see A). It is assumed that when the numerical integration begins, all the GFP marker is in contact with the ER and free to diffuse throughout this compartment. In contrast to the case for the photobleach recovery experiment above, the experimental data points from Golgi blinkout could not be described by a single D eff . Moreover, many of the ROIs examined had a latency period in relation to the simulated curves and a more sigmoidal rise, suggestive of a wave of material progressing outward as a flow rather than diffusive transport. This type of kinetic analysis of Golgi blinkout was performed on over 10 cells with similar results. Data from a cell expressing GFP-KDELR is shown in Fig. 11 C. The simulated D eff that best fit the experimental data to each ROI are indicated (despite each having a latency period and more sigmoidal rise compared with the simulated diffusion curves, though less than in Fig. 11 B). For the two ROIs to the right of the Golgi, D eff was slightly less than D eff measured in the photobleaching experiment for GFP-KDELR. For the ROIs below the Golgi, however, D eff was three to five times this value.
The disparity in diffusion constants needed to fit different ROIs in Golgi blinkout experiments was not explained by assuming delayed fusion of different regions of the Golgi complex with the ER. In Fig. 11 C, for example, one might assume that fusion between Golgi and ER first occurred at a tubule in the bottom of the figure, so as to be closer to the ROI that ostensibly required a large D eff, and further from those that were fit with a small D eff. However, under this scenario facilitated transport or flow would need to be invoked since it is impossible to drain the Golgi by diffusive transport through only a few tubules in a short time interval (see Discussion), while flow through one or a few tubules would do the job. Also, placing the release point low in the figure would increase the D eff determined for the upper ROI by a factor approximately four (the distance to be traveled is roughly doubled), thus making D eff again too large. The problems with a purely diffusive model would not be alleviated by supposing that other points of fusion occurred later since material definitely has moved between the first two images and the less time available for that to occur pushes the inferred D eff value upward. These results indicate that simple diffusive models cannot explain the rate Golgi membrane redistributes into the ER during BFA treatment (i.e., D eff are too high), whereas flow-assisted membrane transport processes can.
Discussion
Golgi Membrane Tubules
Ultrastructural studies have shown tubules (with diameters of 50–100 nm and variable length) to be an inherent feature of Golgi membranes. Both the cis- and trans-cisternae are composed of extensive tubule networks, and tubule bridges frequently connect different stacks or loop back to cisternae within the same stack (Tanaka et al., 1986; Rambourg and Clermont, 1990; Weidman et al., 1993). Moreover, circular profiles in stereopairs of thick specimens often correspond, not to vesicles, but to cross sections of numerous narrow tubules extending off from edges of Golgi cisternae (Clermont et al., 1995). What studies of fixed cells cannot reveal is the dynamic nature of these tubules, including how they arise (i.e., by vesicle-vesicle fusion, periplasmic fusion, or extension/detachment from cisternae [Rothman and Warren, 1994]), their lifetime, and their fate in vivo. The most striking feature of untreated Golgi membranes studied in living cells with GFP-tagged Golgi proteins was the continuous extension of membrane tubules from Golgi rims at rates on the order of 0.6 μm/s along microtubules, as well as their detachment. Such tubules are a prominent, ubiquitous feature of Golgi dynamics and appear to play a dual role both in interconnecting adjacent Golgi elements and in transporting membrane out from the Golgi in normal cells.
In the latter capacity, detached tubules containing GFP-Golgi proteins moved significant distances into the cell periphery before curling up and then often disappearing from view. This suggested they might have a carrier function in some membrane transport pathway. KDELR and GalTase are never transported to the cell surface but do recycle to the ER (Pelham, 1991; Cole et al., 1996b ), which exists as a peripheral membrane network throughout the cell (Terasaki et al., 1986). Assuming the GFP tag did not alter this property, Golgi tubules carrying these proteins to the cell periphery could represent retrograde transport intermediates. Since BFA augments but does not otherwise alter the morphological properties of Golgi tubules, our observations are consistent with the supposition that BFA treatment merely accentuates a normal constitutive membrane cycling pathway. Interestingly, GFP-KDELR was observed more often in the peripherally extending Golgi tubules than GFP-GalTase (data not shown), suggesting that KDELR recycles to the ER more frequently than GalTase.
The other function of tubules is to connect Golgi elements and thereby to facilitate the well-established capacity of the Golgi body to remodel itself. Such processes are likely to be important for Golgi reassembly after mitosis (Warren, 1993) and after removal of BFA (Lippincott-Schwartz et al., 1990) or other agents that lead to Golgi fragmentation. The high mobility of Golgi resident proteins within Golgi membranes revealed by photobleaching studies (Cole et al., 1996a ) enables resident components to diffuse quickly between stacks that have become interconnected by tubules and plausibly facilitates the amalgamation of Golgi elements.
Regulation of Tubule Formation
Given the dual roles of tubules in Golgi dynamics and their proliferation in response to BFA, what can be said about their regulation? To fabricate a tubule or vesicle from flat bilayer without an external force requires increasing the outer leaflet area at the expense of the inner one. Most directly this can occur by flipping lipids from inner to outer leaflets (Mui et al., 1995) or inserting new moieties into the outer leaflet (Fuchs et al., 1995). Alternatively, one can increase the effective area per head group in the outer leaflet by increasing the charge via phosphorylation, by cleaving one of the acyl chains by a phospholipase, by recruiting wedge-shaped lipids to the bud site, or merely via unequal electrostatic screening of the two leaflets (Chou et al., 1997). Since tubules proliferate in BFA-treated cells where peripheral “coat” proteins (including COP I proteins) are dissociated from Golgi membranes, such proteins may play an ancillary and perhaps a regulatory role rather than a structural one in tubulation. COP I proteins, for example, might act like cytosolic “receptors” for membrane-bound proteins that are recruited into the retrograde pathway (Pelham, 1994), and in so doing could couple with any one of the many mechanisms for inducing membrane curvature.
The extension of Golgi tubules appears to be a relatively simple process once the mechanism for supplying membrane curvature is at hand. Our results show that microtubules are required and that the membrane tubules move at speeds 0.6 μm/s towards the plus ends of microtubules. Thus, a kinesin-like motor is likely involved (Lippincott-Schwartz et al., 1995), and the mechanisms by which the tubule components of the ER are extended along microtubules (Dabora and Sheetz, 1988; Allan and Vale, 1994) provide a possible model for Golgi tubules. The motor proteins may simply guide the Golgi membrane extensions and overcome the resistance of cytoplasmic obstacles. An alternative possibility is that the microtubule motor force itself creates tubules from a free membrane with no preferred curvature. Given a bending modulus in the range of typical in vitro experiments of ∼10 times thermal and force of ∼4 pN appropriate to kinesin, radii of ∼50 nm are implied by the balance of forces (Dai and Sheetz, 1995; Sheetz and Dai, 1996). Arguing against this interpretation, however, are the appearance of tubules in the correct size range in in vitro experiments (Cluett et al., 1993) and the various biochemical means the cell has for the regulation of membrane curvature.
Tubulation in Response to BFA
An immediate target of BFA is ARF, which in physical terms is an energy-driven assembly-transport system for supplying COP I to membranes (Donaldson et al., 1992a ; Orci et al., 1993; Palmer et al., 1993; Rothman and Wieland, 1996). When nucleotide exchange onto ARF is inhibited by BFA, COP I proteins are quickly depleted from Golgi membranes (Donaldson and Klausner, 1994). In response, Golgi tubules proliferate, they are longer, and they do not so readily detach from the Golgi complex. Ultimately, fusion with the ER occurs and the Golgi disappears. Given this mechanism of BFA action, either the absence of COP I unblocks processes that cause leaflet area imbalance and hence tubules, or the tubulation is an autonomous downstream consequence of the perturbation in ARF cycling (for example, as a result of ARF's effect on phospholipase D metabolism [Brown et al., 1993; Cockroft et al., 1994; Ktistakis et al., 1996]). Both scenarios could impact protein sorting processes in the Golgi system.
If peripheral “coat” proteins served as a filter or aggregator to facilitate recycling of specific proteins, then there must be at least two populations of transport structures in untreated cells (for recycling components versus forward moving cargo), the contents of which would indiscriminately mix and distribute into tubules in the presence of BFA. Another function of such coat proteins suggested by BFA treatment is in promoting the detachment of tubules. This would be another way in which the integrity of the Golgi body is protected, by severing potential links to other organelles. Whether this property has any structural relation to the mechanism that promotes tubule formation remains to be seen.
Golgi Membrane Resorption into the ER
Golgi elements that were extensively interconnected by membrane tubules during the first 5 to 8 min of BFA treatment rapidly emptied protein and lipid into the ER in a process (called blinkout) usually lasting only 30 s. Golgi structures within a large population of cells were observed to undergo blinkout at distinct time points as in a first order or exponential process. This suggested that Golgi blinkout within individual cells was initiated by a single stochastic event, possibly fusion of a single Golgi tubule with the ER rather than multiple fusion events over an extended period.
The interval before blinkout was greatly increased (to between 10 to 50 min) when Golgi tubule extension was inhibited by depolymerization of microtubules by nocodazole. Once fusion between the ER and Golgi was initiated, however, redistribution still occurred as a very rapid process with Golgi protein and lipid emptying into the ER in less than one minute. This result indicates microtubules are not critical to the redistribution or blinkout phenomenon, although they increase its probability of occurrence, presumably by providing tracks for Golgi tubules to extend peripherally, where they have a greater chance of contacting the ER (which also extends peripherally along microtubules).
Since the blinkout process appeared identical whether viewed with a protein or lipid marker and in neither case was there any significant Golgi remnant structure, we infer that Golgi membranes were absorbed (i.e., moved unidirectionally) into the ER after ER–Golgi fusion, rather than that the two compartments merely mixed but retained their respective areas (see Fig. 12). Various estimates put the surface area of the Golgi at 20% of that of the ER system (Griffiths et al., 1989), so that if a significant fraction of Golgi structure remained intact after BFA-induced redistribution, a concentration of fluorescent material (representing 20% of total fluorescent signal) would still be visible in the Golgi region as material mixed uniformly throughout the ER–Golgi system. Since no such residual concentration of GFP fluorescence was found, the results suggest that the entire Golgi body is absorbed into the ER unidirectionally rather than mixing its membranes one-for-one with ER membranes and retaining its structural integrity. Consistent with this, ER markers in BFA-treated cells also showed no accumulation of fluorescent signal in the Golgi region (data not shown). In addition, recognizable Golgi stack–like structures in BFA-treated cells are not observed by electron microscopy (Fujiwara et al., 1988; Lippincott-Schwartz et al., 1989).
Figure 12.
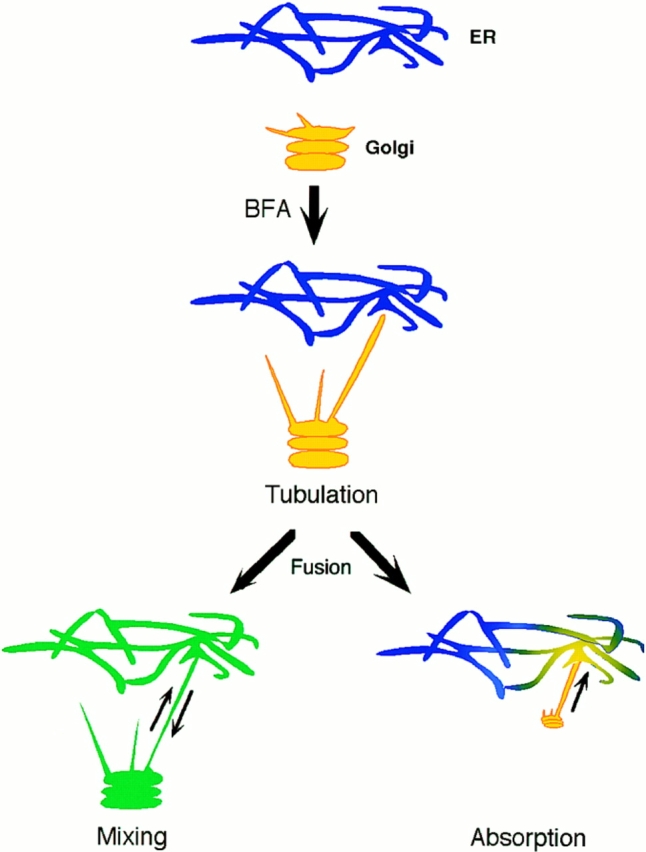
Mixing versus absorption models for Golgi membrane redistribution into the ER in BFA-treated cells. The Poissonian distributed Golgi lifetimes after addition of BFA (Figs. 7 and 8) suggests Golgi redistribution into the ER is initiated by a discrete event, possibly fusion of a single Golgi tubule with the ER. After fusion, redistribution could occur by diffusive mixing of Golgi and ER membranes (bottom left) or by unidirectional absorption of Golgi membrane into the ER (bottom right). Since no significant pool of Golgi lipid or protein remained localized to the Golgi area after Golgi blinkout, the absorption model is favored. Kinetic analysis of Golgi redistribution (Fig. 11) further revealed fluorescent transfer of Golgi protein into and across the ER was too fast to be explained by lateral diffusion within a bilayer and had the characteristics of membrane flow. This suggests Golgi membrane absorption into the ER in BFA-treated cells is mediated by a tension-driven membrane flow. Blue, ER membrane; yellow, Golgi membrane; green, mixed ER–Golgi membranes.
The unidirectionality of Golgi transfer into the ER and its irreversibility in BFA-treated cells suggested it is a thermodynamically favored process with free energy released. The simplest model for this is that the ER provides a lower energy environment for membrane protein and lipid than the Golgi system. The specific chemical basis for such an energy difference between ER and Golgi membranes is unknown. One possibility is that the work required to “pump” Golgi-destined material up in energy is supplied by the peripheral “coat” system, which concentrates membrane proteins exported from the ER and packages them into transport structures (Balch et al., 1994; Schekman and Orci, 1996). Such a system would also likely generate a specific lipid composition within these structures (Warren et al., 1975).
Tension-driven Membrane Flow from Golgi to ER
Given that there appears to be chemical potential or free energy differences between ER and Golgi membranes that lead to unidirectional transport when these membranes fuse upon BFA treatment, one can ask whether such transport occurs diffusively or is driven by a membrane tension flow. Free energy differences do not per se give rise to flow; a diffusion and sticking mechanism could also account for irreversible absorption of one compartment by another. Flow results from forces, which in the context of membranes are surface tension gradients (force/ area) (Probstein, 1994). One straightforward mechanism for establishing tension gradients is to remove material from membranes in one region and add it in another, as has been reported to occur at the plasma membrane (Dai and Sheetz, 1996). Chemical physics supplies a number of other situations involving multiple phases in contact such as wetting and spreading of a surfactant along an interface where flow-based transport exists and is more rapid than diffusion (de Gennes, 1985; Probstein, 1994).
Our evidence for tension-driven membrane flow in the ER–Golgi system is circumstantial; we have not directly measured a velocity for Golgi membrane transport into the ER. To favor a diffusive explanation as much as possible in our analysis of Golgi redistribution into the ER during BFA treatment, we assumed simultaneous connection of all parts of the Golgi to the ER. In one case (see Fig. 11 C), the fluorescence intensity of GalTase-GFP in various ROIs within the ER all started to rise at the same time during Golgi blinkout, but the D eff required to fit the overall rise varied by a factor of 10 among the ROIs and for the fastest was a factor of 4-5 times greater than the diffusion constant measured by FRAP. One might argue that in this case it was the lipid diffusion constant (plausibly 5–10 times larger than the GFP-KDELR value of 4.5 × 10⁻⁹cm2/s) that governed the blinkout time, and that the fluorescent protein was swept along. In another case (see Fig. 11 B), however, D eff was not so great. The experimental data in this case could not be fit well by simple diffusion since it had a latency period followed by a sigmoidal rise in intensity values resembling that of a wave or front of fluorescent material moving across the ER. Such a sigmoidal profile would be expected from flow-assisted transport. The complex geometry of the ER was not responsible for these unusual time courses since our methodology (see A) was able to quantitatively simulate photobleach recovery in the same cells and obtain the same diffusion constants that were measured previously by FRAP (Cole et al., 1996a ).
If one speculates about how connections are made between the Golgi and ER at the time of Golgi blinkout, there are circumstances where diffusion may be ruled out on purely theoretical grounds (see B). Consider two organelles connected by a single tubule of diameter, d = 0.1 μm, and length, L = 3 μm, which drains a Golgi area of A = 100 μm2. Assume Golgi proteins diffuse down the tube with a diffusion constant of 1 μm2/s (Cole et al., 1996a ). To favor diffusion as much as possible assume the concentration is 1 (arbitrary units per area) on the Golgi end of the tube and 0 on the ER side, and that the ER is perfectly absorbing and redistribution within it is instantaneous. Then the time to empty the Golgi of its material would be A × L/ D × π × d, or 1,000 s. By contrast, a flow velocity of v = 10 μm/s could accomplish the transfer via one tube in a time of A/(vπd) = 30 s, irrespective of length (see B).
While this velocity is very high in comparison to molecular motors, it is modest on the scale of what surface tension–driven flows can produce. To explain by analogy what may occur within the Golgi–ER system, we can imagine a situation where flow generated in the course of mixing contributes to the mixing process itself. Consider an interface (e.g., oil–water or water–air) with a nonuniform concentration of surfactant. The interfacial tension depends on the surfactant concentration point by point, so it too is nonuniform, and its spatial gradient generates a force per area at the interface. A bulk flow ensues that transports the surfactant. Diffusion still occurs, but it may be overwhelmed by the flow-induced transport.
For the ER–Golgi system, the role of “surfactant” could be played by specific lipids (i.e., cholesterol) from the Golgi interacting with the tails of ER lipids. Alternatively, the Golgi lipid head groups could lower the energy of the ER– cytoplasm or ER–lumen interface, or the Golgi proteins might fulfill either role. Tension differences of order 0.1 to 1 times the thermal energy (kBT) per surfactant would generate velocities of several microns per second (see B). Membrane flows of this type are either recirculating or must entail an increase in area somewhere since the lipids are incompressible. Thus, we have to imagine that the ER swells to accommodate the Golgi membrane or new ER tubules or cisternae are created. In either case, the mechanical energy generated by the tension difference has to supply the necessary work.
The tension in the ER system, alternatively, could be due to the action of microtubule motors (i.e., kinesin), which extend the ER peripherally, while the Golgi membranes are flaccid. The insensitivity of the Golgi blinkout kinetics to nocodazole and the 10–100-fold lower values of mechanically induced tension deduced from the kinesin force compared to plausible chemically induced tensions, however, lead us to favor a chemical rather than mechanical basis for tension in the ER system. The mechanical tension is f/(4πr), where f is the microtubule motor force and r is the tubule radius (Sheetz and Dai, 1996).
In conclusion, the similarity in the time of Golgi blinkout when imaging either protein or lipid plus the wavelike propagation of Golgi material in the ER argue against diffusive transport and suggest flow-based membrane transport within the ER–Golgi system in BFA-treated cells. Tension-driven membrane flow within biological membranes is a new concept (Sheetz and Dai, 1996), but if one views membrane-bound organelles as lipid solvents with dissolved or meshlike protein at different free energy states, then flows might be the norm and not the exception when different compartments become connected via tubules. Tubule formation and detachment from organelles would thus need to be tightly regulated to modulate such velocity-based transport pathways and thereby to maintain organelle integrity. It remains to be elucidated how organelles generate membrane-associated free energy differences (Do energy-driven peripheral coat proteins which concentrate and sort protein and lipid play a role?) and whether such free energy differences are harnessed by cells to drive organelle disassembly.
Acknowledgments
We thank G. Warren and N. Nakamara (Imperial Cancer Research Fund, UK) for kindly providing antibodies to GM130. We also thank J. Bonifacino, J. Donaldson, K. Hirschberg, J. Ellenberg (NICHID, NIH, Bethesda, MD), and Paul Melancon (University of Alberta, Edmonton, AB) for critical review of the manuscript and Michael Sheetz (Duke University, Chapel Hill, NC) and Josh Zimmerberg (NICHD, NIH, Bethesda, MD) for valuable discussions. We also thank T. Lubensky for an alternative derivation of A2.
Appendix A
Diffusion in a Heterogeneous Environment
We want to relate the diffusion constant, D eff, we measured experimentally for spreading of fluorescent protein through the tubular and cisternal components of the ER to its ideal value D 0, appropriate to a planar bilayer viewed normally. To do so, we assume the ER is a random mesh of tubes of average radius r and average length between connections of L ≫ r. Their orientation is random in either a plane or a volume, and their average density is spacially nonuniform. The tubes are treated as one-dimensional objects because material introduced at one corner becomes uniform circumferentially in a time much less than the diffusion time to the next node. We can therefore use D 0 to describe diffusion along an individual tube.
Let there be some mean gradient g⃗ in the density averaged on scales ≫ L, then D eff is defined by
 |
A1 |
If we assume the ER is isotropic, D eff is a scalar and not a matrix. For a tube making some angle θ with respect to g⃗, the concentration gradient along the tube is reduced to g cos θ and the flux along the tube is D 0 g cos θ. The projection of that flux along g⃗ again (to get the flux needed in A1 is reduced by another factor of cos θ. The average of cos 2 θ over a sphere (d = 3) is 1/3 or over a circle (d = 2) is 1/2. Hence,
 |
A2 |
To address the problem of inhomogeneity, we assume the variation in both the thickness of the cell or the volume density of tubes is slow on a scale of L, so we can use D
eff. To determine the flux, g⃗, in this inhomogeneous system we let  be the average density of the ER, defined by the signal a long time after redistribution of fluorescence from the Golgi and just before photobleach. The flux of material is no longer proportional to the density gradient ∇ρ but rather the gradient of the density measured relative to
  , the fractional filling. Thus,
 |
A3 |
The flux is zero when ρ is a fixed fraction of ρ and when  is uniform, it disappears from A3 and we obtain the conventional equation for flux interms of the density gradient.
The image manipulations after the data was recorded on disk, and all calculations required for the fitting were done with programs written in FORTRAN or C expressly for this purpose. To simulate Eq. A3, the equation was approximated by a discrete difference equation (second order accurate, three point differences in both directions; Press et al., 1992). The approximate equation conserved the total intensity exactly. The time stepping was done with the simplest first order accurate explicit scheme. This did not compromise our results because the experimental points involved intensity averages over 10 or more pixels in each direction to reduce instrumental noise and the effects of random movements inside the cell. Our computed values did not change to two figure accuracy when the time step was decreased by a factor of two or four. To accelerate the time stepping after enough evolution had occured, we would coarsen the mesh.
The reference density  was sometimes blurred to eliminate instrumental noise which on the confocal images could amount to ±10% of the total 8-bit range from pixel to pixel. The experimental image was sometimes cropped so as to retain only the cell interest.
The origin of time in the simulations is defined by the image we started from, but the unit is not known until D eff is determined. To fix it, the experimental and numerical data were averaged over identical regions of interest at each time point. The time axis for all the numerical curves was then scaled to optimally match the experiment and D eff read off.
Appendix B
Tension Driven Flow
Little is known about the basic physical-chemical parameters of the Golgi–ER membrane system other than that the Golgi is adsorbed into the ER rather than the reverse. Thus, the ER provides a lower (free) energy environment for the Golgi contents. To estimate the velocities that could be produced during Golgi redistribution into the ER, we suppose the free energy difference, or tension if expressed in energy/area of membrane, is of order αl T per Golgi lipid where αl ≈ 1 and T is the thermal energy 4 × 10⁻¹⁴ ergs. It is immaterial precisely which constituents of the Golgi–ER system are responsible for the tension difference.
Our model for Golgi adsorption is by analogy with a surfactant (Golgi) that modulates the tension of an interface (the ER). A lateral tension gradient produces a force and hence a flow. An estimate for the averaged flow velocity  proceeds the same way for any tension-driven flow, namely the energy per time provided by the tension difference is balanced by the viscous dissipation set up by the flow. Any back pressure that has to be overcome to add extra lipid to the ER has to be subtracted from the energy available from the tension.
To model the dissipation, we assume some fraction of the ER proteins form a rigid matrix through which the lipids and remaining proteins flow. (If instead the ER membranes were entirely mobile  would increase because of the reduced dissipation from whatever larger scale matrix limits the flow.) The diffusion constant D
p of a protein in an ideal bilayer is several times 10−9 cm2/s. We can invert the Einstein relation that relates D
p to the force on an anchored protein when the bilayer flows by at
  as
as
 |
B1 |
Assume there are n
p proteins/area anchored inside a tube of length l and diameter d down which the lipids move with velocity  . The energy dissipated per time per protein is f
p
 and the total dissipation is
 |
B2 |
The energy per time available from introducing new material is P
l = α
l
T  n
l πd, where n
l is the number of lipids/area. Solving P
diss = P
l for
  gives
gives
 |
B3 |
taking αl ≈ 1, D p ≈ 10−9cm2/s, n l/n p ≈ 102, L ≈ 1μ. The flow dissipation in a three-dimensional mesh or network comes predominantly from the region around the inlet (i.e., the distance to the first branch point), so L was approximated as the spacing between branch points in the ER.
An alternative estimate for P diss models the ER as a two dimensional film flowing through an array of obstacles with spacing δ for which D'arcy's law reads (Batchelor, 1967)
 |
B4 |
where σ is the tension or energy/area whose gradient ∇σ is the force/area. The constant μ can be evaluated by assuming that the viscous stresses induced by the obstacles is equivalent to flow in a two-dimensional channel of width δ, i.e., μ = 12 v
l ρl/δ2, where v
l ≈ 1 cm2/s is the kinematic viscosity of the lipid (Bloom et al., 1991) and ρl the mass/ area of film. The numerical factor comes largely from converting the parabolic velocity profile in the channel v(y) into  via
via

The force/area can be converted into a dissipation as in (B2) by multiplying by L and the area/time as in (B2). Thus,
 |
B5 |
and equating to P l yields
 |
B6 |
using δ ≈ 5 nm and other numbers as before.
Our estimates so far merely place an upper bound on  since they assume all the energy in the surface tension difference is available to drive the flow, i.e., there are no dissipative losses other than those attributable to
  . In reality, whatever components are responsible for the tension difference can mix by diffusion and “short out” the potential responsible for the flow. Given the velocities we are finding, the Golgi material will have to spread quite far into the ER before intrinsic diffusion becomes competitive with flow.
Footnotes
1. Abbreviations used in this paper: ARF, ADP-ribosylation factor; BFA, brefeldin A; FRAP, fluorescence recovery after photobleaching; GFP, green fluorescent protein; NEM, N-ethylmaleimide; ROI, region of interest.
Address all correspondence to Jennifer Lippincott-Schwartz, Cell Biology and Metabolism Branch, NICHD, NIH, Building 18T, Room 101, Bethesda, MD 20892. Tel.: (301) 496-6368. Fax: (301) 402-0078.
Noah Sciaky's current address is Department of Pediatrics, National Jewish Center, Denver, Colorado.
References
- Antony C, Cibert C, Geraud G, Santa A, Maria, Maro B, Mayau V, Goud B. The small GTP-binding protein rab6p is distributed from medial Golgi to the trans-Golgi network as determined by a confocal microscopic approach. J Cell Sci. 1992;103:785–796. doi: 10.1242/jcs.103.3.785. [DOI] [PubMed] [Google Scholar]
- Allan V, Vale R. Movement of membrane tubules along microtubules in vitro: evidence for specialized sites of motor attachment. J Cell Sci. 1994;107:1885–1897. doi: 10.1242/jcs.107.7.1885. [DOI] [PubMed] [Google Scholar]
- Balch WE, McCafferey JM, Plutner H, Farquhar MG. Vesicular stomatitis virus glycoprotein is sorted and concentrated during export from the endoplasmic reticulum. Cell. 1994;76:841–852. doi: 10.1016/0092-8674(94)90359-x. [DOI] [PubMed] [Google Scholar]
- Banta M, Polizotto RS, Wood SA, de Figueiredo P, Brown WJ. Characterization of a cytosolic activity that induces the formation of Golgi membrane tubules in a cell-free reconstitution system. Biochemistry. 1995;34:13359–13366. doi: 10.1021/bi00041a012. [DOI] [PubMed] [Google Scholar]
- Batchelor, G.K. 1967. An Introduction to Fluid Mechanics. Cambridge University Press, Cambridge, UK. 615 pp.
- Berger EG, Thurnker M, Muller U. Galactosyltransferase and sialyltransferase are located in different subcellular compartments in HeLa cells. Exp Cell Res. 1987;173:267–273. doi: 10.1016/0014-4827(87)90352-1. [DOI] [PubMed] [Google Scholar]
- Bloom M, Evans E, Mouritsen OG. Physical properties of the fluid lipid-bilayer component of cell membranes: a perspective. Quart Rev Biophysics. 1991;24:293–397. doi: 10.1017/s0033583500003735. [DOI] [PubMed] [Google Scholar]
- Brown A, Gutowski S, Moomaw CR, Slaughter C, Sternweis PC. ADP-ribosylation factor, a small GTP-dependent regulatory protein, stimulates phospholipase D activity. Cell. 1993;75:1137–1144. doi: 10.1016/0092-8674(93)90323-i. [DOI] [PubMed] [Google Scholar]
- Chou T, Jaric MV, Siggia ED. Electrostatics of bilayer bending. Biophysics J. 1997;72:2042–2055. doi: 10.1016/S0006-3495(97)78848-9. [DOI] [PMC free article] [PubMed] [Google Scholar]
- Clermont Y, Rambourg A, Hermo L. Trans-Golgi network (TGN) of different cell types: three-dimensional structural characteristics and variability. Anat Rec. 1995;242:289–301. doi: 10.1002/ar.1092420302. [DOI] [PubMed] [Google Scholar]
- Cluett EB, Wood SA, Banta M, Brown WJ. Tubulation of Golgi membranes in vivo and in vitro in the absence of brefeldin A. J Cell Biol. 1993;120:15–24. doi: 10.1083/jcb.120.1.15. [DOI] [PMC free article] [PubMed] [Google Scholar]
- Cockcroft S, Thomas GM, Fensome A, Geny B, Cunningham E, Gout I, Hiles I, Totty NF, Trung O, Hsuan JJ. Phospholipase D: a downstream effector effector of ARF in granulocytes. Science. 1994;263:523–526. doi: 10.1126/science.8290961. [DOI] [PubMed] [Google Scholar]
- Cole NB, Smith CL, Sciaky N, Terasaki M, Edidin M, Lippincott-Schwartz J. Diffusional mobility of Golgi proteins in membranes of living cells. Science. 1996a;272:797–801. doi: 10.1126/science.273.5276.797. [DOI] [PubMed] [Google Scholar]
- Cole NB, Sciaky N, Marotta A, Song J, Lippincott-Schwartz J. Golgi dispersal during microtubule disruption: regeneration of Golgi stacks of peripheral endoplasmic reticulum exit sites. Mol Biol Cell. 1996b;7:631–650. doi: 10.1091/mbc.7.4.631. [DOI] [PMC free article] [PubMed] [Google Scholar]
- Cooper MS, Cornell-Bell AH, Chernjavsly A, Dani JW, Smith SJ. Tubulovesicular processes emerge from trans-Golgi cisternae, extend along microtubules and interlink adjacent trans-Golgi elements into a reticulum. Cell. 1990;61:135–145. doi: 10.1016/0092-8674(90)90221-y. [DOI] [PubMed] [Google Scholar]
- Dabora SL, Sheetz MP. The microtubule-dependent formation of a tubulovesicular network with characteristics of the ER from cell extracts. Cell. 1988;54:27–35. doi: 10.1016/0092-8674(88)90176-6. [DOI] [PubMed] [Google Scholar]
- Dai J, Sheetz MP. Axon membrane flows from the growth cone to the cell body. Cell. 1995;83:693–701. doi: 10.1016/0092-8674(95)90182-5. [DOI] [PubMed] [Google Scholar]
- de Figueiredo P, Brown WJ. A role for calmodulin in organelle membrane tubulation. Mol Biol Cell. 1995;6:871–887. doi: 10.1091/mbc.6.7.871. [DOI] [PMC free article] [PubMed] [Google Scholar]
- de Gennes PG. Wetting: statics and dynamics. Rev Modern Phys. 1985;57:827–863. [Google Scholar]
- Doms RW, Russ G, Yewdell J W. Brefeldin A redistributes resident and itinerant Golgi proteins to the endoplasmic reticulum. J Cell Biol. 1989;109:61–72. doi: 10.1083/jcb.109.1.61. [DOI] [PMC free article] [PubMed] [Google Scholar]
- Donaldson JG, Klausner RD. ARF: a key regulatory switch in membrane traffic and organelle structure. Curr Opin Cell Biol. 1994;6:527–532. doi: 10.1016/0955-0674(94)90072-8. [DOI] [PubMed] [Google Scholar]
- Donaldson J, Kahn RA, Lippincott-Schwartz J, Klausner RD. Binding of ARF and β-COP to Golgi membranes: possible regulation by a trimeric G protein. Science. 1991;254:1197–1199. doi: 10.1126/science.1957170. [DOI] [PubMed] [Google Scholar]
- Donaldson J, Lippincott-Schwartz J, Klausner RD. Guanine nucleotides modulates the effects of brefeldin A in semipermeable cells: regulation of the association of 110-kD peripheral membrane proteins with the Golgi apparatus. J Cell Biol. 1991;112:579–588. doi: 10.1083/jcb.112.4.579. [DOI] [PMC free article] [PubMed] [Google Scholar]
- Donaldson JG, Cassel D, Kahn RA, Klausner RD. ADP-ribosylation factor, a small GTP-binding protein, is required for binding of the coatomer protein βCOP to Golgi membranes. Proc Natl Acad Sci USA. 1992a;89:6408–6412. doi: 10.1073/pnas.89.14.6408. [DOI] [PMC free article] [PubMed] [Google Scholar]
- Donaldson JG, Finazzi D, Klausner RD. Brefeldin A inhibits Golgi membrane-catalyzed exchange of guanine nucleotide onto ARF protein. Nature. 1992b;360:350–352. doi: 10.1038/360350a0. [DOI] [PubMed] [Google Scholar]
- Ellenberg J, Siggia ED, Moreira JE, Smith CL, Presley JF, Worman H, Lippincott-Schwartz J. Nuclear membrane dynamics and reassembly in living cells: targeting of an inner nuclear membrane protein in interphase and mitosis. JCell Biol. 1997;139:1193–1206. doi: 10.1083/jcb.138.6.1193. [DOI] [PMC free article] [PubMed] [Google Scholar]
- Finkelstein, A. 1987. Water Movement through Lipid Bilayers, Pores, and Plasma Membranes: Theory and Reality. John Wiley and Sons, New York.
- Fuchs H, Gessner R, Tauber R, Ghosh R. Functional reconstitution of the human placental transferrin receptor into phospholipid bilayers leads to long tubular structures proceeding from the vesicle surface. Biochemistry. 1995;34:6196–6207. doi: 10.1021/bi00018a024. [DOI] [PubMed] [Google Scholar]
- Fujiwara T, Oda K, Yokota S, Takatsuki A, Ikehara Y. Brefeldin A causes disassembly of the Golgi complex and accumulation of secretory proteins in the endoplasmic reticulum. J Biol Chem. 1988;263:18545–18552. [PubMed] [Google Scholar]
- Griffiths G, Fuller SD, Hollinshead M, Pfeiffer S, Simons K. The dynamic nature of the Golgi complex. J Cell Biol. 1989;108:277–297. doi: 10.1083/jcb.108.2.277. [DOI] [PMC free article] [PubMed] [Google Scholar]
- Heim R, Cubitt AB, Tsien RY. Improved green fluorescence. Nature. 1995;373:663–664. doi: 10.1038/373663b0. [DOI] [PubMed] [Google Scholar]
- Helms JB, Rothman JE. Inhibition by brefeldin A of a Golgi membrane enzyme that catalyses exchange of guanine nucleotide bound to ARF. Nature. 1992;360:352–354. doi: 10.1038/360352a0. [DOI] [PubMed] [Google Scholar]
- Hsu VW, Shah N, Klausner RD. A brefeldin A-like phenotype is induced by the overexpression of a human ERD-2-like protein, ELP-1. Cell. 1992;69:625–635. doi: 10.1016/0092-8674(92)90226-3. [DOI] [PMC free article] [PubMed] [Google Scholar]
- Jackson MR, Nilsson T, Peterson PA. Retrieval of transmembrane proteins to the endoplasmic reticulum. J Cell Biol. 1993;121:317–333. doi: 10.1083/jcb.121.2.317. [DOI] [PMC free article] [PubMed] [Google Scholar]
- Klausner RD, Donaldson JG, Lippincott-Schwartz J. Brefeldin A: insights into the control of membrane traffic and organelle structure. J Cell Biol. 1992;116:1071–1080. doi: 10.1083/jcb.116.5.1071. [DOI] [PMC free article] [PubMed] [Google Scholar]
- Ktistakis NT, Brown HA, Waters MG, Sternweis P C, Roth MG. Evidence that phospholipase D mediates ADP ribosylation factor– dependent formation of Golgi coated vesicles. J Cell Biol. 1996;134:295–306. doi: 10.1083/jcb.134.2.295. [DOI] [PMC free article] [PubMed] [Google Scholar]
- Ladinsky MS, Kremer JR, Furcinitti PS, McIntosh JR, Howell KE. HVEM tomography of the trans-Golgi network: structural insights and identification of a lace–like vesicle coat. J Cell Biol. 1994;127:29–38. doi: 10.1083/jcb.127.1.29. [DOI] [PMC free article] [PubMed] [Google Scholar]
- Lewis MJ, Pelham HR. Ligand-induced redistribution of a human KDEL receptor from the Golgi complex to the endoplasmic reticulum. Cell. 1992;68:353–364. doi: 10.1016/0092-8674(92)90476-s. [DOI] [PubMed] [Google Scholar]
- Liou W, Geuze HJ, Slot JW. Improving structural integrity of cryosections for immunogold labeling. Histochem Cell Biol. 1996;106:41–58. doi: 10.1007/BF02473201. [DOI] [PubMed] [Google Scholar]
- Lippincott-Schwartz J. Bidirectional membrane traffic between the endoplasmic reticulum and Golgi apparatus. Trends Cell Biol. 1993;3:81–88. doi: 10.1016/0962-8924(93)90078-f. [DOI] [PubMed] [Google Scholar]
- Lippincott-Schwartz J, Yuan LC, Bonifacino JS, Klausner RD. Rapid redistribution of Golgi proteins into the endoplasmic reticulum in cells treated with brefeldin A: evidence for membrane cycling from Golgi to ER. Cell. 1989;56:801–813. doi: 10.1016/0092-8674(89)90685-5. [DOI] [PMC free article] [PubMed] [Google Scholar]
- Lippincott-Schwartz J, Donaldson JG, Schweizer A, Berger EG, Hauri HP, Yuan LC, Klausner RD. Microtubule-dependent retrograde transport of proteins into the ER in the presence of brefeldin A suggests an ER recycling pathway. Cell. 1990;60:821–836. doi: 10.1016/0092-8674(90)90096-w. [DOI] [PubMed] [Google Scholar]
- Lippincott-Schwartz J, Yuan LC, Tipper C, Amherdt M, Orci L, Klausner RD. Brefeldin A's effects on endosomes, lysosomes and TGN suggest a general mechanism for regulating organelle structure and membrane traffic. Cell. 1991;67:601–616. doi: 10.1016/0092-8674(91)90534-6. [DOI] [PubMed] [Google Scholar]
- Lippincott-Schwartz J, Cole NB, Marotta A, Conrad PA, Bloom GS. Kinesin is the motor for microtubule-mediated Golgi-to-ER membrane traffic. J Cell Biol. 1995;128:293–306. doi: 10.1083/jcb.128.3.293. [DOI] [PMC free article] [PubMed] [Google Scholar]
- Lipsky NG, Pagano RE. A vital stain for the Golgi apparatus. Science (Wash DC) 1987;228:745–747. doi: 10.1126/science.2581316. [DOI] [PubMed] [Google Scholar]
- Mellman I, Simons K. The Golgi complex: in vitro veritas? . Cell. 1992;68:829–840. doi: 10.1016/0092-8674(92)90027-A. [DOI] [PMC free article] [PubMed] [Google Scholar]
- Mui BL, Dobereiner HG, Madden TD, Cullis PR. Influence of transbilayer area asymmetry on the morphology of large unilamellar vesicles. Biophys J. 1995;69:930–941. doi: 10.1016/S0006-3495(95)79967-2. [DOI] [PMC free article] [PubMed] [Google Scholar]
- Nilsson T, Pypaert M, Hoe MH, Slusarewics P, Berger EG, Warren G. Overlapping distribution of two glycosyltransferases in the Golgi apparatus of HeLa cells. J Cell Biol. 1993;120:5–13. doi: 10.1083/jcb.120.1.5. [DOI] [PMC free article] [PubMed] [Google Scholar]
- Orci L, Tagaya M, Amherdt M, Perrelet A, Donaldson JG, Lippincott-Schwartz J, Klausner RD, Rothman JE. Brefeldin A, a drug that blocks secretion, prevents the assembly of non-clathrin coated buds on Golgi cisternae. Cell. 1991;64:1183–1195. doi: 10.1016/0092-8674(91)90273-2. [DOI] [PubMed] [Google Scholar]
- Orci L, Palmer DJ, Amherdt M, Rothman JE. De novo assembly of coated vesicles from Golgi cisternae requires only coatomer and ARF proteins from the cytosol. Nature. 1993;364:732–734. doi: 10.1038/364732a0. [DOI] [PubMed] [Google Scholar]
- Pagano RE, Sepanski MA, Martin OC. Molecular trapping of a fluorescent ceramide analogue at the Golgi apparatus of fixed cells: interaction with endogenous lipids provides a trans-Golgi marker for both light and electron microscopy. J Cell Biol. 1989;109:2067–2079. doi: 10.1083/jcb.109.5.2067. [DOI] [PMC free article] [PubMed] [Google Scholar]
- Pagano RE, Martin OC, Kang HC, Haugland RP. A novel fluorescent ceramide analogue for studying membrane traffic in animal cells: accumulation at the Golgi apparatus results in altered spectral properties of the sphingolipid precursor. J Cell Biol. 1991;113:1267–1279. doi: 10.1083/jcb.113.6.1267. [DOI] [PMC free article] [PubMed] [Google Scholar]
- Palmer DJ, Helms JB, Beckers CJM, Orci L, Rothman JE. Binding of coatomer to Golgi membranes requires ADP-ribosylation factor. J Biol Chem. 1993;268:12083–12089. [PubMed] [Google Scholar]
- Pelham HR. Recycling of proteins between the endoplasmic reticulum and Golgi complex. Curr Opin Cell Biol. 1991;3:585–591. doi: 10.1016/0955-0674(91)90027-v. [DOI] [PubMed] [Google Scholar]
- Pelham HRB. About turn for the COPs? . Cell. 1994;79:1125–1127. doi: 10.1016/0092-8674(94)90002-7. [DOI] [PubMed] [Google Scholar]
- Probstein, R.F. 1994. Physiochemical Hydrodynamics. Second Edition. John Wiley and Sons, New York. 338–357.
- Press, W.H., S.A. Teukolsky, W.T. Vetterling, and B.P. Flannery. 1992. Numerical Recipes in C (2nd Ed.). Cambridge University Press, Cambridge, UK. 994 pp.
- Rambourg A, Clermont Y. Three-dimensional electron microscopy: structure of the Golgi apparatus. Eur J Cell Biol. 1990;51:189–200. [PubMed] [Google Scholar]
- Rambourg A, Clermont Y, Hermo L. Three-dimensional architecture of the Golgi apparatus in Sertoli cells of the rat. Am J Anat. 1979;154:455–476. doi: 10.1002/aja.1001540402. [DOI] [PubMed] [Google Scholar]
- Rothman JE, Warren G. Implications of the SNARE hypothesis for intracellular membrane topology and dynamics. Curr Biol. 1994;4:220–233. doi: 10.1016/s0960-9822(00)00051-8. [DOI] [PubMed] [Google Scholar]
- Rothman JE, Wieland FT. Protein sorting by transport vesicles. Science. 1996;272:227–234. doi: 10.1126/science.272.5259.227. [DOI] [PubMed] [Google Scholar]
- Sackman E. Membrane bending energy concept of vesicle- and cell-shapes and shape-transitions. FEBS Lett. 1994;346:3–16. doi: 10.1016/0014-5793(94)00484-6. [DOI] [PubMed] [Google Scholar]
- Saraste J, Kuismanen E. Pathways of protein sorting and membrane traffic between the rough endoplasmic reticulum and the Golgi complex. Semin Cell Biol. 1992;3:343–355. doi: 10.1016/1043-4682(92)90020-V. [DOI] [PMC free article] [PubMed] [Google Scholar]
- Saraste J, Svensson K. Distribution of the intermediate elements operating in ER to Golgi transport. J Cell Sci. 1991;100:415–430. doi: 10.1242/jcs.100.3.415. [DOI] [PubMed] [Google Scholar]
- Sasaki T, Motegi N, Higashi S. Morphological analysis of the Golgi apparatus in rat amelogenesis as revealed by the Ur-Pb-Cu block staining method and freeze fracture replication. J Electron Microsc. 1984;33:19–33. [PubMed] [Google Scholar]
- Sesso A, de Faria FP, Iwamura ESM, Correa H. A three-dimensional reconstruction study of the rough ER-Golgi interface in serial thin sections of the pancreatic acinar cell of the rat. J Cell Sci. 1994;107:517–528. [PubMed] [Google Scholar]
- Schekman R, Orci L. Coat proteins and vesicle budding. Science. 1996;271:1526–1533. doi: 10.1126/science.271.5255.1526. [DOI] [PubMed] [Google Scholar]
- Sheetz MP, Dai J. Modulation of membrane dynamics and cell motility by membrane tension. Trends Cell Biol. 1996;6:85–89. doi: 10.1016/0962-8924(96)80993-7. [DOI] [PubMed] [Google Scholar]
- Shima DT, Haldar K, Pepperkok R, Watson R, Warren G. Partitioning of the Golgi apparatus during mitosis in living HeLa cells. J Cell Biol. 1997;137:1211–1228. doi: 10.1083/jcb.137.6.1211. [DOI] [PMC free article] [PubMed] [Google Scholar]
- Stinchcombe JC, Nomoto H, Cutler DF, Hopkins CR. Anterograde and retrograde traffic between the rough endoplasmic reticulum and the Golgi complex. J Cell Biol. 1995;131:1387–1401. doi: 10.1083/jcb.131.6.1387. [DOI] [PMC free article] [PubMed] [Google Scholar]
- Tanaka K, Mitsushima A, Fukudome H, Kashima Y. Three- dimensional architecture of the Golgi complex observed by high resolution scanning electron microscopy. J Submicrosc Cytol. 1986;18:1–9. [PubMed] [Google Scholar]
- Tang BL, Wong SH, Qi X, Low SH, Hong W. Molecular cloning, characterization, subcellular localization, and dynamics of p23, the mammalian KDEL receptor. J Cell Biol. 1993;120:325–338. doi: 10.1083/jcb.120.2.325. [DOI] [PMC free article] [PubMed] [Google Scholar]
- Terasaki M, Chen LB, Fujiwara K. Microtubules and the endoplasmic reticulum are highly interdependent structures. J Cell Biol. 1986;103:1557–1568. doi: 10.1083/jcb.103.4.1557. [DOI] [PMC free article] [PubMed] [Google Scholar]
- Vale RD, Hotani H. Formation of membrane networks in vitro by kinesin-driven microtubule movement. J Cell Biol. 1988;107:2233–2241. doi: 10.1083/jcb.107.6.2233. [DOI] [PMC free article] [PubMed] [Google Scholar]
- Vale RD, Reese TS, Sheetz MS. Identification of a novel force-generating protein, kinesin, involved in microtubule-based motility. Cell. 1985;42:39–50. doi: 10.1016/s0092-8674(85)80099-4. [DOI] [PMC free article] [PubMed] [Google Scholar]
- Warren G. Membrane partitioning during cell division. Annu Rev Biochem. 1993;62:323–348. doi: 10.1146/annurev.bi.62.070193.001543. [DOI] [PubMed] [Google Scholar]
- Warren GB, Houslay MD, Birdsall NJM, Metcalfe JC. Cholesterol is selectively excluded from the phospholipid annulus surrounding an active calcium transport protein. Nature. 1975;255:684–687. doi: 10.1038/255684a0. [DOI] [PubMed] [Google Scholar]
- Weidman P, Roth R, Heuser J. Golgi membrane dynamics imaged by freeze-etch electron microscopy: views of different membrane coatings involved in tubulation versus vesiculation. Cell. 1993;75:123–133. [PubMed] [Google Scholar]


