

Abstract
Directed fusion of transmitter-laden vesicles enables rapid intercellular signaling in the central nervous system and occurs at synapses within gray matter. Here we show that action potentials also induce the release of glutamate from axons in the corpus callosum, a white matter region responsible for interhemispheric communication. Callosal axons release glutamate by vesicular fusion, which induces quantal AMPA receptor–mediated currents in NG2+ glial progenitors at anatomically distinct axo–glial synaptic junctions. Glutamate release from axons was facilitated by repetitive stimulation and could be inhibited through activation of metabotropic autoreceptors. Although NG2+ cells form associations with nodes of Ranvier in white matter, measurements of conduction velocity indicated that unmyelinated fibers are responsible for glutamatergic signaling with NG2+ glia. This activity-dependent secretion of glutamate was prevalent in the developing and mature mouse corpus callosum, indicating that axons within white matter both conduct action potentials and engage in rapid neuron-glia communication.
The white matter of the CNS contains axons that permit functional interactions among specialized brain regions. The prevailing view is that these axons blindly transmit electrical activity through the white matter to be translated into the release of chemical messengers at synapses in gray matter; this restricted secretion of neurotransmitters at or near terminal active zones helps to maintain the specificity of intercellular communication in the nervous system1. Indeed, terminal boutons are rare in white matter, which contains primarily myelinated and unmyelinated axons and a variety of glial cells2. Nevertheless, glutamate is released in an activity-dependent manner from white matter3, glial cells within these fiber tracts express glutamate receptors4,5 and glutamate transporters are present to remove glutamate6. Furthermore, glutamate-induced excitotoxic damage to oligodendrocytes and their progenitors is often observed after ischemia7, which leads to a loss of myelin and is a contributing factor in cerebral palsy. Despite this evidence of glutamatergic signaling in white matter, the mechanisms responsible for glutamate release within these projection pathways have not been determined.
To define the mechanisms of glutamate release within white matter, we recorded from glial precursor cells that express the proteoglycan NG2 (NG2+ cells) in the corpus callosum; these cells represent a potential target of axon-derived glutamate, as they express ionotropic glutamate receptors4, make contact with axons in white matter8 and form synapses with neurons in the hippocampus and cerebellum9,10. We found that NG2+ cells within the corpus callosum express functional AMPA receptors, which are activated after action potential-induced release of glutamate from unmyelinated axons. This rapid signaling occurs through vesicular fusion at defined axon–NG2+ cell junctions, indicating that axons do not merely transmit electrical activity through white matter, but rather engage in rapid signaling with a distinct group of glial progenitors.
RESULTS
DsRed is expressed by NG2+ cells in NG2-DsRed BAC mice
Visualization of cells within white matter using differential interference contrast (DIC) imaging is made difficult by light scattering from myelin. Therefore, to study intercellular signaling mechanisms active within NG2+ cells in living tissue, we used bacterial artificial chromosome (BAC)-mediated transgenesis11 to create mice that express the fluorescent protein DsRed under the control of the NG2 promoter. In these NG2-DsRed BAC mice, DsRed expression was restricted to NG2+ cells throughout the brain, including small stellate-shaped glial cells in gray and white matter that expressed the platelet-derived growth factor receptor-α (PDGFαR) and pericytes surrounding blood vessels (Fig. 1a–h). To determine the proportion of NG2+ cells that express DsRed in juvenile mice, we performed dual immunolabeling for NG2 and platelet-derived growth factor receptor-β (PDGFβR; to label NG2+ vascular-associated pericytes) in the corpus callosum at three postnatal ages (postnatal day (P) 7, P14 and P26), and counted the number of DsRed+PDGFβR− cells that were NG2+ in two or three randomly selected sections in the anterior corpus callosum at the level of the striatum, and in the posterior corpus callosum at the level of the hippocampus. More than 90% of DsRed+ cells were NG2+ at these ages (P7: 67/70 cells, 96%; P14: 64/68 cells, 94%; P26: 57/60 cells, 95%), indicating that these BAC transgenic mice allow access to this specific population of glial progenitors in both developing and mature white matter. The small number of DsRed+ cells that were NG2− had much lower DsRed fluorescence, suggesting that these cells may have been transitioning to a more mature phenotype.
Figure 1.
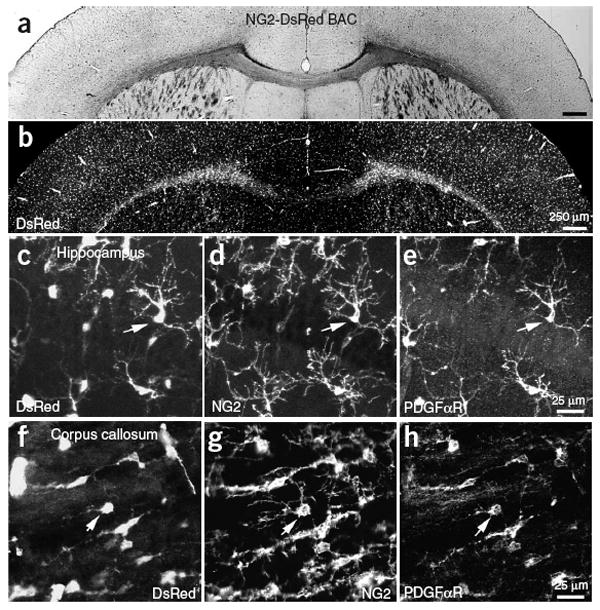
NG2+ cells express DsRed in NG2-DsRed BAC mice. (a) Coronal brain section from a P24 NG2-DsRed BAC transgenic mouse. (b) DsRed fluorescence image from the same section as in a. (c–e) CA1 region of the hippocampus from a P30 NG2-DsRed BAC transgenic mouse showing DsRed fluorescence (c), NG2 immunoreactivity (d) and PDGFαR immunoreactivity (e). (f–h) Section of corpus callosum from the same P30 mouse showing DsRed fluorescence (f), NG2 immunoreactivity (g) and PDGFαR immunoreactivity (h). Arrows in each panel highlight one NG2+ glial cell.
Glutamatergic signaling in NG2+ cells within white matter
Whole-cell recordings from DsRed+ glial cells in the corpus callosum revealed that these cells had a high resting potential (−101 ± 1 mV, mean ± s.e.m.), a small size (whole cell capacitance = 13.9 ± 1.5 pF) and a moderate input resistance (229 ± 59 MΩ) and did not fire action potentials in response to depolarization (n = 13) (Fig. 2a), properties similar to those of NG2+ cells in gray matter12. Focal application of kainate to these cells triggered inward currents (n = 11) that were blocked by the AMPA receptor (AMPAR) antagonist GYKI 53655 (100 μM; n = 4), and in the majority of DsRed+ cells (18/22 cells) application of NMDA elicited small currents that were blocked by the NMDA receptor (NMDAR) antagonist d,l-CPP (10 μM; n = 5) (Fig. 2b and Supplementary Fig. 1 online). These results indicate that NG2+ cells in the corpus callosum have the potential to respond to the release of glutamate.
Figure 2.
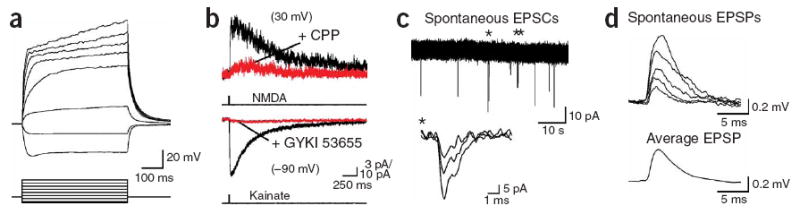
Spontaneous release of glutamate within the corpus callosum activates AMPA receptors in NG2+ glial cells. (a) Whole-cell current-clamp recording from a DsRed+ cell in the corpus callosum showing responses to current injection. VM = −97 mV. Current steps: −90, −30, 30, 90, 150, 210, 270 and 330 pA. (b) Activation of NMDA receptors (upper traces) and AMPA receptors (lower traces) in DsRed+ cells by focal application of NMDA (100 μM) and kainate (200 μM), respectively. NMDAR responses were blocked by d,l-CPP (upper red trace) (10 μM) and AMPAR responses were blocked by GYKI 53655 (100 μM) (lower red trace). (c) Spontaneous EPSCs recorded from a corpus callosum NG2+ cell. Inward currents highlighted by an asterisk are shown at an expanded time scale (inset). (d) Individual spontaneous EPSPs recorded from an NG2+ cell in current clamp (upper traces) and the average EPSP waveform calculated from 24 events (lower trace). VM = −104 mV.
Spontaneous inward currents were observed in callosal NG2+ cells during continuous recordings that had a time course reminiscent of excitatory postsynaptic currents (EPSCs) (Fig. 2c) and were blocked by GYKI 53655 (10 μM; n = 5), indicating that their AMPARs are activated in white matter. These currents were capable of inducing small membrane depolarizations (average amplitude, 0.45 ± 0.04 mV; range, 0.17–1.55 mV; n = 127 events, six cells) (Fig. 2d). Electrical stimulation of callosal axons also triggered inward currents in NG2+ cells at room temperature (22–24 °C) and near physiological temperature (36 °C), which were blocked by GYKI 53655 (100 μM; n = 7) (Fig. 3a) or the Na+ channel antagonist tetrodotoxin (TTX, 1 μM; n = 4), indicating that action potentials can trigger the release of glutamate in the corpus callosum. To determine the proportion of NG2+ cells that receive glutamatergic input, we randomly selected cells at three ages (P14–P15, P19–P21 and P35) and examined whether they responded to electrical stimulation of callosal fibers. EPSCs were observed in 100% (23/23 cells) of DsRed+ cells at P14–P15, in 97% (32/33 cells) of DsRed+ cells at P19–P21 and in 100% (12/12 cells) of DsRed+ cells at P35. These results indicate that AMPAR signaling is pervasive among the population of NG2+ cells in both the developing and mature corpus callosum.
Figure 3.
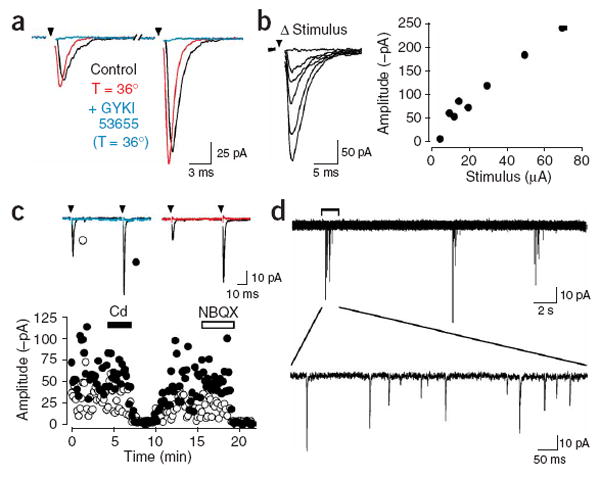
Stimulation of axons within the corpus callosum evokes the release of glutamate. (a) Response of an NG2+ cell to paired stimulation of corpus callosum axons (50 ms ISI), recorded at room temperature (22–24 °C) and near physiological temperature (36 °C). Evoked responses were blocked by GYKI 53655 (100 μM). (b) Series of responses evoked with stimuli of different intensities (left, traces) and plot of the peak amplitude of the responses versus stimulus intensity (right, graph). Stimulation intensities: 5, 10, 12.5, 15, 20, 30, 50 and 70 μA. (c) Averaged responses and plot of peak amplitudes of evoked AMPAR currents recorded from an NG2+ cell in response to paired stimulation. Responses were blocked by cadmium (Cd, 30 μM, blue trace) and NBQX (10 μM, red trace). Open circles, first response amplitude; closed circles, second response amplitude. (d) Bursts of EPSCs recorded from a callosal NG2+ cell in the presence of gabazine (5 μM).
When paired stimuli were applied to callosal axons with a 50-ms interstimulus interval (ISI), AMPAR responses in NG2+ cells were on average much larger after the second stimulus (Fig. 3a); the degree of facilitation increased with age, from 1.5 ± 0.1 at P14 (n = 5) to 2.3 ± 0.2 at P21 (n = 5), after which it remained stable (at P35 the facilitation was 2.4 ± 0.1; n = 5). Varying the ISI from 50 to 500 ms revealed that AMPAR responses returned to control levels with a time constant of 151 ms (at P21; n = 5), indicating that repetitive firing of cortical neurons transiently enhances glutamate release within the corpus callosum. Furthermore, AMPAR currents became progressively larger when the stimulus intensity was increased (n = 8) (Fig. 3b), suggesting that individual NG2+ cells receive glutamatergic input from multiple sources. These evoked AMPAR currents were reversibly blocked by the voltage-gated Ca2+ channel blocker cadmium (CdCl2, 30 μM; n = 10) (Fig. 3c), indicating that Ca2+ influx was required to induce glutamate release. Spontaneous action potentials also were sufficient to induce glutamate release; in the presence of the GABAA receptor antagonist gabazine, bursts of AMPAR currents consisting of 2–14 events (mean, 5.6 events) appeared at regular intervals (2.0 ± 0.5 min−1; n = 4) in callosal NG2+ cells (Fig. 3d). Previous studies have shown that pyramidal neurons in layer II/III of the cortex, a main source of axons to the corpus callosum13, fire bursts of action potentials at a frequency of 2–8 min−1 in the presence of GABAA receptor antagonists14. Consistent with these observations, the rhythmic bursts of AMPAR currents in NG2+ cells were blocked by TTX (1 μM) (n = 3), indicating that intrinsically generated action potentials also induced the release of glutamate in white matter.
Glutamate release is mediated by vesicle fusion along axons
In the presence of TTX, spontaneous AMPAR currents occurred in NG2+ cells at a low frequency (average, 0.008 ± 0.0085 Hz; range, 0–0.022 Hz; n = 12) (Fig. 4a). In cells that showed sufficient activity, the average amplitude of these miniature EPSCs (mEPSCs) was −18.4 ± 1.2 pA (n = 7). These currents had rapid rise and decay kinetics (10–90% rise time, 321 ± 25 μs; decay tau, 1.44 ± 0.13 ms; n = 7 cells) (Fig. 4b), indicating that glutamate was transiently elevated near NG2+ cell AMPARs.
Figure 4.
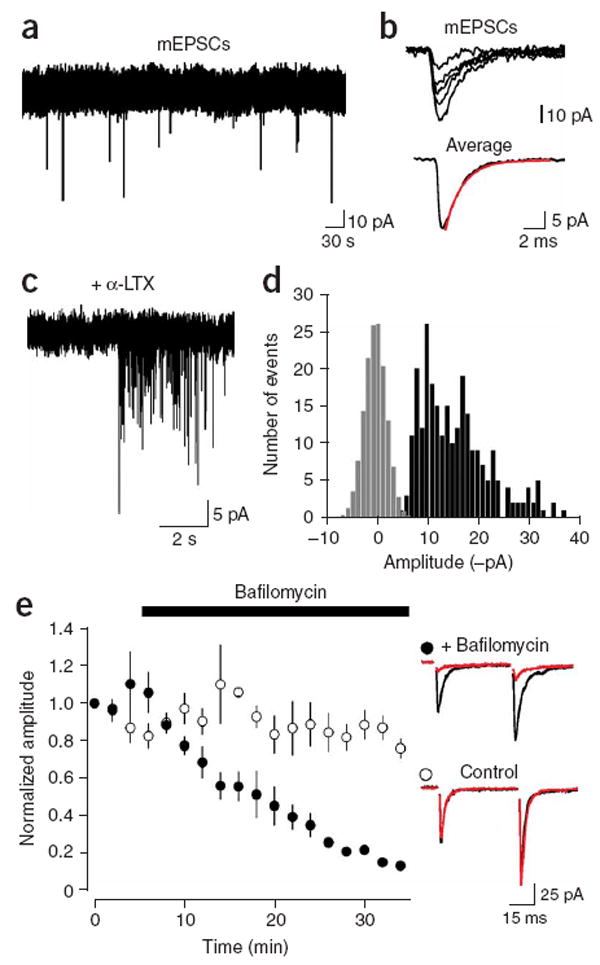
AMPAR currents in callosal NG2+ cells arise from vesicular release of glutamate. (a) Spontaneous mEPSCs recorded from an NG2+ cell in the presence of TTX (1 μM). (b) Five individual mEPSCs and the average mEPSC are shown from the recording in (a). The red line is a single exponential fit to the decay (tau decay = 1.6 ms). (c) A burst of mEPSCs recorded in an NG2+ cell after exposure to α-latrotoxin (5 nM). (d) Graph of the amplitude distribution of α-latrotoxin induced mEPSCs (black bars) and baseline noise (gray bars, scaled to peak of mEPSC distribution). (e) Inhibition of glutamate loading into vesicles with the proton pump inhibitor bafilomycin A1 (Baf, 2 μM) caused a progressive decrease in evoked AMPA currents in NG2+ cells. Traces at right show the average response before application of Baf (black traces) and after 30 min in the presence (red, top trace) or absence (red, bottom trace) of Baf.
The neurotoxin α-latrotoxin (α-LTX) enhances Ca2+-independent fusion of vesicles at glutamatergic synapses15 by binding to specific receptors localized within axon terminal membranes16. Exposure to α-LTX (5 nM) similarly increased the frequency of mEPSCs in NG2+ cells (n = 3) (Fig. 4c), suggesting that these events may be generated at defined synaptic junctions. Events were observed within 5–8 min of exposure to α-LTX and multiple bursts of EPSCs were typically observed in one cell. The amplitude distributions of events collected from multiple bursts were approximately unimodal, and showed a prominent skew toward larger events (Fig. 4d). The average peak amplitude of mEPSCs evoked with α-LTX was −15.1 ± 0.6 pA (range 14.0–16.0 pA; n = 3), and the coefficient of variance was 0.30 ± 0.06, comparable to the variance observed at en passant glutamatergic synapses in the hippocampus17. Previous studies have shown that the skew in the amplitude distribution of miniature events can be accounted for by the variation in vesicle size18, assuming that the quantity of glutamate in each vesicle varies with the third power of vesicle radius, although variations in receptor occupancy and subsequent changes in unitary conductance may also influence the shape of the distribution. Indeed, when mEPSC amplitude distributions were subjected to a cubed root transformation, they were well fit with a single Gaussian (n = 3) (data not shown). Together, these results suggest that spontaneous AMPAR currents in NG2+ cells arise from vesicular fusion along axons.
If AMPAR currents in NG2+ cells are generated via fusion of glutamate-containing vesicles rather than via glutamate release through connexin hemichannels, P2X7 purinergic receptors or volume-sensitive anion channels—all channels that permit glutamate release19—the currents should become smaller when loading of glutamate into vesicles is inhibited. As expected for vesicular release, application of bafilomycin A1 (Baf, 2 μM), an inhibitor of the vacuolar-type ATPase that establishes the voltage and pH gradients required for transport of glutamate into secretory vesicles, led to a progressive decrease in the amplitude of evoked AMPAR currents; after 30 min, the evoked response was reduced by 82 ± 3% (n = 4), similar to the inhibition observed at neuronal synapses20, while responses recorded without Baf decreased by only 25 ± 6% (n = 4) (Fig. 4e). The Baf-induced reduction could not be accounted for by changes in the responsiveness of NG2+ cells to glutamate, as kainate-evoked currents were reduced by only 27 ± 7% (n = 4) by Baf over this period. The rapid kinetics of the AMPAR currents, and the dependence of release on voltage-gated Ca2+ channels and vesicle filling, suggest that action potentials rapidly trigger the fusion of glutamate-filled vesicles along axons within the corpus callosum.
It has been reported that axons in optic nerve can release glutamate through reversed cycling of glutamate transporters3. This mechanism of release is inconsistent with the rapid kinetics of the AMPAR currents observed in callosal NG2+ cells, because transporters cycle slowly21 and are expressed at a low level in axonal membranes. Indeed, evoked AMPAR currents in NG2+ cells could still be elicited in the presence of the glutamate transporter antagonist d,l-threo-β-benzyloxyaspartate (TBOA, 100 μM; n = 5) (Fig. 5a), when cyclothiazide (CTZ, 100 μM) was included to prevent AMPAR desensitization by elevated ambient glutamate. The decay kinetics of evoked EPSCs were not altered by TBOA (tau decay; control (CTZ), 1.99 ± 0.19 ms; TBOA (CTZ), 2.18 ± 0.19 ms; n = 12, P = 0.068), in accordance with the limited role of transporters in shaping AMPAR EPSCs at synapses containing a single release site22. However, TBOA decreased the amplitudes of EPSCs by 69 ± 4% (n = 12) (control (CTZ), −128 ± 20 pA; TBOA (CTZ), −39 ± 9 pA). This depression could have resulted from tonic activation of AMPARs or activation of ‘presynaptic’ metabotropic glutamate receptors (mGluRs) at sites of release. Application of the mGluR agonist (±)-1-aminocyclopentane-trans-1,3-dicarboxylic acid (trans-ACPD) caused a 76 ± 4% (n = 4) reduction in the amplitude of evoked responses; in three cells that showed failures before trans-ACPD application, this reduction was accompanied by a 4.2 ± 1.5-fold increase in failures, indicating a presynaptic site of action. These results suggest that mGluR autoreceptors are present along axons in white matter to regulate glutamate release.
Figure 5.
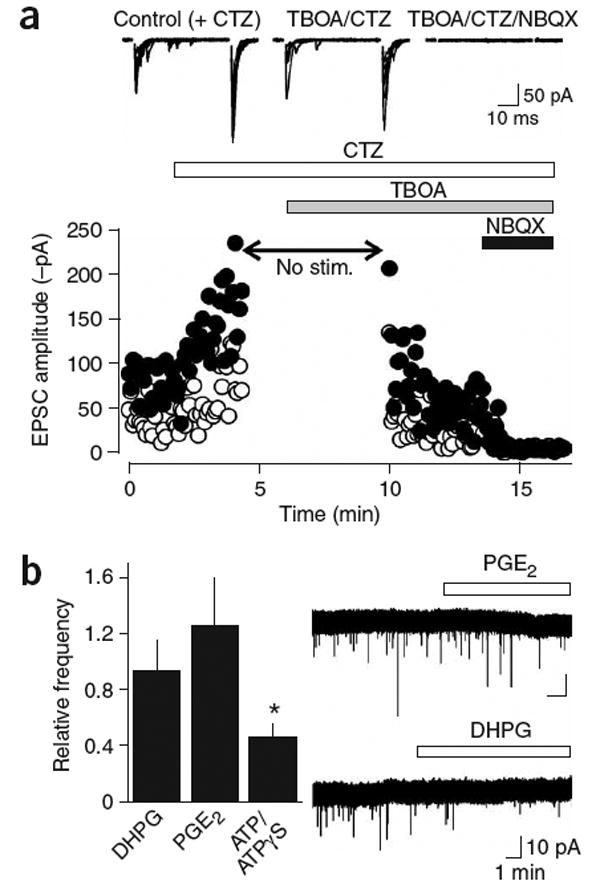
AMPAR currents in NG2+ cells are not produced by reversed cycling of glutamate transporters or by vesicular release from astrocytes. (a) Evoked AMPA receptor responses persist in the presence of the glutamate transporter inhibitor TBOA (100 μM). Cyclothiazide (CTZ, 100 μM) was applied to prevent desensitization of AMPAR during uptake blockade. The stimulation was stopped during the initial application of TBOA to prevent glutamate accumulation. Traces above show ten superimposed responses to paired stimulation in the different pharmacological conditions. Open circles are the responses to the first stimulus; closed circles are the responses to the second stimulus. (b) Stimulation of astrocytes does not increase the frequency of mEPSCs in callosal NG2+ cells. Graph shows the relative frequency (drug/control) of mEPSCs recorded after 5 min in DHPG (15 μM, n = 11), PGE2 (10 μM, n = 11) and ATP/ATPγS (100 μM, n = 17). Traces at the right are continuous recordings of mEPSCs showing the response of cells to PGE2 (upper trace) and DHPG (lower trace).
Astrocytes in gray matter areas such as the hippocampus can release glutamate through Ca2+-dependent vesicular fusion in response to neuronal activity23. Although tetanic stimulation is required to initiate glutamate secretion from astrocytes, and this release occurs tens of seconds after the stimulus, it is nevertheless possible that astrocytes rather than axons could be the source of glutamate in white matter. However, although stimulation of receptors that elicit glutamate release from astrocytes, including metabotropic receptors (DHPG, 15 μM; n = 11), purinergic receptors (ATP, 100 μM; n = 17) and prostaglandin receptors (PGE2, 10 μM; n = 11), was sufficient to induce a Ca2+ rise in astrocytes within the corpus callosum (data not shown) (see Supplementary Methods online), it did not increase the frequency of spontaneous miniature AMPAR currents in white matter NG2+ cells (Fig. 5b). The frequency of mEPSCs in NG2+ cells was significantly reduced by ATP (P = 0.004) but not by DHPG (P = 0.078) or PGE2 (P = 0.809). ATP also decreased the amplitude of evoked responses by 63 ± 9% (n = 6), which was accompanied by a more than threefold increase in failures (P < 0.01), indicating that ATP also reduces the probability of glutamate release from axons in white matter.
Glutamate release in developing and mature white matter
The quantal currents seen in NG2+ cells could be generated at transient contacts between growing axons and glia, as neurotransmitters can be released from growth cones24 and non-neuronal guidepost cells serve as interim targets for growing axons25. Although NG2+ cells appear in the corpus callosum before birth, evoked AMPAR currents were not observed in these cells until P5. These responses were small in young mice (P7–P9; amplitude range, −5 to −30 pA; n = 4), but increased in size as the animals matured (P20–30; amplitude range, −40 to −400 pA; n = 15) and could be elicited in NG2+ cells in the corpus callosum of adult (P90) mice (n = 5) (data not shown). Thus, rapid signaling between axons and glia is established early and persists into adulthood, paralleling the maturation of this white matter tract. Could this signaling occur as a result of interactions at the ends of severed axons? To address this possibility we recorded from NG2+ cells near the midline of coronal slices where the corpus callosum had been completely severed; if axotomy induces the de novo formation of junctions between NG2+ cells and axons, the frequency of miniature events should be higher within these regions than in cells located within untransected slices. The frequency of miniature events was not significantly different in cells located near the transected area (control: 0.008 ± 0.0085 Hz, n = 12; transected: 0.010 ± 0.011 Hz, n = 11, P > 0.05), indicating that AMPAR currents do not reflect vesicle fusion at the ends of severed axons.
If each axon makes only one junction with an NG2+ cell, and only one vesicle is released at a time at these sites, then the quantal content of evoked EPSCs provides a lower bound for the number of axons that provide input to NG2+ cells. Dividing the average maximum amplitude of EPSCs elicited through paired stimulation (−203 ± 44 pA, n = 8) by the average mEPSC amplitude (−18.4 ± 1.2 pA) indicates that, on average, NG2+ cells in the mature corpus callosum receive input from 11 fibers. This is a conservative estimate, as not all inputs may have released glutamate in response to the stimulus.
Synaptic junctions between NG2+ cells and callosal axons
To determine whether anatomically distinct synaptic junctions are formed with NG2+ cells in the corpus callosum, we performed immunolabeling for NG2 and the type 1 vesicular glutamate transporter (VGLUT1). Discrete VGLUT1+ puncta were observed throughout the corpus callosum that were also immunoreactive for synaptophysin (Supplementary Fig. 2 online), indicating that there are numerous sites of vesicle accumulation within glutamatergic axons that project through this region. In many instances, VGLUT1+ puncta were directly apposed to NG2+ processes; of 15 NG2+ cells examined, 14 had processes with associated VGLUT1+ puncta (mean, 5.7 ± 1.5 puncta per cell; range, 0–23 puncta; n = 15) (Fig. 6a). Notably, these sites of VGLUT1 accumulation were not adjacent to microtubule-associated protein-2–expressing dendrites, indicating that NG2+ cells are a direct target of callosal axons (Supplementary Fig. 2).
Figure 6.
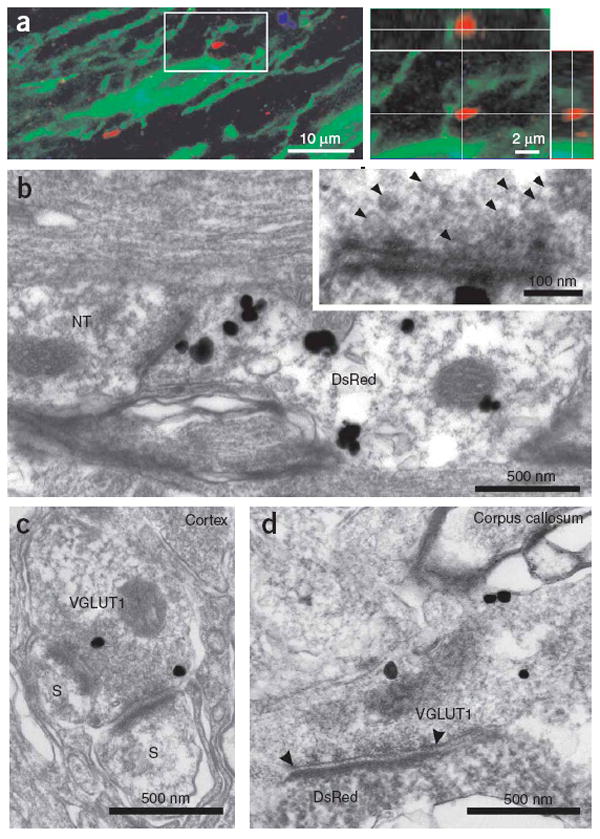
Axons form defined synaptic junctions with NG2+ cells within the corpus callosum. (a) Triple-immunofluorescence of NG2 (green), VGLUT1 (red) and Map2 (blue) immunoreactivity in a projection image showing close association between VGLUT1+ puncta and NG2+ processes; these VGLUT1+ puncta were not in close proximity to neuronal dendrites (blue process, left image). The area circumscribed by the white box is shown in an orthogonal reconstruction with x-z and y-z planes extracted at the levels indicated by the white lines (right). (b) Thin-section electron micrograph from the corpus callosum. Silver-enhanced pre-embedding immunogold for DsRed shows an NG2+ cell process (DsRed) opposed to a nerve terminal (NT) containing small clear vesicles. The inset shows the active zone region at higher magnification, illustrating the region of close apposition between axon and NG2+ cell membranes, the accumulation of electron-dense material, and the presence of small (∼35-nm-diameter) vesicles in the axon. (c) Thin-section electron micrograph from the cortex showing VGLUT1 immunoreactivity (silver-enhanced immunogold, VGLUT1) in a terminal bouton that forms two synapses with dendritic spines (S). (d) Thin-section electron micrograph from the corpus callosum showing VGLUT1 immunoreactivity (silver-enhanced immunogold, VGLUT1) in an axon that forms a synaptic junction (highlighted by arrowheads) with a lightly labeled NG2+ cell process (DsRed immunoreactivity, horseradish peroxidase product).
To determine the ultrastructural relationships between nerve fibers and NG2+ cell processes, we visualized DsRed in NG2-DsRed BAC mice using silver-enhanced pre-embedding immunogold. In accordance with the accumulation of VGLUT1 next to NG2+ cell processes, discrete junctions were observed between axons and DsRed+ cell membranes that showed the structural characteristics of neuronal synapses, including rigid parallel apposition of axonal and NG2+ cell membranes, accumulation of small, clear vesicles near the pre-junctional membrane, electron-dense material in the extracellular space separating the two membranes, and localization of mitochondria in the pre-junctional axon (n = 19 junctions, five cells) (Fig. 6b). The length of active zones at these sites was more variable than that observed for synapses in layer VI of the cortex (corpus callosum: 280 ± 142 nm, n = 17; cortex: 264 ± 43 nm, n = 17; P = 0.895), although the average length was similar. Immunogold labeling revealed that these axons contained VGLUT1, and vesicles observed within axons at these junctions had the same diameter as those at cortical synapses (corpus callosum: 35 ± 5 nm, n = 30 vesicles; cortex: 36 ± 4 nm, n = 49 vesicles; P = 0.207) (Fig. 6c,d). These results indicate that axons in white matter form specialized junctions with NG2+ cells that share many structural similarities with conventional synapses in the gray matter.
Vesicular release from unmyelinated axons in white matter
NG2+ cells within the optic nerve and spinal cord make contact with nodes of Ranvier8,26, raising the possibility that vesicle secretion is localized to nodal regions of myelinated axons. However, approximately 30% of axons in the adult rodent corpus callosum are unmyelinated27. To determine which axons were responsible for glutamate release in white matter, we estimated the conduction velocity of axons that mediate NG2+ cell AMPAR currents. Increasing the separation between the stimulating electrode and the cell resulted in a substantial increase in the delay between the stimulus and the onset of the response (Fig. 7a). A regression of the delay measured at various distances provides an estimate of the conduction velocity of the axons responsible for generating the AMPAR currents. For seven NG2+ cells, the mean conduction velocity was 0.45 ms−1 (at 37 °C) (Fig. 7b). Similar time-delay measurements of EPSCs elicited in hippocampal CA1 pyramidal neurons indicated that Schaffer collateral fibers had a conduction velocity of 0.18 ms−1, in agreement with the small diameter of these unmyelinated axons28. To compare these measurements to the conduction velocity of myelinated and unmyelinated axons in the corpus callosum of NG2-DsRed BAC mice, we recorded evoked extracellular compound action potentials (CAPs) produced by these fiber tracts; CAPs produced by the two groups of fibers can be distinguished by differences in conduction velocity and by sensitivity to 4-aminopyridine (4-AP), which preferentially slows the conduction of unmyelinated fibers29. Two discrete negative waves were visible in the field response after callosal stimulation, which were blocked by TTX (1 μM, n = 6) (Fig. 7c); the second CAP peak was prolonged by 4-AP (10 μM; n = 5), indicating that it reflected the activity of unmyelinated fibers. Time-delay measurements revealed that the conduction velocity of myelinated fibers was 0.89 ms−1 at room temperature, whereas that of unmyelinated fibers was 0.33 ms−1. At 37 °C these values increased to 1.89 ms−1 (myelinated fibers) and 0.54 ms−1 (unmyelinated fibers) (Fig. 7d), comparable to conduction velocities measured in the rat corpus callosum29. The slow conduction velocity of axons giving rise to EPSCs in NG2+ cells (0.45 ms−1) suggests that glutamate is released primarily from unmyelinated fibers.
Figure 7.
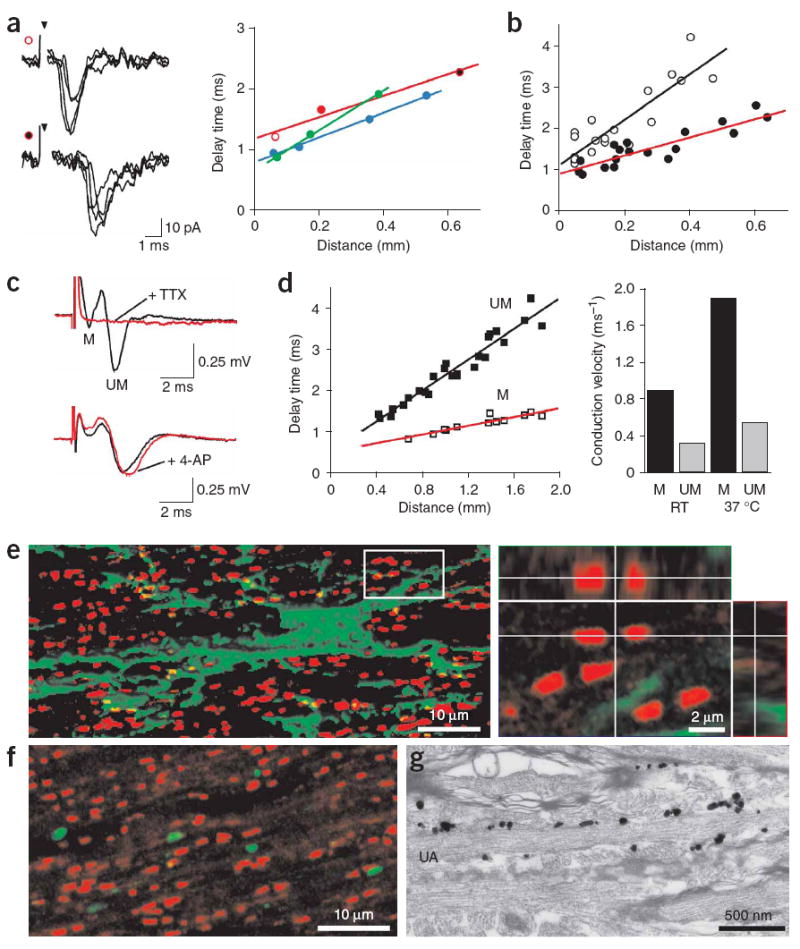
Glutamate is released from unmyelinated axons in the corpus callosum. (a) Left, example traces recorded from an NG2+ cell after callosal axon stimulation at distances of 70 μm (upper traces, open red circle) and 640 μm (lower traces, filled red circle). Inverted arrowhead denotes time of stimulation. Right, plot of change in delay between stimulation and onset of EPSC recorded with increasing separation of stimulation electrode and NG2+ cell. Each color corresponds to responses of one cell; red circles correspond to the traces shown at left. (b) Plot of delay time versus distance for synaptic responses recorded from 7 callosal NG2+ cells (filled circles, red line) and 13 hippocampal CA1 pyramidal neurons (open circles, black line). Lines represent regression fits to the points (P33–P51 NG2+ cells; P20–P33 pyramidal neurons). (c) Extracellular recordings of compound action potentials (CAPs) generated by myelinated (M) and unmyelinated (UM) fibers in the corpus callosum, showing the sensitivity to TTX (1 μM) and 4-aminopyridine (4-AP, 10 μM) (lower red trace). (d) Left, plot of delay time versus distance for myelinated (M, open squares) and unmyelinated (UM, filled squares) fibers at 37 °C. Right, conduction velocities of myelinated and unmyelinated fibers calculated from extracellular CAPs. Ages for c and d were P32–P37. (e) Double-immunofluorescence for NG2 (green) and Caspr (red) shown in a projection image with isosurface rendering of the NG2+ cell (left). The area circumscribed by the white box is shown in an orthogonal reconstruction with x-z and y-z planes extracted at levels indicated by the white lines (right). Age, P30. (f) Double-immunofluorescence for Caspr (red) and VGLUT1 (green) shown in a projection image. (g) Silver-enhanced pre-embedding immunogold for DsRed showing extensive contact between an unmyelinated axon (UA) and DsRed+ processes in the corpus callosum. Age, P35.
The involvement of unmyelinated axons in this axon-glia signaling indicates that NG2+ cell-axon interactions are not limited to the nodes of Ranvier. Indeed, visualization of the paranodal protein Caspr revealed that the majority of nodes (67 ± 3%) in the vicinity of NG2+ cells were not associated with NG2+ cell processes (n = 731 nodes, 3 cells) (Fig. 7e and Supplementary Fig. 2); because NG2+ cells cover only a small portion of the corpus callosum, these results indicate that few nodes are associated with NG2+ cells. Furthermore, analysis of 515 VGLUT1+ puncta in four coronal sections of corpus callosum revealed that only 2 ± 1% of the VGLUT1+ puncta were located near nodes (Fig. 7f). In contrast to the limited interaction between nodes and NG2+ cells, DsRed immunogold labeling revealed large areas of contact between NG2+ cells and unmyelinated nerve fibers in this region (Fig. 7g). These results, and the finding that evoked AMPAR currents could be elicited in NG2+ cells for >1 h with repeated stimulation (at 0.25 Hz), indicate that glutamate is released from unmyelinated axons within the corpus callosum at defined axon-glia synaptic junctions.
Previous studies have demonstrated that NG2+ cells in the hippocampus and cerebellum express Ca2+-permeable AMPARs9,10. To determine whether AMPAR signaling in white matter NG2+ cells could also enable Ca2+ influx, we measured the rectification of evoked EPSCs with 100 μM spermine in the intracellular solution, which blocks outward current through Ca2+-permeable AMPARs. In the developing corpus callosum (P7–P8), the current-to-voltage (I-V) relationship of NG2+-cell EPSCs showed little deviation from linearity at positive potentials (n = 4) (Fig. 8a), suggesting that few Ca2+-permeable AMPARs were activated. In contrast, in the mature corpus callosum (P42–P52) the I-V relationship showed prominent inward rectification (n = 8) (Fig. 8b), with the amplitudes of evoked EPSCs being proportionally smaller at positive potentials. This rectification was not observed when spermine was omitted from the intracellular solution, indicating that vesicular release of glutamate from axons in the mature corpus callosum results in the activation of Ca2+-permeable AMPARs in NG2+ cells. The small depolarization produced by spontaneous EPSPs (Fig. 2) suggest that the flux of Ca2+ through these receptors may be essential for regulating the behavior of NG2+ cells.
Figure 8.
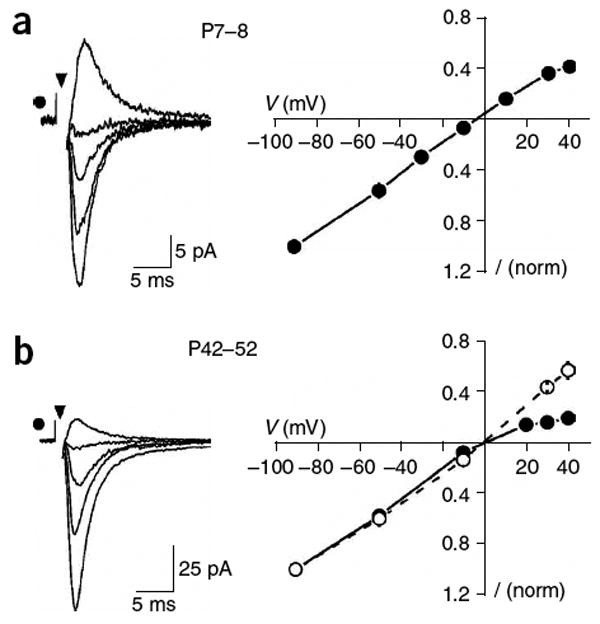
NG2+ cells in the adult corpus callosum express Ca2+-permeable AMPARs. (a) Evoked EPSCs recorded from an NG2+ cell in the developing corpus callosum (P8) with an internal solution containing spermine (left traces) at holding potentials of −90, −50, −10 and 30 mV. At right is the current-voltage (I-V) relationship of AMPAR currents elicited in NG2+ cells in young animals (P7–P8) (n = 4). These responses showed little rectification, indicating that few Ca2+-permeable AMPARs were activated. (b) Evoked EPSCs recorded from an NG2+ cell in the mature corpus callosum (P52) with an internal solution containing spermine (left traces) at holding potentials of −90, −50, −10 and 30 mV. At right is the I-V relationship of AMPAR currents elicited in NG2+ cells in mature animals (P42–P52), when spermine was present (filled circles, n = 8)) or absent (open circles, n = 3) from the internal solution. Responses at this age showed prominent inward rectification, indicating that Ca2+-permeable AMPARs contributed to the EPSCs.
DISCUSSION
Here we investigated the mechanisms responsible for glutamate release within the corpus callosum, an expanse of white matter that is the principal commissural pathway linking the two cerebral hemispheres. We found that the propagation of action potentials through this region induces the secretion of glutamate from unmyelinated axons. This vesicular release of glutamate results in the transient activation of AMPARs in NG2+ cells, a distinct class of glial progenitor cells that make overt synaptic junctions with this subset of axons. Thus, axons in white matter not only convey information to other gray matter regions but also engage in rapid synaptic signaling with glial cells. The presence of numerous sites of vesicular release in white matter has implications both for activity-dependent control of myelination and for the mechanisms responsible for ischemia-induced excitotoxic damage to myelin.
Callosal axons arise primarily from pyramidal neurons in layers II/III and V and are purely excitatory13. Although unmyelinated axons comprise up to 30% of the axons that traverse this commissure, remarkably little is known about the information carried by these fibers. Because of their small diameter and lack of myelin sheaths, they conduct action potentials up to 40 times more slowly than the most rapidly conducting myelinated fibers. Therefore, in humans, events initiated in one hemisphere that are conveyed by these fibers would arise in the contralateral cortex with a delay of about 200 ms, assuming that unmyelinated axons conduct action potentials at 0.5 ms−1 over a length of 0.1 m. Whereas large myelinated fibers in the corpus callosum arise from primary sensory regions, unmyelinated axons arise from and project to prefrontal association areas, which may have less stringent requirements for temporal and spatial summation of inputs30. It has been suggested that these fibers may even exert a tonic rather than a phasic influence on their targets30. As our results indicate that these unmyelinated fibers are a primary source for the release of glutamate within the corpus callosum, it is possible that they may have a greater role than myelinated fibers in influencing the behavior of glial cells; neuron–glial cell signaling may not require the precise timing that is critical for interactions among neurons.
Oligodendrocyte progenitors within white matter express NG2, a chondroitin sulfate proteoglycan that regulates cell proliferation and motility31 and axon growth32,33 and prevents axon regeneration34. Within these cells, NG2 is directly coupled to AMPARs through an interaction with the scaffolding protein GRIP1 (ref. 35). AMPARs in these progenitors may therefore attract NG2-bearing processes to particular regions of unmyelinated axons, in a manner analogous to that demonstrated for Bergmann glial cells in the cerebellum36, to create a matrix that helps to maintain callosal projections and prevent sprouting. In addition, in vitro studies have shown that AMPAR signaling in NG2+ progenitors can regulate the ability of these cells to differentiate into myelinating oligodendrocytes37. This widespread glutamatergic signaling between axons and oligodendrocyte progenitors in the corpus callosum could therefore allow axons to influence the extent of myelination within white matter38, which has been shown to vary with both development and behavioral experience39. Although our studies indicate that glutamate is released at these axon-glia junctions, it is also possible that other neurotransmitters—such as ATP, which has also been implicated in activity-dependent regulation of myelination40—could be concurrently released at these sites. If activity could initiate myelination of these fibers, there would be a marked increase in the speed of information transfer between cortical associational areas.
Despite the demonstrated role of NG2+ cells in the formation of oligodendrocytes, these cells are abundant outside white matter areas, a finding that has led to the proposal that NG2+ cells may comprise a diverse population of cells that perform distinct functions and are destined for different fates. Indeed, comparisons of NG2+ cell properties across various white and gray matter regions have uncovered variations in cell morphology41, physiological properties42 and patterns of gene expression43. Nevertheless, our studies indicate that in the mature CNS, NG2+ cells in the gray and white matter share some physiological properties, including a high resting membrane potential, expression of voltage- and ligand-gated ion channels, and a lack of excitability. Furthermore, NG2+ cells in both white and gray matter engage in glutamatergic signaling with neurons, indicating that this rapid form of neuron-glia communication is a universal property of this class of glial cells. The fact that this signaling is not restricted to myelinated regions10 suggests that activity at these synapses may influence more than oligodendrogenesis, and that NG2+ cells may have ongoing roles in influencing the organization or activity of neuronal projections throughout the CNS.
Cerebral ischemia often causes extensive damage to oligodendrocytes and their progenitors, leading to a loss of myelin44. In gray matter, ischemic episodes trigger widespread, sustained fusion of synaptic vesicles, which contributes to the increase in extracellular glutamate that is responsible for excitotoxicity45. In experimental ischemia, white matter injury is ameliorated by administration of AMPAR antagonists7, indicating that excitotoxicity is also responsible for damage to glia in these regions. NG2+-cell AMPARs represent one site of action for these drugs. In addition, the presence of VGLUT1+ puncta at axon–NG2+ cell junctions suggests that vesicular fusion at these sites may contribute to glutamate release in white matter during ischemia.
Recent studies have provided evidence that NMDARs are also expressed by oligodendrocytes and their precursors in white matter and contribute to ischemic injury to myelin5,46. However, we found that NMDARs are expressed by only ∼60% of NG2+ cells in the developing and mature corpus callosum, and NMDAR currents from these cells were very small (∼10 pA at 30 mV) under saturating conditions (see Supplementary Fig. 1). Assuming a unitary conductance of 50 pS and a maximum open probability of 0.3 (ref. 47), these results suggest that ∼20 NMDARs were present in each cell. NG2+ cells may be extraordinarily sensitive to the Ca2+ that flows through these receptors; however, we found that ∼40% of NG2+ cells had no detectable NMDAR current. Furthermore, NMDAR currents in NG2+ cells were blocked by Mg2+ at their resting potential, indicating that substantial depolarization would be required to allow Ca2+ influx through these receptors. These results suggest that NMDAR antagonists may offer limited protection of oligodendrocyte progenitors during ischemia. Further knowledge about the complement of receptors expressed by white matter NG2+ cells, and the regulation of synaptic transmission between axons and this class of progenitors, may offer new avenues for the prevention of myelin damage after ischemic injury or in demyelinating diseases.
METHODS
Generation of BAC transgenic mice
Transgenic mice expressing DsRed-T1 under the control of the NG2 promoter were generated using BAC-mediated transgenesis11. The DsRed-T1 coding sequence and rabbit β-globin polyadenylation signal were inserted into the first exon of the mouse NG2 gene, immediately 5′ to the translation initiation site, in a BAC clone by homologous recombination in Escherichia coli. The ATG of the translation initiation site was mutated to AAG to allow translation from the first ATG in the DsRed cDNA. Clones were analyzed by PCR and Southern blotting to confirm insertion and correct orientation of the transgene. The modified BAC DNA was linearized and microinjected into the pronucleus of fertilized oocytes from B6SJL/F1 mice at the John Hopkins University Transgenic Facility. Three founders were identified by PCR analysis using primers from the DsRed sequence, which showed the same pattern of DsRed expression, but varied in the amount of DsRed expressed.
Slice preparation
Coronal cerebral brain slices were prepared from postnatal (P5–P90) NG2-DsRed mice using standard techniques, in strict accordance with a protocol approved by the Animal Care and Use Committee at Johns Hopkins University. Slices 250 μm thick were cut with a vibratome using a sapphire blade in ice cold N-methyl-d-glucamine (NMDG)-based cutting solution containing 135 mM NMDG, 1 mM KCl, 1.2 mM KH2PO4, 20 mM choline bicarbonate, 10 mM glucose, 1.5 mM MgCl2 and 0.5 mM CaCl2. Slices were maintained thereafter in artificial cerebral spinal fluid (ACSF) containing 119 mM NaCl, 2.5 mM KCl, 2.5 mM CaCl2, 1.3 mM MgCl2, 1 mM NaH2PO4, 26.2 mM NaHCO3 and 11 mM glucose. Slices were maintained in ACSF at 37 °C for 30 min, and thereafter at room temperature. ACSF was bubbled with 95% O2/5% CO2. Unless noted, all experiments were carried out at room temperature. NG2+ cells were visualized on an upright microscope (Zeiss Axioskop FS2) equipped with both DIC optics and a filter set for visualizing DsRed fluorescence (HQ:TRITC 41002c, Chroma) using a ×40 water-immersion objective (Zeiss Acroplan 40x IR) and two charge-coupled device (CCD) cameras (Sony XC-73 and XC-EI30). Two CCD camera controllers (Hamamatsu C-2400) were used to adjust image quality and an image combiner (MicroImage PIX/2) was used to display DIC and fluorescence signals simultaneously.
Electrophysiology
Whole-cell recordings were made from callosal NG2+ cells in ACSF using conventional techniques. The electrode solution consisted of 100 mM CsCH3SO3H (CsMeS), 20 mM tetraethylammonium (TEA) chloride, 20 mM HEPES, 10 mM EGTA, 2 mM sodium ATP and 0.2 mM sodium GTP (pH 7.3). The membrane resistance of NG2+ cells was >1 GΩ when recordings were made with this solution. For current-clamp recordings, we replaced CsMeS with KCH3SO3H (KMeS) in the electrode solution and omitted TEA. Pipette resistance varied from 3.5 to 4.5 MΩ and recordings were made without series resistance compensation. Membrane potentials have been corrected for the error resulting from the liquid junction potentials, and unless otherwise noted, the holding potential was −90 mV. Evoked responses were elicited using a bipolar stainless steel electrode (Frederick Haer Co.; tip separation, 150 μm) placed within the corpus callosum. Stimuli varied between 5 and 200 μA and were 80–200 μs in duration. In some experiments, the temperature of the superfusing solution was increased using a feedback-controlled in-line heater (Warner Instruments). Baf was applied by recirculating continuously oxygenated ACSF containing the drug using a peristaltic pump (Instech Laboratories). For analysis of astrocyte modulation (Fig. 5b), ruthenium red was included in some recordings to enhance the frequency of mEPSCs in NG2+ cells. For extracellular field recordings of CAPs, 450-μm-thick slices were prepared. Extracellular field electrodes of a tip resistance of 1.5–2.5 MΩ were filled with ACSF and CAPs were evoked using constant current (50–300 μA).
The following agents were applied by addition to the superfusing ACSF: TTX (Alomone Lab or Tocris), 1 μM; CTZ (Tocris), 100 μM; GYKI 53655 (Sigma), 100 μM; 2,3-dihydroxy-6-nitro-7-sulfamoyl-benzo(f)quinoxaline (NBQX; Tocris), 10 μM; ruthenium red (Sigma), 100 μM; gabazine (SR-95531; Tocris), 5 μM; DHPG (Tocris), 15 μM; PGE2 (Biomol), 10 μM; bafilomycin A1 (Biomol), 2 μM; TBOA (Tocris), 100 μM; CPP (Tocris), 10 μM; ATP/ATPγS (Sigma), 100 μM; d-serine (Aldrich), 50 μM; Cd2+ (CdCl2; Aldrich), 30 μM; kainate (Tocris), 30 μM; NMDA (Tocris), 200 μM; and d-aspartate (Sigma), 100 μM.
Analysis
Responses were recorded using a MultiClamp 700A amplifier (Axon Instruments), filtered at 2 kHz, digitized at 50 kHz and recorded to disk using pClamp9 software (Axon Instruments) or stored continuously to tape (CDAT-4, Cygnus Technology). Data were analyzed offline using Clampfit (Axon Instruments), Origin (OriginLab Corp.) and Mini analysis (Synaptosoft Inc.) software. Data are expressed as mean ± s.e.m., and statistical significance was determined using the unpaired Student's t-test with a cutoff value of 0.05. The paired pulse ratio (PPR) is reported as the ratio of the peak amplitude of the second response (P2) to the peak amplitude of the first response (P1). The decay time of events was measured by fitting the response with a single exponential using the logistic equation. Amplitude histograms of mEPSCs were plotted using 1-pA bins and Gaussian fits were generated in Origin software. Stimulus artifacts have been truncated for clarity.
Histology
Mice were anesthetized with pentobarbital and perfused with 4% paraformaldehyde in 0.1 M sodium phosphate buffer containing 0.2% (wt/vol) picric acid in accordance with a protocol approved by the Animal Care and Use Committee at Johns Hopkins University. Brain tissue was isolated and maintained in this solution for 6–18 h at 4 °C, then washed in phosphate buffer. Tissue was cut into 30–50-μm sections on a vibrotome, or cryoprotected in sucrose and frozen with 2-methylbutane in OCT compound (Electron Microscopy Sciences) for sectioning at 20 μm on a cryostat (Zeiss; 500OM). For labeling, free-floating sections or slide-mounted sections were treated with 0.3% Triton X-100, and nonspecific antibody reaction was blocked with 5% donkey serum. Rabbit and guinea pig antibodies to NG2 were used at 1:1,000 and rabbit antibody to PDGFαR at 1:200 (see Acknowledgments for sources)48. Antibodies to NG2 label both NG2+ glial cells and perivascular cells. The guinea pig antibody to Caspr (see Acknowledgments)49 was used at 1:1,500, the antibody to Map2 was used at 1:500 (Sigma) and the goat and guinea pig antibodies to VGLUT1 IgG were used at 2.0 μg ml−1. The rabbit antibody to synaptophysin50 was used at 1 μg ml−1. Immunoreactivity to different antigens was detected with Alexa 488- (Molecular Probes), Cy2-, Cy3- or Cy5-conjugated secondary antibodies to rabbit, mouse, goat or guinea pig (1:500; Jackson ImmunoResearch). Fluorescence images were collected with a Noran Oz confocal microscope (Noran) attached to an upright microscope (Zeiss Axioskop FS2) using a ×40 water-immersion objective, Kr-Ar (488 nm, 568 nm) and red HeNe (633 nm) lasers, and Cy2 (500–550-nm band-pass), Cy3 (590-nm band-pass) and Cy5 (660-nm long-pass) filter sets. Low-power images were obtained using a Nikon Eclipse E800 microscope with a Q Imaging Retiga EX camera. Control sections incubated with secondary antibody alone did not result in labeling of cells. Images shown in Figures 6 and 7 and Supplementary Figure 2 were collected with a LSM 510 Meta confocal microscope (Zeiss) using ×40 or ×63 oil immersion objectives and 488-nm, 543-nm and 633-nm laser lines and were filtered using 500–530-nm band-pass, 565–615-nm band-pass and 644–719-nm meta detector setting. Z-stack images were taken at 0.5-μm intervals. The projection images shown in Figures 6a and 7f are composed of five serial sections. All orthogonal images were created from six serial sections. The projection image in the left panel of Figure 7e is composed of nine serial images; isosurface rendering of NG2 immunoreactivity was performed using Imaris software with an edge preserving filter width set at 0.097 μm, an intensity threshold of 37.992 and a voxel size of 0.4061 × 0.4061 × 0.8 μm. This rendering of the NG2+ cell prevented the inappropriate appearance of colocalization between nodes and NG2+ cell processes in the combined image.
Electron microscopy
For pre-embedding immunoelectron microscopy, adult NG2-DsRed-BAC mice were perfused transcardially with 4% paraformaldehyde/0.1% glutaraldehyde in 0.1 M PB under deep pentobarbital anesthesia. After blocking with 5% BSA in TBS/0.02% saponin (blocking solution), coronal sections (50 μm in thickness) including corpus callosum were incubated overnight with rabbit anti-DsRed IgG (1:2,000, BD Bioscience) and then with anti-rabbit IgG conjugated to 1.4-nm gold particles (Nanoprobes). Following silver enhancement (HQ silver, Nanoprobes), sections were osmificated, dehydrated and embedded in Epon 812 resin. For double immunoelectron microscopy, sections were first subjected to silver-enhanced immunogold for DsRed, and then to immunoperoxidase for VGLUT1 using guinea pig anti-VGluT1 IgG (2.0 μg ml−1), SAB-PO kit (Nichirei) and 3,3′-diaminobenzidine (Sigma). Ultrathin sections were prepared with an ultramicrotome (Leica Ultracut UCT) and stained with 2% uranyl acetate. Electron micrographs were taken with an H-7100 electron microscope (Hitachi).
Acknowledgments
We thank N. Heintz (Columbia University, New York) for providing BAC cloning reagents, B. Glick (University of Chicago) for the DsRed-T1 cDNA, W.B. Stallcup (Burnham Institute, San Diego) for antibodies to NG2 and PDGFαR, M.H. Bhat (University of North Carolina, Chapel Hill) for antibodies to Caspr, R. Edwards (University of California, San Francisco) for VGLUT1+/+ and VGLUT1−/− tissue, N. Nishiyama for assistance with PCR and mouse breeding, the IVAX Drug Research Institute for GYKI 53655, G. Ellis-Davies for MNI-d-aspartate, M. Watanabe for support and comments on the manuscript, J. Egen for assistance with confocal imaging and image analysis, and P. Somogyi for comments on the manuscript. This work was supported by the US National Institutes of Health grants NS051509 (D.E.B.), PAR-02-059 (D.E.B.) and NS049267 (A.N.), as well as by the March of Dimes (D.E.B.), NARSAD (D.E.B.), the National Multiple Sclerosis Society (A.N.) and the Medical Scientist Training Program (J.L.Z.).
Footnotes
Note: Supplementary information is available on the Nature Neuroscience website.
COMPETING INTERESTS STATEMENT
The authors declare that they have no competing financial interests.
References
- 1.Barbour B. An evaluation of synapse independence. J Neurosci. 2001;21:7969–7984. doi: 10.1523/JNEUROSCI.21-20-07969.2001. [DOI] [PMC free article] [PubMed] [Google Scholar]
- 2.Clancy B, Silva-Filho M, Friedlander MJ. Structure and projections of white matter neurons in the postnatal rat visual cortex. J Comp Neurol. 2001;434:233–252. doi: 10.1002/cne.1174. [DOI] [PubMed] [Google Scholar]
- 3.Kriegler S, Chiu SY. Calcium signaling of glial cells along mammalian axons. J Neurosci. 1993;13:4229–4245. doi: 10.1523/JNEUROSCI.13-10-04229.1993. [DOI] [PMC free article] [PubMed] [Google Scholar]
- 4.Fulton BP, Burne JF, Raff MC. Visualization of O-2A progenitor cells in developing and adult rat optic nerve by quisqualate-stimulated cobalt uptake. J Neurosci. 1992;12:4816–4833. doi: 10.1523/JNEUROSCI.12-12-04816.1992. [DOI] [PMC free article] [PubMed] [Google Scholar]
- 5.Karadottir R, Cavelier P, Bergersen LH, Attwell D. NMDA receptors are expressed in oligodendrocytes and activated in ischaemia. Nature. 2005;438:1162–1166. doi: 10.1038/nature04302. [DOI] [PMC free article] [PubMed] [Google Scholar]
- 6.Hassel B, Boldingh KA, Narvesen C, Iversen EG, Skrede KK. Glutamate transport, glutamine synthetase and phosphate-activated glutaminase in rat CNS white matter. A quantitative study. J Neurochem. 2003;87:230–237. doi: 10.1046/j.1471-4159.2003.01984.x. [DOI] [PubMed] [Google Scholar]
- 7.Follett PL, Rosenberg PA, Volpe JJ, Jensen FE. NBQX attenuates excitotoxic injury in developing white matter. J Neurosci. 2000;20:9235–9241. doi: 10.1523/JNEUROSCI.20-24-09235.2000. [DOI] [PMC free article] [PubMed] [Google Scholar]
- 8.Butt AM, et al. Cells expressing the NG2 antigen contact nodes of Ranvier in adult CNS white matter. Glia. 1999;26:84–91. [PubMed] [Google Scholar]
- 9.Bergles DE, Roberts JD, Somogyi P, Jahr CE. Glutamatergic synapses on oligodendrocyte precursor cells in the hippocampus. Nature. 2000;405:187–191. doi: 10.1038/35012083. [DOI] [PubMed] [Google Scholar]
- 10.Lin SC, et al. Climbing fiber innervation of NG2-expressing glia in the mammalian cerebellum. Neuron. 2005;46:773–785. doi: 10.1016/j.neuron.2005.04.025. [DOI] [PubMed] [Google Scholar]
- 11.Yang XW, Model P, Heintz N. Homologous recombination based modification in Escherichia coli and germline transmission in transgenic mice of a bacterial artificial chromosome. Nat Biotechnol. 1997;15:859–865. doi: 10.1038/nbt0997-859. [DOI] [PubMed] [Google Scholar]
- 12.Lin SC, Bergles DE. Physiological characteristics of NG2-expressing glial cells. J Neurocytol. 2002;31:537–549. doi: 10.1023/a:1025799816285. [DOI] [PubMed] [Google Scholar]
- 13.Jacobson S, Trojanowski JQ. The cells of origin of the corpus callosum in rat, cat and rhesus monkey. Brain Res. 1974;74:149–155. doi: 10.1016/0006-8993(74)90118-8. [DOI] [PubMed] [Google Scholar]
- 14.Aram JA, Lodge D. Validation of a neocortical slice preparation for the study of epileptiform activity. J Neurosci Methods. 1988;23:211–224. doi: 10.1016/0165-0270(88)90005-2. [DOI] [PubMed] [Google Scholar]
- 15.Capogna M, Gahwiler BH, Thompson SM. Calcium-independent actions of alpha-latrotoxin on spontaneous and evoked synaptic transmission in the hippocampus. J Neurophysiol. 1996;76:3149–3158. doi: 10.1152/jn.1996.76.5.3149. [DOI] [PubMed] [Google Scholar]
- 16.Malgaroli A, DeCamilli P, Meldolesi J. Distribution of alpha latrotoxin receptor in the rat brain by quantitative autoradiography: comparison with the nerve terminal protein, synapsin I. Neuroscience. 1989;32:393–404. doi: 10.1016/0306-4522(89)90088-2. [DOI] [PubMed] [Google Scholar]
- 17.Hanse E, Gustafsson B. Quantal variability at glutamatergic synapses in area CA1 of the rat neonatal hippocampus. J Physiol (Lond) 2001;531:467–480. doi: 10.1111/j.1469-7793.2001.0467i.x. [DOI] [PMC free article] [PubMed] [Google Scholar]
- 18.Bruns D, Riedel D, Klingauf J, Jahn R. Quantal release of serotonin. Neuron. 2000;28:205–220. doi: 10.1016/s0896-6273(00)00097-0. [DOI] [PubMed] [Google Scholar]
- 19.Volterra A, Meldolesi J. Astrocytes, from brain glue to communication elements: the revolution continues. Nat Rev Neurosci. 2005;6:626–640. doi: 10.1038/nrn1722. [DOI] [PubMed] [Google Scholar]
- 20.Zhou Q, Petersen CC, Nicoll RA. Effects of reduced vesicular filling on synaptic transmission in rat hippocampal neurones. J Physiol (Lond) 2000;525:195–206. doi: 10.1111/j.1469-7793.2000.t01-1-00195.x. [DOI] [PMC free article] [PubMed] [Google Scholar]
- 21.Wadiche JI, Arriza JL, Amara SG, Kavanaugh MP. Kinetics of a human glutamate transporter. Neuron. 1995;14:1019–1027. doi: 10.1016/0896-6273(95)90340-2. [DOI] [PubMed] [Google Scholar]
- 22.Hestrin S, Sah P, Nicoll RA. Mechanisms generating the time course of dual component excitatory synaptic currents recorded in hippocampal slices. Neuron. 1990;5:247–253. doi: 10.1016/0896-6273(90)90162-9. [DOI] [PubMed] [Google Scholar]
- 23.Fellin T, et al. Neuronal synchrony mediated by astrocytic glutamate through activation of extrasynaptic NMDA receptors. Neuron. 2004;43:729–743. doi: 10.1016/j.neuron.2004.08.011. [DOI] [PubMed] [Google Scholar]
- 24.Young SH, Poo MM. Spontaneous release of transmitter from growth cones of embryonic neurones. Nature. 1983;305:634–637. doi: 10.1038/305634a0. [DOI] [PubMed] [Google Scholar]
- 25.Shen K, Bargmann CI. The immunoglobulin superfamily protein SYG-1 determines the location of specific synapses in C. elegans. Cell. 2003;112:619–630. doi: 10.1016/s0092-8674(03)00113-2. [DOI] [PubMed] [Google Scholar]
- 26.Huang JK, et al. Glial membranes at the node of Ranvier prevent neurite outgrowth. Science. 2005;310:1813–1817. doi: 10.1126/science.1118313. [DOI] [PubMed] [Google Scholar]
- 27.Olivares R, Montiel J, Aboitiz F. Species differences and similarities in the fine structure of the mammalian corpus callosum. Brain Behav Evol. 2001;57:98–105. doi: 10.1159/000047229. [DOI] [PubMed] [Google Scholar]
- 28.Westrum LE, Blackstad TW. An electron microscopic study of the stratum radiatum of the rat hippocampus (regio superior, CA 1) with particular emphasis on synaptology. J Comp Neurol. 1962;119:281–309. doi: 10.1002/cne.901190303. [DOI] [PubMed] [Google Scholar]
- 29.Preston RJ, Waxman SG, Kocsis JD. Effects of 4-aminopyridine on rapidly and slowly conducting axons of rat corpus callosum. Exp Neurol. 1983;79:808–820. doi: 10.1016/0014-4886(83)90044-4. [DOI] [PubMed] [Google Scholar]
- 30.Lamantia AS, Rakic P. Cytological and quantitative characteristics of four cerebral commissures in the rhesus monkey. J Comp Neurol. 1990;291:520–537. doi: 10.1002/cne.902910404. [DOI] [PubMed] [Google Scholar]
- 31.Stallcup WB. The NG2 proteoglycan: past insights and future prospects. J Neurocytol. 2002;31:423–435. doi: 10.1023/a:1025731428581. [DOI] [PubMed] [Google Scholar]
- 32.Ughrin YM, Chen ZJ, Levine JM. Multiple regions of the NG2 proteoglycan inhibit neurite growth and induce growth cone collapse. J Neurosci. 2003;23:175–186. doi: 10.1523/JNEUROSCI.23-01-00175.2003. [DOI] [PMC free article] [PubMed] [Google Scholar]
- 33.Yang Z, et al. NG2 glial cells provide a favorable substrate for growing axons. J Neurosci. 2006;26:3829–3839. doi: 10.1523/JNEUROSCI.4247-05.2006. [DOI] [PMC free article] [PubMed] [Google Scholar]
- 34.Morgenstern DA, et al. Expression and glycanation of the NG2 proteoglycan in developing, adult, and damaged peripheral nerve. Mol Cell Neurosci. 2003;24:787–802. doi: 10.1016/s1044-7431(03)00245-8. [DOI] [PubMed] [Google Scholar]
- 35.Stegmuller J, Werner H, Nave KA, Trotter J. The proteoglycan NG2 is complexed with α-amino-3-hydroxy-5-methyl-4-isoxazolepropionic acid (AMPA) receptors by the PDZ glutamate receptor interaction protein (GRIP) in glial progenitor cells. Implications for glial-neuronal signaling. J Biol Chem. 2003;278:3590–3598. doi: 10.1074/jbc.M210010200. [DOI] [PubMed] [Google Scholar]
- 36.Iino M, et al. Glia-synapse interaction through Ca2+-permeable AMPA receptors in Bergmann glia. Science. 2001;292:926–929. doi: 10.1126/science.1058827. [DOI] [PubMed] [Google Scholar]
- 37.Yuan X, Eisen AM, McBain CJ, Gallo V. A role for glutamate and its receptors in the regulation of oligodendrocyte development in cerebellar tissue slices. Development. 1998;125:2901–2914. doi: 10.1242/dev.125.15.2901. [DOI] [PubMed] [Google Scholar]
- 38.Barres BA, Raff MC. Proliferation of oligodendrocyte precursor cells depends on electrical activity in axons. Nature. 1993;361:258–260. doi: 10.1038/361258a0. [DOI] [PubMed] [Google Scholar]
- 39.Bengtsson SL, et al. Extensive piano practicing has regionally specific effects on white matter development. Nat Neurosci. 2005;8:1148–1150. doi: 10.1038/nn1516. [DOI] [PubMed] [Google Scholar]
- 40.Stevens B, Porta S, Haak LL, Gallo V, Fields RD. Adenosine: a neuron-glial transmitter promoting myelination in the CNS in response to action potentials. Neuron. 2002;36:855–868. doi: 10.1016/s0896-6273(02)01067-x. [DOI] [PMC free article] [PubMed] [Google Scholar]
- 41.Dawson MR, Polito A, Levine JM, Reynolds R. NG2-expressing glial progenitor cells: an abundant and widespread population of cycling cells in the adult rat CNS. Mol Cell Neurosci. 2003;24:476–488. doi: 10.1016/s1044-7431(03)00210-0. [DOI] [PubMed] [Google Scholar]
- 42.Chittajallu R, Aguirre A, Gallo V. NG2-positive cells in the mouse white and grey matter display distinct physiological properties. J Physiol (Lond) 2004;561:109–122. doi: 10.1113/jphysiol.2004.074252. [DOI] [PMC free article] [PubMed] [Google Scholar]
- 43.Gensert JM, Goldman JE. Heterogeneity of cycling glial progenitors in the adult mammalian cortex and white matter. J Neurobiol. 2001;48:75–86. [PubMed] [Google Scholar]
- 44.McDonald JW, Althomsons SP, Hyrc KL, Choi DW, Goldberg MP. Oligodendrocytes from forebrain are highly vulnerable to AMPA/kainate receptor-mediated excitotoxicity. Nat Med. 1998;4:291–297. doi: 10.1038/nm0398-291. [DOI] [PubMed] [Google Scholar]
- 45.Rossi DJ, Oshima T, Attwell D. Glutamate release in severe brain ischaemia is mainly by reversed uptake. Nature. 2000;403:316–321. doi: 10.1038/35002090. [DOI] [PubMed] [Google Scholar]
- 46.Micu I, et al. NMDA receptors mediate calcium accumulation in myelin during chemical ischaemia. Nature. 2006;439:988–992. doi: 10.1038/nature04474. [DOI] [PubMed] [Google Scholar]
- 47.Jahr CE. High probability opening of NMDA receptor channels by L-glutamate. Science. 1992;255:470–472. doi: 10.1126/science.1346477. [DOI] [PubMed] [Google Scholar]
- 48.Tillet E, Ruggiero F, Nishiyama A, Stallcup WB. The membrane-spanning proteoglycan NG2 binds to collagens V and VI through the central nonglobular domain of its core protein. J Biol Chem. 1997;272:10769–10776. doi: 10.1074/jbc.272.16.10769. [DOI] [PubMed] [Google Scholar]
- 49.Bhat MA, et al. Axon-glia interactions and the domain organization of myelinated axons requires neurexin IV/Caspr/Paranodin. Neuron. 2001;30:369–383. doi: 10.1016/s0896-6273(01)00294-x. [DOI] [PubMed] [Google Scholar]
- 50.Fukaya M, Watanabe M. Improved immunohistochemical detection of postsynaptically located PSD-95/SAP90 protein family by protease section pretreatment: a study in the adult mouse brain. J Comp Neurol. 2000;426:572–586. [PubMed] [Google Scholar]