

Abstract
Despite a long history of development, diagnostic tools for in vivo regional assessment of lungs in patients with pulmonary emphysema are not yet readily available. Recently, a new imaging technique, in vivo lung morphometry, was introduced by our group. This technique is based on MRI measurements of diffusion of hyperpolarized 3He gas in lung air spaces and provides quantitative in vivo tomographic information on lung microstructure at the level of the acinar airways. Compared with standard diffusivity measurements that strongly depend on pulse sequence parameters (mainly diffusion time), our approach evaluates a “hard number,” the average acinar airway radius. For healthy dogs, we find here a mean acinar airway radius of ~0.3 mm compared with 0.36 mm in healthy humans. The purpose of the present study is the application of this technique for quantification of emphysema progression in dogs with experimentally induced disease. The diffusivity measurements and resulting acinar airway geometrical characteristics were correlated with the local lung density and local lung-specific air volume calculated from quantitative computed tomography data obtained on the same dogs. The results establish an important association between the two modalities. The observed sensitivity of our method to emphysema progression suggests that this technique has potential for the diagnosis of emphysema and tracking of disease progression or improvement via a pharmaceutical intervention.
Keywords: hyperpolarized gases, magnetic resonance imaging, diffusion
Pulmonary emphysema, which is defined as “a condition of the lung characterized by abnormal, permanent enlargement of airspaces distal to the terminal bronchioles, accompanied by destruction of their walls, without fibrosis” (23), is a major medical problem worldwide. There are several conventional methods of diagnosing and evaluating emphysema: pulmonary function tests, chest radiography, and computed tomography (CT). These methods in general provide a gross assessment of the degree of emphysema and are used for qualitative, clinical applications. Pulmonary function tests are reportedly insensitive to early, mild changes of emphysema (24); the same is true for conventional chest radiography (25). CT is more sensitive in detecting early changes and local variations of emphysema (9, 10, 15, 17, 20), and it has shown good correlation with pathology specimens for assessing the degree of emphysema (7, 12, 18). However, CT cannot provide information on lung tissue microstructure and cannot readily distinguish between ventilated and nonventilated lung regions.
Magnetic resonance (MR) imaging of lung air spaces with hyperpolarized gases can provide new insights into lung physiology. In particular, diffusion lung imaging with hyperpolarized 3He gas has demonstrated substantial differences between the 3He gas apparent diffusion coefficient (ADC) in healthy and emphysematous lungs, both in humans (4, 21, 22, 26) and animals (rats with elastase-induced emphysema) (2, 19). This points to a large potential for identifying emphysema by means of hyperpolarized gas ADC measurements. However, before the technique can become a useful tool for characterizing emphysema, it is important to understand the relationship between the measured ADC and the underlying lung microstructure. Recently, an MR imaging technique, i.e., in vivo lung morphometry (27), was introduced by our group. In this approach, lung geometry at the acinar level was described in terms of cylindrical airways covered with alveolar sleeves, a model previously introduced by Haefeli-Bleuer and Weibel (11), as depicted in Fig. 1. The in vivo lung morphometry technique (27) is based on MRI measurements of anisotropic-restricted diffusion (along and perpendicular to the acinar airway axis) of hyperpolarized 3He atoms in lung air spaces and allows evaluation of acinar airway geometry and the integrity of alveolar walls. The method provides in vivo tomographic information on lung microstructure and may be considered as a virtual morphometry of the acinar airways without physically violating the lung parenchyma for tissue samples. The enlargement and destruction of the acini associated with emphysema increases the apparent diffusivity of the 3He gas. This alteration in diffusivity, along with ventilation images obtained with 3He spin density MRI, may be used to assess the structure-function relationship of the lung; the quantitative values can be used to follow the natural history of emphysema progression and treatment outcome.
Fig. 1.

Schematic structure of two levels of respiratory airways. Open spheres represent alveoli forming an alveolar sleeve around each airway. Each respiratory airway can be considered geometrically as a cylindrical object consisting of a tube embedded in the alveolar sleeve. The diagram defines inner (r) and outer radii (R) (as in Fig. 1 in Ref. 11). Inset: schematic representation of the structure of the same airways in emphysema, scaled down for clarity.
The purpose of the present study is the application of the in vivo lung morphometry technique (27) for evaluation of emphysema progression in dogs with experimentally induced emphysema and in healthy controls. The diffusivity measurements and the acinar airway geometrical characteristics so determined were correlated with quantitative CT measurements in the same dogs, providing an important association between two modalities.
MATERIALS AND METHODS
The experiments reported here are based on five mongrel dogs (weight between 18 and 20 kg). All of the procedures used were approved by the institutional animal studies committee.
Animal preparation
Emphysema was induced in only the right lungs of dogs, according to a previously developed protocol (3). In brief, porcine pancreatic elastase was instilled through one side of a specially designed, double-lumen tube that allows separate ventilation of each lung. The right lung was made to be atelectatic to facilitate a deep penetration of the elastase into the lung parenchyma. The right lung was first ventilated with 100% oxygen. Then the ventilation was suspended for 10 min. During the suspension, the alveolar oxygen in the right lung was absorbed by continued blood flow to the lung. As a result, the right lung became completely atelectatic. During the procedure, anesthesia was maintained with intravenous thiopental. The left lungs were left untreated, allowing them to be used as in situ controls for experiments in each animal.
A total of five mongrel dogs were included in the study. One of the dogs was imaged only at baseline (no emphysema induction). Two dogs underwent a three-step series of emphysema induction. In these two dogs, imaging was performed at baseline and 4–6 wk after each emphysema induction procedure (this time period between emphysema induction and imaging allowed the inflammatory reaction from emphysema induction to resolve). The remaining two dogs were imaged only after several treatments for emphysema induction (three for one dog and six for the other). This allowed us to obtain measurements for a broad range of lung conditions, from healthy to severe emphysema.
Hyperpolarized 3He gas preparation and delivery
For each study, a 500-ml bolus of hyperpolarized 3He gas with 35–50% polarization was prepared using a home-built apparatus (16). It was mixed in a flexible plastic bag with ~300 ml of N2 to ensure sufficient gas for inspiration. The dogs were ventilated on air with a mechanical piston-cylinder ventilator through a cuffed endotracheal tube, anesthetized with isoflurane and propofol, and monitored with pulse oximetry via the tongue. At a lung volume of approximately functional residual capacity, the mechanical ventilator was halted, and ~200 ml of air were removed from the lungs by opening valves to a partially evacuated 2-liter container; pressures during this maneuver were never below −5 cmH2O. The container was removed from the circuit, and the gas mixture was then delivered by manually squeezing the 3He/N2-containing bag (maximum distending pressure of 15 cmH2O). This procedure ensured that approximately the same lung volume (within 100 ml) was achieved during CT and MR imaging.
MR studies
A home-built, 30-cm-diameter double-tuned radio-frequency Helmholtz coil operating at 63.63 MHz (1H) and 48.47 MHz (3He) was used with a 1.5-T whole body Magnetom Vision Scanner (Siemens, Erlanger, Germany). Twenty-five transverse 5-mm slices of proton scout images were obtained to localize the area of the lung. 3He diffusion lung scans with nine b values were obtained within an ~30-s breath hold from five transverse slices [the corresponding b values are 0.001, 0.95, 1.9, 2.85, 3.8, 4.75, 5.7, 6.65, and 7.6 s/cm2, and the shape of the gradient waveform was identical to one used previously (27)]. The diffusion gradient was applied perpendicular to the long axis of the body. Images were 20 mm thick, with an in-plane resolution of 5 × 5 mm (160 × 320 mm field of view with 32 × 64 matrix). The gradient echo time in all sequences was 7.2 ms. Each of the 32 lines in k-space uses a radio-frequency excitation pulse with a flip angle of ~3.5°, allowing for repeated acquisition from the same hyperpolarized spins. This protocol provided signal-to-noise ratio (SNR) of ~100 in the first image, corresponding to the smallest b value, which is sufficient for model parameter estimation.
MR image analysis
Data were analyzed with locally designed software, based on a previously proposed theoretical model of gas diffusion in the lung (27). In this model, lung geometry at the acinar level was described in terms of cylindrical airways covered by alveolar sleeves (11), as depicted in Fig. 1. Diffusion in each acinar airway was considered anisotropic and characterized by a longitudinal diffusion coefficient along the cylindrical axis, DL, and a diffusion coefficient transverse to the axis, DT. Given that a large number of acinar airways with different directions reside in each imaging voxel, the total MR signals can be expressed as a sum of the signals from airways with an isotropic distribution of directions, leading to the following analytical expression (27):
| (1) |
Here, S0 is the MR signal intensity in the absence of diffusion sensitizing gradients, Φ(x) is the error function, and the anisotropy of the diffusion coefficient DAN is
| (2) |
Hence, this model allows extraction of the microscopically DAN in lung airways, despite the macroscopically nearly isotropic nature of the lung and despite the airways being too small to be resolved by direct imaging. Equation 1 describes the non-monoexponential dependence of diffusion attenuated signal on b value. Hence, the ADC, defined as ADC = −ln (S/S0)/b, is a function of b value. It can be easily demonstrated that, for small b values, ADC coincides with mean diffusion coefficient (DM):
| (3) |
The DM value reported by our method is related to ADC measurements reported previously (i.e., Refs. 2, 21, 22). However, the previous work employed only two b values and effectively assumed exponential signal decay as a function of b through the diffusion-sensitizing gradient strength. As is evident from the present results and analysis, the ADC in lungs determined from the two-b method depends on b value and approaches the true orientation-average value DM from below, only in the limit of small b. The DM values reported herein provide a more objective result because they do not depend on the diffusion-sensitizing gradient strength.
For 3He diffusion, MR image analysis, nine b-value images were utilized. The theoretical model, Eq. 1, was fit to the data on a pixel-by-pixel basis using Bayesian probability theory, and maps of DT, DL, and DM were generated. To reduce the influence of noise on our results, the minimum threshold value was set to three times the value of noise (typical SNR for the image with minimum b value was 35–40). Thus only the pixels that had signal values in the largest b-value image greater than three times the value of noise were considered for all b-value images. The mean external radii (R) of acinar airways (see Fig. 1) in millimeters were calculated from DT using Equation 8 in Ref. 27 (see also Figs. 1 and 3 therein). This equation is rather complicated, and we do not reproduce it here. It was derived theoretically, and for a given gradient waveform establishes a unique relationship between transverse ADC DT (measured with our technique) and airway R.
Fig. 3.

Examples of diffusion-weighted 3He magnetic resonance (MR) lung images with b = 0.001, 2.85, and 5.7 s/cm2 (from left to right, first three columns) and corresponding CT images (fourth column). The top row displays images from bilateral healthy (nonemphysematous) canine lungs before any emphysema was induced. The bottom row displays images after three lavage treatments for emphysema induction to the RL (RLs and LLs are correspondingly on the right and left side of each image). Substantially stronger signal decay with increasing b value is seen in the emphysematous RL, reflecting a larger apparent diffusion coefficient. The heterogeneity of this decay suggests a distribution of disease severity across the RL.
CT studies
CT scans were performed using a four-channel multi-detector row CT scanner (Plus 4 volume zoom; Siemens Medical Systems, Iselin, NJ). The scan parameters include spiral scan mode, 120 kVp, 120 mA, and 4 × 2.5-mm collimation. The CT images were reconstructed with 3-mm section thickness, except for one set reconstructed with 5-mm section thickness. The dogs were anesthetized, intubated, and positioned prone during the CT scan (similar to the position for the MR scan). The scans were obtained at an end-inspiratory volume of 600 ml above functional residual capacity, using air delivered from a calibrated cylinder.
CT scan analysis
Analysis of CT images was carried out using Analyze 3.1 image analysis software program (Biomedical Imaging Resource, Mayo Foundation, Rochester, MN) and a home software for image registration. CT images were first registered against proton MR images that were acquired during the same MR imaging session and under the same breathing protocol as 3He MR images. Then the center position of each of the 20-mm 3He MR images was determined, and five 3-mm (three 5-mm in one case) CT images centered on this position were selected. They were combined together to create one 15-mm CT image for quantitative analysis. Because elastase-induced emphysema is a rather homogeneous disease, the choice of 15-mm CT slice provides reasonably accurate representation of X-ray attenuation in the selected lung region. On the other hand, the choice of 15-mm CT section vs. 20-mm 3He MR section minimizes errors due to imperfections in the registration procedure and provides better correlation of the anatomic levels on the two modalities. The lung region was segmented from the chest wall, mediastinal structures, and large blood vessels based on the frequency distribution curves of CT attenuation values. The pixels within the attenuation range of −1,000 to −500 Hounsfield units (HU) were considered lung parenchyma, as reported for segmentation of human lungs (5–7). The boundary of each right and left lung was manually outlined. Large airways (e.g., trachea and major bronchi) were excluded from the outlined boundaries. For untreated healthy right and left lungs and control healthy left lungs in treated dogs, the selected region of interest was simply the entire lung in the corresponding image. For elastase-treated right lungs, only focal areas with the SNR > 100 on the 3He images were selected. These were matched with the corresponding area in the CT image via developed image registration software. The CT attenuation values within each delineated lung parenchyma were converted to the specific volume of gas per gram of tissue, V, using Equation 1 from Refs. 5–7, 13:
| (4) |
where V values are the inverse of densities and are measured in ml/g. The V of the lung (tissue and gas; Vtissue & gas) was thus measured from CT as
| (5) |
The V of tissue was calculated as Vtissue = 1/ρtissue, where density of tissue was assumed to be ρtissue = 1.065 g/ml (13).
RESULTS
The canines were imaged at various stages of emphysema induction. Figure 2 demonstrates histograms of CT attenuation distribution for healthy untreated, emphysematous, and healthy control (the neighboring to emphysematous) lungs. The lower attenuation (more negative HU) in the emphysematous lungs is clear and as expected. We note a decrease in the volume of the healthy control lungs and a corresponding increase in their CT attenuation coefficient.
Fig. 2.

The frequency distribution curves of computed tomography (CT) Hounsfield units (HU), normalized to equal areas, demonstrate clear differences between the healthy and treated lungs. The untreated healthy lungs show a peak at −880 HU, whereas the healthy left lungs (LLs) of the treated dogs (healthy control) display a peak at −740 HU. The treated right lung (RL) group demonstrates a left shifted peak at −940 HU. For emphysematous and healthy control lungs, these HU values were measured in dogs with three or more lavage treatments.
Typical diffusion-attenuated MR images for both healthy and emphysematous lungs along with their corresponding CT images are displayed in Fig. 3. In the top row, the small diffusivity of the lungs in untreated dogs is demonstrated by the weak attenuation of signal intensity with increasing b value. In the bottom row with data from a dog with three lavage treatments, the larger diffusivity of the emphysematous lung and the smaller diffusivity of the untreated control lung are evident.
Typical dependence of diffusion-weighted MR signal on b value is demonstrated for healthy untreated, healthy control lungs, and lungs with emphysema of varying severity in Fig. 4. This figure clearly shows that the attenuation of hyperpolarized helium gas MR signal is substantially dependent on the severity of emphysema. There is very rapid signal decay in the case of diffusion of 3He molecules in free air, as can be obtained in the trachea. In contrast, the rate of signal decay in healthy control lungs is far slower. In between the two extremes are signal attenuation curves from normal healthy and emphysematous lungs from the same dog after each emphysema treatment, tentatively identified as being mild, moderate, or severely emphysematous.
Fig. 4.

Example of data obtained from regions of interest (ROIs) selected in 9 b-value MR diffusion images. Each ROI represents one lung in a selected slice. The solid line with stars is the case of freely diffusing 3He gas in air. All curves are normalized to the same initial amplitude of 100 units. The level of emphysema was tentatively assigned, according to the CT linear attenuation coefficient: control lung HU = −747, healthy lung HU = −786, mild emphysema HU = −776, moderate emphysema HU = −800, severe emphysema HU = −955, free diffusion in air HU = −1,000.
Two of the dogs were followed serially before and approximately 1 mo after each lavage. Figure 5 illustrates diffusion maps, proton density, and corresponding CT images from one of them. Baseline healthy diffusion MR maps (first column) display a relatively homogenous distribution of diffusion co-efficients. The corresponding CT images also display lung parenchyma that appears healthy, with no evidence of emphysema. After the first lavage (second column in Fig. 5), the CT images show some evidence of tissue destruction in the right lung. As in Fig. 3, nine b-value MR images demonstrate good gas distribution in both lungs on the initial b-value images (very small b value, so no diffusion weighting; images not shown). Increasing b-value images illustrate relatively faster signal decay in the regions, with greater tissue destruction in the right lung. This rapid signal decay is reflected in the nonhomogenous distributions in the right lung on MR diffusivity maps (Fig. 5). After three lavage treatments, the changes in 3He diffusivities and CT attenuation are yet more pronounced. In the third column of Fig. 5, regions of very low ventilation appear in the treated lung (similar to the low-intensity regions in the treated lung shown in Fig. 3, second row). They manifest as voids in diffusion maps because the low SNR does not allow accurate calculation of diffusion coefficients in these voxels. Hogg et al. (14) measured the pressure-volume curves of centrilobular emphysematous spaces and showed that they were so compliant that they became fully inflated at very low transpulmonary pressures. We suspect that the same is true here in that, if the emphysematous spaces are fully inflated and on the flat part of their pressure-volume curve, it takes large transpulmonary pressure to further inflate them when 3He gas is delivered. Our experiments on excised lungs (not shown here) demonstrate that such regions can actually be filled with the 3He gas after several inhalation/exhalation cycles.
Fig. 5.
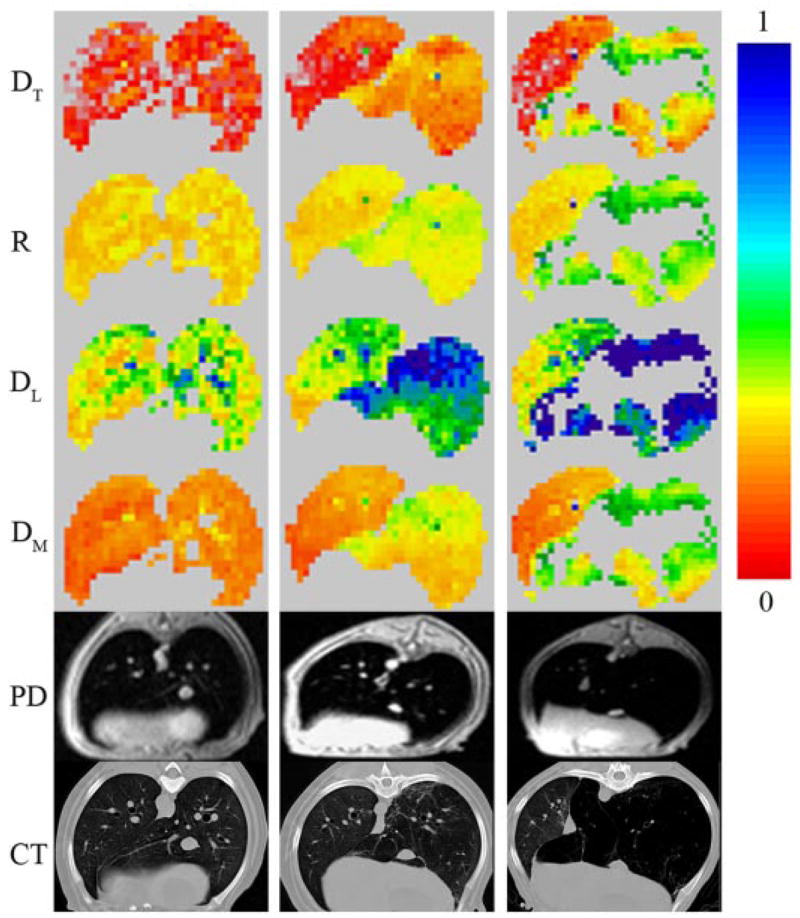
Example of 3He diffusivity maps (transverse DT, longitudinal DL, and mean DM in cm2/s), airway R map (in mm), proton density (PD) MRI, and CT images corresponding to the same anatomical level. All data are from the same dog. First column corresponds to baseline healthy lungs; second and third columns represent images after first and third lavage with elastase for emphysema induction in the RL. Scale on the color bar represents diffusivities in cm2/s and airway R in mm. Emphysema manifests as regions of increased airway R and diffusion coefficients in the RL, which worsen with additional lavages. Uncolored pixels on the diffusivity maps in the third column correspond to poorly ventilating lung regions with severe disease (diffusivity data from these regions are not available as 3He gas does not penetrate there at the initial inhalation).
Figure 6 illustrates values of 3He diffusivities, airway R, and lung-specific V from a serial follow-up in the same dog. This bar graph displays an increase in DT, DL, DM, R, and gas-specific V values from healthy to diseased lung. In contrast, if we look at the untreated left lung, its mean specific V decreases slightly after each treatment (the compliant emphysematous right lung reduces the transpulmonary pressure gradient, leading to effective “underinflation” of healthy control lung), while the 3He diffusivity values and, therefore, the airway R tend to remain relatively constant within experimental error.
Fig. 6.

Example of the results of serial 3He and CT imaging data obtained from one of the dogs. DT, DL, and DM are in cm2/s, whereas R is of acinar airways in mm. Lung-specific volume V (ml gas/g tissue) was calculated from CT HU using Eq. 4. Each bar represents an average number for each value with standard deviation (variability measure) of that value for one whole lung. Results for V were divided by 20 for better representation.
Comparison of quantitative analysis of CT and diffusion MR images
Figure 7 demonstrates the relationship between mean values of DT, DL, DM, and R and gas-specific V. The specific V calculated from Eq. 4 is a physiologically meaningful parameter that allows easy calculation of regional and total lung V using X-ray linear attenuation coefficient obtained from CT data. Data for DT, DL, and DM were approximated by the following mathematical equations:
Fig. 7.

Scatter plots demonstrating relationships between DT, DL, and DM (in cm2/s), R (in mm), and specific V (ml gas/g tissue) for all dogs. *, Healthy lung in untreated dogs; □, control lung in treated dogs; and ▲, treated lung. Each data point in the graph represents a mean DT, DL, DM, R, and V value for a healthy or treated lung in a given slice at a specific time point in the treatment. Lines represent fitting curves, following Eqs. 6 and 7. The values of parameters transverse, longitudinal, and mean V (VT, VL, and VM, respectively; in ml/g) obtained by fitting Eqs. 6 are 86 (SD 3), 4.5 (SD 0.20), and 19.9 (SD 0.59), respectively; the parameter a in Eq. 7 is 0.162 (SD 0.001) (dimensionless). Treated lungs generally have larger specific V values and diffusion coefficients than the lungs of untreated dogs, whereas control lungs have smaller V values and coefficients.
| (6) |
Here D0 is the 3He-free diffusion coefficient in air (0.88 cm2/s), and VT, VL, and VM are phenomenological fitting parameters (transverse, longitudinal, and mean, respectively) with dimensions of specific V. These simple equations satisfy two important physical limiting requirements: 1) for fully compressed lung tissue when V → 0, distances between airway walls go to zero, and the diffusion coefficients should tend to zero; and 2) for very inflated lung tissue, as V grows toward infinity, the restrictions for gas diffusion disappear and the diffusion coefficients should tend to the free diffusion coefficient D0. The solid lines in Fig. 7 represent fitting curves following Eq. 6 and demonstrate good agreement with the experimental data. We note that there are many other mathematical expressions that satisfy the two physical requirements as V → 0 and V → ∞; however, the scatter of the data in Fig. 7 is large enough that other models are not considered here.
The relationship between airway R and gas-specific volume V can, in principle, be obtained using Eq. 6 for DT and the relationship between DT and airway R (Equation 8 in Ref. 27). However, here we will use a simplified phenomenological relationship based on scaling,
| (7) |
where a is a dimensionless parameter. This provides a good fit to the experimental data for healthy and emphysematous lungs, as shown in Fig. 7. The lung tissue density, ρtissue = 1.065 g/ml, is introduced to Eq. 7 for convenience.
Figure 8 also shows our results in a more conventional way, plotted directly as functions of HU. Fitting curves represent the same Eqs. 6 and 7, where specific V is defined as a function of HU according to Eq. 4, and the values of VT, VL, VM, and a are the same as in Fig. 7.
Fig. 8.

Scatter plots demonstrating relationships between DT, DL, DM (in cm2/s), R (in mm), and HU for all dogs. Each data point represents a mean value for a healthy or treated lung in a given slice at a specific time point in the treatment. *, Healthy lung in untreated dogs; □, untreated lung in treated dogs; ▲, treated lung. Treated lungs generally have larger diffusion coefficients and lower X-ray attenuations than the lungs of untreated dogs, while the control lungs have smaller diffusion coefficients and greater X-ray attenuations.
All fitting curves in Figs. 7 and 8 demonstrate good correlation (r2 = 0.71, 0.56, 0.54, and 0.56 for DT, DM, DL, and R, respectively) with experimental data. Among all of the diffusivity values, DT demonstrates the greatest change (4–5 times) from healthy to affected lung. Figure 8 also demonstrates a large interdog variability in HU values among healthy dogs. For the same data points, diffusivity values lie within a comparatively narrower range. In addition, a closer look at Figs. 7 and 8 in the emphysematous region demonstrates a few data points (from one dog) clearly deviating from the norm, showing change in diffusivities after one treatment but very little or no change in HU value.
DISCUSSION
Two modalities that work by entirely different physical processes were used to detect the presence and severity of emphysema and follow its progression. The X-ray attenuation determined by CT was employed to directly assess the density and specific V of the lungs, and the MRI technique, utilizing measurements of diffusion of spins of hyperpolarized 3He gas, was employed to estimate the airway microgeometry. A quantitative measure reflective of acinar airway size and morphometry contained within the corresponding voxel can be obtained by hyperpolarized 3He multi-b-value diffusion imaging during health and disease. It is expected that, after emphysema induction with porcine pancreatic elastase, there should be panacinar-like emphysema changes in the acinar airways and their alveolar sleeves. These alterations in shape and size should cause an increase in 3He diffusivity values in emphysematous regions of the lungs. Using our laboratory’s technique, in vivo lung morphometry (27), we quantified these changes in lung parenchyma of mongrel dogs and evaluated the R of the acinar airways in health and disease.
Our study demonstrates that DT, DL, DM, R, and specific V in healthy canine lungs are smaller than those in emphysema lungs. This result reflects that the alveoli of intact lung parenchyma are smaller, resulting in more restricted gas diffusion, in agreement with previous MR studies in humans (21, 22, 27). With progression of emphysema, the alveolar air space is enlarged, leading to the reduction in CT attenuation along with progressive increase in DT, DL, DM, R, and specific V. The overall correlation between CT attenuation and diffusivity values is good, but a closer look at the data shows that the healthy lungs show large intersubject variability in CT values, whereas the diffusivity values do not. For example, data in Fig. 8 demonstrate that DT for healthy subjects changes approximately between 0.02 and 0.04 cm2/s, which corresponds to ~12% of the DT dynamic range in all of the dogs. The same figure demonstrates that HU for healthy dogs changes approximately between −800 and −700, which corresponds to 40% of the whole dynamic range for all dogs. In addition (as previously pointed out), a twofold increase in the value of DT was observed after the first lavage treatment in one of the dogs without any significant change in HU value. These observations point to the fact that X-ray attenuation may be affected by various factors that are not directly associated with changes in the disease progression.
Comparing previously obtained results in healthy humans (DT in the range of 0.09 to 0.13 cm2/s and DM in the range of 0.16 to 0.23 cm2/s) (27) and our current results for dogs (DT in the range of 0.03 to 0.06 cm2/s and DM in the range of 0.13 to 0.2 cm2/s), we suggest that DT is much more sensitive to lung microstructural differences than the commonly used DM. Indeed, the data show the average value of DT to be 240% higher in healthy humans than in healthy dogs, whereas DM is only slightly increased (~15%) in healthy humans compared with healthy dogs. This result becomes even more convincing if we note that exactly the same parameters for diffusion times were used in the pulse sequences employed herein and in the human studies (27).
We specifically emphasize an important feature of our approach: the ability to evaluate a geometrical parameter of lung microstructure, the mean R of acinar airways (Fig. 1). Compared with ADC measurements that strongly depend on pulse sequence parameters (mainly diffusion time), the airway R is a “hard number” that directly reflects the size of acinar airways. For healthy dogs, our analysis yields a mean acinar airway R of ~0.3 mm compared with 0.36 mm in healthy humans. While human data are in good agreement with previous direct measurements (11), to the best of our knowledge, there are no data for canine acinar airway geometry available for comparison.
We note that the theoretical model (27) that we have used for analysis is based on the description of lungs in terms of airways covered with alveolar sleeves (see Fig. 1) as proposed by Haefeli-Bleuer and Weibel (11) for healthy lungs. We can expect that this model can also be applied for initial stages of emphysema when only minor deformation and destruction of acinar airways and alveoli take place. With the further progression of emphysema, acinar airways become enlarged and alveolar walls undergo destruction; hence, the description of acinar airways in terms of cylinders covered with alveolar sleeves becomes less accurate (8, 27). Hence, in these cases, the parameters DT, DL, and R, as determined by our method, can only be considered as apparent. As we demonstrated herein, the values of these parameters increase with emphysema progression; consequently, they still can characterize the level of emphysema and serve as biomarkers of emphysema evolution.
The phenomenological Eqs. 6 and 7 arising from the comparison of diffusion measurements of lung microstructure and CT measurements of lung density and inflation V (ml/g) (Figs. 7 and 8) can be used to estimate the microstructure of the acinar airways and the regional and overall specific V of the lung at which the scan was obtained. With progression of emphysema, there is an observed increase in DM of 3He gas, which is associated with an increase in specific lung V and acinar airway R. On a slice-by-slice comparison, the healthy lungs show reduced scatter, i.e., less variability in diffusivity and regional lung V values. As emphysema progresses, this variability increases, amplifying the scatter. This finding is expected, as the general appearance of emphysema under magnification is extremely variable. It includes holes in the alveolar walls, coalescence of alveoli that form larger cavities. There are also groups of “intact” alveoli larger in size. This distention may be due to damage to elastin in the alveolar walls, making the walls weak before they break, or it is simply air trapping in those alveoli causing their distention (1).
The strong correlation between quantitative CT values and numbers obtained from measurement of multi-b-value diffusion MRI is important. CT is currently considered to be the best imaging option for diagnosis, quantification, and follow-up of emphysema. However, the presence of ionizing radiation limits its utility in following the progression of disease. Our in vivo lung morphometry technique, based on diffusion imaging, using hyperpolarized 3He gas (27), is, by contrast, free of ionizing radiation, and our results show that its value is well correlated with CT. In fact, it promises even improved results for diagnosis of emphysema; in addition to providing data concerning destruction of lung parenchyma, another advantage includes the identification of regions of poor lung ventilatory function. Therefore, not only can this technique be used for early diagnosis of emphysema, it also has potential for following disease progression or improvement via pharmaceutical treatments.
In conclusion, we suggest that the in vivo lung morphometry technique based on diffusion MRI with hyperpolarized 3He gas provides important regional information on lung microstructure and could potentially add to the evaluation of emphysema progression. It is safer and could be more sensitive for the diagnosis of emphysema than CT, especially at early stages of the disease.
Acknowledgments
The authors are grateful to Dr. James Quirk for valuable discussion and help with manuscript preparation, and T. D. Toeniskoetter and K. Chino for help with animal preparation and handling.
GRANTS
This work was supported by National Heart, Lung, and Blood Institute Grants R01 HL-70037 and R01 HL-062194.
References
- 1.Anderson AE, Jr, Foraker AG. Pathology of Disruptive Pulmonary Emphysema. Springfield, IL: Thomas; 1976. pp. 82–83. [Google Scholar]
- 2.Chen XJ, Hedlund LW, Moller HE, Chawla MS, Maronpot RR, Johnson GA. Detection of emphysema in rat lungs by using magnetic resonance measurements of 3He diffusion. Proc Natl Acad Sci USA. 2000;97:11478–11481. doi: 10.1073/pnas.97.21.11478. [DOI] [PMC free article] [PubMed] [Google Scholar]
- 3.Chino K, Choong CK, Toeniskoetter PD, Cooper JD, Lausberg HF, Bae KT, Pierce JA, Hogg JC. A canine model for production of severe unilateral panacinar emphysema. Exp Lung Res. 2004;30:319–332. doi: 10.1080/01902140490439022. [DOI] [PubMed] [Google Scholar]
- 4.Conradi MS, Yablonskiy DA, Woods JC, Gierada DS, Jacob RE, Chang YV, Choong CK, Sukstanskii AL, Tanoli T, Lefrak SS, Cooper JD. 3He diffusion MRI of the lung. Acad Radiol. 2005;12:1406–1413. doi: 10.1016/j.acra.2005.07.006. [DOI] [PMC free article] [PubMed] [Google Scholar]
- 5.Coxson HO, Hoggs JC, Mayo JR, Behzad H, Whittall KP, Schwartz DA, Hartley PG, Galvin JR, Wilson JS, Hunninghake GW. Quantification of idiopathic pulmonary fibrosis using computed tomography and histology. Am J Respir Crit Care Med. 1997;155:1649–1656. doi: 10.1164/ajrccm.155.5.9154871. [DOI] [PubMed] [Google Scholar]
- 6.Coxson HO, Mayo JR, Behzad H, Moore BJ, Verburgt LM, Staples CA, Pare PD, Hogg JC. Measurement of lung expansion with computed tomography and comparison with quantitative histology. J Appl Physiol. 1995;79:1525–1530. doi: 10.1152/jappl.1995.79.5.1525. [DOI] [PubMed] [Google Scholar]
- 7.Coxson HO, Rogers RM, Whittall KP, D’Yachkova Y, Pare PD, Sciurba FC, Hogg JC. A quantification of the lung surface area in emphysema using computed tomography. Am J Respir Crit Care Med. 1999;159:851–856. doi: 10.1164/ajrccm.159.3.9805067. [DOI] [PubMed] [Google Scholar]
- 8.Fichele S, Paley MN, Woodhouse N, Griffiths PD, van Beek EJ, Wild JM. Investigating 3He diffusion NMR in the lungs using finite difference simulations and in vivo PGSE experiments. J Magn Reson. 2004;167:1–11. doi: 10.1016/j.jmr.2003.10.019. [DOI] [PubMed] [Google Scholar]
- 9.Gevenois PA, Yernault JC. Can computed tomography quantify pulmonary emphysema? Eur Respir J. 1995;8:843–848. [PubMed] [Google Scholar]
- 10.Goddard PR, Nicholson EM, Laszlo G, Watt I. Computed tomography in pulmonary emphysema. Clin Radiol. 1982;33:379–387. doi: 10.1016/s0009-9260(82)80301-2. [DOI] [PubMed] [Google Scholar]
- 11.Haefeli-Bleuer B, Weibel ER. Morphometry of the human pulmonary acinus. Anat Rec. 1988;220:401–414. doi: 10.1002/ar.1092200410. [DOI] [PubMed] [Google Scholar]
- 12.Hayhurst MD, MacNee W, Flenley DC, Wright D, McLean A, Lamb D, Wightman AJ, Best J. Diagnosis of pulmonary emphysema by computerised tomography. Lancet. 1984;2:320–322. doi: 10.1016/s0140-6736(84)92689-8. [DOI] [PubMed] [Google Scholar]
- 13.Hogg JC, Nepszy S. Regional lung volume and pleural pressure gradient estimated from lung density in dogs. J Appl Physiol. 1969;27:198–203. doi: 10.1152/jappl.1969.27.2.198. [DOI] [PubMed] [Google Scholar]
- 14.Hogg JC, Nepszy SJ, Macklem PT, Thurlbeck WM. Elastic properties of the centrilobular emphysematous space. J Clin Invest. 1969;48:1306–1312. doi: 10.1172/JCI106097. [DOI] [PMC free article] [PubMed] [Google Scholar]
- 15.Kreel L. Computer tomography of the thorax. Radiol Clin North Am. 1978;16:575–584. [PubMed] [Google Scholar]
- 16.Leawoods JC, Yablonskiy DA, Saam B, Gierada DS, Conradi MS. Hyperpolarized 3He gas production and MR imaging of the lung. Concepts Magn Reson. 2001;13:277–293. [Google Scholar]
- 17.Morgan MD, Strickland B. Computed tomography in the assessment of bullous lung disease. Br J Dis Chest. 1984;78:10–25. [PubMed] [Google Scholar]
- 18.Muller NL, Staples CA, Miller RR, Abboud RT. “Density mask”. An objective method to quantitate emphysema using computed tomography. Chest. 1988;94:782–787. doi: 10.1378/chest.94.4.782. [DOI] [PubMed] [Google Scholar]
- 19.Peces-Barba G, Ruiz-Cabello J, Cremillieux Y, Rodriguez I, Dupuich D, Callot V, Ortega M, Rubio Arbo ML, Cortijo M, Gonzalez-Mangado N. Helium-3 MRI diffusion coefficient: correlation to morphometry in a model of mild emphysema. Eur Respir J. 2003;22:14–19. doi: 10.1183/09031936.03.00084402. [DOI] [PubMed] [Google Scholar]
- 20.Rosenblum LJ, Mauceri RA, Wellenstein DE, Bassano DA, Cohen WN, Heitzman ER. Computed tomography of the lung. Radiology. 1978;129:521–524. doi: 10.1148/129.2.521. [DOI] [PubMed] [Google Scholar]
- 21.Saam BT, Yablonskiy DA, Kodibagkar VD, Leawoods JC, Gierada DS, Cooper JD, Lefrak SS, Conradi MS. MR imaging of diffusion of (3)He gas in healthy and diseased lungs. Magn Reson Med. 2000;44:174–179. doi: 10.1002/1522-2594(200008)44:2<174::aid-mrm2>3.0.co;2-4. [DOI] [PubMed] [Google Scholar]
- 22.Salerno M, de Lange EE, Altes TA, Truwit JD, Brookeman JR, Mugler JP., 3rd Emphysema: hyperpolarized helium 3 diffusion MR imaging of the lungs compared with spirometric indexes–initial experience. Radiology. 2002;222:252–260. doi: 10.1148/radiol.2221001834. [DOI] [PubMed] [Google Scholar]
- 23.Snider GL, Kleinerman J, Thurlbeck WM, Bengali ZH. The definition of emphysema. Report of a National Heart, Lung, and Blood Institute, Division of Lung Diseases workshop. Am Rev Respir Dis. 1985;132:182–185. doi: 10.1164/arrd.1985.132.1.182. [DOI] [PubMed] [Google Scholar]
- 24.Thurlbeck WM. Overview of the pathology of pulmonary emphysema in the human. Clin Chest Med. 1983;4:337–350. [PubMed] [Google Scholar]
- 25.Thurlbeck WM, Simon G. Radiographic appearance of the chest in emphysema. AJR Am J Roentgenol. 1978;130:429–440. doi: 10.2214/ajr.130.3.429. [DOI] [PubMed] [Google Scholar]
- 26.Woods JC, Yablonskiy DA, Choong CK, Chino K, Pierce JA, Hogg JC, Bentley J, Cooper JD, Conradi MS, Macklem PT. Long-range diffusion of hyperpolarized 3He in explanted normal and emphysematous human lungs via magnetization tagging. J Appl Physiol. 2005;99:1992–1997. doi: 10.1152/japplphysiol.00185.2005. [DOI] [PMC free article] [PubMed] [Google Scholar]
- 27.Yablonskiy DA, Sukstanskii AL, Leawoods JC, Gierada DS, Bret-thorst GL, Lefrak SS, Cooper JD, Conradi MS. Quantitative in vivo assessment of lung microstructure at the alveolar level with hyper-polarized 3He diffusion. MRI Proc Natl Acad Sci USA. 2002;99:3111–3116. doi: 10.1073/pnas.052594699. [DOI] [PMC free article] [PubMed] [Google Scholar]