

Abstract
Causal coherence and generalized synchronization (GS) index were extracted from beat-to-beat mean intracranial pressure (ICP) and intervals between consecutive normal sinus heart beats (RR interval) that were recorded from 12 patients undergoing normal pressure hydrocephalus diagnosis. Data were organized into two groups including an ICP B-Wave group and a baseline control group. Maximal classic coherence (CC) between ICP and RR interval within [0.04, 0.15] Hz was found to be significantly greater than zero for both B-Wave and control groups with B-Wave CC greater than that of the baseline group. Causal coherence analysis further revealed that feedforward coherence due to RR interval’s effect on ICP always exists for both B-Wave and baseline ICP state and no significant difference exists between two groups. On the other hand, feedback coherence from ICP to RR interval was enhanced during the occurrence of B-Wave. This finding regarding the enhanced directional, from ICP to RR interval, coupling between ICP and RR interval was also confirmed by a modified GS measure.
Index Terms: B wave, causal spectral analysis, generalized synchronization, HRV, intracranial pressure
I. INTRODUCTION
Intracranial pressure (ICP) is an important physiological signal for the diagnosis and management of patients of various neurosurgical and neurological diseases including brain injury, stroke and hydrocephalus. ICP is the intracranial response to cardiovascular volumetric load and, thus, contains information for characterizing the dynamics of the tightly coupled cerebrospinal fluid (CSF) and cerebral blood flow (CBF) circulatory systems in both normal and diseased states. Despite the great potential of using ICP to study the above physiological systems, the most popular ICP measure used by clinicians is still its mean value over certain period of time. Hence, subtle but potentially critical information is often lost due to this simple processing of ICP signal. Encouragingly, computerized processing of ICP has become increasingly popular and sophisticated as evidenced by several recent publications [1]–[3] that introduced novel methods for ICP signal processing. These recent efforts demonstrated that much information could be extracted by an integrative analysis of ICP with other related signals including arterial blood pressure (ABP) and cerebral blood flow velocity (CBFV). These information may be pertinent to characterizing the CBF autoregulation efficiency [2] and quantifying the compliance of cerebrospinal space [3]. To continue this trend of integrative analysis of ICP, the present work aims to characterize the interdependency between ICP and heart rate variability (HRV) signals using recently introduced methods of causal spectral analysis [4]–[7] and generalized synchronization (GS) [8]–[10].
Variability of the intervals between consecutive normal sinus heart beats (RR intervals) is a widely used equivalent measure of HRV and will be used in the present work. However, RR interval, a signal reflecting heart beat dynamics, may be deceivably thought of being remotely, if at all, related to ICP that is recorded within the head (either the ventricles or the parenchyma). In fact, an integrative analysis of ICP and RR interval is well justified. First of all, elevated ICP may have profound effects on the autonomic nervous system (ANS). Both human and animal studies suggest the possibility of ICP, or related, sensory systems in the brainstem [11], [12], the hypothalamic nuclei [13] and the spinal cord [14]. These sensory systems may function as intracranial Baroreflex receptors. Markedly elevated ICP is a known cause of severe bradycardia and systolic hypertension, a well-known phenomenon called the Cushing reflex [15]. The possibility for such an ICP feedback on the functioning of the automatic nervous system has been further indicated by cardiac abnormalities associated with subarachnoid hemorrhage (SAH) [16] and those encountered during acute ICP increase in humans [17]–[19] and animals [20]. RR interval variability, as an indirect but sensitive measure of the ANS activity, can provide objective information regarding ICP’s effect on the functioning of ANS. Second, beat-to-beat variations of systemic ABP are affected by RR interval changes. They in sequel alter the volumetric load to the intracranial space. Hence, slow (less than heart rate) ICP dynamics may be related to heart beat dynamics. In summary, both cardio-cerebral and cerebro-cardiac interactions are anticipated. This inherent interactive nature between RR interval and beat-to-beat ICP justifies the adoption of analysis methods that can not only quantify the degree of interaction but also its direction. In light of this, the causal spectral analysis and the GS analysis were used for studying interaction between variations of beat-to-beat ICP and RR interval.
Causal spectral analysis was originally introduced for processing of RR interval and beat-to-beat systemic blood pressure [4]. Traditional spectral analysis methods can only compute the linear coherence between two signals as a function of frequency while the causal approach is additionally able to differentiate between the direction of coupling. This property makes it suitable for analyzing signals from coupled dynamic systems. Even though this approach assumes a linear time-invariant dynamic system for signal generation, it has been demonstrated to be effective in illustrating the complex interactions among HRV, ABP and respiratory signals [6] and in characterizing the Baroreflex effect [4]. ICP’s spectral contents are similar to those of ABP, therefore, the causal spectral analysis is expected to be applicable for analyzing RR interval and beat-to-beat ICP changes.
Measures of GS between two signals are also capable of differentiating between the direction of coupling. In addition, they can deal with both linear and nonlinear signal generation systems. A recent extension to a robust way of calculating GS from measured data has been proposed by our group [10] and shown to be useful in characterizing autoregulation status using slow spontaneous ABP and CBFV signals. This new GS measure is preferred because it was demonstrated to be more consistent than several existing GS measures, which were investigated in [21], in differentiating the direction of coupling when driver and response systems have different complexity [10]. The incorporation of this method in the present work may, thus, complement the causal spectral analysis because of its insensitiveness to the linear dynamic system assumption.
As a nonintrusive condition for studying the cardio-cerebral interaction, episodes of ICP B-Wave provide ideal materials for testing the above methods. ICP B-Wave was first described by Lundberg in 1960s [22] as a rhythmic spontaneous oscillation of ICP with a duration of 0.5–2 min. Oscillations with similar frequencies to ICP B-Wave have been observed in other physiological signals, both intracranial and extracranial ones. CBFV through large cerebral arteries has demonstrated B-Wave-like oscillations [23], [24]. Local CBFV at small cerebral arteries, measured using Laser Doppler, has also provided evidence for the existence of similar oscillatory activity [25], [26]. Animal studies have directly established the existence of oscillations of pial arterial diameters of cats that were synchronized with ICP B-Wave [27]. These demonstrations of B-Wave-like patterns in cerebral hemodynamic variables including CBFV and vessel diameters support the concept that ICP B-Wave is related to cerebral vascular dynamics. Given these cardio and cerebral vascular relevances of ICP B-Wave, application of the integrative analysis of ICP and RR interval signals to B-Wave episodes is particulary appropriate in validating the effectiveness of the methods on one hand and in discovering useful information regarding the interaction of ICP and RR interval variations on the other hand.
In the next section, a brief introduction of causal spectral analysis is first given followed by an introduction of a modified GS measure. A numerical experiment on the modified GS measure will be first introduced and then results from applying these two analytical methods to patient data will be presented in Section Results. Finally, evaluation of the findings in the present work, the pathophysiological implications of characterizing interdependency between ICP and RR interval, and some methodological issues will follow in Section Discussion.
II. Methods
A. Causal Spectral Analysis
1) Bivariate Autoregressive Model and Spectral Analysis
Causal spectral analysis starts with the classic parametric cross-spectral analysis. A bivariate autoregressive model (AR) is used to model a vector time series (xn) such that
| (1) |
where is AR coefficient matrix and p is the mode order. wn represents a white noise series and is uncorrelated with x.
Given this model structure, the transfer matrix H(f) in the frequency domain (f) can be calculated as
| (2) |
where I is the identity matrix and
| (3) |
Then the PSD matrix P(f) is obtained as
| (4) |
| (5) |
where Σ is the covariance matrix of white noise wn
The classic coherence (CC) CC(f) is then calculated as
| (6) |
Denote nth sample of ICP signal as icpn and nth sample of RR interval as rrn, xn is arranged as in the present work. Therefore, the causal coherence when RR interval changes ICP without any feedback from ICP can be obtained as
| (7) |
Similarly, causal coherence when ICP drives RR interval change can be obtained as
| (8) |
It should be noted that A(0) has a priori structure such that there is only one nonzero term in A(0) and that it should be located at an off-diagonal position [28]. As observed clinically, a prolonged RR interval would decrease diastolic ICP and, hence, mean ICP within the same RR interval. Therefore, the nonzero term is allocated to A12(0).
2) Model Order Selection
The combined information criterion (CIC) for vector AR model as proposed in [29] was adopted in the present work for model order selection. CIC was shown to be an optimal criterion in terms of balancing the penalty of model underfit and that of model overfit. CIC was calculated according to
| (9) |
where RES(k) is the determinant of the estimate covariance matrix of the residual vector of a kth order AR model, m is the dimension of vector time series and N is the total number of samples in fitting the model. vi is the finite sample variance coefficient and was given as
| (10) |
Based on CIC, the optimal order is determined as the k where CIC(k) is the minimum.
3) Detection of Zero Coherence
Based on the previous work [30], surrogate data was preferred for generating the zero coherence function for each data instance. Specifically, two univariate AR models were fitted to RR interval and beat-to-beat mean ICP series, respectively. Then multiple surrogate pairs were generated by simulating the resultant univariate AR models with different realizations of Gaussian white noise series whose variances were determined from the model fitting process. In the present work, 50 surrogate pairs were generated for each data instance and subjected to the same causal coherence analysis. The zero coherence threshold was set to 95th percentile of values calculated from surrogate data.
B. Modification of a Generalized Synchronization Measure
In this section, vectors are denoted using bold lower case and matrices are denoted using upper case letters. Let dn,j denote the time index of the jth nearest neighbor point of x(n) on the trajectory x(i), i = 1, …, Nx and rn,j the time index of the jth nearest neighbor point of y(n) on the trajectory y(i), i = 1, …, Ny. Nx and Ny are the number of samples for x and y.
Computation of a GS measure is based on comparison between a conditional neighbor and a true neighbor as originally proposed in [9]. Suppose that x(i) and y(i), i = 1, …, N are two reconstructed trajectories from two scalar measurements of two systems, respectively, then there are four k-nearest neighbors for any given time instant n: x(dn,j), x(rn,j), y(rn,j), and y(dn,j), j = 1, …, k. The former two are true neighbors of x and y, respectively. The last two are conditional neighbors. Based on these neighbors, various methods can be formulated to derive a single measure of the coupling strength. The C measure [10] was based on obtaining a complete geometric characterization of neighborhood matrices via their singular value decomposition (SVD)
| (11) |
| (12) |
| (13) |
| (14) |
where mx and my are the embedding dimensions of time series x and y, respectively. In general, the condition k > max(mx, my) is required. SVD of neighbor matrices reveals a complete geometric picture of them in the reconstructed phase space, which can be used for deriving a measure of coupling degree from a measure of the geometric closeness of a conditional neighbor and a true neighbor.
1) Ca Measure
A particular way of measuring the geometric closeness is to compare the alignment of the principal directions. Such a measure at time n can be defined succinctly as
| (15) |
and similarly y’s dependency on x as
| (16) |
where denotes the transpose of the ith column of matrix Ux and Ux|y(:, j) the jth column of Ux|y. wx|y(i, j) and wy|x(i, j) are weighting coefficient for the i, j pair, i and j are matched according to a paring algorithm. A convenient pairing algorithm is to pair columns of Ux and Ux|y based on the order of their corresponding singular values, which means that i and j are equal in the above definitions.
According to [2], weighting coefficients can be calculated as
| (17) |
and for y|x dependency as
| (18) |
where σx(i) is the ith diagonal entry of Σx and the same notation applies to σy(i), σx|y(j) and σy|x(j).
and can then be calculated as an average of corresponding and for a set of reference points, respectively.
2) Neighborhood Span Comparison
SVD not only reveals the axial directions of a neighborhood matrix but also the span of each direction as its corresponding singular value. The latter information has no effect on the original definition of the C measure. To gain a complete characterization of the geometric picture, this information should be captured as well. To proceed, associated with each paired columns of Ux and Ux|y, a ratio between their corresponding singular values is calculated as the degree of matching of the spans of these two directions. Hence, a similar measure to can be defined as
| (19) |
The superscript s in the above definition denotes a S measure derived from comparing the span of axial directions. In the same way, can be defined as
| (20) |
and can then be calculated as an average of and for a set of reference points, respectively.
3) Uniform Sampling of Trajectories
In this section, a uniform sampling of trajectories is introduced that is used when formulating a k-nearest neighbor. This is motivated for alleviating the undesired asymmetry between Cx|y and Cy|x that is caused by a nonuniform sampling of trajectories. More details regarding this problem are given in Appendix to focus on the content of this modification in this section.
To alleviate the unevenness of the number of nearest neighbor trajectories given the same number of nearest neighbor points, it is proposed that the neighborhood search be modified such that a fixed number of points are to be sampled from each trajectory that is found for requested number of neighborhood points. Hence, suppose that at a reference point n, xn has a larger number of neighbor trajectories than that of yn, the final number of trajectories used in SVD analysis will be equal to that of yn. In addition, nearest trajectories of xn will be first sampled. In situations where the number of final neighbor points is less than max(mx, my), the reference point xn and yn will be excluded from the averaging process of calculating the final C measure. In consequence, the effective number of neighborhood points could be different for different reference points.
C. Data Acquisition and Processing
Twelve patients who underwent pre-operative workup for diagnosing normal pressure hydrocephalus (NPH) showed prominent B-Wave episodes in their overnight recordings. Simultaneous ICP and ECG were acquired by using a mobile cart loaded with a PowerLab™ data acquisition system that interfaced with the Codman ICP Express Box and the GE bedside cardiovascular monitors. Signals were sampled at 400 Hz for a proper heart beat delineation. The insertion of ICP sensor and data acquisition were conducted with proper IRB approval and written consent from patients. Data were recorded as soon as possible after setting up the Codman ICP express box and lasted for 12 h until the morning on the second day after admission.
Overnight recordings were reviewed using the program Chart 5.0 to locate episodes of prominent B-Wave (amplitude > 5 mmHg). Chart was suitable for this visual inspection because of its versatile control of the temporal scale. One 5-min segment with B-Wave and one 5-min baseline segment that either preceded or followed the selected B-Wave segment were then exported for further processing. Consequently, the extracted segments were organized into two groups. The first group contains all segments with ICP B-Wave and the second group contains their corresponding baseline segments.
An automatic ICP latency analysis program [31] was used for an easy extraction of RR interval and beat-to-beat mean ICP series. This latency analysis program has a built-in safeguard for both missed and spuriously detected ECG beats. The resultant RR interval series were further visually inspected for removing any remaining outliers that were due to the presence of ectopic beats. As a quality control, counters of detected and removed beats were recorded and reported here. The resultant beat-to-beat series were then re-sampled at 2 Hz using cubic spline.
Classic coherence (CC), feedforward coherence (CCrr→icp), and feedback coherence (CCicp→rr) were calculated using the causal spectral analysis. The modified C measure was computed using the algorithm introduced above. Respiratory modulation could affect both ICP and RR interval. Due to the lack of recordings for respiration, coherence was only evaluated at the low-frequency spectrum, ranging from 0.04–0.15 Hz, following the same protocol used in [7]. Specifically, CCrr→icp and CCicp→rr were evaluated at the frequency where the CC is the maximum within the predefined low-frequency range. Determination of zero coherence was done by comparing all coherence values against the corresponding zero coherence function. To calculate the modified C measure, embedding parameters were determined using the same procedure in our previous study [2] for each segment.
III. RESULTS
A. Numerical Test
The modified C measure and the original one were calculated for the time series that were generated, as was done in [10], from the Rossler-Lorenz system [(22) and (21)] at 11 levels of coupling strength. Four different C measures were calculated that include the original C measure denoted as Cold, the modified C measure denoted as Cnew and its two components: Cs and Ca. Cs is based on the weighted ratio of axial span between a true and a conditional neighborhood while Ca is based on the weighted degree of alignment of axial direction between a true and a conditional neighborhood. Cnew was calculated as an average of Cs and Ca.
These four C measures are shown in Fig. 5, which shows the alleviation of the asymmetry of the C measure that is present when the two systems are not coupled. This is due to the adoption of the proposed uniform sampling of trajectories when building neighborhood matrices. Additionally, Cs andCa show different behaviors: Cs has a larger range for grading coupling strength; Ca is more consistent in detecting the direction of coupling, i.e., the driving role of x is always detectable based on Ca because of .
Fig. 5.

Comparison of the original C measure with the modified C measure and its two components (Ca and Cs). They were calculated at 11 levels of coupling strength for the Rossler-Lorenz system. It is observed that the undesired bias when two systems are uncoupled has been effectively removed for the modified C measures. While Ca has the largest range for grading coupling strength, it is less robust in differentiating coupling direction for this unidirectionally coupled system.
B. Time Domain Summaries
Time domain summary statistics for each case are listed in Table I that include mean and standard deviation of ICP and RR intervals. A paired t-test indicated that mean ICP during B-Wave occurrences was significantly (p = 0.006) higher than the corresponding baseline value. This was the case for the standard deviation of ICP (p = 8E−6), i.e., oscillations of ICP during B-Wave have larger amplitudes than those in baseline. On the other hand, there was no significant difference (p = 0.63) of average RR intervals between B-Wave and baseline but the standard deviation of RR interval was significantly higher for the B-Wave group (p = 0.0014). The number of analyzed and detected beats for each case is also shown in the table. More than 95% of detected beats were analyzed except for case No. 5 where the patient had a large number of ectopic beats at both the B-Wave and the baseline states.
TABLE I.
list of time domain mean ICP and RR interval statistics
| ICP(mmHg) | RR(ms) | Beats | ||||
|---|---|---|---|---|---|---|
| Case No. | B-Wave | Baseline | B-Wave | Baseline | B-Wave | Baseline |
| 1 | 1.2± 1.8 | 0.3± 0.9 | 972.1± 33.3 | 962.4± 33.2 | 576/576 | 407/407 |
| 2 | 21.3± 6.0 | 4.9± 0.9 | 815.7± 46.2 | 777.5± 34.1 | 645/645 | 788/788 |
| 3 | 7.5± 3.8 | 8.0± 1.0 | 968.8± 30.9 | 1076.2± 12.1 | 583/583 | 545/545 |
| 4 | 8.1± 2.3 | 0.7± 0.5 | 784.5± 46.5 | 818.7± 19.2 | 572/572 | 576/576 |
| 5 | 8.1± 2.6 | 6.3± 0.9 | 873.8± 57.3 | 878.4± 25.4 | 480/571 | 524/582 |
| 6 | −0.2± 2.4 | 0.2± 1.0 | 751. 5± 47.9 | 724.8± 22.9 | 671/698 | 667/668 |
| 7 | 10.8± 4.4 | 7.8± 0.8 | 988. 1± 67.1 | 998.9± 33.5 | 620/623 | 529/529 |
| 8 | 7.8± 5.0 | 1.3± 1.2 | 898.3± 31.3 | 855.4± 35.3 | 677/677 | 555/572 |
| 9 | 2.2± 3.6 | 2.4± 1.4 | 1084.9± 74.9 | 1062.9± 29.8 | 538/538 | 580/580 |
| 10 | 1.8± 4.9 | −3.5± 1.2 | 821. 6± 35.0 | 841. 1± 24.2 | 416/418 | 437/439 |
| 11 | 19.9± 7.3 | 6.1± 2.2 | 1099.7± 74.8 | 1115.9± 80.5 | 368/368 | 571/572 |
| 12 | 17.0± 3.5 | 13.9± 1.0 | 838.9± 27.4 | 832.7±11.8 | 578/589 | 681/695 |
C. Power Spectral Analysis
Before running the causal spectral analysis, power spectral density (PSD) was calculated for ICP and RR interval time series for each case using the Welch PSD estimation algorithm. Hanning window was used with a window length of 64 s and an overlap length of 32 s. Linear trend was removed from both time series before calculating the PSD. The group averages are shown in Fig. 1 with the mean ±S.D. value plotted as grey line for the B-Wave group. It can be seen from this figure that average ICP and RR interval power spectral densities of the B-Wave group are larger than those of the control group across the whole frequency spectrum. Additionally, baseline ICP and RR interval PSDs are below the mean − S.D. threshold of the B-Wave group for frequencies below 0.05 Hz.
Fig. 1.

Average PSD of RR interval and ICP for the B-Wave and the baseline group. RR PSD is shown on the upper panel while that of ICP on the lower panel. The mean ±STD lines for the B-Wave group are shown in grey on each panel.
D. Causal Spectral Analysis
Feedforward causal coherence (CCrr→icp) and feedback causal coherence (CCicp→rr) were evaluated at the frequency where the CC was maximal within ([0.04, 0.15] Hz). These values are listed in Table II. Zero coherence as determined by the zero-coherence threshold calculated using 30 surrogates are indicated with *. Results shown here clearly indicate that beat-to-beat mean ICP is highly correlated, in the frequency range of [0.04, 0.15] Hz, with RR intervals in both groups as evidenced by the nonzero CCs. Furthermore, a paired-t test shows that CCs of B-Wave group are significantly larger than those of baseline (p = 0.0034). There is no significant difference between CCrr→icps of the B-Wave and those of the baseline group (p = 0.081). On the other hand, CCicp→rr is significantly different between two groups (p = 0.037). This result is further confirmed by a larger number of cases where CCicp→rr did not pass the zero-coherence test for the baseline group.
TABLE II.
List of Coherence Values extracted by Applying the Linear Causal Spectral Analysis to Each Case
| CC | CCrr→icp | CCicp→rr | ||||
|---|---|---|---|---|---|---|
| B-Wave | Baseline | B-Wave | Baseline | B-Wave | Baseline | |
| 1 | 0.85 | 0.93 | 0.34* | 0.51 | 0.65 | 0.61 |
| 2 | 0.78 | 0.57 | 0.90 | 0.54 | 0.25 | 0.11* |
| 3 | 0.63 | 0.34 | 0.65 | 0.20* | 0.04* | 0.16* |
| 4 | 0.91 | 0.67 | 0.80 | 0.71 | 0.30 | 0.09* |
| 5 | 0.52 | 0.45 | 0.35 | 0.39* | 0.31 | 0.13* |
| 6 | 0.72 | 0.52 | 0.46 | 0.44 | 0.50 | 0.20* |
| 7 | 0.85 | 0.69 | 0.68 | 0.56 | 0.32* | 0.17* |
| 8 | 0.85 | 0.65 | 0.63 | 0.37 | 0.54 | 0.62 |
| 9 | 0.89 | 0.82 | 0.85 | 0.73 | 0.11* | 0.14* |
| 10 | 0.88 | 0.75 | 0.65 | 0.57 | 0.35 | 0.25 |
| 11 | 0.93 | 0.85 | 0.59 | 0.86 | 0.55 | 0.06* |
| 12 | 0.33 | 0.47 | 0.31 | 0.26 | 0.08* | 0.22* |
’ is used to denote instances where the calculated coherence value is below the zero-coherence threshold.
CC: Classic coherence.
CCrr→icp: Feedforward coherence form RR interval to ICP.
CCicp→rr: Feedback coherence form ICP to RR interval.
Figs. 2 and 3 present a typical example, using data case No. 2, of RR interval and mean ICP time series and their coherence spectra, respectively. ICP recorded at B-Wave has a higher amplitude and mean value while RR interval time series at the B-Wave state is elevated but showing similar degree of variability as compared to that at the baseline. Fig. 3 shows that both CC and CCrr→icp spectra are significantly larger than their corresponding zero coherence threshold within [0.04, 0.15] Hz while CCicp→rr is only significantly larger than zero for the B-Wave group.
Fig. 2.

Representative spline interpolated time series of beat-to-beat mean ICP (panels C and D) and RR intervals (panels A and B) for both the B-Wave and the baseline groups. Data shown were from case No.2.
Fig. 3.
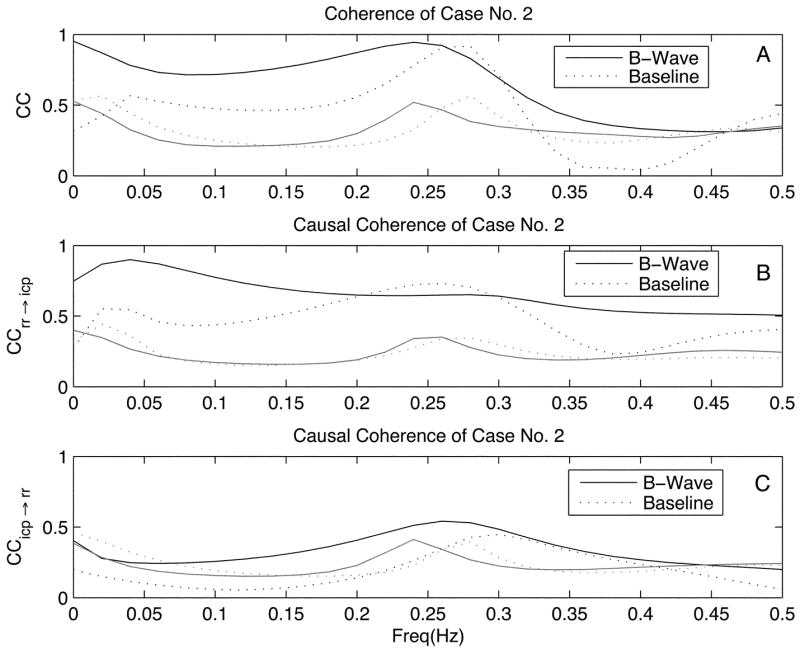
Classic coherence (CC), feedforward coherence (CCrr→icp), and feedback coherence (CCicp→rr) of the case No.2 are shown on panels A, B, and C, respectively. Coherence curves for the B-Wave group are shown with solid line with their corresponding zero-coherence function curves shown in grey. Dotted line and its grey version are used for showing coherence and zero-coherence curves for the baseline group.
E. Nonlinear GS Measure
The Ca and the Cs measures were calculated with embedding parameters automatically determined using the procedure described in [2]. The embedding dimension, thus, defined was 7 for both ICP and RR interval. The time delay was in the range of 2–3 s amounting to 4–6 number of samples. The number of neighbor points was 25. Varying this number was found to only affect the absolute value of the calculated C measures. Table III lists the modified Ca and the Cs measures for each case.
TABLE III.
List of the Modified C Measure of Generalized Synchronization for Each Case
| B-Wave | Baseline | B-Wave | Baseline | B-Wave | Baseline | B-Wave | Baseline | |
|---|---|---|---|---|---|---|---|---|
| 1 | 0.70 | 0.67 | 0.71 | 0.69 | 0.46 | 0.40 | 0.46 | 0.42 |
| 2 | 0.73 | 0.67 | 0.71 | 0.68 | 0.43 | 0.51 | 0.54 | 0.44 |
| 3 | 0.66 | 0.70 | 0.66 | 0.66 | 0.42 | 0.35 | 0.60 | 0.47 |
| 4 | 0.75 | 0.73 | 0.71 | 0.71 | 0.43 | 0.42 | 0.49 | 0.45 |
| 5 | 0.68 | 0.66 | 0.70 | 0.69 | 0.53 | 0.41 | 0.50 | 0.44 |
| 6 | 0.72 | 0.67 | 0.75 | 0.66 | 0.59 | 0.49 | 0.58 | 0.48 |
| 7 | 0.73 | 0.71 | 0.68 | 0.69 | 0.37 | 0.40 | 0.57 | 0.47 |
| 8 | 0.74 | 0.67 | 0.70 | 0.61 | 0.41 | 0.46 | 0.55 | 0.43 |
| 9 | 0.71 | 0.72 | 0.69 | 0.71 | 0.39 | 0.44 | 0.53 | 0.53 |
| 10 | 0.70 | 0.67 | 0.66 | 0.70 | 0.40 | 0.43 | 0.59 | 0.53 |
| 11 | 0.70 | 0.67 | 0.65 | 0.66 | 0.35 | 0.37 | 0.60 | 0.54 |
| 12 | 0.68 | 0.69 | 0.70 | 0.65 | 0.40 | 0.42 | 0.55 | 0.44 |
: Interdependence of RR interval on ICP based on axial span matching of neighborhoods.
: Interdependence of ICP on RR interval based on axial span matching of neighborhoods.
: Interdependence of RR interval on ICP based on axial direction matching of neighborhoods.
: Interdependence of ICP on RR interval based on axial direction matching of neighborhoods.
Comparison of the Ca and the Cs measures between the B-Wave and the baseline groups shows that and are significantly larger for the B-Wave group, p = 0.011 and p = 1.0E − 5, respectively, while and do not show significant difference, p = 0.32 and p = 0.09, respectively.
In addition, asymmetry between and is not significant for both the B-Wave group and the baseline one, p = 0.11 and p = 0.26, respectively. On the other hand, is significantly larger than for both the B-Wave and the baseline groups, p = 7.2E − 4 and p = 0.022, respectively.
IV. Discussion
The relationship between beat-to-beat mean ICP and RR interval signals was investigated in the present work using two recent methods. The maximal coherence between them was found to be significant for both the baseline and the B-Wave groups within the frequency range of [0.04, 0.15] Hz. The adoption of two new interdependency analysis methods revealed additional information regarding the directionality of the coupling between ICP and RR interval, especially the existence of a possible feedback effect from ICP to RR interval.
A. Information Revealed by the Analysis
The linear causal spectral analysis showed that no significant difference of the feedforward coherence of RR to ICP exists between the B-Wave and the baseline group. This suggests that the underlying influential mechanism of RR interval fluctuations on beat-to-beat ICP changes probably stays stationary at both the B-Wave and the baseline states. On the other hand, the feedback coherence of ICP to RR is significantly higher for the B-Wave group. Furthermore, it is more frequently to have significant feedback coherence for the B-Wave group. These results suggest a possible lack of influence from ICP on RR interval dynamics at baseline but possible enhanced influence during occurrence of B-Wave.
The nonlinear analysis using the modified C measure of GS produced essentially compatible results as the linear causal analysis did. Numerical test of Ca and Cs indicated that Ca is more consistent in detecting the dominant direction of coupling. Therefore, the fact that is more significant (p = 7.2E − 4) for the B-Wave group as compared to the baseline group (p = 0.022) suggests that ICP plays a more significant driving role for the B-Wave group. This is directly compatible to the results from the linear causal coherence. On the other hand, is not significantly different from for both groups. This may be caused by Cs’s inferior capability of detecting the direction of coupling. Furthermore, for the B-Wave group is significantly larger than that of the baseline group further supporting an enhanced influence from ICP to RR during occurrence of B-Wave. While the hypothesis of a larger for the B-Wave group as compared to the baseline group did not achieve a significant p value (p = 0.09), it is suggestive of the same finding as reached based on .
One major different finding between the nonlinear and linear causal spectral analysis concerns that is significantly larger for the B-Wave group and that no significant difference of CCrr→icp between the B-Wave and the baseline groups is found. One possible explanation is that Cs measure characterizes interdependency from RR to ICP using the information from the whole frequency spectrum while the finding based on CCrr→icp is limited within [0.04, 0.15] Hz. This hypothesis could be tested in future by extending the frequency range under investigation to cover respiratory modulations preferably with simultaneous recording of respiration activity. Alternatively, a band pass filter with a matching frequency band could be applied to signals before conducting the analysis of GS. Apart from the explanation concerning different frequency range, presence of potential nonlinear dynamic interaction between ICP and RR interval signals, which is not captured by linear coherence measures could result in larger for the B-Wave group. On the other hand, the reason why did not show significant difference between the two groups may be due to the fact that Cs is sensitive of the difference of interdependency while Ca is more consistent in detecting the direction of coupling.
B. Physiological Interpretation of Coherence Between ICP and RR Interval
The feedforward effect from RR interval to ICP is expected as the longer the RR interval is, the smaller the diastolic value of ICP pulse is. This would then translate into the observed nonzero coherence between the ICP and the RR interval. Both the causal spectral analysis and the GS revealed the existence of a potential feedback effect from ICP to RR interval and that this feedback effect is enhanced during the occurrence of B-Wave. This phenomenon, to our knowledge, has not been reported in the existing publications. However, explanation of this feedback effect is not straightforward from the present study. It is possible that this feedback effect is not completely mediated by ICP because changes of beat-to-beat ICP may follow those of systemic ABP. Consequently, the apparent feedback effect from ICP to RR interval could be attributed to that of ABP on RR interval, e.g., the Baroreflex. Additionally, respiratory modulation on ICP and RR interval could be another confounding factor even though we have chosen the frequency of interest below 0.15 Hz.
Lack of ABP measurement in the present work prevented us from drawing a conclusive judgement on whether ICP’s feedback effect on RR interval exists, however, abundant evidence of central organization of cardiovascular rhythms including RR interval variability exists in literatures that conducted integrative analysis of HRV and other signals other than ICP. These, thus, indirectly support a potential role that ICP may play in influencing the control of RR interval variability that originates from central nervous systems. For example, it was reported in [32] that discharge of medullary neurons was showing low-frequency rhythmic patterns synchronized with that in HRV while no such low-frequency oscillations exist in simultaneously recorded ABP signals. This suggested that low-frequency HRV oscillations are not necessarily associated with the functional integrity of the baroreceptive mechanism. Furthermore, it is known that in some conditions, e.g., experimental myocardial ischemia low-frequency increase in HRV could occur in the absence of ABP changes [33], [34]. Additional evidence has been obtained from studies involving HRV and direct intraneural microneurograpic recordings of efferent sympathetic nerve traffic to muscle blood vessels (MSNA) and skin blood vessels (SSNA) [35] where synchronous changes in both low-frequency and high-frequency components of both MSNA and RR interval variabilities were found.
In summary, cardiac abnormalities associated with some pathological cerebral vascular conditions such as SAH [16], intracranial hypertension [17]–[19] and the modulation of RR interval through centrally organized neural control are supportive of the observed feedback coherence from beat-to-beat ICP to RR interval variabilities. Nevertheless, the confounding effect of ABP variability as well as respiratory influences could not be excluded. Further study of interaction of ICP, HRV, and other related signals is needed.
C. Methodological Issues
The present work also compares two new methodologies of characterizing interdependency between two signals. The linear causal spectral analysis has the advantage of resolving the coherence in the frequency domain such that an appropriate frequency range could be selectively studied, e.g., the exclusion of the higher frequency for avoiding confounding effect from respiration. The causal spectral analysis was done using the linear parametric AR model. Hence, any deviation from the modeling assumptions could potentially invalidate the results. The modified C measure of characterizing the GS is a model-independent approach and, thus, is free from the assumption of linearity. Apparently, it integrates coherence from the whole frequency range and, thus, lacks the frequency selectivity. On the other hand, the nonstationarity is the common assumption for both methods studied here. The adaptive algorithm of causal spectral analysis is not available yet and presents an interesting direction for future research. One adaptive algorithm for calculating the C measure was proposed recently by us and could be extended to calculate the modified C measure introduced here. The application of these adaptive algorithms could be used to study time-varying interdependency between ICP and RR interval and the development of B-Wave, in particular.
We have used a 5-min window, a common choice in HRV studies, for both basal and B-Wave groups. More robust results with a longer but stationary window could be obtained for the B-Wave group since the 5-min window, containing only five cycles of oscillation for a record with a period of 1 min, may be a limiting factor.
Acknowledgments
The authors would like to thank M. Eliseo for his help during data collection. They would also like to thank the two anonymous reviewers for their constructive critiques of this manuscript.
This work was supported in part by the Brain Injury Research Center (BIRC) at the University of California at Los Angeles (UCLA). The work of X. Hu was supported in part by the National Institute of Neurological Disorders and Stroke (NINDS) under R21 Award NS055998. The work of M. Bergsneiderand was supported in part by the National Institute of Neurological Disorders and Stroke (NINDS) under R01 Award NS054881.
Biographies

Xiao Hu (S’03–M’04) received the B.S. and M.S. degrees from the University of Electronic Science and Technology of China, Hefei, China, in 1996 and 1999, respectively. He received the Ph.D. degree in biomedical engineering from the University of California, Los Angeles (UCLA), in 2004.
He joined the division of neurosurgery at the UCLA Medical Center as an Assistant Researcher in 2004 and then as an Assistant Professor in December 2006. He has a broad research interest in biomedical modeling, signal processing, and medical informatics. He is currently a principal investigator of NIH-funded exploratory projects and is researching effective ways of extracting information from intracranial pressure and cerebral hemodynamic signals for a better monitoring and diagnosis of brain injury and hydrocephalus patients.

Valeriy Nenov received the engineering degree in micro electronics from the Czech Polytechnic University, Prague, Czech Republic, in 1979, the Ph.D. degrees in neuroscience and in computer science from the University of California, Los Angeles (UCLA), in 1989 and 1991, respectively.
He was an Assistant Professor in Computer Science and Biomedical Engineering for one year at the University of Southern California (USC) and in 1992 joined the faculty at the UCLA Division of Neurosurgery. Presently, he holds the position of Adjunct Professor in Neurosurgery. While at UCLA, he established and directs the Brain Monitoring and Modeling Laboratory, where for the past 13 years he and his undergraduate, graduate and post-doctoral students have conducted NIH-funded research. He is a co-founder of Global Care Quest, Inc. http://www.GlobalCare-Quest.com.

Paul Vespa is an Associate Professor of Neurology and Neurosurgery at the David Geffen School of Medicine at the University of California, Los Angeles (UCLA). He is the Director of the Neurocritical Care program. He is a Fellow-elect of the American College of Critical Care Medicine. He has clinical and research interests in traumatic brain injury, intracerebral hemorrhage, status epilepticus, stroke, subarachnoid hemorrhage, and coma. He has pioneered the role of brain monitoring in the neurointensive care unit. He has also pioneered robotic telepresence in the Neuro-ICU. He has published over 68 articles and is an editorial board member of several international journals. Dr. Vespa is funded to do cutting-edge research by the National Institutes of Health and the State of California Neurotrauma Initiative.

Marvin Bergsneider received the B.S. degree in electrical engineering from the University of Arizona, in 1983, and the M.D. degree in 1987 from the University of Arizona College of Medicine, Phoenix, in 1983 and 1987, respectively.
His neurosurgical residency training was at the University of California, Los Angeles (UCLA), where he joined the faculty in 1994. He is an Associate Professor of Surgery/Neurosurgery and a faculty member of UCLA Biomedical Engineering Interdepartmental Program. His research interests include modeling of intracranial fluid biomechanics, molecular imaging of clinical traumatic brain injury, and development of intra-operative MRI technology.
APPENDIX
To demonstrate the necessity of uniformly sampling trajectories, a numerical experiment was conducted based the same coupled systems and the same numerical values used in [10]. Time series were generated using the coupled Rossler-Lorenz system where the Rossler system, as a driver, is
| (21) |
and the Lorenz system, as a responser, is
| (22) |
where the parameter γ controls the coupling strength.
For the sake of following analysis, it is considered that two arrays of consecutive points are considered to belong to two different trajectories if their temporal distance is at least τ samples away, where τ is the delay time in samples for embedding the time series. Hence, one can count the number of different trajectories as covered by a neighborhood of a reference vector at time n. Fig. 4 gives the histogram of all embedding vectors, at an uncoupled and a coupled state, based on the number of different trajectories that their 20-nearest neighbors covered.
Fig. 4.

Histogram of number of trajectories found for the x and y variables of the Rossler-Lorenz systems at uncoupled (γ = 0) and coupled (γ = 10) states, respectively. The number of neighborhood points for query was fixed at 40.
This figure reveals that far fewer trajectories were found for the Rossler system than for the Lorenz system given the same requested number of neighbor points when the two were not coupled. Consequently, a bigger portion of the neighbor points of the Rossler system is consecutive in time. This, hence, artificially makes the conditional neighborhood matrices of the Lorenz time series more structured. This unevenness contributes to the undesirable asymmetry of the C measure for two uncoupled systems as shown in Fig. 5(B). On the other hand, this unevenness was much less when the two systems become coupled. Therefore, the asymmetry of the C measure seen in the coupled state truly reflects the fact that x is a driving system.
Footnotes
Color versions of one or more of the figures in this paper are available online at http://ieeexplore.ieee.org.
Contributor Information
Xiao Hu, X. Hu is with the Brain Monitoring and Modelling Laboratory, Division of Neurosurgery, University of California, Los Angeles, CA 90034 USA (e-mail: xiaohu@ucla.edu).
Valeriy Nenov, V. Nenov is with the Brain Monitoring and Modelling Laboratory, Division of Neurosurgery, University of California, Los Angeles, CA 90034 USA (e-mail: vnenov@mednet.ucla.edu)..
Paul Vespa, P. Vespa is with the UCLA Neurocritical Care Program, 18-228 NPI, UCLA Medical Center, Los Angeles, CA 90095 USA..
Marvin Bergsneider, M. Bergsneider is with the UCLA Adult Hydrocephalus Center, Los Angeles, CA 90095 USA..
References
- 1.Aboy M, McNames J, Thong T, Tsunami D, Ellenby MS, Goldstein B. An automatic beat detection algorithm for pressure signals. IEEE Trans Biomed Eng. 2005 Oct;52(10):1662–1670. doi: 10.1109/TBME.2005.855725. [DOI] [PubMed] [Google Scholar]
- 2.Hu X, Nenov V, Glenn TC, Steiner LA, Czosnyka M, Martin N, Bergsneider M. Nonlinear analysis of cerebral hemodynamical and intracranial pressure signals: Implication for a nonlinear measure of the autoregulation status. IEEE Trans Biomed Eng. 2006 Feb;53(2):195–209. doi: 10.1109/TBME.2005.862546. [DOI] [PubMed] [Google Scholar]
- 3.Hornero R, Aboy M, Abasolo D, McNames J, Wakeland W, Goldstein B. Complex analysis of intracranial hypertension using approximate entropy. Crit Care Med. 2006;34(1):87–95. doi: 10.1097/01.ccm.0000190426.44782.f0. [DOI] [PubMed] [Google Scholar]
- 4.Porta A, Baselli G, Rimoldi O, Malliani A, Pagani M. Assessing baroreflex gain from spontaneous variability in conscious dogs: Role of causality and respiration. Am J Physiol Heart Circ Physiol. 2000;279(5):H2558–H267. doi: 10.1152/ajpheart.2000.279.5.H2558. [DOI] [PubMed] [Google Scholar]
- 5.Porta A, Furlan R, Rimoldi O, Pagani M, Malliani A, van de Borne P. Quantifying the strength of the linear causal coupling in closed loop interacting cardiovascular variability signals. Biol Cybern. 2002;86(3):241–251. doi: 10.1007/s00422-001-0292-z. [DOI] [PubMed] [Google Scholar]
- 6.Faes L, Porta A, Cucino R, Cerutti S, Antolini R, Nollo G. Causal transfer function analysis to describe closed loop interactions between cardiovascular and cardiorespiratory variability signals. Biol Cybern. 2004;90(6):390–399. doi: 10.1007/s00422-004-0488-0. [DOI] [PubMed] [Google Scholar]
- 7.Faes L, Widesott L, Del Greco M, Antolini R, Nollo G. Causal cross-spectral analysis of heart rate and blood pressure variability for describing the impairment of the cardiovascular control in neurally mediated syncope. IEEE Trans Biomed Eng. 2006 Jan;53(1):65–73. doi: 10.1109/TBME.2005.859788. [DOI] [PubMed] [Google Scholar]
- 8.Pecora LM, Carroll TL. Synchronization in chaotic systems. Phys Rev Lett. 1990;64(8):821–824. doi: 10.1103/PhysRevLett.64.821. [DOI] [PubMed] [Google Scholar]
- 9.Rulkov NF, Sushchik MM, Tsimring LS, Abarbanel HDI. Generalized synchronization of chaos in directionally coupled chaotic systems. Phys Rev E—Statist Phys, Plasmas, Fluids, Rel Interdisciplinary Topics. 1995;51(2):980–994. doi: 10.1103/physreve.51.980. [DOI] [PubMed] [Google Scholar]
- 10.Hu X, Nenov V. Robust measure for characterizing generalized synchronization. Phys Rev E—Statist Nonlinear Soft Matter Phys. 2004;69(2 pt 2):026206. doi: 10.1103/PhysRevE.69.026206. [DOI] [PubMed] [Google Scholar]
- 11.Maeda M, Miyazaki M. Control of icp and the cerebrovascular bed by the cholinergic basal forebrain. Acta Neurochir Suppl. 1998;71:293–296. doi: 10.1007/978-3-7091-6475-4_85. [DOI] [PubMed] [Google Scholar]
- 12.Tsubokawa T, Katayama Y, Miyazaki S, Hoff J, Betz A, editors. Intracranial pressure in response to deep brain stimulation in traumatic prolonged coma patients. Proc. 7th Int. Symp. Intracranial Pressure and Brain Monitoring; Ann Arbor, MI. 1988. pp. 703–705. [Google Scholar]
- 13.Sirowski E, Amcheslavski V, Savin I, Nagai H, Kamiya K, Ishii S, editors. Towards the mechanism of spontaneous “b” and “plateau” waves. Proc. 9th Int. Symp. Intracranial Pressure and Brain Monitoring; Tokyo, Japan. 1994. pp. 490–492. [Google Scholar]
- 14.Maeda M, Miyazaki M, Ishii S, Hoff J, Betz A, editors. The roles of the mutual interaction between the locus coeruleus complex and the chorioceptive pontine area in the plateau wave. Proc. 7th Int. Symp. Intracranial Pressure and Brain Monitoring; Ann Arbor, MI. 1988. pp. 228–231. [Google Scholar]
- 15.Cushing H. Concerning a definite regulatory mechanism of the vasomotor centre which controls blood pressure during cerebral compression. Johns Hopkins Hospital Bull. 1901;12:290–292. [Google Scholar]
- 16.Kawahara E, Ikeda S, Miyahara Y, Kohno S. Role of autonomic nervous dysfunction in electrocardio-graphic abnormalities and cardiac injury in patients with acute subarachnoid hemorrhage. Circ J. 2003;67(9):753–756. doi: 10.1253/circj.67.753. [DOI] [PubMed] [Google Scholar]
- 17.Prabhakar H, Rath GP, Bithal PK, Chouhan RS. Intracranial pressure and haemodynamic changes during the tunnelling phase of ventriculoperitoneal shunt insertion. Eur J Anaesthesiol. 2005;22(12):947–950. doi: 10.1017/S0265021505001626. [DOI] [PubMed] [Google Scholar]
- 18.van Aken J, Struys M, Verplancke T, de Baerdemaeker L, Caemaert J, Mortier E. Cardiovascular changes during endoscopic third ventriculostomy. Minimally Invasive Neurosurg. 2003;46(4):198–201. doi: 10.1055/s-2003-42354. [DOI] [PubMed] [Google Scholar]
- 19.Biswas AK, Scott WA, Sommerauer JF, Luckett PM. Heart rate variability after acute traumatic brain injury in children. Crit Care Med. 2000;28(12):3907–3912. doi: 10.1097/00003246-200012000-00030. [DOI] [PubMed] [Google Scholar]
- 20.Wallis DE, Littman WJ, Scanlon PJ, Euler DE. The effects of elevated intracranial pressure on the canine electrocardiogram. J Electrocardiol. 1987;20(2):154–161. doi: 10.1016/s0022-0736(87)80105-x. [DOI] [PubMed] [Google Scholar]
- 21.Quiroga RQ, Arnhold J, Grassberger P. Learning driver-response relationships from synchronization patterns. Phys Rev E—Statist Phys, Plasmas, Fluids, Rel Interdisciplinary Topics. 2000;61(5):5142–5148. doi: 10.1103/physreve.61.5142. [DOI] [PubMed] [Google Scholar]
- 22.Lundberg N, Troupp H, Lorin H. Continuous recording of the ventricular-fluid pressure in patients with severe acute traumatic brain injury. A preliminary report. J Neurosurg. 1965;22(6):581–590. doi: 10.3171/jns.1965.22.6.0581. [DOI] [PubMed] [Google Scholar]
- 23.Droste DW, Krauss JK, Berger W, Schuler E, Brown MM. Rhythmic oscillations with a wavelength of 0.5–2 min in transcranial Doppler recordings. Acta Neurol Scand. 1994;90(2):99–104. doi: 10.1111/j.1600-0404.1994.tb02687.x. [DOI] [PubMed] [Google Scholar]
- 24.Zhang R, Zuckerman JH, Levine BD. Spontaneous fluctuations in cerebral blood flow: Insights from extended-duration recordings in humans. Am J Physiol Heart Circ Physiol. 2000;278(6):H1848–H1855. doi: 10.1152/ajpheart.2000.278.6.H1848. [DOI] [PubMed] [Google Scholar]
- 25.Dirnagl U, Kaplan B, Jacewicz M, Pulsinelli W. Continuous measurement of cerebral cortical blood flow by laser-Doppler flowmetry in a rat stroke model. J Cereb Blood Flow Metab. 1989;9(5):589–596. doi: 10.1038/jcbfm.1989.84. [DOI] [PubMed] [Google Scholar]
- 26.Jones SC, Williams JL, Shea M, Easley KA, Wei D. Cortical cerebral blood flow cycling: Anesthesia and arterial blood pressure. Am J Physiol. 1995;268(2 pt 2):H569–H575. doi: 10.1152/ajpheart.1995.268.2.H569. [DOI] [PubMed] [Google Scholar]
- 27.Auer LM, Sayama I. Intracranial pressure oscillations (b-waves) caused by oscillations in cerebrovascular volume. Acta Neurochir (Wien) 1983;68(1–2):93–100. doi: 10.1007/BF01406205. [DOI] [PubMed] [Google Scholar]
- 28.Baselli G, Porta A, Rimoldi O, Pagani M, Cerutti S. Spectral decomposition in multichannel recordings based on multivariate parametric identification. IEEE Trans Biomed Eng. 1997 Nov;44(11):1092–1101. doi: 10.1109/10.641336. [DOI] [PubMed] [Google Scholar]
- 29.de Waele S, Broersen PMT. Order selection for vector autoregressive models. IEEE Trans Signal Process. 2003 Feb;51(2):427–433. [Google Scholar]
- 30.Faes L, Pinna GD, Porta A, Maestri R, Nollo G. Surrogate data analysis for assessing the significance of the coherence function. IEEE Trans Biomed Eng. 2004 Jul;51(7):1156–1166. doi: 10.1109/TBME.2004.827271. [DOI] [PubMed] [Google Scholar]
- 31.Hu X, Nenov V, Bergsneider M. Phase coordination between intracranial pressure and electrocardiogram signals. Proc IEEE Eng. Med. Biol. Soc. Conf; 2005. pp. 45–48. [DOI] [PubMed] [Google Scholar]
- 32.Montano N, Gnecchi-Ruscone T, Porta A, Lombardi F, Malliani A, Barman SM. Presence of vasomotor and respiratory rhythms in the discharge of single medullary neurons involved in the regulation of cardiovascular system. J Auton Nerv Syst. 1996;57(1–2):116–122. doi: 10.1016/0165-1838(95)00113-1. [DOI] [PubMed] [Google Scholar]
- 33.Bernardi L, Keller F, Sanders M, Reddy PS, Griffith B, Meno F, Pinsky MR. Respiratory sinus arrhythmia in the denervated human heart. J Appl Physiol. 1989;67(4):1447–1455. doi: 10.1152/jappl.1989.67.4.1447. [DOI] [PubMed] [Google Scholar]
- 34.Rimoldi O, Pierini S, Ferrari A, Cerutti S, Pagani M, Malliani A. Analysis of short-term oscillations of r-r and arterial pressure in conscious dogs. Am J Physiol. 1990;258(4 pt 2):H967–H976. doi: 10.1152/ajpheart.1990.258.4.H967. [DOI] [PubMed] [Google Scholar]
- 35.Pagani M, Montano N, Porta A, Malliani A, Abboud FM, Birkett C, Somers VK. Relationship between spectral components of cardiovascular variabilities and direct measures of muscle sympathetic nerve activity in humans. Circulation. 1997;95(6):1441–1448. doi: 10.1161/01.cir.95.6.1441. [DOI] [PubMed] [Google Scholar]