Abstract
PLGA microspheres are attractive DNA delivery vehicles due to their controlled release capabilities. One major problem with PLGA microspheres is that they develop an acidic microclimate as the polymer degrades, lowering the intraparticle pH, and potentially damaging the DNA. Antacids have recently shown promise in buffering this acidic microclimate and enhancing protein stability. We manufactured uniform plasmid DNA-encapsulating PLGA microspheres of two sizes (47, 80 μm diameter) and antacid concentrations (0, 3% Mg(OH)2). Microspheres with antacid had a homogeneous surface coverage of small pores, which resulted in a significant reduction of the burst effect. The 47 μm microspheres exhibited complete release of plasmid DNA over the course of two months. Incomplete release was observed from 80 μm spheres, though microspheres with 3% Mg(OH)2 showed a higher cumulative release, suggesting that the antacid at least partially aids in increasing the stability of DNA. SEM was used to visualize the surface pore evolution and cross-sectional microsphere structure over time. Subsequent image analysis was used to quantify the increase of surface pore sizes. Cross-sectional images showed increasing internal degradation and erosion, which resulted in a hollowing-out of microspheres. Our studies show that the incorporation of antacid into the microsphere structure has potential in addressing some of the major problems associated with DNA encapsulation and release in PLGA microspheres.
Keywords: DNA delivery, Microspheres, Poly (lactide-co-glycolide), plasmid DNA, magnesium hydroxide
Introduction
Gene delivery holds tremendous potential for gene replacement therapies for inherited disease, treatment of acquired diseases, and vaccinations. The promise of human gene therapy ensures that DNA will continue to be a large part of the pharmaceutical toolbox in the coming years. A major barrier to successful gene therapy is the safe and efficient delivery of DNA to the right place, in the right amount, at the right time. Although many vectors are available for gene therapy, including viruses [1], liposomes [2, 3], and polymers [4], biodegradable polymer microparticles have emerged in recent years as a suitable gene delivery vehicle [5–7]. Encapsulation and controlled release of plasmid DNA from polymer microspheres provides several advantages. Microparticles allow for access to alternative routes of administration including oral [8], pulmonary [9], subcutaneous [10], and intramuscular [7] pathways. Encapsulation in microspheres has also been shown to lead to in vivo expression of naked plasmid DNA (pDNA) [8]. Passive targeting of microspheres encapsulating plasmid DNA based on size, via phagocytosis, to professional antigen presenting cells has been demonstrated [10], and active targeting by coating the surface of microspheres with cell-specific ligands is also possible [7, 11].
Unfortunately, encapsulation and release of pDNA in microspheres for gene delivery is problematic for several reasons. The most common method of microsphere fabrication involves a water-oil-water double emulsion technique that affords limited control of microsphere size. It has been demonstrated for a variety of encapsulated drugs that microsphere size is a key variable in determining the characteristics of the release profile [12–14]. Small microspheres have a larger surface area to volume ratio, and generally release drug at a faster rate than larger spheres. Many studies of DNA release with microspheres have dealt with spheres smaller than 5 μm in diameter. Though these particles are suitable for passive targeting, they generally exhibit a high burst of DNA released within the first day [15, 16], which is often undesirable for long term controlled release applications. Another disadvantage of the double emulsion fabrication method is that the strong forces employed in the emulsification process often shears the DNA, resulting in the conversion of supercoiled DNA into open circular or linear topologies, both of which have a lower transfection efficiency [17, 18].
The degradation of polyesters such as poly(lactic-co-glycolic) acid (PLGA), the most commonly used polymer for biodegradable microspheres, results in the production and subsequent buildup of acidic molecules. Over time, the continued effects of degradation can lower the pH within the microsphere, resulting in an acidic microclimate as low as pH 2.5 [19, 20]. This microclimate can accelerate acid hydrolysis of the pDNA, resulting in conversion of supercoiled DNA to the open circular or linear forms, or complete degradation of the DNA. In addition, because of the large size of pDNA, diffusion through the polymer matrix is slow. As a result, pDNA release typically occurs at a low rate over a prolonged time. This slow release makes it difficult to control release rates and amounts delivered, and exacerbates the problem of DNA degradation inside the degrading particles.
Improved strategies for stabilization of DNA and control of the rate of release from PLGA microspheres would alleviate many of the problems associated with using polymer microspheres. Antacids have shown promise in buffering the intraparticle pH and increasing the stability of encapsulated proteins in microspheres and cylinders composed of PLGA. Zhu et al. observed that the addition of 3% magnesium hydroxide to PLGA cylinders encapsulating bovine serum albumin (BSA) decreased the amount of non-covalent protein aggregates (from 65% to 2.0%) and increased the degradation half-life of PLGA (from 16.0 to 25.1 days) [21]. Kang and Schwendeman later demonstrated that PLGA millicylinders with incorporated antacid showed greater cumulative release of BSA (75% vs.15%), as well as a faster release rate and greater total release of tissue plasminogen activator (100% vs.75%) compared to non-antacid cylinders [22]. Jaganathan et al. added magnesium hydroxide to PLGA microspheres encapsulating tetanus toxoid, and found that the antacid similarly increased the degradation half-life of PLGA (from 14 to 32 days) as well as decreased the aggregation of tetanus toxoid (from 65% to 1.5%), resulting in a larger total release [23].
Our goal is to stabilize the pDNA by adding an excipient to the microspheres to buffer the increasingly acidic intraparticle pH and control the release profile by changing the size of the microsphere. This paper reports the effects of using an antacid, Mg(OH)2, on the stability and release of plasmid DNA from different sized PLGA microspheres.
Methods and Materials
Materials
Poly(D,L-lactide-co-glycolide) (PLGA) (50:50 lactide:glycolide, inherent viscosity 0.40 dl/g in hexaflouroisopropanol) was obtained from Absorbable Polymers International. Magnesium hydroxide (Mg(OH)2) was purchased from Sigma-Aldrich. Poly(vinyl alcohol) (PVA) (88% hydrolyzed) was purchased from Polysciences Inc. Reagent grade dicholoromethane (DCM), lactose, and EDTA were acquired from Fisher Scientific. PicoGreen reagent was purchased from Invitrogen. All materials were used as obtained.
Plasmid Isolation
The pGL3-Control vector was obtained from Promega and amplified in DH5-α cells. Cells were grown in LB broth (Sigma) and purified using a Quantum Maxiprep Kit (Bio-Rad) according to the manufacturer’s protocol. Concentration of DNA was determined by the Beer-Lambert equation, using a UV-vis spectrophotometer (Cary 50, Varian) to measure absorbance at 260 nm and using an extinction coefficient of 50 mL/μg·cm.
Preparation of Microspheres
Microspheres were fabricated using a previously reported technique [24]. Briefly, PLGA was dissolved in DCM to make a 20% w/v solution. An aqueous solution consisting of pGL3 DNA (750 μg/ml), lactose (300 mM) and EDTA (1 mM) was added in a 1:10 aqueous to organic ratio. The solution was sonicated at 50% amplitude (Fisher Sonic Dismembrator Model 500) in an ice bath for 30 seconds in one-second pulses to form an emulsion. The emulsion was extruded through a small-gauge needle lined concentrically with a carrier stream (0.5% w/v PVA in MilliQ water). The nozzle was acoustically excited using an ultrasonic transducer (Trek PZD700) controlled by a frequency generator (Agilent 3320A waveform generator) to disrupt the stream into uniform droplets, which were then collected in a beaker containing 400 mL of 0.5% PVA solution. The microspheres were hardened into uniform particles by stirring for three hours to allow for solvent extraction and evaporation. After hardening, the microspheres were washed three times with MilliQ water, vacuum filtered, and finally lyophilized for 48 hours (Labconco Lyph Lock 6). The lyophilized microspheres were stored with dessicant at –20 °C. To prepare microspheres with antacid, particles of Mg(OH)2 were added to the organic phase to a concentration of 3% (weight Mg(OH)2/ weight PLGA) prior to emulsification.
DNA Encapsulation Efficiency
Approximately 5 mg of spheres were dissolved in 100 μl of DMSO, of which 10 μl was added to 1 ml of TE buffer and briefly vortexed. The precipitated polymer was removed by centrifugation (13000 rpm for 2 minutes), and 100 μl of this solution was added to 1 ml of fresh TE. One ml of this mixture was added to 1 ml of freshly made PicoGreen reagent (100 μl in 20 ml of TE buffer), inverted to ensure homogeneity, and incubated in the dark for 5 minutes before being assayed fluorometrically to determine DNA content (ex. 480 nm, em. 520 nm) (Cary Eclipse).
Analysis of DNA structure
Approximately 20 mg of microspheres were weighed into microcentrifuge tubes and dissolved with 1 ml of DCM. Two hundred ml of TE buffer was added to each tube, and the tube was agitated lightly for 1 hour at room temperature, then microcentrifuged at 13000 rpm for 3 minutes. The top aqueous layer and white polymer precipitate were removed and added to a new microcentrifuge tube, to which 1 ml of fresh DCM was added. The tubes were allowed to shake slowly for 10 min, then again microcentrifuged at 13000 rpm for 3 minutes. The top aqueous layer was removed, 10 μl of which was assayed by gel electrophoresis on a 0.75% agarose gel, stained for 15 minutes in an ethidium bromide solution, and visualized by UV illumination (Bio-Rad Gel Doc 2000). To extract DNA at various time points during incubation and release (see below), microspheres were centrifuged at 13000 rpm for 1 minute and washed three times with MilliQ water prior to following the above procedure. Relative amounts of DNA present in the supercoiled, open circular, and linear forms were analyzed using ImageJ software. Band intensities were integrated as a volume, with background volume subtracted to give normalized band intensity. Percentage of DNA in a single form was determined by dividing a single normalized band intensity by the sum of all other normalized band intensities.
In-vitro DNA Release
Release studies were conducted by suspending approximately 15 mg of microspheres in 1.3 ml of PBS buffer (pH 7.4) with 0.05 wt% Tween 80. Samples were rotated at 6 revolutions per minute at 37 °C. At regular time intervals, 1 ml of release media was removed and replaced with 1 ml of fresh PBS buffer, vortexed, and returned to incubation. DNA concentration was determined using the PicoGreen reagent as described above. All release experiments were performed in triplicate.
Scanning Electron Microscopy
The microspheres were imaged using a Hitachi S-4700 scanning electron microscope (SEM). To image the interior structure of the microspheres, cross sections were obtained using a razor blade to fracture frozen particles dried on glass slides. Intact or fractured particles were placed on metal sample holders and sputter coated (Emitech K-575 Sputter Coater) with a gold-palladium target for 30 seconds at 20 mA prior to imaging. Only cross sectional images of particles that were fractured through the center axis were used. Images were obtained at 2 kV accelerating voltage.
Surface Pore Size Distribution
SEM images were analyzed using ImageJ to determine the surface pore size distribution. The “threshold function” was initially used to highlight pores in black. Subsequently, the “analyze particles” function was used to obtain sizes of the highlighted pores, with a 5000 nm2 area (corresponding to a pore with an 80 nm diameter) cutoff to eliminate noise. Approximately ten images were averaged for each batch of microspheres and each time point.
Results
Four batches of microspheres were fabricated using the precision particle fabrication (PPF) method [13, 24], at two sizes (47 μm and 80 μm) and two magnesium hydroxide concentrations (0%, 3%). Encapsulation efficiencies for all four batches were relatively high, ranging from 70–84%, and the size distributions were narrow, with standard deviations of one micron or less in diameter (Table 1). The surfaces of the microspheres fabricated without magnesium hydroxide contained relatively few pores of varying sizes (Figure 1A, B). In contrast, microspheres containing magnesium hydroxide displayed a more homogeneous surface coverage of smaller, but more numerous pores (Figure 1C, D). These small pores are likely due to dissolution of magnesium hydroxide from near the surface of nascent microspheres during the three-hour solvent evaporation/particle hardening phase of the fabrication process.
Table 1.
Size distributions and encapsulation efficiencies of microsphere formulations.
| Sample | Diameter ± Std. Dev. | Encapsulation Efficiencya |
|---|---|---|
| 47 μm, non-Mg(OH)2 | 46.6 ± 0.8 μm | 69.8 ± 7.6% |
| 80 μm, non-Mg(OH)2 | 78.1 ± 0.4 μm | 69.9 ± 4.7% |
| 47 μm, 3% Mg(OH)2 | 47.0 ± 0.5 μm | 72.2 ± 2.9% |
| 80 μm, 3% Mg(OH)2 | 83.3 ± 1.1 μm | 84.0 ± 3.7% |
Encapsulation efficiency is defined as actual amount of DNA present in microspheres divided by the theoretical amount of DNA in microspheres (as determined from formulation parameters) * 100%
Figure 1.
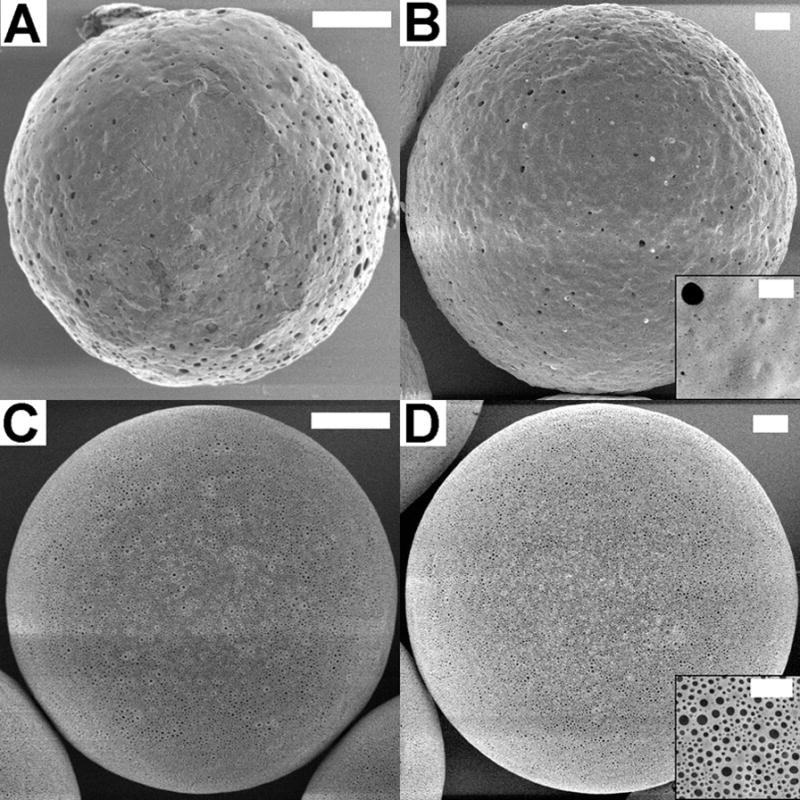
SEM images of microspheres prior to release. 47 μm non-Mg(OH)2 (A), 80 μm non-Mg(OH)2 (B), 47 μm with 3% Mg(OH)2 (C), and 80 μm with 3% Mg(OH)2 (D). Scale bar is 10 μm, 2 μm on inset.
DNA Stability
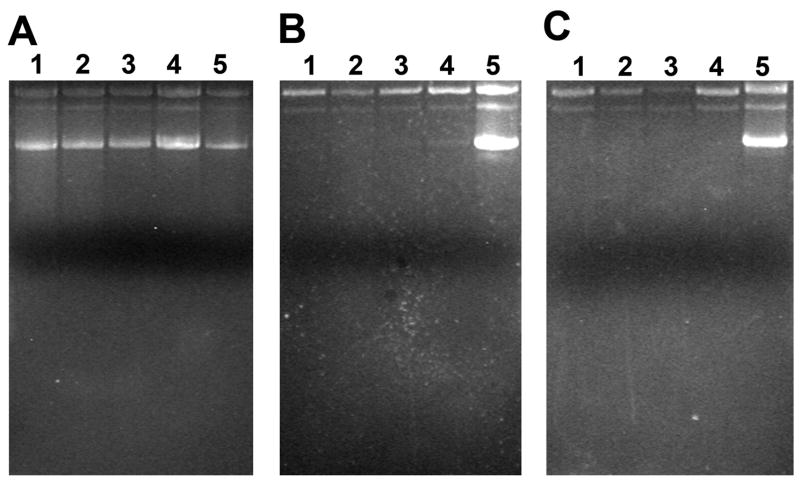
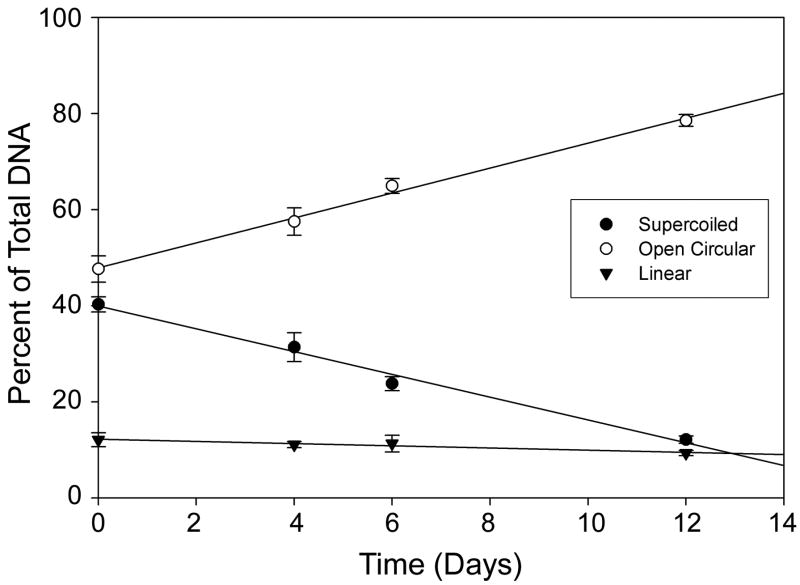
Plasmid DNA was extracted from the microspheres following lyophilization to determine the stability of pDNA following the PPF process, as well as after one week and three weeks of incubation in PBS at 37 °C (Figure 2) to gauge stability of the encapsulated plasmid during polymer degradation. There was no evidence of fragmentation or change in conformation of DNA extracted from the freshly prepared microspheres, which might have been expected due to the shear forces associated with sonication, in forming the primary emulsion, or extrusion through the PPF nozzle. This result is likely due to the relatively low power input and short duration of sonication in formation of the primary emulsion. Also, during passage through the PPF nozzle, shear forces are relatively small as the stream is in the laminar flow regime and the length of the orifice is only a few millimeters (and thus passage through the orifice is of very short duration). However, after one week of incubation in PBS, no supercoiled DNA was recovered from the microspheres (Figure 2B). This could be due to conversion of supercoiled DNA to the open circular form as a result of the acidic microclimate inside the degrading microspheres or preferential release of supercoiled DNA from the microspheres. Since magnesium hydroxide has been shown to buffer the intraparticle microsphere acidity [25], it seems more likely that the smaller, supercoiled DNA is releasing preferentially. To test this hypothesis, plasmid DNA was incubated in a suspension of blank microspheres in PBS at 37°C. The fraction of supercoiled DNA decreased nearly linearly, coupled with a corresponding increase in the open circular form (Figure 3). However, the decrease was not sufficient to account for the loss of supercoiled DNA inside the microspheres. After 6 days, 60% of the original supercoiled DNA remained, whereas for encapsulated pDNA, almost no supercoiled DNA remained after 7 days. Therefore, it is likely that the lack of supercoiled DNA after one and three weeks was due to a combination of degradation into the open circular form, as well as a preferential release of supercoiled DNA. It is interesting to note that we found no evidence of DNA fragmentation during the course of this study.
Figure 2.
Gel electrophoresis of DNA extracted from (A) freshly prepared microspheres, and after (B) one week or (C) three weeks incubation of microspheres in PBS at 37 °C. Lane 1, 47 μm non-Mg(OH)2; 2, 80 μm non-Mg(OH)2; 3, 47 μm with 3% Mg(OH)2; 4, 80μm with 3% Mg(OH)2; 5, standard pGL3 DNA.
Figure 3.
Conformation of DNA after incubation with blank PLGA microspheres in PBS buffer at 37 °C. Graph shows percentage of DNA retained in supercoiled (closed circles), open circular (open circles) and linear (closed triangles) forms over time.
In-vitro Release
Release of macromolecules from PLGA microspheres is controlled by a combination of diffusion and polymer degradation [26]. Particle size, and therefore surface area to volume ratio, plays a major role in both mechanisms but with opposite trends. Diffusion-controlled release rates decrease with increasing sphere diameter. On the other hand, autocatalytic degradation rates tend to increase with increasing sphere diameter, leading to potential increase in release rates [27].
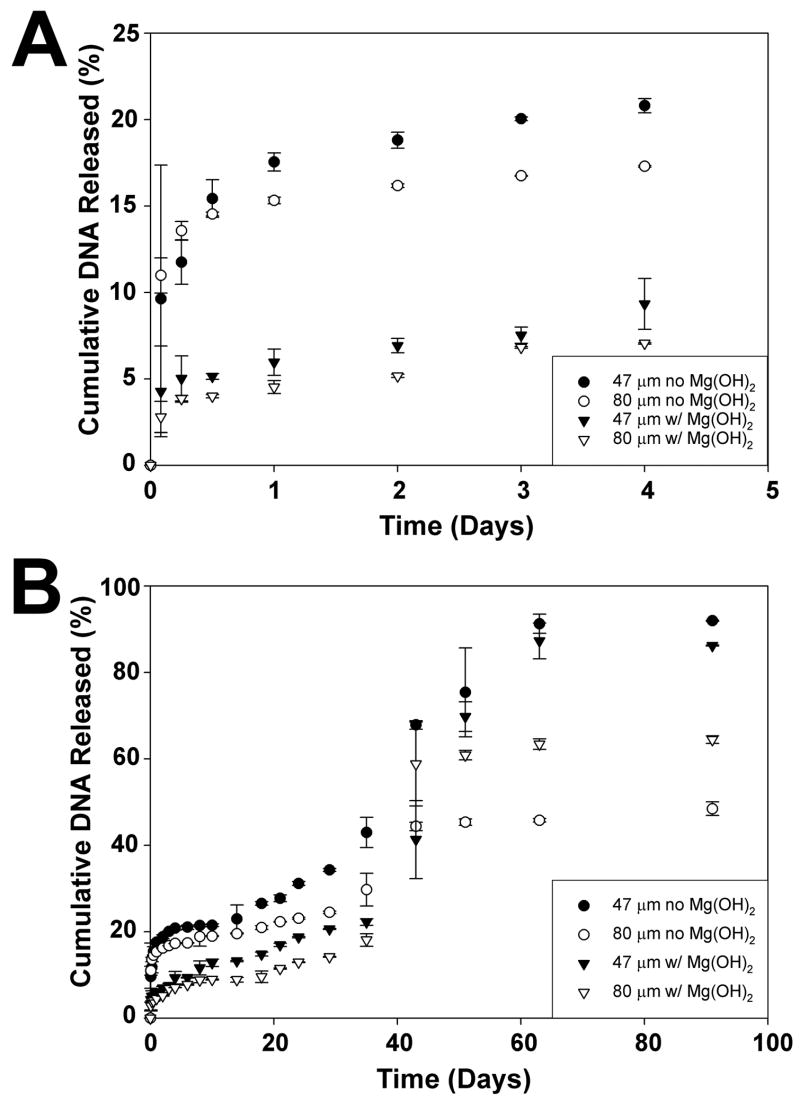
The in-vitro release of pDNA from each of the particle samples was followed for 90 days to investigate the effects of particle size and Mg(OH)2. The initial burst of release varied with the addition of magnesium hydroxide but not particle size. Microspheres without antacid released 15–17% of encapsulated DNA compared to 4–6% from particles with magnesium hydroxide after one day. Following the burst, a short lag period occurred, followed by more rapid release, typical of release profiles for many macromolecules. During this faster release, the smaller (47 μm) spheres were observed to have a higher rate of release than their 80 μm counterparts, both in the presence and absence of Mg(OH)2. Between 35–40 days, the release rates increased significantly, perhaps due to the effects of degradation and erosion on the particles (see below). Eventually, the smaller spheres exhibited almost complete release, while release from the larger spheres plateaued. Although the 80 μm spheres did not demonstrate complete release, the 3% Mg(OH)2 spheres released a higher overall fraction of DNA. This suggests that magnesium hydroxide is at least partially effective in buffering the intraparticle pH, since a more neutral local environment may be expected to provide greater stability to the plasmid DNA.
As described above, no fragmentation of plasmid DNA released from the microspheres was observed at times as late as three weeks. We were not able to assess the conformation of released DNA at later time points. In addition, the assay used to determine DNA concentration cannot distinguish between super-coiled, open-circular and linear DNA, nor between plasmid DNA and DNA fragments. Thus, it is possible that the release DNA detected at later times may have been damaged and, therefore, not bioactive.
Visualization of particle erosion
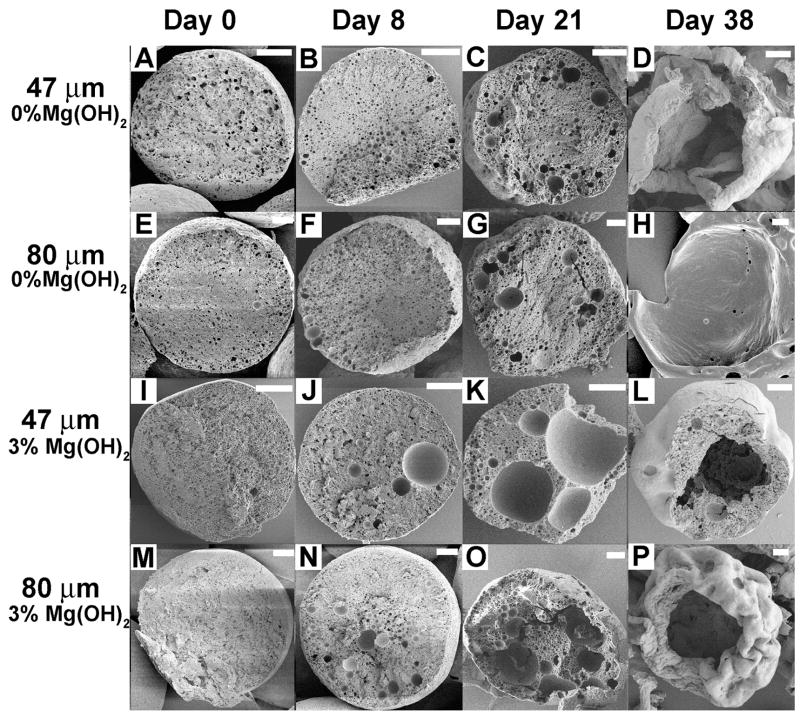
Cross-sectional scanning electron micrographs allow for elucidation of the extent of particle erosion over time. Initially, small pores were present in all of the microspheres (Figure 5A, E, I, M). Spheres produced without Mg(OH)2 appeared to have slightly larger pores than those made with Mg(OH)2, which is consistent with differences in initial surface porosity. After 8 days of incubation in PBS at 37 °C, noticeably larger pores, on the order of 2–8 μm diameter, were present in the spheres containing Mg(OH)2 (Figure 5J, N). In the absence of magnesium hydroxide, spheres appeared largely unchanged. After 21 days (Figure 5K, O), larger pores, on the order of 10–20 μm diameter, were observed within the Mg(OH)2 containing particles. Increased pore formation was also evident in the non-Mg(OH)2 spheres as several pores on the order of 3–9 μm diameter were apparent at this time point (Figure 5C, G). By day 38, it is clear that substantial erosion has occurred. Although the antacid-containing microspheres were eroded more extensively on days 8 and 21, by day 38 they exhibited hollow centers and more closely resembled core/shell microparticles than solid microspheres (Figure 5L, P). In comparison, the non-antacid microspheres underwent severe erosion between days 21 and 38 (Figure 5D, H), and appear to have eroded even further than the 3% Mg(OH)2 microspheres. This substantial change between days 21 and 38 in the non-Mg(OH)2 spheres is likely due to effects from auto-catalytic degradation. The lack of such a profound effect in the antacid-containing particles provides further evidence that the antacid aids in buffering the microclimate within the microsphere.
Figure 5.
Cross sectional SEM images of microspheres at various time points during in vitro degradation. Scale bar is 10 μm.
Evolution of surface porosity
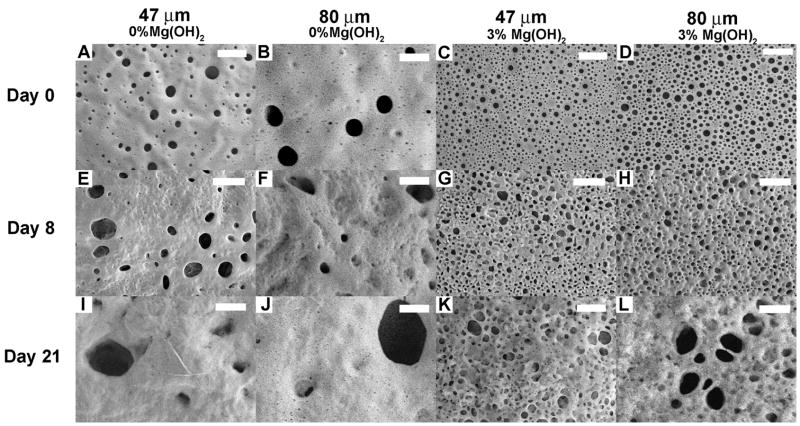
From the initial SEM images of the microsphere surfaces (Figure 6A–D), it is clear that the microspheres containing Mg(OH)2 had greater surface porosity than those without antacid, but with smaller pore sizes. After 8 and 21 days of degradation, the pores on the surface of non-Mg(OH)2 microspheres increased in size considerably. On day 8, multiple pores around 1 μm in diameter were observed (Figure 6E, F), and on day 21 pores greater than 2 μm in diameter were seen (Figure 6I, J). The antacid-containing microspheres likewise showed an increase in pore size, but the increase did not appear to be as dramatic as for the microspheres in the absence of antacid.
Figure 6.
SEM images showing temporal surface pore evolution for microspheres. Scale bar is 2 μm.
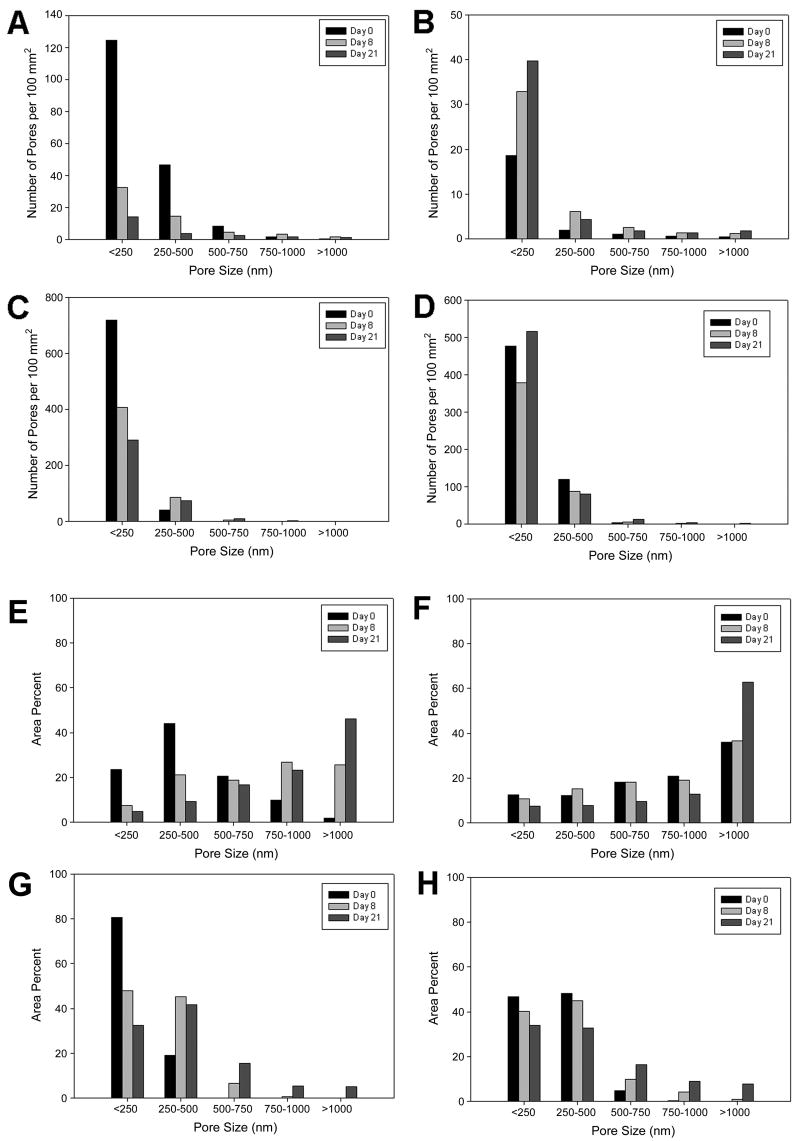
Image analysis was used to quantify the pore sizes and size distributions seen in the SEMs (Figure 7). Initially, the 3% Mg(OH)2 microspheres had many more pores per area than the non-antacid spheres (Figure 7, A–D). Over time, the number of pores on the 47 μm microspheres decreased dramatically, whereas for the 80 μm spheres the number of pores stayed the same or increased slightly. The non-antacid microspheres had a large area of pores greater than 500 nm, ~30% for the 47 μm particles and ~75% for the 80 μm spheres (Figure 7, E–H). In contrast, the 3% Mg(OH)2 microspheres initially had almost all of their area in pores less than 500 nm. After incubation, the pore size increased, as expected. This was most pronounced in the <250 nm bin, as all four types of microspheres shifted away from this size range over time. The 47 μm, non-Mg(OH)2 particles had a dramatic reduction in the <250 nm and 250–500 nm bins, with a corresponding increase in the 750–1000 nm and >1000 nm bins from day zero to day 8 (Figure 7E). Given that the number of pores per area is decreasing (by about 100 per 100 mm2), it is likely that as the pores grow, they combine with other pores to drastically increase in size [21]. This is true of the 47 μm, 3% Mg(OH)2 group, as well (Figure 7G). From day zero to day 8 there is a decrease of about 300 pores per 100 mm2, so it is likely that pores from the <250 nm bin are combining to create a significant area in the 250–500 nm range. The pore size distribution of 80 μm, non-Mg(OH)2 particles change little from day zero to day 8. However, they do show a slight decrease in all bins less than 1000 nm, and a 30% increase for the >1000 nm bin from day 8 to day 21. The 80 μm, 3% Mg(OH)2 particles demonstrate perhaps the most consistent trend (Figure 7H). As incubation time increases there is a gradual decrease of the bins less than 500 nm, and a matching increase of all bins greater than 500 nm.
Figure 7.
Quantitative analysis of temporal surface pore evolution at Day 0, Day 8, and Day 21. (A–D) Average number of pores in each bin per 100 mm2. (E–H) Area percent of pores in each size range. (A, E) 47 μm non-Mg(OH)2, (B, F) 80 μm non-Mg(OH)2, (C, G) 47 μm 3% Mg(OH)2, and (D, H) 80 μm 3% Mg(OH)2.
Discussion
The principles governing controlled release of plasmid DNA have not been well understood. Owing to its large size, and instability in an even mildly acidic environment, results have been mixed. While some studies show bursts of as much as 90% of DNA release within the first day [15], others exhibit limited bursts with less than 50% cumulative release [28]. Despite these inconsistencies, the variety of administrative pathways, targeting possibilities, and potential for long term gene expression make microspheres a promising gene delivery vector.
We used the PPF method to fabricate uniform microspheres with Mg(OH)2, an antacid, to buffer the acidic microclimate within the PLGA particles. A more neutral microclimate is expected to decrease the likelihood of DNA degradation and increase the bioavailability of the drug. Surprisingly, we found that the addition of antacid modified the surface morphology of the microspheres, resulting in a homogeneous coverage of small surface pores. Microspheres manufactured with 3% Mg(OH)2 produced a significantly smaller burst compared to their non-Mg(OH)2 counterparts. The burst effect in microspheres is widely thought to be a result of drug localized near the surface of the sphere diffusing through open surface pores [29]. Since the pGL3 DNA is around 200 nm in diameter, it is more likely to be trapped within the smaller pores of the 3% Mg(OH)2 microspheres than in the larger pores of the non-Mg(OH)2 spheres. The burst reduction in the antacid-containing spheres may have been aided by complexation between the antacid and the plasmid DNA to form larger nanoparticulates. Larger nanoparticulates would be further hindered by pore size, resulting in a decreased release rate. However, a gel retardation study in which pDNA was compared to pDNA incubated with Mg(OH)2 showed no difference, implying that complexation was not a factor in release. In short, even though the overall surface porosity was larger in the antacid-containing microspheres, the large pore sizes in the non-antacid-containing spheres appear to be the dominating factor in controlling the extent of the burst.
Using the PPF method, the structure of the supercoiled DNA was maintained during the fabrication process and there was no evidence of DNA fragmentation (Figure 2A). Magnesium hydroxide had no noticeable effect on DNA stability one or three weeks after rehydration. We hypothesized that the lack of supercoiled pDNA could be due to its preferential release from the microspheres. Although we did find that supercoiled DNA was transformed into the open circular form during incubation with blank microspheres, it is important to note that the release buffer could not periodically be replaced in this experiment (since the DNA was suspended in the buffer), unlike in the in-vitro release experiment. Even with the non-replacement of buffer, the supercoiled DNA had a half-life of ~8 days. This fact, coupled with the presence of only a slight supercoiled band in the one week microsphere extraction (Figure 2B), suggests that at least some of the supercoiled DNA is releasing preferentially. The addition of magnesium hydroxide did appear to affect the amount of DNA available for release in the 80 μm formulations. The 3% Mg(OH)2, 80 μm spheres showed 30% higher cumulative release than the non-antacid spheres, suggesting increased DNA stability.
The 3% Mg(OH)2 spheres showed a more rapid increase in internal porosity compared to the non-Mg(OH)2 spheres. At days 8 and 21, SEM cross-sections indicated higher porosity, suggesting more extensive erosion in the antacid-containing microspheres. At first, this may appear counterintuitive. The non-antacid microspheres appear to have a greater internal porosity than the 3% Mg(OH)2 spheres. The lower internal porosity, along with the buffering capacity of antacid, is expected to result in slower degradation and erosion in the 3% Mg(OH)2 spheres. However, PLGA millicylinders and microspheres with magnesium hydroxide have been shown to have greater water uptake compared to their non-antacid counterparts [22, 25]. An increased water uptake, as well as dissolution and transport of antacid molecules out of the microsphere, would result in an increased degradation rate, leading to greater erosion. We note, however, that there appears to be little correlation between the surface pore evolution (Figures 7 and 8) and the release profiles after the initial burst. Thus, it appears that the primary effect of the surface pore sizes is to control the initial burst release. Subsequent release rates are more likely controlled by erosion and evolution of the internal porosity of the particles.
The final amount of cumulative release was primarily affected by microsphere size and not antacid concentration. Both batches of 47 μm spheres exhibited complete release at 60 days, whereas the 80 μm spheres showed incomplete release. This is most likely due to the higher surface area to volume ratio of the smaller spheres. This higher ratio means that any acidic degradation byproducts are likely to more quickly diffuse out of the smaller microspheres, but remain entrained in the larger spheres for longer periods of time, lowering the intraparticle pH. The fact that the 80 μm, 3% Mg(OH)2 spheres released a higher fraction of DNA than the 80 μm, non-Mg(OH)2 spheres, suggests that the antacid is partially effective in neutralizing this deleterious effect.
It may be beneficial to study the effect of further increasing the concentration of antacid in the microsphere formulations. A greater amount of Mg(OH)2 could potentially aid in further stabilization of the DNA, resulting in a greater cumulative release of DNA from larger spheres. However, more antacid might also result in a more porous microstructure, which may negatively impact the release rate kinetics of DNA from the spheres.
Conclusions
We have manufactured DNA-encapsulating PLGA microspheres of different sizes and antacid content. By adding Mg(OH)2 as an antacid excipient, we were able to change the surface morphology of our particles, and reduce the burst effect. In addition, we have demonstrated complete DNA release from 47 μm particles, and established that antacid does at least partially aid in increasing the stability of DNA in an acidic microclimate. Image analysis enabled quantitative measurements of conformational changes in the pore surface structure, and SEM cross-sectional images showed the extent of polymer erosion over time. Our studies indicate that the incorporation of antacid into the microsphere structure has potential in addressing some of the major problems associated with DNA encapsulation in and release from PLGA microspheres.
Figure 4.
In-vitro p-DNA release from microspheres. (A) initial release showing burst profile. (B) long-term, 90-day release.
Acknowledgments
This research was sponsored by the National Institute of Health under NIH EB002878 and NIH EB005181. All scanning electron microscopy studies were carried out in the Center for Microanalysis of Materials, University of Illinois, which is partially supported by the U.S. Department of Energy under grant DEFG02-91-ER45439.
Footnotes
Publisher's Disclaimer: This is a PDF file of an unedited manuscript that has been accepted for publication. As a service to our customers we are providing this early version of the manuscript. The manuscript will undergo copyediting, typesetting, and review of the resulting proof before it is published in its final citable form. Please note that during the production process errors may be discovered which could affect the content, and all legal disclaimers that apply to the journal pertain.
References
- 1.Vile RG, Tuszynski A, Castleden S. Retroviral vectors: from laboratory tools to molecular medicines. Molec Biotechnol. 1996;5:139–158. doi: 10.1007/BF02789062. [DOI] [PubMed] [Google Scholar]
- 2.Felgner PL, Ringold GM. Cationic liposome-mediated transfection. Nature. 1989;337:387. doi: 10.1038/337387a0. [DOI] [PubMed] [Google Scholar]
- 3.Wasungu L, Hoekstra D. Cationic lipids, lipoplexes and intracellular delivery of genes. J Control Release. 2006;116:255–264. doi: 10.1016/j.jconrel.2006.06.024. [DOI] [PubMed] [Google Scholar]
- 4.Pack DW, Hoffman AS, Pun S, Stayton PS. Design and development of polymers for gene delivery. Nat Rev Drug Disc. 2005;4:581–593. doi: 10.1038/nrd1775. [DOI] [PubMed] [Google Scholar]
- 5.Wang D, Robinson DR, Kwon GS, Samuel J. Encapsulation of plasmid DNA in biodegradable poly(d,l-lactic-co-glycolic acid) microspheres as a novel approach for immunogene delivery. J Control Release. 1999;57:9–18. doi: 10.1016/s0168-3659(98)00099-6. [DOI] [PubMed] [Google Scholar]
- 6.Oster CG, Kim N, Grode L, Barbu-Tudoran L, Schaper AK, Kaufmann SHE, Kissel T. Cationic microparticles consisting of poly(lactide-co-glycolide) and polyethylenimine as carriers systems for parental DNA vaccination. J Control Release. 2005;104:359–377. doi: 10.1016/j.jconrel.2005.02.004. [DOI] [PubMed] [Google Scholar]
- 7.Jang JH, Shea LD. Intramuscular delivery of DNA releasing microspheres: microsphere properties and transgene expression. J Control Release. 2006;112:120–128. doi: 10.1016/j.jconrel.2006.01.013. [DOI] [PMC free article] [PubMed] [Google Scholar]
- 8.Mathiowitz E, Jacob JS, Jong YS, Carino GP, Chickering DE, Chaturvedi P, Santos CA, Vijayaraghavan K, Montgomery S, Bassett M, Morrell C. Biologically erodable microspheres as potential oral drug delivery systems. Nature. 1997;386:410–414. doi: 10.1038/386410a0. [DOI] [PubMed] [Google Scholar]
- 9.Bivas-Benita M, van Meijgaarden KE, Franken Kees LMC, Junginger HE, Borchard G, Ottenhoff THM, Geluk A. Pulmonary delivery of chitosan-DNA nanoparticles enhances the immunogenicity of a DNA vaccine encoding HLA-A*0201-restricted T-cell epitopes of Mycobacterium tuberculosis. Vaccine. 2004;22:1609–1615. doi: 10.1016/j.vaccine.2003.09.044. [DOI] [PubMed] [Google Scholar]
- 10.Hedley ML, Curley J, Urban R. Microspheres containing plasmid-encoded antigens elicit cytotoxic T-cell responses. Nat Med. 1998;4:365–368. doi: 10.1038/nm0398-365. [DOI] [PubMed] [Google Scholar]
- 11.Eniola AO, Hammer DA. Characterization of biodegradable drug delivery vehicles with the adhesive properties of leukocytes II: effect of degradation on targeting activity. Biomaterials. 2004;26:661–670. doi: 10.1016/j.biomaterials.2004.03.003. [DOI] [PubMed] [Google Scholar]
- 12.Berkland C, Kim K, Pack DW. PLG microsphere size controls drug release rate through several competing factors. Pharm Res. 2003;20:1055–1062. doi: 10.1023/a:1024466407849. [DOI] [PubMed] [Google Scholar]
- 13.Berkland C, King M, Cox A, Kim K, Pack DW. Precise control of PLG microsphere size provides enhanced control of drug release rate. J Control Release. 2002;82:137–147. doi: 10.1016/s0168-3659(02)00136-0. [DOI] [PMC free article] [PubMed] [Google Scholar]
- 14.Berkland C, Pollauf EJ, Varde NK, Pack DW, Kim KK. Monodisperse liquid-filled biodegradable microcapsules. Pharm Res. 2007;24:1007–1013. doi: 10.1007/s11095-006-9197-9. [DOI] [PubMed] [Google Scholar]
- 15.Luo D, Woodrow-Mumford K, Belcheva N, Saltzman WM. Controlled DNA delivery systems. Pharm Res. 1999;16:1300–1308. doi: 10.1023/a:1014870102295. [DOI] [PubMed] [Google Scholar]
- 16.Cohen H, Levy RJ, Gao J, Fishbein I, Kousaev V, Sosnowski S, Slomkowski S, Golomb G. Sustained delivery and expression of DNA encapsulated in polymeric nanoparticles. Gene Ther. 2000;7:1896–1905. doi: 10.1038/sj.gt.3301318. [DOI] [PubMed] [Google Scholar]
- 17.Ando S, Putnam D, Pack DW, Langer R. PLGA microspheres containing plasmid DNA: preservation of supercoiled DNA via cryopreparation and carbohydrate stabilization. J Pharm Sci. 1999;88:126–130. doi: 10.1021/js9801687. [DOI] [PubMed] [Google Scholar]
- 18.Remaut K, Sanders NN, Fayazpour F, Demeester J, DeSmedt SC. Influence of plasmid DNA topology on the transfection properties of DOTAP/DOPE lipoplexes. J Control Release. 2006;115:335–343. doi: 10.1016/j.jconrel.2006.08.009. [DOI] [PubMed] [Google Scholar]
- 19.Shenderova A, Burke TG, Schwendeman SP. The acidic microclimate in poly(lactide-co-glycolide) microspheres stabilizes camptothecins. Pharm Res. 1999;16:241–248. doi: 10.1023/a:1018876308346. [DOI] [PubMed] [Google Scholar]
- 20.Fu K, Pack DW, Klibanov AM, Langer R. Visual evidence of acidic environment within degrading poly(lactic-co-glycolic acid) (PLGA) microspheres. Pharm Res. 2000;171:100–106. doi: 10.1023/a:1007582911958. [DOI] [PubMed] [Google Scholar]
- 21.Zhu G, Schwendeman SP. Stabilization of proteins encapsulated in cylindrical poly(lactide-co-glycolide) implants: mechanism of stabilization by basic additives. Pharm Res. 2000;17:351–357. doi: 10.1023/a:1007513425337. [DOI] [PubMed] [Google Scholar]
- 22.Kang J, Schwendeman SP. Comparison of the effects of Mg(OH)2 and sucrose on the stability of bovine serum albumin encapsulated in injectable poly(d,l-lactide-co-glycolide) implants. Biomaterials. 2001;23:239–245. doi: 10.1016/s0142-9612(01)00101-6. [DOI] [PubMed] [Google Scholar]
- 23.Jaganathan KS, Rao YUB, Singh P, Prabakaran D, Gupta S, Jain A, Vyas SP. Development of a single dose tetanus toxoid formulation based on polymeric microspheres: a comparative study of poly(d,l-lactic-co-glycolic acid) versus chitosan microspheres. Int J Pharm. 2005;294:23–32. doi: 10.1016/j.ijpharm.2004.12.026. [DOI] [PubMed] [Google Scholar]
- 24.Berkland C, Kim K, Pack DW. Fabrication of PLG microspheres with precisely controlled and monodisperse size distributions. J Control Release. 2001;73:59–74. doi: 10.1016/s0168-3659(01)00289-9. [DOI] [PubMed] [Google Scholar]
- 25.Zhu GZ, Mallery SR, Schwendeman SP. Stabilization of proteins encapsulated in injectable poly(lactide-co-glycolide) Nat Biotechnol. 2000;18:52–57. doi: 10.1038/71916. [DOI] [PubMed] [Google Scholar]
- 26.O'Donnell PB, McGinity JW. Preparation of microspheres by the solvent evaporation technique. Adv Drug Del Rev. 1997;28:25–42. doi: 10.1016/s0169-409x(97)00049-5. [DOI] [PubMed] [Google Scholar]
- 27.Klose D, Siepmann F, Elkharraz K, Krenzlin S, Siepmann J. How porosity and size affect the drug release mechanisms from PLGA-based microparticles. Int J Pharm. 2006;314:198–206. doi: 10.1016/j.ijpharm.2005.07.031. [DOI] [PubMed] [Google Scholar]
- 28.Jang JH, Shea LD. Controllable delivery of non-viral DNA from porous scaffolds. J Control Release. 2003;86:157–168. doi: 10.1016/s0168-3659(02)00369-3. [DOI] [PubMed] [Google Scholar]
- 29.Kim TH, Park TG. Critical effect of freezing/freeze-drying on sustained release of FITC-dextran encapsulated within PLGA microspheres. Int J Pharm. 2004;271:207–214. doi: 10.1016/j.ijpharm.2003.11.021. [DOI] [PubMed] [Google Scholar]


