

Abstract
In normal humans, relationships between cognitive test performance and cortical structure have received little study, in part, because of the paucity of tools for measuring cortical structure. Computational morphometric methods have recently been developed that enable the measurement of cortical thickness from MRI data, but little data exist on their reliability. We undertook this study to evaluate the reliability of an automated cortical thickness measurement method to detect correlates of interest between thickness and cognitive task performance. Fifteen healthy older participants were scanned four times at two-week intervals on three different scanner platforms. The four MRI datasets were initially treated independently to investigate the reliability of the spatial localization of findings from exploratory whole-cortex analyses of cortical thickness-cognitive performance correlates. Next, the first dataset was used to define cortical ROIs based on the exploratory results that were then applied to the remaining three datasets to determine whether the relationships between cognitive performance and regional cortical thickness were comparable across different scanner platforms and field strengths. Verbal memory performance was associated with medial temporal cortical thickness, while visuomotor speed/set-shifting was associated with lateral parietal cortical thickness. These effects were highly reliable—in terms of both spatial localization and magnitude of absolute cortical thickness measurements—across the four scan sessions. Brain-behavior relationships between regional cortical thickness and cognitive task performance can be reliably identified using an automated data analysis system, suggesting that these measures may be useful as imaging biomarkers of disease or performance ability in multi-center studies in which MRI data are pooled.
Introduction
Remarkably specific cognitive deficits can be present in patients with focal cortical lesions (Caramazza and Hillis, 1991; Damasio et al., 1996; Stuss et al., 2001a; Rosenbaum et al., 2005). Yet the relationships, in normal persons, between individual differences in performance on neuropsychologic tests and individual variability in measures of cortical structure have received relatively little study. The lack of data on this fundamental brain-behavior correlate is in part a reflection of the paucity of tools with which to perform such measurements. Manual operator-derived region-of-interest (ROI) measurements from magnetic resonance imaging (MRI) data have demonstrated, for example, that hippocampal and entorhinal volume in patients with Alzheimer’s disease (AD) correlates with performance on particular neuropsychological tests of memory (de Toledo-Morrell et al., 2000; De Toledo-Morrell et al., 2000; Kramer et al., 2005). However, manual ROI-based approaches are limited in that they are quite laborious, and thus are typically restricted to a few brain regions. Furthermore, this procedure enables the measurement of only cortical volume, not cortical thickness, because the cortical thickness is a property that can only be properly measured if the location and orientation of both the gray/white and pial cortical surfaces are known. In addition, cortical volumetric approaches typically require an a priori definition of the ROIs, limiting the possibility of exploratory analyses of other cortical regions or of subregions within the ROIs.
Voxel-based methods have been developed that enable the exploratory analysis of MRI data with respect to clinical diagnosis, cognitive performance, or other variables, and have demonstrated relationships between the grey matter density of particular brain regions and cognitive performance measures in patients with traumatic brain injury, for example (Gale et al., 2005). Yet given the range of normal individual variance in cortical morphologic features, such as gyral and sulcal patterns, the use of voxel-based tools that transform and smooth individual MRI data into common coordinate spaces may remove the precise features of interest for studies investigating within-group correlations between cortical morphometry and cognitive performance, and reduce the ability to specifically localize findings. Furthermore, the measure typically analyzed by voxel-based techniques—“grey matter density” (Thompson et al., 2001)—is difficult to interpret quantitatively with respect to a particular morphometric property of cerebral tissue (i.e., volume, thickness, surface area).
To enable the study of morphometric properties of the human cerebral cortex and their relationship to cognitive function, disease state, or other behavioral variables, automated methods have been developed for segmenting and measuring the cerebral cortex from MRI data (Dale et al., 1999; Joshi et al., 1999; MacDonald et al., 1999; Xu et al., 1999; Zeng et al., 1999; van Essen et al., 2001; Shattuck and Leahy, 2002; Sowell et al., 2003; Barta et al., 2005; Han et al., 2005). Using such tools, relationships have been identified between regional cortical thickness and intelligence quotient (Narr et al., 2006; Shaw et al., 2006), personality measures (Wright et al., 2006; Wright et al., 2007), and memory (Walhovd et al., 2006). Although the validation of MRI-derived cortical thickness measurements has been performed against manual measurements derived from both in vivo and post-mortem MRI brain scans (Rosas et al., 2002b; Kuperberg et al., 2003a; Salat et al., 2004), the reliability of measures of this fundamental morphometric property of the brain has received relatively little systematic investigation (Fischl and Dale, 2000; Rosas et al., 2002a; Kuperberg et al., 2003b; Sowell et al., 2004; Lerch and Evans, 2005; Han et al., 2006). Most studies have investigated reliability by comparing thickness measurements across different subjects, or by performing repeated scans on a few subjects acquired within the same scan session or within very short scan intervals (e.g., the subjects were removed from the scanner and then scanned again in 5 minutes (Sowell et al., 2004)). This approach may greatly underestimate the sources of variability relevant for longitudinal studies (e.g., subject-related factors, such as hydration status, or instrument-related factors, such as scanner drift). Furthermore, the level of reliability that is needed for the detection of effects of interest is not clear, as none of these studies have evaluated the reliability of cortical morphometric methods for the detection of specific effects of interest, such as correlation of thickness with behavioral measures or group differences in thickness between normal and diseased populations. Thus, the feasibility of the pooling of MRI data across multiple centers for the study of cortical thickness correlates of behavioral performance, disease state, or other purposes is unknown.
We undertook this study to extend our previous investigation of the reliability of a cortical thickness measurement method both within and across different scanner platforms and field strengths (Han et al., 2006). In the previous investigation, we analyzed the test-retest and cross-platform and cross-field strength reliability of cortical thickness measurements across the entire cerebral cortex.
The goal of the present analysis, which makes use of the same MRI dataset used previously (Han et al., 2006), was to investigate the reliability of detection of correlates of interest between cortical thickness and cognitive task performance. Fifteen healthy older subjects were scanned four times at two-week intervals on three different scanner platforms (test scan on Siemens 1.5T, re-test scan on Siemens 1.5T, cross-site/manufacturer scan on GE 1.5T located at a different clinical site, and cross-field-strength scan on Siemens 3T). Older participants were studied so that anatomical variability related to atrophy and age-related signal changes was represented. The two-week interval was chosen so that elements of variability related to subject hydration status and minor instrument drift would be included, which may be artificially minimized when the test-retest interval is several minutes to ∼1 day. We initially treated each of the four MRI datasets independently to investigate the reliability of the spatial localization of findings from exploratory whole-cortex analyses of cortical thickness-cognitive performance correlates. Next, we used the first of the four datasets to define cortical ROIs based on the results of the exploratory analysis that could then be applied to the remaining three datasets, in an unbiased manner, to determine how well the magnitude measures of absolute cortical thickness within these regions corresponded across the datasets, and whether the relationships (slopes of regression lines) between cognitive performance and regional cortical thickness were comparable across different scanner platforms and field strengths.
Materials and methods
Subjects: Recruitment and evaluation
Healthy individuals older than 65 were recruited from the Boston metropolitan community via newspaper advertisements specifically for this reliability study. Respondents were pre-screened extensively using a standardized telephone interview (Go et al., 1997), and excluded based on evidence of significant medical, psychiatric, or neurologic conditions, the use of psychoactive medications, contraindications to MRI, or evidence of memory impairment. Respondents who were not excluded based on pre-screening were scheduled for a screening visit. All participants provided informed consent in accordance with the Human Research Committee of Massachusetts General Hospital.
At the screening visit, following informed consent, all participants underwent a standard medical, neurologic, and psychiatric evaluation by a board-certified behavioral neurologist (B.C.D.), as well as routine laboratory screening. Subjects were excluded based on the following criteria: evidence of significant medical disease (e.g., cancer, cardiovascular disease, diabetes, lung or kidney disease), neurologic disease (e.g., epilepsy, significant head trauma), psychiatric illness (e.g., depression, substance abuse); evidence of cognitive impairment by clinical evaluation; or contraindication to MRI. For subjects who were not excluded, a neuropsychologic test battery was administered. This battery included the following standard neuropsychological tests: the California Verbal Learning Test (CVLT) (Delis et al., 1987), the Trail Making Test (TMT) (Reitan, 1958), and the Mini-Mental State Examination. These tests were selected because they have demonstrated sensitivity to the cognitive impairment in both prodromal and established AD (Albert et al., 2001).
MRI Data acquisition
Each subject underwent 4 MRI scan sessions at approximately two week intervals, including two sessions on a Siemens 1.5T Sonata scanner (Siemens AG, Erlangen, Germany), one on a Siemens 3T Trio scanner, and one on a GE 1.5T Signa scanner (General Electric, Milwaukee, WI). The Siemens scanners were located at the Martinos Center for Biomedical Imaging at Massachusetts General Hospital, and the GE scanner was located at the Brigham & Women’s Hospital. The first scan session followed the screening visit (during which neuropsychological testing was performed) by about 2-4 weeks.
In each Siemens scan session, the acquisition included two MPRAGE volumes (190 Hz/pixel, flip angle= 70, 1.5T: TR/TE/TI=2.73s/3.44ms/1s, 3T: TR/TE/TI =2.53s/3.25ms/1.1s). In each GE session, a custom MPRAGE sequence was programmed with parameters as similar as possible, and two volumes were acquired. The total scanning time for the MPRAGE sequences was about 8 minutes for each acquisition. All scans were 3D sagittal acquisitions with 128 contiguous slices (imaging matrix = 256x192, in-plane resolution = 1mm, and slice thickness = 1.33mm). In each Siemens scan session, the acquisitions were automatically aligned to a standardized anatomical atlas to ensure consistent slice prescription across scans (van der Kouwe et al., 2005; Benner et al., 2006).
Cortical surface reconstruction and cortical thickness measurement
Reconstruction of the cortical surfaces and measurement of cortical thickness were performed using the FreeSurfer toolkit (version 2.2, which is freely available to the research community via the internet at http://surfer.nmr.mgh.harvard.edu/). This suite of methods was initially proposed in the 1990s (Dale et al., 1999; Fischl et al., 1999a), and has undergone several important improvements over the years (Fischl et al., 1999b; Fischl et al., 2001; Fischl et al., 2002a; Segonne et al., 2004). With these updates, the current method is fully automated, and the major steps are outlined below and detailed previously (Han et al., 2006). For this study, each dataset was processed independently without use of the longitudinal methods outlined in Han et al. (2006).
The preprocessing step performs motion correction and averaging of the two acquisitions into one T1 volume, resampling to 1mm isotropic, spatial normalization, intensity normalization, and skull stripping. The white matter (WM) is then segmented and subcortical grey matter and ventricles are filled following subcortical segmentation. Once the two WM volumes (one for each hemisphere) have been generated, a surface tessellation is constructed for each hemisphere. Then a surface-based automatic topology correction (Segonne et al., 2004) is performed to remove topological “defects”, also known as handles or holes (Fischl et al., 2001), from the initial surface tessellation. After the topology correction, a deformable model method is applied to refine the surface localization to obtain a subvoxel-accurate representation of the gray/white boundary and then further deform it to find the pial surface (Dale et al., 1999). The surface deformation involves a multi-scale and locally adaptive estimation of the MRI values at the gray/white and the pial surfaces. The deformation is accomplished by minimizing a constrained energy functional, with the constraint that the surface be smooth at the spatial scale of a few millimeters. In addition, an absolute constraint is placed on the surface during the deformation that maintains the natural topology of the cortical surface.
The reconstruction of the white and pial surfaces is sufficient for the goal of estimating cortical thickness. For visualization purposes and to facilitate the comparison of thickness results across different subjects, it is necessary to obtain an inflated model of the cortex and establish a common surface-based coordinate system. Both a partially inflated representation and a spherical map are generated from the gray/white surface for each hemisphere (Fischl et al., 1999a). The inflated surface allows easy visualization of cortical localization. The data were smoothed on the surface using an iterative nearest-neighbor averaging procedure. One hundred iterations were applied, which is equivalent to applying a 2-dimensional Gaussian smoothing kernel along the cortical surface with a full-width/half-maximum of 18.4 mm. The spherical map of each subject for each hemisphere is further morphed to a common spherical atlas using a nonlinear surface registration procedure (Fischl et al., 1999b), which allows high-resolution, surface-based averaging and comparison of cortical measurements across different subjects.
With the reconstructed gray/white and pial surfaces, cortical thickness estimates are obtained as follows. For each point on the gray/white surface, the shortest distance to the pial surface is first computed. Next, for each point on the pial surface, the shortest distance to the gray/white is found, and the cortical thickness at that location is set to the average of these two values. (Note that pathological point pairs in which the dot product between the vector from the gray/white boundary to the pial surface with the surface normal is negative are excluded.)
Statistical analysis of cortical thickness and cognitive performance data
Statistical surface maps were generated by computing a general linear model for the effects of the cognitive performance variable of interest on cortical thickness at each vertex point of the cortical surface model. Given the small number of subjects, the statistical threshold was set at a relatively liberal level for initial exploratory whole-cortex analyses (p< 0.01, two-tailed). For each MRI dataset, two separate general linear models were generated, one for CVLT delayed free recall and one for TMT-B timed speed of performance.
To explore the reliability of the detection of effects of interest across all four MRI datasets, we initially treated each dataset independently, performing two separate general linear model analyses as described above for each dataset. This yielded four maps for each cognitive performance variable, one from the ‘test’ 1.5T dataset, one from the ‘re-test’ 1.5T dataset, one from the ‘cross-platform’ 1.5T dataset, and one from the ‘cross-field-strength’ 3.0T dataset. The purpose of this analytic approach was to assess the reliability of the spatial localization of findings across all four datasets, based on the idea that lack of reliability of cortical thickness estimates would lead to differences in the spatial location of clusters of cortical regions in which thickness correlated with cognitive test performance.
In addition, we analyzed the reliability of regional cortical thickness magnitude estimates (in millimeters) across the four scan sessions, and the correlation between cortical thickness and cognitive performance, using the following approach. Once cortical regions with significant effects were identified as described above in the exploratory analysis of the ‘test’ dataset, a region of interest (ROI) based approach was used to further investigate the quantitative relationships between the four datasets. For these analyses, an ROI was generated on the template cortical surface that included all vertices in which thickness-performance correlations were observed. Specifically, in the delayed free recall analysis, an ROI was generated in the medial temporal lobe cortex. In the TMT-B analysis, an ROI was generated in the lateral parietal cortex. These ROIs are illustrated in Figures 3 and 6 below.
Figure 3.

Reliability of spatial locations where cortical thickness correlates with visuomotor/set-shifting speed performance on the Trail Making Test part B (TMT-B) in the four scans of the 15 older subjects: Test) 1.5T Siemens “test” dataset; ReTest) 1.5T Siemens “re-test” dataset; Site 2) Cross-manufacturer 1.5T GE dataset; 3T) Cross-field strength 3.0T Siemens dataset. For the purposes of this reliability study, each dataset was treated independently and subjected to an exploratory analysis across the entire cortical surface to identify regions in which thickness correlates with memory performance. Maps are presented on the semi-inflated cortical surface of an average brain with dark gray regions representing sulci and light gray regions representing gyri. The color scale represents the significance of the correlation with blue indicating regions of inverse correlation (thicker cortex correlates with better TMT-B performance (faster = smaller time values) and yellow indicating regions of direct correlation.
Using the spherical morph from each subject that transforms that subject’s cortical surface model to the average cortical surface template, these ROIs were mapped from the template to each individual subject and the mean cortical thickness within each ROI in each subject was measured. This generates, for the ‘test’ MRI datset for each of the 15 subjects, a mean cortical thickness measure for 1) the medial temporal cortical ROI and 2) the lateral parietal cortical ROI. Next, similar procedures were performed using the other three MRI datasets for each subject, using the ROIs generated from the ‘test’ dataset. Thus, bias is avoided by making measurements of the cortical thickness from the models generated from the last three datasets from each subject by using the ROI generated from the first (‘test’) dataset. The ROI analysis also avoids the problem of having to correct for large numbers of statistical tests (the so-called “multiple comparison” problem). The results of these analyses were used to plot each individual subject’s mean cortical thickness within the two ROIs against the cognitive performance measure of interest. A regression line as well as correlation r and p-values were then calculated. For all ROI based analyses a two-tailed significance threshold of p < .05 was used. These statistical analyses were performed using SPSS 11.0, (Chicago, IL).
Results
Subject characteristics and cognitive performance data
Seventeen older subjects were screened, 16 were enrolled, and 15 completed the study (age between 66 - 81 years; mean: 69.5 years; std: 4.8 years). (One subject was excluded based on a history of significant head trauma, and the other was unable to complete the scanning procedures due to excessive motion in the scanner.) Demographic and cognitive performance data are provided in Table 1. Although an informant was not interviewed in this study, all subjects received a Clinical Dementia Rating score of 0 based on subject interview and office evaluation.
TABLE 1.
Demographic and neuropsychological data on study participants
| Range | Mean | SD | |
|---|---|---|---|
| Age (yrs) | 66 - 81 | 69.5 | 4.8 |
| Education (yrs) | 12 - 21 | 16 | 3.0 |
| Sex (m/f) | 8 / 7 | ||
| MMSE | 28 - 30 | 29.5 | 0.64 |
| CVLT* | 4 - 16 | 10.4 | 3.6 |
| TMT B-T* | 58 - 118 | 81.5 | 16.6 |
CVLT = CVLT Delayed free recall; TMT B-T = Trail Making Test Part B, Time to completion
MRI scan data
MRI data were obtained from all 15 subjects. Sequence-related gradient artifacts were present in MP-RAGE data obtained on the GE Signa scanner in two subjects. Both participants returned for repeat scans; one of these two scans was artifact-free but the other contained an artifact similar to the first GE scan, so GE data were unusable for that subject. Subject motion-related artifacts were present in two Siemens datasets, one from the re-test scan session on the 1.5T Sonata and one from a different subject’s 3T Trio scan session. Thus, the total number of analyzable datasets included fifteen test 1.5T Sonata sessions, 14 re-test 1.5T Sonata sessions, 14 3T Trio sessions, and 14 1.5T Signa sessions.
Reliable identification of cortical thickness correlates of delayed free recall
Results of the statistical analysis of cortical thickness predictors of CVLT delayed free recall performance demonstrated several regionally specific correlates in the ‘test’ 1.5T dataset. In the left hemisphere, the thickness of a region of the rostral medial temporal cortex correlated with delayed free recall performance. Medial paracentral/cingulate sulcus cortical thickness was inversely correlated with free recall performance. No regions on the lateral surface or on the right hemisphere were identified. These results are illustrated in Figure 1.
Figure 1.
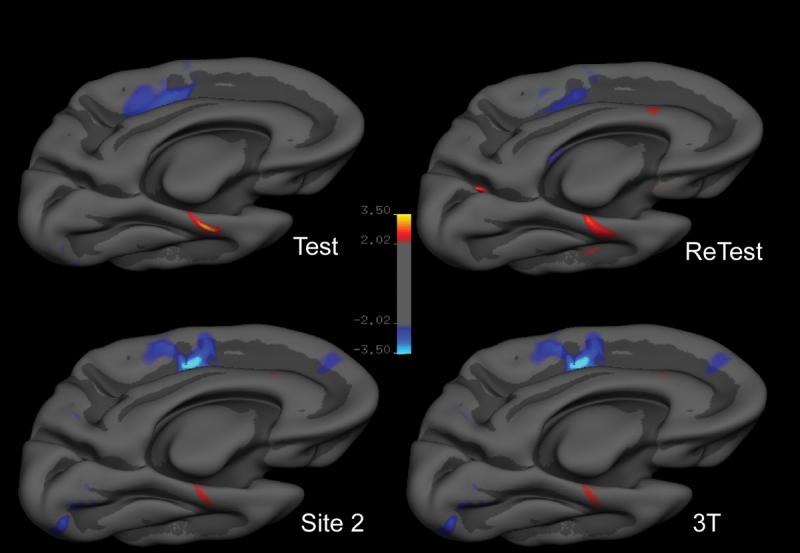
Reliability of spatial locations where cortical thickness correlates with delayed free recall performance on the California Verbal Learning Test (CVLT) in the four scans of the 15 older subjects: Test) 1.5T Siemens “test” dataset; ReTest) 1.5T Siemens “re-test” dataset; Site 2) Cross-manufacturer 1.5T GE dataset; 3T) Cross-field strength 3.0T Siemens dataset. For the purposes of this reliability study, each dataset was treated independently and subjected to an exploratory analysis across the entire cortical surface to identify regions in which thickness correlates with memory performance. Areas identified in these analyses were remarkably consistent in terms of spatial localization. Maps are presented on the semi-inflated cortical surface of an average brain with dark gray regions representing sulci and light gray regions representing gyri. The color scale represents the significance of the correlation with yellow indicating regions of direct correlation (thicker cortex correlates with better recall performance) and blue indicating regions of inverse correlation (p<0.01).
Results of similar statistical analyses in the ‘re-test’ 1.5T dataset, as well as the cross-platform 1.5T dataset and the cross-field-strength 3.0T dataset were remarkably consistent. When these datasets were analyzed independently, the spatial locations of cortical thickness correlates of delayed free recall performance were quite similar (based on visual inspection) to those described above, as shown in Figure 1. When these datasets were analyzed using an ROI-based approach, using the medial temporal cortical ROI derived from the ‘test’ dataset, strong correlations were found across the four datasets, with nearly identical slopes. The correlation derived from the 3.0T dataset demonstrated a bias toward slightly larger estimates of cortical thickness, but a nearly identical correlative effect with respect to delayed free recall performance data (slope of regression line) was observed in comparison to the three 1.5T datasets, as shown in Figure 2.
Figure 2.
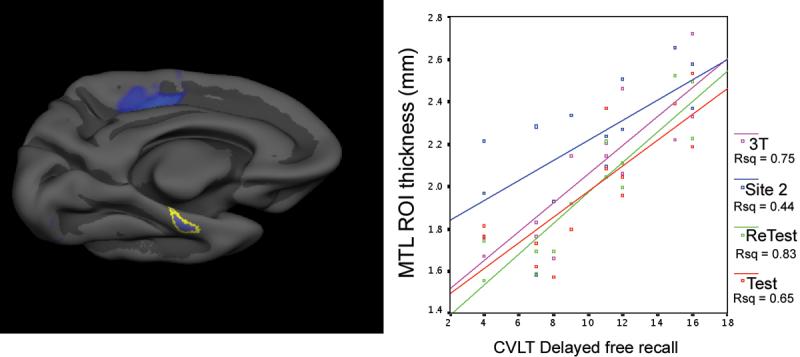
Reliability of measurements of absolute magnitude of cortical thickness within left medial temporal lobe (MTL) cortical region of interest (ROI). For this analysis, the area of the MTL in which thickness correlates with memory performance in the Test dataset was used to generate an ROI (left), which was applied in an unbiased manner to extract mean thickness from each of the four datasets. The correlations between these MTL ROI cortical thickness measures (y axis) and delayed free recall (x axis) are all highly significant (p < 0.001) and have remarkably similar slopes. 3.0T Siemens (blue) estimates of thickness are slightly higher than those of Test Siemens 1.5T (red), Re-test Siemens 1.5T (green), and GE 1.5T (magenta).
We also investigated the paracentral/cingulate sulcus region in which a consistent inverse relationship was found, using the same ROI approach described above (ROI defined in ‘test’ dataset and applied to additional datasets. The results were again very reliable across datasets in terms of slope of correlation, but the 3.0T data demonstrated a bias toward slightly larger estimates of cortical thickness (see Supplemental Figure 1).
Reliable identification of cortical correlates of visuomotor speed and set-shifting
Results of the statistical analysis of cortical thickness predictors of TMT Part B performance in the ‘test’ 1.5T dataset demonstrated, in the left hemisphere, that the thickness of a region of the lateral parietal cortex, localized rostrally within the intraparietal sulcus, was inversely correlated with TMT B performance speed. These results are illustrated in Figure 3.
Results of similar statistical analyses in the ‘re-test’ 1.5T dataset, as well as the cross-platform 1.5T dataset and the cross-field-strength 3.0T dataset were again strikingly consistent. When these datasets were treated independently and analyzed as described above, the spatial location of the cortical thickness correlate of TMT-B performance was quite similar to that described above, in the same region of the lateral parietal cortex, as shown in Figure 3. When these datasets were analyzed using an ROI-based approach, using the parietal cortical ROI derived from the ‘test’ dataset, strong correlations were found across the four datasets, again with nearly identical slopes. The correlation derived from the 3.0T dataset again demonstrated a bias toward slightly larger estimates of cortical thickness, but a nearly identical correlative effect with respect to TMT-B performance data was observed in comparison to the three 1.5T datasets, as shown in Figure 4.
Figure 4.

Reliability of measurements of absolute magnitude of cortical thickness within left lateral parietal cortical region of interest (ROI). For this analysis, the area of the parietal cortex in which thickness correlates with Trails B performance in the Test dataset was used to generate an ROI (left), which was applied in an unbiased manner to extract mean thickness from each of the four datasets. The correlations between these parietal ROI cortical thickness measures (y axis) and visuomotor/set-shifting speed (x axis) are all highly significant (p < 0.001) and have remarkably similar slopes and magnitudes, indicating that thicker parietal cortex is associated with better (faster time) performance. Test Siemens 1.5T (red), Re-test Siemens 1.5T (green), GE 1.5T (magenta), 3.0T Siemens (blue).
Exploratory interaction analysis
In addition, an exploratory analysis was run to investigate the possibility that there may be a scan session * task performance interaction with respect to cortical thickness. This analysis was run in an exploratory fashion across the entire cortical surface within the framework of a general linear model with scan session as a class variable and task performance as a continuous variable (this analysis was run twice, once for each cognitive task variable). The contrast of interest focused on a class * performance interaction, asking the question of whether there may be a difference in the correlation slopes between performance and cortical thickness as a function of one or more of the scan sessions. The results of this analysis indicated that there were no regions showing such an effect (p<0.01, two-tailed).
Discussion
In this study, we demonstrate that an automated method for the measurement of cortical thickness from MRI data is remarkably reliable for the detection and quantification of regional cortical thickness correlates of cognitive performance in normal older adults. In a small sample of subjects, dissociated effects were detected between the performance of two different cognitive tests and cortical thickness in two different brain regions. Verbal memory performance was associated with left medial temporal cortical thickness, while visuomotor speed/set-shifting was associated with thickness of a region of the lateral parietal cortex. These effects were highly reliable—not only in terms of spatial localization but also magnitude of absolute cortical thickness measurements—across four different scan sessions, including 1.5T test and re-test sessions, a 1.5T session at a different site using a scanner made by a different manufacturer, and a session on a higher-field strength (3.0T) scanner, each of which was separated by a two-week interval.
With respect to the localized regions of the cerebral cortex where thickness correlates with cognitive performance, the findings of the present study are consistent with previous data. Delayed recall of recently learned information depends critically on the integrity of the medial temporal lobe memory system (Squire et al., 2004). The rostral medial temporal cortex, encompassing entorhinal and perirhinal cortices, is known from neurophysiologic studies to be important for delayed memory performance in rats (Young et al., 1997), monkeys (Suzuki et al., 1997), and humans (Fried et al., 1997). Although some volumetric imaging studies of entorhinal cortex suggest that it is important for immediate recall (De Toledo-Morrell et al., 2000), others demonstrate its importance in delayed recall (Rodrigue and Raz, 2004; Dickerson et al., 2005). The TMT is usually thought to be a test in which performance is compromised by frontal cortical lesions, particularly those in the dorsolateral prefrontal cortex (Stuss et al., 2001b). Yet functional imaging studies have shown that performance of this task recruits parietal cortex (Asari et al., 2005), likely because it involves visuospatial attentional processing and set-shifting. A functional MRI study of an analogue of the TMT reported that this task engages, in addition to dorsolateral prefrontal and supplementary motor cortex, cortical regions within the lateral parietal cortex in the intraparietal sulci (Moll et al., 2002).
Manual-operator generated ROI measurements from MRI data have been used in hypothesis-driven studies to identify specific relationships between the volume of particular cortical regions and neuropsychological test performance measures. For example, in patients with AD, delayed verbal free recall was best predicted by left hippocampal volume, while delayed spatial free recall was best predicted by right hippocampal volume (de Toledo-Morrell et al., 2000). In a mixed group of AD, frontotemporal dementia, and semantic dementia patients, hippocampal volume was the best predictor of delayed recall while frontal cortical volume was the best predictor of semantic clustering (Kramer et al., 2005). However, because of their labor-intensive nature, manual ROI-based approaches generally lend themselves best to studies in which a priori hypotheses have enabled the selection of particular brain regions for measurement. For example, in both of the aforementioned studies, entorhinal volume was not measured, so it is unclear whether relationships would have been present with memory variables.
In contrast, voxel-based morphometry (VBM) techniques have been used in exploratory whole-brain analyses to identify regionally-specific relationships between cortical grey matter density and neuropsychological test performance (Gale et al., 2005). Yet VBM involves the voxel-based transformation and smoothing of individual MRI data into common coordinate space, which may remove the precise features of interest for studies of cortical anatomy (because transformations are performed based on voxel intensity without regard to gyral or sulcal anatomic features of the cortex). Furthermore, it is difficult to interpret the grey matter density measure employed by VBM with respect to measurable biologic properties of brain tissue. Thus, it may be useful to interpret the results of an exploratory VBM analysis in terms of the generation of a hypothesis, which then could be tested to identify the particular biologic property of brain tissue that accounts for the effect (e.g., volume, thickness, or surface area of a particular neuroanatomic structure).
The automated tools used in the present study enable both efficient exploratory whole-cortex analyses for the generation of hypotheses, as well as the derivation of ROIs for use as a priori ROIs in the subsequent testing of these hypotheses in, for example, a separate subject sample. The measure is a morphometric property of the cortex--thickness--that is interpretable in an individual subject and may relate, at least in part, to neuronal or synaptic numbers within the cortex (Gomez-Isla et al., 1996; Regeur, 2000). The present analysis is limited, however, to the cerebral cortex, and a separate but related set of automated tools is required to generate measurements of the hippocampal formation, amygdala, basal ganglia, and other subcortical structures (Fischl et al., 2002b). Another important limitation of this study is the small sample size. Because of this, the particular cortical regions identified in this study should be interpreted cautiously and subjected to replication in larger samples; they are highlighted here primarily to illustrate reliability of thickness measures. Furthmore, it is not clear why there may be inverse correlations between performance and thickness, as was observed in the paracentral/cingulate sulcus region in which thinner cortex was associated with better performance on CVLT. Issues such as these deserve further investigation in larger samples of subjects.
Given the growth of multicenter imaging studies that seek to identify quantitative measures of brain structure or function that relate to disease (Jack et al., 2003; Mueller et al., 2005; Murphy et al., 2006; Belmonte et al., 2007), it is surprising that there has been fairly little study of the influence of MRI instrument-related factors on the reliability of such putative imaging biomarkers (Han et al., 2006; Jovicich et al., 2006). Since measures of cortical thinning are sensitive (Lerch et al., 2006) and reasonably specific (Du et al., 2007), at least in the context of particular neurodegenerative diseases, these measures are a promising candidate MRI imaging biomarker. Knowledge of the degree to which different MRI instrument-related factors—such as field strength, scanner manufacturer, and scanner software and hardware upgrades—affect the reliability of cortical thickness measures is essential for the interpretation of these measures in basic and clinical neuroscientific studies. This knowledge is critical if cortical thickness measures are to find applications as biomarkers in clinical trials of putative treatments for neurodegenerative or other neuropsychiatric diseases. Reliability of putative MRI biomarkers should be assessed not only using statistical reliability measures (Han et al., 2006), such as intraclass correlation, but also by determining how well “real world” effects of interest can be detected. The present study indicates that automated measures of cortical thickness are highly reliable within scanner systems and across manufacturers and field strengths for the localization and quantification of cortical thickness correlates of cognitive test performance. Further study of the influence of instrument-related factors on quantitative MRI-derived measures of brain anatomy will be critical if these measures are to be successfully translated into useful imaging biomarkers of disease or performance ability (Dickerson and Sperling, 2005).
Supplementary Material
Supplemental figure. Reliability of measurements of absolute magnitude of cortical thickness within left paracentral/cingulate sulcus cortical region of interest (ROI). For this analysis, the ROI was derived from the test dataset (shown on top left left of Figure 1), which was applied to extract mean thickness from each of the four datasets. The correlations between these ROI cortical thickness measures (y axis) and delayed free recall (x axis) are all highly significant (p < 0.001) and have remarkably similar slopes. 3.0T Siemens (blue) estimates of thickness are slightly higher than those of Test Siemens 1.5T (red), Re-test Siemens 1.5T (green), and GE 1.5T (magenta).
Acknowledgements
This study was supported by grants from the NIA (K23-AG22509), the NCRR (P41-RR14075 R01 RR16594-01A1, the NCRR BIRN Morphometric Project BIRN002, U24 RR021382 & U24-RR021382), and the Mental Illness and Neuroscience Discovery (MIND) Institute. Additional support was provided by the National Institute for Biomedical Imaging and Bioengineering (R01 EB001550), the National Institute for Neurological Disorders and Stroke (R01 NS052585-01) and the National Alliance for Medical Image Computing (NAMIC), funded by the National Institutes of Health through the NIH Roadmap for Medical Research, Grant U54 EB005149.
We thank Jeanette Gunther and the staff of the MGH Gerontology Research Unit, as well as Mary Foley and Larry White for their technical assistance with data acquisition. We express special appreciation to the participants in this study for their valuable contributions, without which this research would not have been possible.
Footnotes
Publisher's Disclaimer: This is a PDF file of an unedited manuscript that has been accepted for publication. As a service to our customers we are providing this early version of the manuscript. The manuscript will undergo copyediting, typesetting, and review of the resulting proof before it is published in its final citable form. Please note that during the production process errors may be discovered which could affect the content, and all legal disclaimers that apply to the journal pertain.
References
- Albert MS, Moss MB, Tanzi R, Jones K. Preclinical prediction of AD using neuropsychological tests. J Int Neuropsychol Soc. 2001;7:631–639. doi: 10.1017/s1355617701755105. [DOI] [PubMed] [Google Scholar]
- Asari T, Konishi S, Jimura K, Miyashita Y. Multiple components of lateral posterior parietal activation associated with cognitive set shifting. Neuroimage. 2005;26:694–702. doi: 10.1016/j.neuroimage.2004.12.063. [DOI] [PubMed] [Google Scholar]
- Barta P, Miller MI, Qiu A. A stochastic model for studying the laminar structure of cortex from MRI. IEEE Trans Med Imaging. 2005;24:728–742. doi: 10.1109/TMI.2005.846861. [DOI] [PubMed] [Google Scholar]
- Belmonte MK, Mazziotta JC, Minshew NJ, Evans AC, Courchesne E, Dager SR, Bookheimer SY, Aylward EH, Amaral DG, Cantor RM, Chugani DC, Dale AM, Davatzikos C, Gerig G, Herbert MR, Lainhart JE, Murphy DG, Piven J, Reiss AL, Schultz RT, Zeffiro TA, Levi-Pearl S, Lajonchere C, Colamarino SA. Offering to Share: How to Put Heads Together in Autism Neuroimaging. J Autism Dev Disord. 2007 doi: 10.1007/s10803-006-0352-2. [DOI] [PMC free article] [PubMed] [Google Scholar]
- Benner T, Wisco JJ, van der Kouwe AJ, Fischl B, Vangel MG, Hochberg FH, Sorensen AG. Comparison of manual and automatic section positioning of brain MR images. Radiology. 2006;239:246–254. doi: 10.1148/radiol.2391050221. [DOI] [PubMed] [Google Scholar]
- Caramazza A, Hillis AE. Lexical organization of nouns and verbs in the brain. Nature. 1991;349:788–790. doi: 10.1038/349788a0. [DOI] [PubMed] [Google Scholar]
- Dale AM, Fischl B, Sereno MI. Cortical surface-based analysis. I. Segmentation and surface reconstruction. Neuroimage. 1999;9:179–194. doi: 10.1006/nimg.1998.0395. [DOI] [PubMed] [Google Scholar]
- Damasio H, Grabowski TJ, Tranel D, Hichwa RD, Damasio AR. A neural basis for lexical retrieval. Nature. 1996;380:499–505. doi: 10.1038/380499a0. [DOI] [PubMed] [Google Scholar]
- De Toledo-Morrell L, Goncharova I, Dickerson B, Wilson RS, Bennett DA. From healthy aging to early Alzheimer’s disease: in vivo detection of entorhinal cortex atrophy. Ann N Y Acad Sci. 2000;911:240–253. doi: 10.1111/j.1749-6632.2000.tb06730.x. [DOI] [PubMed] [Google Scholar]
- de Toledo-Morrell L, Dickerson B, Sullivan MP, Spanovic C, Wilson R, Bennett DA. Hemispheric differences in hippocampal volume predict verbal and spatial memory performance in patients with Alzheimer’s disease. Hippocampus. 2000;10:136–142. doi: 10.1002/(SICI)1098-1063(2000)10:2<136::AID-HIPO2>3.0.CO;2-J. [DOI] [PubMed] [Google Scholar]
- Delis DC, Kramer JH, Kaplan E, Ober BA. California verbal learning test, research edition, manual. The Psychological Corporation, Harcourt Brace Jovanovich; San Antonio: 1987. [Google Scholar]
- Dickerson BC, Sperling RA. Neuroimaging Biomarkers for Clinical Trials of Disease-Modifying Therapies in Alzheimer’s Disease. Neurorx. 2005;2:348–360. doi: 10.1602/neurorx.2.2.348. [DOI] [PMC free article] [PubMed] [Google Scholar]
- Dickerson BC, Salat DH, Greve DN, Chua EF, Rand-Giovannetti E, Rentz DM, Bertram L, Mullin K, Tanzi RE, Blacker D, Albert MS, Sperling RA. Increased hippocampal activation in mild cognitive impairment compared to normal aging and AD. Neurology. 2005;65:404–411. doi: 10.1212/01.wnl.0000171450.97464.49. [DOI] [PMC free article] [PubMed] [Google Scholar]
- Du AT, Schuff N, Kramer JH, Rosen HJ, Gorno-Tempini ML, Rankin K, Miller BL, Weiner MW. Different regional patterns of cortical thinning in Alzheimer’s disease and frontotemporal dementia. Brain. 2007 doi: 10.1093/brain/awm016. [DOI] [PMC free article] [PubMed] [Google Scholar]
- Fischl B, Dale AM. Measuring the thickness of the human cerebral cortex from magnetic resonance images. Proc Natl Acad Sci U S A. 2000;97:11050–11055. doi: 10.1073/pnas.200033797. [DOI] [PMC free article] [PubMed] [Google Scholar]
- Fischl B, Sereno MI, Dale AM. Cortical surface-based analysis. II: Inflation, flattening, and a surface-based coordinate system. Neuroimage. 1999a;9:195–207. doi: 10.1006/nimg.1998.0396. [DOI] [PubMed] [Google Scholar]
- Fischl B, Liu A, Dale AM. Automated manifold surgery: constructing geometrically accurate and topologically correct models of the human cerebral cortex. IEEE Trans Med Imaging. 2001;20:70–80. doi: 10.1109/42.906426. [DOI] [PubMed] [Google Scholar]
- Fischl B, Sereno MI, Tootell RB, Dale AM. High-resolution intersubject averaging and a coordinate system for the cortical surface. Hum Brain Mapp. 1999b;8:272–284. doi: 10.1002/(SICI)1097-0193(1999)8:4<272::AID-HBM10>3.0.CO;2-4. [DOI] [PMC free article] [PubMed] [Google Scholar]
- Fischl B, Salat DH, Busa E, Albert M, Dieterich M, Haselgrove C, van der Kouwe A, Killiany R, Kennedy D, Klaveness S, Montillo A, Makris N, Rosen B, Dale AM. Whole brain segmentation: automated labeling of neuroanatomical structures in the human brain. Neuron. 2002a;33:341–355. doi: 10.1016/s0896-6273(02)00569-x. [DOI] [PubMed] [Google Scholar]
- Fischl B, Salat DH, Busa E, Albert M, Dieterich M, Haselgrove C, van der Kouwe A, Killiany R, Kennedy D, Klaveness S, Montillo A, Makris N, Rosen B, Dale AM. Whole brain segmentation: automated labeling of neuroanatomical structures in the human brain. Neuron. 2002b;33:341–355. doi: 10.1016/s0896-6273(02)00569-x. [DOI] [PubMed] [Google Scholar]
- Fried I, MacDonald KA, Wilson CL. Single neuron activity in human hippocampus and amygdala during recognition of faces and objects. Neuron. 1997;18:753–765. doi: 10.1016/s0896-6273(00)80315-3. [DOI] [PubMed] [Google Scholar]
- Gale SD, Baxter L, Roundy N, Johnson SC. Traumatic brain injury and grey matter concentration: a preliminary voxel based morphometry study. J Neurol Neurosurg Psychiatry. 2005;76:984–988. doi: 10.1136/jnnp.2004.036210. [DOI] [PMC free article] [PubMed] [Google Scholar]
- Go RC, Duke LW, Harrell LE, Cody H, Bassett SS, Folstein MF, Albert MS, Foster JL, Sharrow NA, Blacker D. Development and validation of a Structured Telephone Interview for Dementia Assessment (STIDA): the NIMH Genetics Initiative. J Geriatr Psychiatry Neurol. 1997;10:161–167. doi: 10.1177/089198879701000407. [DOI] [PubMed] [Google Scholar]
- Gomez-Isla T, Price JL, McKeel DW, Jr., Morris JC, Growdon JH, Hyman BT. Profound loss of layer II entorhinal cortex neurons occurs in very mild Alzheimer’s disease. J Neurosci. 1996;16:4491–4500. doi: 10.1523/JNEUROSCI.16-14-04491.1996. [DOI] [PMC free article] [PubMed] [Google Scholar]
- Han X, Pham DL, Tosun D, Rettmann ME, Xu C, Prince JL. CRUISE: Cortical reconstruction using implicit surface evolution. NeuroImage. 2005;23:997–1012. doi: 10.1016/j.neuroimage.2004.06.043. [DOI] [PubMed] [Google Scholar]
- Han X, Jovicich J, Salat D, van der Kouwe A, Quinn B, Czanner S, Pacheco J, Albert M, Killiany R, Maguire P, Rosas HD, Makris N, Dale A, Dickerson B, Fischl B. Reliability of MRI-derived measurements of human cerebral cortical thickness: The effects of field strength, scanner upgrade and manufacturer. Neuroimage. 2006;32:180–194. doi: 10.1016/j.neuroimage.2006.02.051. [DOI] [PubMed] [Google Scholar]
- Jack CR, Jr., Slomkowski M, Gracon S, Hoover TM, Felmlee JP, Stewart K, Xu Y, Shiung M, O’Brien PC, Cha R, Knopman D, Petersen RC. MRI as a biomarker of disease progression in a therapeutic trial of milameline for AD. Neurology. 2003;60:253–260. doi: 10.1212/01.wnl.0000042480.86872.03. [DOI] [PMC free article] [PubMed] [Google Scholar]
- Jones SE, Buchbinder BR, Aharon I. Three-dimensional mapping of cortical thickness using Laplacian’s equation. Hum Brain Mapp. 2000;11:12–32. doi: 10.1002/1097-0193(200009)11:1<12::AID-HBM20>3.0.CO;2-K. [DOI] [PMC free article] [PubMed] [Google Scholar]
- Joshi M, Cui J, Doolittle K, Joshi S, Essen D, Wang L, Miller ML. Brain segmentation and the generation of cortical surfaces. NeuroImage. 1999;9:461–476. doi: 10.1006/nimg.1999.0428. [DOI] [PubMed] [Google Scholar]
- Jovicich J, Czanner S, Greve D, Haley E, van der Kouwe A, Gollub R, Kennedy D, Schmitt F, Brown G, Macfall J, Fischl B, Dale A. Reliability in multi-site structural MRI studies: effects of gradient non-linearity correction on phantom and human data. Neuroimage. 2006;30:436–443. doi: 10.1016/j.neuroimage.2005.09.046. [DOI] [PubMed] [Google Scholar]
- Kramer JH, Rosen HJ, Du AT, Schuff N, Hollnagel C, Weiner MW, Miller BL, Delis DC. Dissociations in hippocampal and frontal contributions to episodic memory performance. Neuropsychology. 2005;19:799–805. doi: 10.1037/0894-4105.19.6.799. [DOI] [PMC free article] [PubMed] [Google Scholar]
- Kuperberg GR, Broome MR, McGuire PK, David AS, Eddy M, Ozawa F, Goff D, West WC, Williams SC, van der Kouwe AJ, Salat DH, Dale AM, Fischl B. Regionally localized thinning of the cerebral cortex in schizophrenia. Arch Gen Psychiatry. 2003a;60:878–888. doi: 10.1001/archpsyc.60.9.878. [DOI] [PubMed] [Google Scholar]
- Kuperberg GR, Broome M, McGuire PK, David AS, Eddy M, Ozawa F, Goff D, West WC, Williams SCR, Van der Kouwe A, Salat D, Dale A, Fischl B. Regionally localized thinning of the cerebral cortex in Schizophrenia. Arch Gen Psychiatry. 2003b;60:878–888. doi: 10.1001/archpsyc.60.9.878. [DOI] [PubMed] [Google Scholar]
- Lerch JP, Evans AC. Cortical thickness analysis examined through power analysis and a population simulation. NeuroImage. 2005;24:163–173. doi: 10.1016/j.neuroimage.2004.07.045. [DOI] [PubMed] [Google Scholar]
- Lerch JP, Pruessner J, Zijdenbos AP, Collins DL, Teipel SJ, Hampel H, Evans AC. Automated cortical thickness measurements from MRI can accurately separate Alzheimer’s patients from normal elderly controls. Neurobiol Aging. 2006 doi: 10.1016/j.neurobiolaging.2006.09.013. [DOI] [PubMed] [Google Scholar]
- MacDonald D, Kabani N, Avis D, Evans AC. Automated 3-D extraction of inner and outer surfaces of cerebral cortex from MRI. NeuroImage. 1999;12:340–356. doi: 10.1006/nimg.1999.0534. [DOI] [PubMed] [Google Scholar]
- Moll J, de Oliveira-Souza R, Moll FT, Bramati IE, Andreiuolo PA. The cerebral correlates of set-shifting: an fMRI study of the trail making test. Arq Neuropsiquiatr. 2002;60:900–905. doi: 10.1590/s0004-282x2002000600002. [DOI] [PubMed] [Google Scholar]
- Mueller SG, Weiner MW, Thal LJ, Petersen RC, Jack C, Jagust W, Trojanowski JQ, Toga AW, Beckett L. The Alzheimer’s disease neuroimaging initiative. Neuroimaging Clin N Am. 2005;15:869–877. xi–xii. doi: 10.1016/j.nic.2005.09.008. [DOI] [PMC free article] [PubMed] [Google Scholar]
- Murphy SN, Mendis ME, Grethe J, Gollub R, Kennedy D, Rosen BR. A Web Portal that Enables Collaborative Use of Advanced Medical Image Processing and Informatics Tools through the Biomedical Informatics Research Network (BIRN) AMIA Annu Symp Proc. 2006:579–583. [PMC free article] [PubMed] [Google Scholar]
- Narr KL, Woods RP, Thompson PM, Szeszko P, Robinson D, Dimtcheva T, Gurbani M, Toga AW, Bilder RM. Relationships between IQ and Regional Cortical Gray Matter Thickness in Healthy Adults. Cereb Cortex. 2006 doi: 10.1093/cercor/bhl125. [DOI] [PubMed] [Google Scholar]
- Regeur L. Increasing loss of brain tissue with increasing dementia: a stereological study of post-mortem brains from elderly females. Eur J Neurol. 2000;7:47–54. doi: 10.1046/j.1468-1331.2000.00017.x. [DOI] [PubMed] [Google Scholar]
- Reitan RM. Validity of the Trail Making Test as an indicator of organic brain damage. Perceptual and Motor Skills. 1958;8:271–276. [Google Scholar]
- Rodrigue KM, Raz N. Shrinkage of the entorhinal cortex over five years predicts memory performance in healthy adults. J Neurosci. 2004;24:956–963. doi: 10.1523/JNEUROSCI.4166-03.2004. [DOI] [PMC free article] [PubMed] [Google Scholar]
- Rosas HD, Liu AK, Hersch S, Glessner M, Ferrante RJ, Salat DH, van der Kouwe A, Jenkins BG, Dale AM, Fischl B. Regional and progressive thinning of the cortical ribbon in Huntington’s disease. Neurology. 2002a;58:695–701. doi: 10.1212/wnl.58.5.695. [DOI] [PubMed] [Google Scholar]
- Rosas HD, Liu AK, Hersch S, Glessner M, Ferrante RJ, Salat DH, van der Kouwe A, Jenkins BG, Dale AM, Fischl B. Regional and progressive thinning of the cortical ribbon in Huntington’s disease. Neurology. 2002b;58:695–701. doi: 10.1212/wnl.58.5.695. [DOI] [PubMed] [Google Scholar]
- Rosenbaum RS, Kohler S, Schacter DL, Moscovitch M, Westmacott R, Black SE, Gao F, Tulving E. The case of K.C.: contributions of a memory-impaired person to memory theory. Neuropsychologia. 2005;43:989–1021. doi: 10.1016/j.neuropsychologia.2004.10.007. [DOI] [PubMed] [Google Scholar]
- Salat DH, Buckner RL, Snyder AZ, Greve DN, Desikan RS, Busa E, Morris JC, Dale AM, Fischl B. Thinning of the cerebral cortex in aging. Cereb Cortex. 2004;14:721–730. doi: 10.1093/cercor/bhh032. [DOI] [PubMed] [Google Scholar]
- Segonne F, Dale A, Busa E, Glessner M, Salat D, Hahn HK, Fischl B. A hybrid approach to the skull stripping problem in MRI. NeuroImage. 2004;22:1060–1075. doi: 10.1016/j.neuroimage.2004.03.032. [DOI] [PubMed] [Google Scholar]
- Shattuck DW, Leahy RM. BrainSuite: an automated cortical surface identification tool. Med Image Anal. 2002;6:129–142. doi: 10.1016/s1361-8415(02)00054-3. [DOI] [PubMed] [Google Scholar]
- Shaw P, Greenstein D, Lerch J, Clasen L, Lenroot R, Gogtay N, Evans A, Rapoport J, Giedd J. Intellectual ability and cortical development in children and adolescents. Nature. 2006;440:676–679. doi: 10.1038/nature04513. [DOI] [PubMed] [Google Scholar]
- Sowell ER, Peterson BS, Thompson P, Welcome SE, Henkenius AL, Toga AW. Mapping cortical changes across the human life span. Nat Neurosci. 2003;6:309–315. doi: 10.1038/nn1008. [DOI] [PubMed] [Google Scholar]
- Sowell ER, Thompson P, Leonard CM, Welcome SE, Kan E, Toga AW. Longitudinal mapping of cortical thickness and brain growth in normal children. J Neurosci. 2004;24:8223–8231. doi: 10.1523/JNEUROSCI.1798-04.2004. [DOI] [PMC free article] [PubMed] [Google Scholar]
- Squire LR, Stark CE, Clark RE. The medial temporal lobe. Annu Rev Neurosci. 2004;27:279–306. doi: 10.1146/annurev.neuro.27.070203.144130. [DOI] [PubMed] [Google Scholar]
- Stuss DT, Floden D, Alexander MP, Levine B, Katz D. Stroop performance in focal lesion patients: dissociation of processes and frontal lobe lesion location. Neuropsychologia. 2001a;39:771–786. doi: 10.1016/s0028-3932(01)00013-6. [DOI] [PubMed] [Google Scholar]
- Stuss DT, Bisschop SM, Alexander MP, Levine B, Katz D, Izukawa D. The Trail Making Test: a study in focal lesion patients. Psychol Assess. 2001b;13:230–239. [PubMed] [Google Scholar]
- Suzuki WA, Miller EK, Desimone R. Object and place memory in the macaque entorhinal cortex. J Neurophysiol. 1997;78:1062–1081. doi: 10.1152/jn.1997.78.2.1062. [DOI] [PubMed] [Google Scholar]
- Thompson PM, Mega MS, Woods RP, Zoumalan CI, Lindshield CJ, Blanton RE, Moussai J, Holmes CJ, Cummings JL, Toga AW. Cortical change in Alzheimer’s disease detected with a disease-specific population-based brain atlas. Cereb Cortex. 2001;11:1–16. doi: 10.1093/cercor/11.1.1. [DOI] [PubMed] [Google Scholar]
- van der Kouwe AJ, Benner T, Fischl B, Schmitt F, Salat DH, Harder M, Sorensen AG, Dale AM. On-line automatic slice positioning for brain MR imaging. Neuroimage. 2005;27:222–230. doi: 10.1016/j.neuroimage.2005.03.035. [DOI] [PubMed] [Google Scholar]
- van Essen DC, Dickson J, Harwell J, Hanlon D, Anderson CH, Drury HA. An integrated software system for surface-based analyses of cerebral cortex. J Am Med Info Assoc. 2001;8:443–459. doi: 10.1136/jamia.2001.0080443. [DOI] [PMC free article] [PubMed] [Google Scholar]
- Walhovd KB, Fjell AM, Dale AM, Fischl B, Quinn BT, Makris N, Salat D, Reinvang I. Regional cortical thickness matters in recall after months more than minutes. Neuroimage. 2006;31:1343–1351. doi: 10.1016/j.neuroimage.2006.01.011. [DOI] [PubMed] [Google Scholar]
- Wright CI, Feczko E, Dickerson B, Williams D. Neuroanatomical correlates of personality in the elderly. Neuroimage. 2007;35:263–272. doi: 10.1016/j.neuroimage.2006.11.039. [DOI] [PMC free article] [PubMed] [Google Scholar]
- Wright CI, Williams D, Feczko E, Barrett LF, Dickerson BC, Schwartz CE, Wedig MM. Neuroanatomical Correlates of Extraversion and Neuroticism. Cereb Cortex. 2006 doi: 10.1093/cercor/bhj118. [DOI] [PubMed] [Google Scholar]
- Xu C, Pham DL, Rettmann ME, Yu DN, Prince JL. Reconstruction of the human cerebral cortex from magnetic resonance images. IEEE Trans Med Imaging. 1999;18:467–480. doi: 10.1109/42.781013. [DOI] [PubMed] [Google Scholar]
- Yezzi A, Prince JL. An Eulerian PDE approach for computing tissue thickness. IEEE Trans Med Imaging. 2003;22:1332–1339. doi: 10.1109/TMI.2003.817775. [DOI] [PubMed] [Google Scholar]
- Young BJ, Otto T, Fox GD, Eichenbaum H. Memory representation within the parahippocampal region. J Neurosci. 1997;17:5183–5195. doi: 10.1523/JNEUROSCI.17-13-05183.1997. [DOI] [PMC free article] [PubMed] [Google Scholar]
- Zeng X, Staib LH, Schultz RT, Duncan JS. Segmentation and measurement of the cortex from 3D MR images using coupled surfaces propagation. IEEE Trans Med Imaging. 1999;18:100–111. doi: 10.1109/42.811276. [DOI] [PubMed] [Google Scholar]
Associated Data
This section collects any data citations, data availability statements, or supplementary materials included in this article.
Supplementary Materials
Supplemental figure. Reliability of measurements of absolute magnitude of cortical thickness within left paracentral/cingulate sulcus cortical region of interest (ROI). For this analysis, the ROI was derived from the test dataset (shown on top left left of Figure 1), which was applied to extract mean thickness from each of the four datasets. The correlations between these ROI cortical thickness measures (y axis) and delayed free recall (x axis) are all highly significant (p < 0.001) and have remarkably similar slopes. 3.0T Siemens (blue) estimates of thickness are slightly higher than those of Test Siemens 1.5T (red), Re-test Siemens 1.5T (green), and GE 1.5T (magenta).