Abstract
Cytochrome P4501A1 is a hepatic, microsomal membrane–bound enzyme that is highly induced by various xenobiotic agents. Two NH2-terminal truncated forms of this P450, termed P450MT2a and MT2b, are also found localized in mitochondria from β-naphthoflavone–induced livers. In this paper, we demonstrate that P4501A1 has a chimeric NH2-terminal signal that facilitates the targeting of the protein to both the ER and mitochondria. The NH2-terminal 30–amino acid stretch of P4501A1 is thought to provide signals for ER membrane insertion and also stop transfer. The present study provides evidence that a sequence motif immediately COOH-terminal (residues 33–44) to the transmembrane domain functions as a mitochondrial targeting signal under both in vivo and in vitro conditions, and that the positively charged residues at positions 34 and 39 are critical for mitochondrial targeting. Results suggest that 25% of P4501A1 nascent chains, which escape ER membrane insertion, are processed by a liver cytosolic endoprotease. We postulate that the NH2-terminal proteolytic cleavage activates a cryptic mitochondrial targeting signal. Immunofluorescence microscopy showed that a portion of transiently expressed P4501A1 is colocalized with the mitochondrial-specific marker protein cytochrome oxidase subunit I. The mitochondrial-associated MT2a and MT2b are localized within the inner membrane compartment, as tested by resistance to limited proteolysis in both intact mitochondria and mitoplasts. Our results therefore describe a novel mechanism whereby proteins with chimeric signal sequence are targeted to the ER as well as to the mitochondria.
Protein targeting to the mitochondrial and ER compartments follow distinct pathways and involve different primary translation sites, targeting signals, and transport machinery (Schatz and Dobberstein, 1996). A majority of proteins targeted to the ER reach their destination through a cotranslational mechanism that requires the association of the NH2-terminal signal sequence with signal recognition particle (SRP)1 and association of the translation complex with the ER membrane (Walter et al., 1981; Gilmore et al., 1982; and see Isenman et al., 1995 for a recent review). Exceptions to the cotranslational mechanisms that do not follow the SRP pathway have also been reported for a limited number of proteins targeted to the ER (Andersson et al., 1983; Wickner and Lodish, 1985). The membrane topology and mechanisms of targeting of the hepatic P450 isoenzymes that remain bound to the ER have been studied extensively (Bar-Nun et al., 1980; Black and Coon, 1982; Sakaguchi et al., 1987; Monier et al., 1988; Szcesna-Skorupa et al., 1988); it is generally believed that the enzyme is anchored through a single transmembrane domain with most of the catalytic domains facing the cytosolic side of the membrane (Monier et al., 1988; Szczesna-Skorupa and Kemper, 1993). Various studies (Fujii-Kuriyama et al., 1979; Bar-Nun et al., 1980; Sakaguchi et al., 1987; Monier et al., 1988; Szczesna-Skorupa et al., 1988) have shown that the NH2-terminal hydrophobic sequence functions as an unclipped signal for targeting to the ER through the cotranslational SRP pathway. In particular, the NH2-terminal 25–30 hydrophobic residues have been shown to provide the signal for membrane insertion and stop transfer, in addition to serving as the transmembrane anchor (Sakaguchi et al., 1987; Monier et al., 1988; Szczesna-Skorupa et al., 1988). Mitochondrial protein transport, on the other hand, occurs through a posttranslational mechanism and involves a complex series of interactions of the protein with various cytosolic factors (Ohta and Schatz, 1984; Murakami et al., 1988; Kang et al., 1990; Hachiya et al., 1995), as well as interaction of the NH2-terminal or internal mitochondrial specific signal sequence with the multisubunit outer and inner membrane receptors (Sollner et al., 1989; Lithgow et al., 1994; Hachiya et al., 1995; Lill et al., 1996; Schatz and Dobberstein, 1996). In this paper, we demonstrate that the rat cytochrome P4501A1 protein contains an unusual chimeric signal that facilitates its targeting to both the ER and mitochondria through a novel pathway.
The hepatic cytochrome P450s are mostly localized on the ER (hereafter referred to as microsomes), though some of the constitutive as well as inducible forms are also found in the mitochondrial compartment. The occurrence of xenobiotic inducible cytochrome P450 (P450) forms in the hepatic (Niranjan and Avadhani, 1980; Niranjan et al., 1984; Honkakowski et al., 1988; Raza and Avadhani, 1988; Anandatheerthavarada et al., 1997) and brain (Bhagwat et al., 1995; Iscan et al., 1990) mitochondria have been reported by many groups, although their primary sequence and gene structure remain unclear. It is well documented that the rat genome contains a single or limited number of gene copies for some of the xenobiotic inducible P450 forms, including P4501A1/2, P4503A1/2, and P4502E1 (Gonzalez, 1990). This apparent limitation raises questions on the precise nature and sequence properties of the similarly inducible mitochondrial P450 forms that exhibit immunological cross-reactivity to the major microsomal forms. In the present study, we have extensively characterized the β-napthoflavone (BNF)-inducible mitochondrial P450MT2 and surprisingly found that it exists in two electrophoretically separable molecular forms that are different NH2-terminal truncated versions of the microsomal P4501A1. Our results also suggest that the NH2-terminal processing past the 4th or 32nd amino acid residues by a cytosolic endoprotease exposes a cryptic mitochondrial targeting sequence that directs the protein into the mitochondrial compartment. We postulate that this mode of protein targeting represents a novel mechanism for the biogenesis of not only P450MT2, but for other mitochondrial drugs metabolizing P450 enzymes as well.
Materials and Methods
Tissue Fractionation and P450 Purification
Mitochondria and microsomes were isolated from the treated or untreated Sprague Dawley rat livers described before (Niranjan et al., 1984). Freshly isolated mitochondria from untreated livers were washed three times with the sucrose-mannitol buffer and used for in vitro protein import assays. For purifying P450MT2, mitochondria from BNF-treated livers (Raza and Avadhani, 1988) were fractionated with 75 μg/mg digitonin (Niranjan et al., 1984) under conditions that yield mitoplasts with <1% microsomal-specific NADPH cytochrome c reductase (rotenone insensitive), 0.7% outer membrane–specific monoamine oxidase, and >95% mitochondrial-specific cytochrome c oxidase (COX) and isocitrate dehydrogenase activities (Anandatheerthavarada et al., 1997). The mitochondrial P450MT2 and microsomal P4501A1 were purified as described previously (Raza and Avadhani, 1988). The postmitochondrial supernatant was used to prepare the microsomal fraction as described (Niranjan et al., 1984).
Bacterial expression of +5/1A1 and +33/1A1 was carried out using the PCW vector as described before (Imai et al., 1993). Details of induced expression and purification of proteins have been described elsewhere (Anandatheerthavarada, H.K., S. Addya, J. Mullick, and N.G. Avadhani, manuscript submitted for publication).
Peptide Fingerprint Analysis and Amino Acid Sequencing
Purified P450MT2 and the microsomal P4501A1 were resolved by electrophoresis on 14–16% gradient polyacrylamide gels by overrunning. Protein bands (P450MT2a/MT2b and P4501A1) were transferred to PVDF membrane and subjected to NH2-terminal sequencing (model 475A sequencer; Applied Biosystems, Inc., Foster City, CA). Proteins immobilized on polyvinyldifluoride (PVDF) membranes were subjected to trypsin digestion, and the peptides were recovered and resolved on a reverse-phase microbore HPLC column using 80% acetonitrile and 10% TFA solvent system. Different peak fractions were collected, lyophilized, and subjected to NH2-terminal sequencing.
Preparation of Antibody and Subcellular Protein Fractions
A high titer polyclonal antibody in rabbits was raised against >95% homogeneous P450MT2 using standard protocols (Parkinson and Gemzik, 1991). The antibody was affinity purified against bacterially expressed, purified +33/1A1 protein conjugated to a solid matrix.
The rat liver cytosolic fraction, without added protease inhibitors, was fractionated with (NH4)2SO4, and the proteins precipitating between 18 and 40% saturation were collected by centrifugation at 100,000 g for 30 min. The protein preparation was dialyzed against 20 mM KH2PO4, pH 7.4, 20 mM KCl, 1 mM EDTA, and 0.5 mM DTT, suspended in the same buffer, and stored in −80°C. Canine pancreatic ER was generously provided by Dr. Reid Gilmore (University of Massachusetts Medical Center, Worcester, MA).
Construction of Expression Plasmids
P4501A1 cDNA (Yabusaki et al., 1984) containing a 5′ HindIII site and a 3′ XbaI site was generated by the reverse transcriptase–based PCR. Various NH2-terminal deletions were generated by PCR amplification of the parent cDNA using the appropriate sense primer containing an ATG codon and upstream Kozak consensus (Kozak, 1986) for translation initiation. The 1A1Mut and +33/Mut cDNAs with internal mutations (R34D and K39I) and 1A1M32/33 cDNA with V32A/T33I mutations were generated by overlap PCR. All constructs were engineered to contain a Kozak consensus ATG codon, as well as a 5′ HindIII site and a 3′ Xbal site. cDNAs were cloned in pCMV4 or pGEM vectors, and the sequence properties of all the plasmid constructs were ascertained by manual sequencing using the dideoxy termination method. Plasmid pCDADX encoding the bovine adrenodoxin (Zuber et al., 1988), pMT2 vector containing full-length human NADPH cytochrome P450 reductase (P450 reductase), and pSP-DHFR plasmid containing full-length cDNA for the mouse dihydrofolate reductase (Skerjanc et al., 1990) were generously provided by Drs. Michael Waterman (Vanderbilt University School of Medicine, Nashville, TN), Frank Gonzalez (National Institutes of Health, Bethesda, MD), and Gordon Shore (McGill University, Montreal, Quebec, Canada), respectively.
In Vitro Protein Transport into Isolated Mitochondria
cDNAs encoding the wild-type P4501A1, various NH2-terminal truncated forms, point mutations, 1A1Mut, +33/Mut, and 1A1M32/33 constructs generated as described above were cloned in pGEM7Zf plasmid (Promega Biotech, Madison, WI), and were used as templates for generating the 35S-labeled translation products. 1–2 μg of circular plasmid DNAs were used as templates in a Sp6 or T7 polymerase–coupled reticulocyte lysate transcription translation system in the presence of [35S]methionine (40 μci/50μl/reaction, 1,000 Ci/mmol; Amersham Corp., Arlington Heights, IL) using the protocol recommended by Promega Biotech. Import of the in vitro–synthesized proteins into the mitochondria was carried out by a procedure modified from that of Gasser et al. (1982), using freshly isolated mitochondria. The import assays were carried out in a 200-μl final vol and contained 4 μl of 35S-labeled translation product (105 cpm), 500 μg mitochondria, or microsomes (from a 10 mg/ml suspension in sucrose-mannitol buffer), 60 μl energy mixture (10 mM ATP, 10 mM GTP, 2.5 mM CDP, 2.5 mM UDP, 50 mM malate, 20 mM isocitrate), 70 μl transport buffer (0.6 M mannitol, 20 mM Hepes, pH 7.4, 1 mM MgCl2, 2.5 mg/ml BSA with or without added inhibitors), as indicated in the figure legends. After incubation at 28°C for 60 min, the reaction mixtures were cooled on ice for 5 min, and each mixture was divided into two or three equal portions. One portion was mixed with 20 μl of protease inhibitor mix to yield a final concentration of 1 mM PMSF, 25 μg each of antipain, chymostatin, leupeptin, and pepstatin, and was stored on ice. The other portions were incubated with pronase (125–250 μg/ml of reaction) or trypsin (150–375 μg/ml of reaction) for 30–90 min on ice as specified in the figure legends. The protease-treated samples were mixed with the protease inhibitor mix as described above. Mitochondria were reisolated from both protease-treated and untreated samples by sedimentation through 1.35 M sucrose, and were washed twice with sucrose-mannitol buffer. Mitochondrial proteins were dissociated in Laemmli's sample buffer at 95°C for 5 min, and were analyzed by SDS–gel electrophoresis and fluorography.
Expression of cDNA in COS Cells
cDNAs encoding the wild-type protein, NH2-terminal deletions, and point mutations were cloned in the proper orientation in the HindIII and Xbal sites of a mammalian expression vector pCMV4 (Andersson et al., 1989). CsCl banded plasmid DNAs were used for transfecting COS-M6 cells by the DEAE dextran method (Zuber et al., 1988). About 48–60 h after transfection, cells from 10 plates (100 mm) were pooled, homogenized in a Teflon fitted glass homogenizer (10 strokes at 5,000 revolutions), and used for the isolation of mitochondrial and microsomal fractions by the differential centrifugation method (Niranjan et al., 1984). The mitochondrial fraction was resuspended in the sucrose-mannitol buffer by gentle homogenization and further purified by banding through a discontinuous sucrose gradient. Mitochondrial particles banding at the interface of 1.35 and 1.6 M sucrose were recovered, washed twice with the sucrose-mannitol buffer, and used for the Western blot analysis. In all cDNA expression experiments, the transfection efficiencies were monitored by coexpression with 2 μg/plate of cytomegalovirus β-galactosidase and assaying the cell extracts for β-galactosidase activities. Only plates showing activities within the range of 85–100% were chosen for the isolation of subcellular fractions. In some experiments, mitochondria from transfected cells and those used for in vitro import were subjected to digitonin fractionation, as described above for liver mitochondria.
Indirect Immunofluorescence Microscopy
COS cells were grown on coverslips, transfected with various cDNA constructs, and processed for antibody staining essentially as described by Rizzolo et al. (1985), except that after permeabilization with 0.1% Triton X-100, cells were blocked with 5% goat serum for 1 h at 25°C. Cells were double immunostained with 1:100 dilution of rabbit antibody to P4501A1 and 1:50 dilution of mouse mAb to the mitochondrial genome encoded human COX subunit I (Molecular Probes, Inc., Eugene, OR) as a positive control. Cells were washed repeatedly with PBS, and were incubated with FITC-conjugated anti–rabbit donkey IgG for the detection of P4501A1 and Texas red–conjugated anti–mouse donkey IgG for the detection of COX subunit I protein. Incubation with both the secondary antibodies (purchased from Jackson ImmunoResearch Laboratories, Inc., West Grove, PA) was carried out for 1 h at 37°C at 1:100 dilution. Unbound secondary antibodies were removed by repeated washing with PBS. Fluorescence microscopy was carried out under a TCS laser scanning microscope (Leica Inc., Deerfield, IL). 0.5-μm optical sections were scanned at the z-axis with both FITC and Texas red channels fully open to prevent any shifting or distortion of the images.
Results
Sequence Characteristics of the Mitochondrial P450MT2
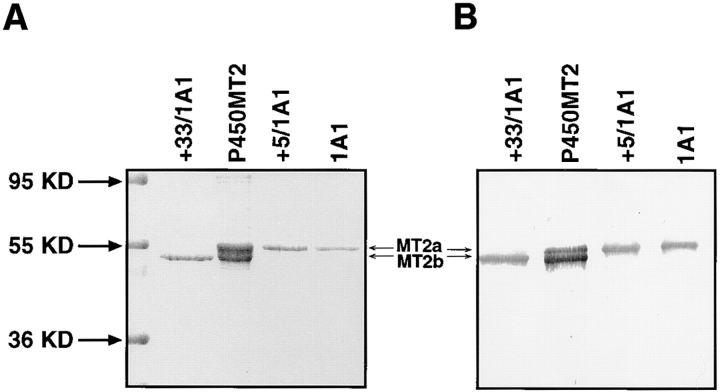
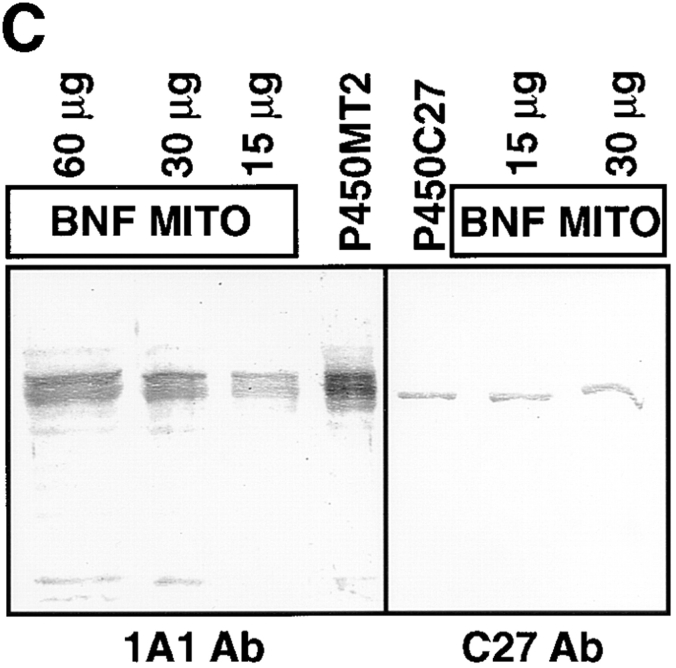
Using a high resolution gradient polyacrylamide gel system, initially we found that the mitochondrial and microsomal P450s purified from BNF-induced rat livers differed in electrophoretic mobility. The Coomassie-stained gel pattern in Fig. 1 A shows that the mitochondrial P450MT2 resolves into two distinct components marked as MT2a and MT2b. The larger component, MT2a, comigrated with bacterially expressed purified +5/1A1 and with intact 1A1 purified from BNF-induced rat liver microsomes. MT2a (+5/1A1) and P4501A1 were not separable on the gel electrophoresis system used in this study. MT2b comigrated with bacterially expressed purified +33/ 1A1. The Western blot in Fig. 1 B shows that both MT2a and MT2b cross-react with antibody to microsomal P4501A1. As expected, bacterially expressed +33/1A1, +5/1A1, and purified, intact P4501A1 cross-reacted with the antibody (Fig. 1 B). Although +33/1A1 and intact +1A1 vary by ∼4 kD in mass, we experienced difficulty in clearly resolving these two proteins because of the unusual migration of the truncated form on SDS gels. As shown in Fig. 1 C, mitochondria from BNF-treated rat livers contained two differently migrating 1A1 antibody–reactive proteins that comigrated with the major components of purified P450MT2. Additionally, a companion Western blot using antibody to P450c27 detected an intact 52-kD protein that comigrated with purified P450c27. The two antibody-reactive bands in the purified P450MT2 closely resemble the proteins detected in intact mitochondria from BNF-induced liver and the mitochondrial species generated by in vivo expression of intact 1A1 protein in COS cells, as described later in this section (see Fig. 3). These results therefore suggest that the two closely migrating proteins in the purified P450MT2 are not likely caused by proteolytic degradation during protein purification.
Figure 1.
Electrophoretic resolution of the two forms of mitochondrial P450MT2. P450s from BNF-induced rat liver mitochondria and microsomes and bacterially expressed +5/ 1A1 and +33/1A1 were purified, and ∼1–2 μg of protein sample in each case was resolved by electrophoresis on a 14–16% gradient SDS-polyacrylamide gel. (A) Coomassie Blue stained pattern. (B) A companion gel was subjected to Western blot analysis using 20 μg/ml of affinity-purified P4501A1 antibody. (C) The purified P450MT2 was compared with antibody-reactive proteins from BNF-induced liver mitochondria. Indicated amounts of mitochondria from BNF-induced liver and 2 μg of P450MT2 were subjected to electrophoretic resolution and Western blot analysis using either affinity-purified P4501A1 antibody or mAb against P450c27 (Addya et al., 1991), as indicated.
Figure 3.
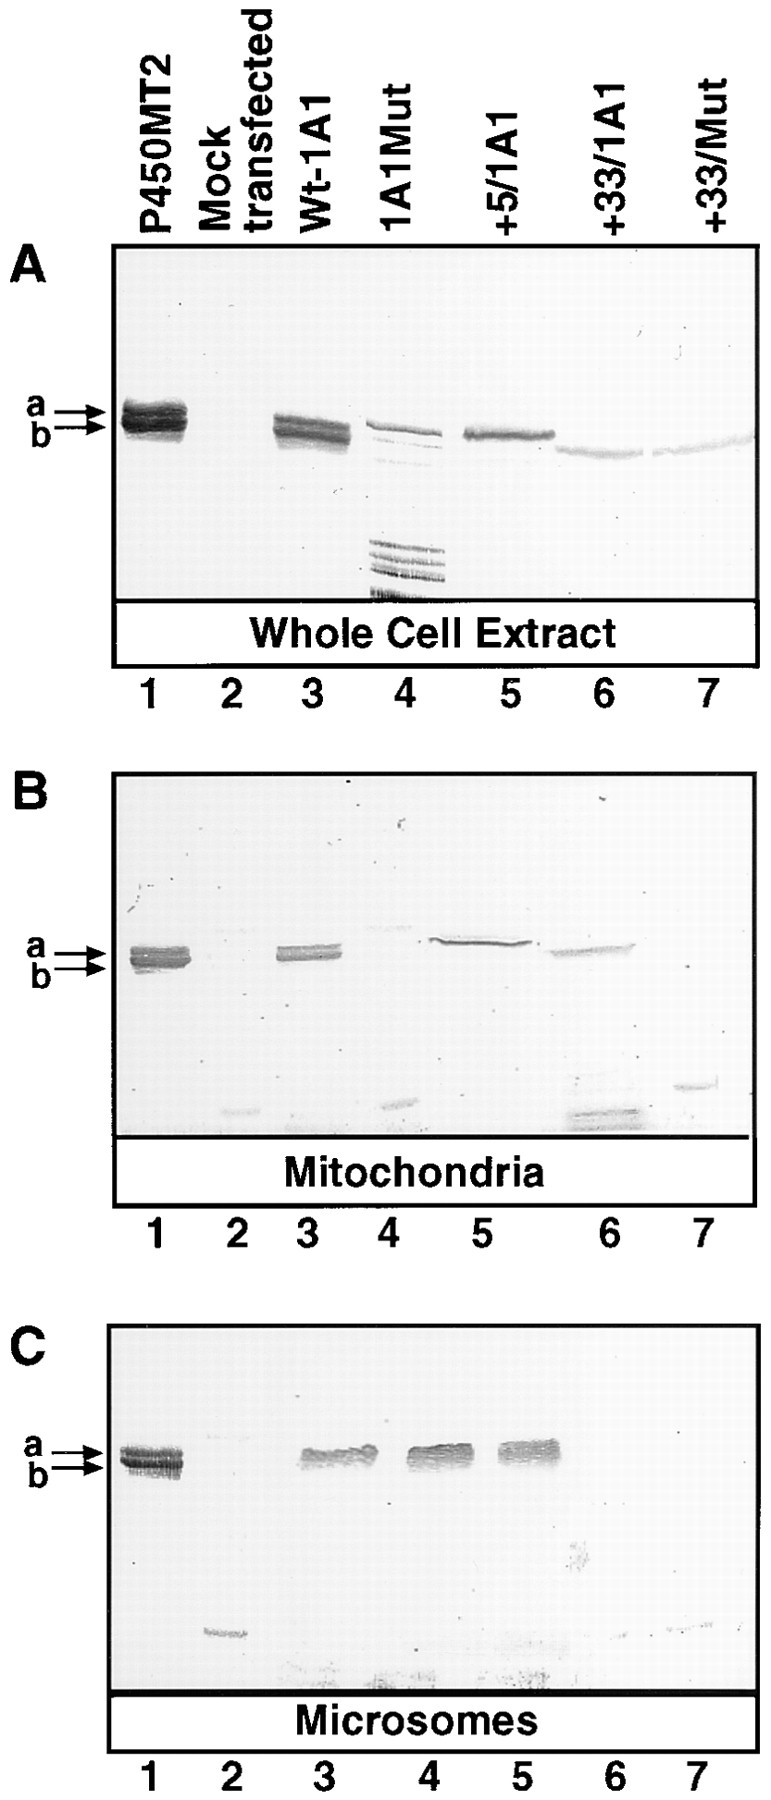
Targeting of P4501A1 to the microsomal and mitochondrial compartments in vivo in COS cells. COS cells were transfected with 10 μg/plate of the various wild type, mutant cDNA constructs, or pCMV4 vector without any insert (Mock transfected), together with 2 μg/plate of CMV β-galactosidase plasmid. Cells from 8–10 companion plates were used to isolate the mitochondrial and microsomal membrane fractions or whole-cell extracts as described in Materials and Methods. 2 μg of purified P450MT2 and 25 μg protein from each of the cell fractions were resolved by electrophoresis on 14–16% gradient polyacrylamide gels and were subjected to Western blot analysis using the affinity- purified P4501A1 antibody.
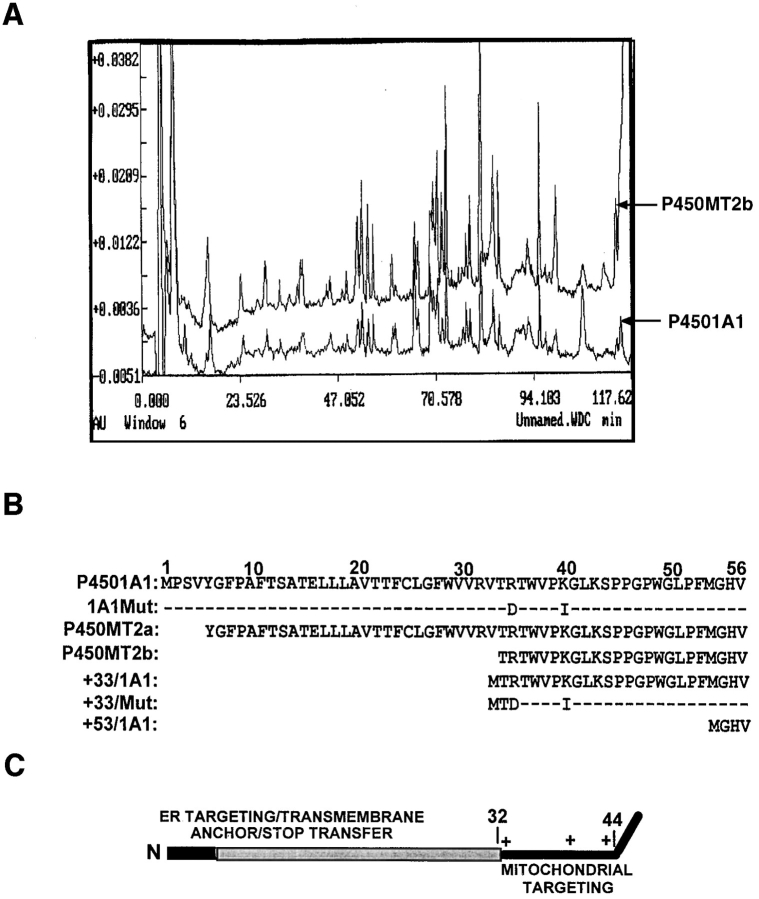
As seen from Fig. 2 A, the protein recovered from the faster migrating MT2b band yielded peptide fragments nearly identical to that of P4501A1. Although not shown, the slower migrating MT2a also yielded a nearly similar peptide pattern. NH2-terminal sequencing, as shown in Fig. 2 B, and sequencing of internal peptides (results not shown) revealed that both MT2a and MT2b have primary sequences to that of P4501A1, except that MT2b lacks the NH2-terminal 32–amino acid residues and MT2a lacks the NH2-terminal four–amino acid residues. Different P450MT2 preparations from induced livers showed the +5/1A1 to +33/1A1 ratios from 20:80 to 40:60. Although the precise reason for this variation remains unknown, the age of the animals and the length of BNF treatment are some of the factors that affect this ratio. However, both of these species are true mitochondrial forms since they are resistant to limited protease digestion of both mitochondrial and mitoplast preparations under conditions when >95% of the microsomal P4501A1 is degraded (Anandatheerthavarada et al., 1997).
Figure 2.
The sequence properties of P450MT2. (A) 3–6 μg of P450MT2 and 1A1 proteins were resolved as described in Fig. 1 and transferred to PVDF membranes. Bands corresponding to P450MT2b and 1A1 were excised and subjected to proteolytic digestion and HPLC analysis. The absorbency profiles at 260 nm are presented. (B) The microsomal P4501A1 and mitochondrial P450MT2a and MT2b protein bands were transblotted to PVDF membrane and sequenced by Edman degradation as described in Materials and Methods. The nature of 1A1Mut and +33/Mut cDNA constructs carrying R34D and K39I substitutions, as well as NH2-terminal deletion clones are indicated. (C) The chimeric signal properties of P4501A1 are indicated. The NH2-terminal-most luminal region is indicated in dark, and the transmembrane region is indicated in gray. The sequence 33–44 of the protein containing three basic amino acid residues at positions 34, 39, and 42 is predicted to function as a putative mitochondrial-targeting sequence.
As shown in Fig. 2 C, the NH2-terminal transmembrane domain of P4501A1 is followed by a Pro-rich region that acts as a hinge between the membrane anchor domain and the rest of the molecule, which is folded in the form of a globular structure. A number of xenobiotic-inducible P450s, including P4501A1, also contain two to three positively charged residues between the NH2-terminal hydrophobic domain and the Pro-rich hinge region. As seen in Fig. 2, B and C, P4501A1 contains three positively charged residues at positions 34, 39, and 42, thus, mimicking some of the known mitochondrial targeting sequences (Roise et al., 1988; von Heijne et al., 1989).
Mitochondrial Targeting of P450MT2 under In Vivo Conditions
The possibility that the sequence 1–44 of P4501A1 acts as a chimeric signal sequence with residues 33–44 of the protein functioning as a mitochondrial-specific targeting sequence was tested by in vivo transient expression of cDNA constructs in COS cells. Cells were transfected with cDNAs encoding intact P4501A1, and its truncated forms, +5/1A1 and +33/1A1, in pCMV4 expression vector (Andersson et al., 1989), and the subcellular fractions were purified by differential centrifugation and sucrose density banding. The Western blot in Fig. 3, developed with 1A1 antibody, shows that the whole-cell extract (Fig. 3 A, lane 3) and mitochondrial proteins (Fig. 3 B, lane 3) from cells transfected with wild-type 1A1 cDNA contain two antibody-reactive bands that migrated similarly to purified P450MT2. Although the precise composition of the slower migrating MT2a band in Fig. 3 A, lane 3, remains unknown, it is likely to contain both intact 1A1 and +5/1A1, which migrate very similarly on the SDS gel, as shown in Fig. 1. The microsomal fraction from these cells showed a single protein band (Fig. 3 C, lane 3) consistent with intact P4501A1. Surprisingly, all three fractions from +5/1A1-expressing cells showed a single band that migrated similarly to the MT2a band in Fig. 3 C, lane 1. The whole-cell extract from cells transfected with 1A1Mut cDNA construct, with mutations targeted to the two basic residues at 34 and 39, showed an unusual pattern in that it contained a major band comigrating with MT2a and a very minor MT2b-like band, in addition to a number of faster migrating bands that may represent degradation products. Furthermore, mitochondria from cells transfected with 1A1Mut cDNA (Fig. 3 B, lane 4) contained no detectable antibody-reactive protein, while the microsomal fraction (Fig. 3 C, lane 4) contained normal levels of 1A1-like protein. Although reasons for the rapid degradation of the mutant protein in the whole-cell extract remain unknown, it is possibly more open to attack by proteases, or more likely, the degraded component may represent proteins blocked at the level of mitochondrial transport because of a mutated matrix targeting sequence. Transfection with the +33/1A1 cDNA construct (Fig. 3 C, lane 6), however, yielded antibody-reactive protein comigrating with the MT2b band in the whole-cell extract, as well as in the mitochondrial isolate, but not in the microsomal preparations from these cells. These results are consistent with reports suggesting the importance of the NH2-terminal 30– amino acid residues for the microsomal targeting of P4501A1 (Monier et al., 1988; Sakaguchi et al., 1988; Szczesna- Skorupa and Kemper, 1993). Expression of +33/Mut protein, which carries mutations at the same two positively charged residues (Nos. 34 and 39), however, yielded no detectable antibody-reactive protein in the mitochondrial and microsomal preparations (Fig. 3, B and C, lane 7). The whole-cell extract of cells transfected with the mutant construct, however, contained antibody-reactive protein similar in size and intensity to the +33/1A1-expressing cells, indicating that the mutant protein is indeed translated. In repeated attempts, we observed that cells transfected with +33/1A1 and +33/Mut constructs show lower levels of antibody-reactive proteins, as compared to 1A1- or +5/1A1-expressing cells, possibly because of lower translation or faster turnover rates.
To determine the extent of cross-contaminating membrane fragments in the mitochondrial and microsomal fractions isolated from transfected COS cells, we carried out a control experiment in which cells were transfected with intact 1A1 reporter construct and were coexpressed with human P450 reductase and bovine Adx expression constructs. P450 reductase is targeted exclusively to the ER, and Adx targeted exclusively to mitochondria (Mitani, 1979; Black and Coon, 1982; Zuber et al., 1988). Western blot analysis showed that the microsomal fraction of transfected COS cells contains proteins cross-reacting with P4501A1 antibody (Fig. 4 B) and rat P450 reductase antibody (Fig. 4 A), but no detectable Adx antibody–reactive protein (see Fig. 4 C). The mitochondrial fraction, on the other hand, showed proteins reactive to the 1A1 antibody (Fig. 4 B) and Adx antibody (Fig. 4 C), but lacked significant P450 reductase antibody–reactive protein (see Fig. 4 A). Additionally, in agreement with the results presented in Fig. 3, the P4501A1 antibody–reactive protein associated with the mitochondrial particles (Fig. 4 B) migrated as two components characteristic of P450MT2, while the antibody-reactive component in the microsomal fraction migrated as a single slow migrating band, consistent with intact P4501A1. The results in Fig. 4 B also show that both of the antibody-reactive proteins associated with the intact mitochondrial particles are resistant to limited protease digestion, while the addition of 0.3% Triton X-100 renders them protease sensitive, suggesting their intramitochondrial location. The 1A1 protein associated with the microsomal membrane fraction, on the other hand, is highly sensitive to proteolytic attack, even in the absence of added Triton X-100. In addition to providing further support for the mitochondrial targeting of P4501A1 under the in vivo conditions, these results provide evidence for the qualitative separation of the two membrane components under the fractionation scheme used in this study. Although not shown, the mitochondrial content of P450MT2 was unaffected by outer membrane stripping by limited digitonin fractionation (see Materials and Methods). Additionally, both MT2a and MT2b were nearly quantitatively extracted with alkaline 0.1 M Na2CO3 under conditions when transmembrane Fo components of the mitochondrial ATPase remained associated with the inner membrane fraction, suggesting that the mitochondrial-targeted P450s exist as extrinsic membrane proteins.
Figure 4.
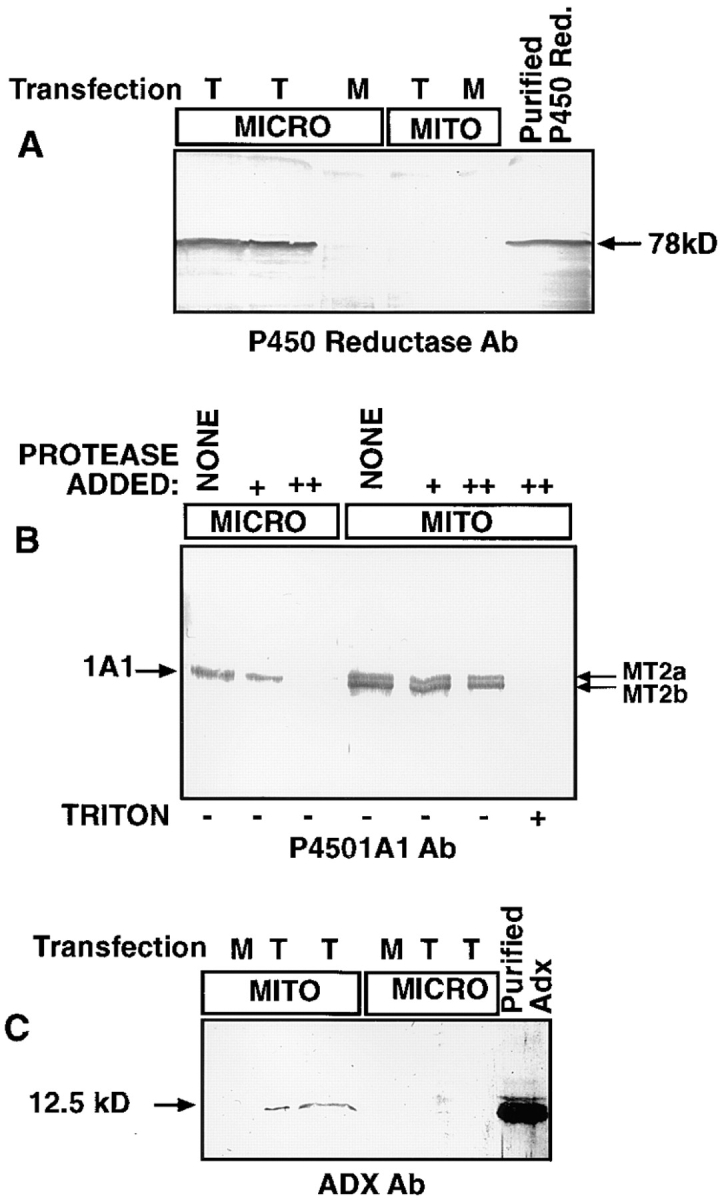
Specificity of the mitochondrial targeting of P4501A1 under in vivo conditions. In lanes marked T, COS cells were transfected with full-length 1A1 construct (10 μg/plate) and cotransfected with 10 μg/ plate of the human P450 reductase cDNA and 5 μg/ plate of bovine Adx cDNA constructs. In lanes marked M, cells were mock transfected with equivalent amount of pCMV-4 plasmid DNA. Mitochondrial and microsomal fractions were isolated as described in Materials and Methods, and 20 μg of microsomal and 30 μg of mitochondrial proteins were resolved on a 14–16% gradient polyacrylamide gel and were subjected to Western blot analysis using the indicated antibodies. (A and C) Mitochondrial and microsomal fractions in duplicate lanes were derived from two separate transfections. (B) Microsomal and mitochondrial proteins were digested with 100 μg/ml (+) or 200 μg/ml of reaction (++) with pronase for 30 min on ice before electrophoresis.
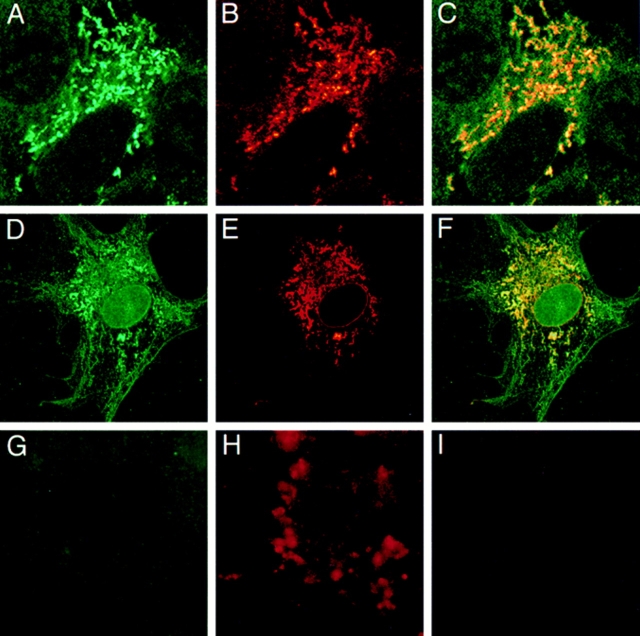
Mitochondrial targeting of P4501A1 was further ascertained using immunofluorescence microscopy. COS cells transfected with 1A1 cDNA or +33/1A1 cDNA constructs were subjected to double immunostaining with rabbit polyclonal antibody to 1A1 and mouse mAb to COX subunit I. As seen from Fig. 5 A, COS cells transfected with +33/1A1 cDNA show P4501A1 antibody cross-reactivity mainly in punctuate filamentous to wormiform extranuclear structures that have characteristic mitochondrial morphology. The 1A1 antibody–reactive protein also colocalized with the mitochondrial-specific COX subunit I (Fig. 5, B and C), further supporting the mitochondrial targeting of +33/1A1 protein. In intact 1A1-expressing cells, however, the 1A1 antibody stains were localized in granular to wormy membrane structures and more spread-out microsomal membranes (see Fig. 5 D). As seen from Fig. 5, E and F, the COX subunit I–specific antibody colocalized with the granular/wormy membrane structures, further ascertaining that they represent mitochondrial membranes. The mock-transfected cells, on the other hand, show minimal staining with the 1A1 antibody but characteristic granular staining with the COX subunit I antibody (Fig. 5, G and H). Additionally, Texas red–conjugated secondary antibody yielded no significant staining in the absence of added COX subunit I antibody, indicating the specificity of the antibody staining. These results are consistent with the cell fractionation data in Figs. 3 and 4, and they support the dual targeting of P4501A1 to both the mitochondrial and microsomal membranes under in vivo conditions.
Figure 5.
Subcellular localization of P4501A1 and +33/1A1 by immuno-fluorescence microscopy. COS cells were grown on coverslips and transfected with +33/1A1 cDNA (top), intact 1A1cDNA (middle), or mock transfected with pCMV-4 vector without insert (bottom). Cells in A–H were double immunostained with rabbit polyclonal antibody to P4501A1 and mouse mAb to COX subunit I protein, and were developed with FITC-conjugated anti–rabbit IgG and Texas red–conjugated anti– mouse IgG, respectively. Cells in I represent control without added primary antibody, developed with Texas red–conjugated IgG as in H. A, D, and G represent FITC staining, showing patterns of 1A1 protein distribution. B, E, and H represent Texas red staining showing COX subunit I patterns. C and F represent superimposed patterns of A and B and D and E, respectively. The micrograph in H was scanned at a threefold higher magnification compared to those in the other panels.
In Vitro Transport of Intact and Truncated P4501A1 into Mitochondria
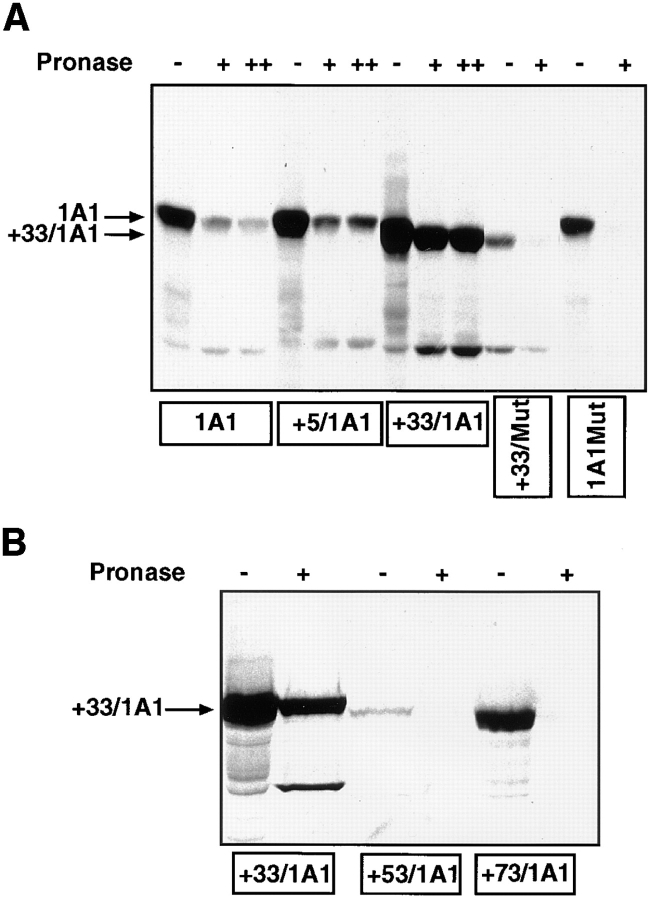
The sequence requirements for the mitochondrial transport of P4501A1 were further tested using an in vitro mitochondrial transport system in which resistance to limited proteolysis and energy requirements are used as criteria for the transport of proteins into the mitochondrial membrane compartment. Results in Fig. 6 A show that although intact 1A1 and +5/1A1 proteins bind to mitochondrial particles, only ∼2–4% of the former and 12–15% of the latter species were resistant to protease digestion, suggesting negligible and low levels of transport, respectively. The +33/1A1 protein, on the other hand, exhibited a high level of binding and a high level (40–55%) of transport, as judged by the band intensities and radiometric quantitation. More progressive NH2-terminal deletion products, +53/1A1 and +73/1A1 (Fig. 6 B), showed varying levels of binding to mitochondria, although neither was transported at significant levels inside the membrane compartment. Consistent with the in vivo transfection data in Fig. 3, the in vitro transport efficiency of 1A1Mut and +33/Mut proteins carrying R34D and K39I mutations (Fig. 2 B) into isolated mitochondria was extremely low, suggesting the importance of these positively charged residues for mitochondrial targeting. These results provide further evidence that the 12–amino acid sequence between 33 and 44 functions as a putative mitochondrial-targeting signal, and that removal of the first 4– or 32–amino acid residues from the intact protein positions the mitochondrial targeting signal for efficient binding to the mitochondrial import receptors under the in vitro conditions.
Figure 6.
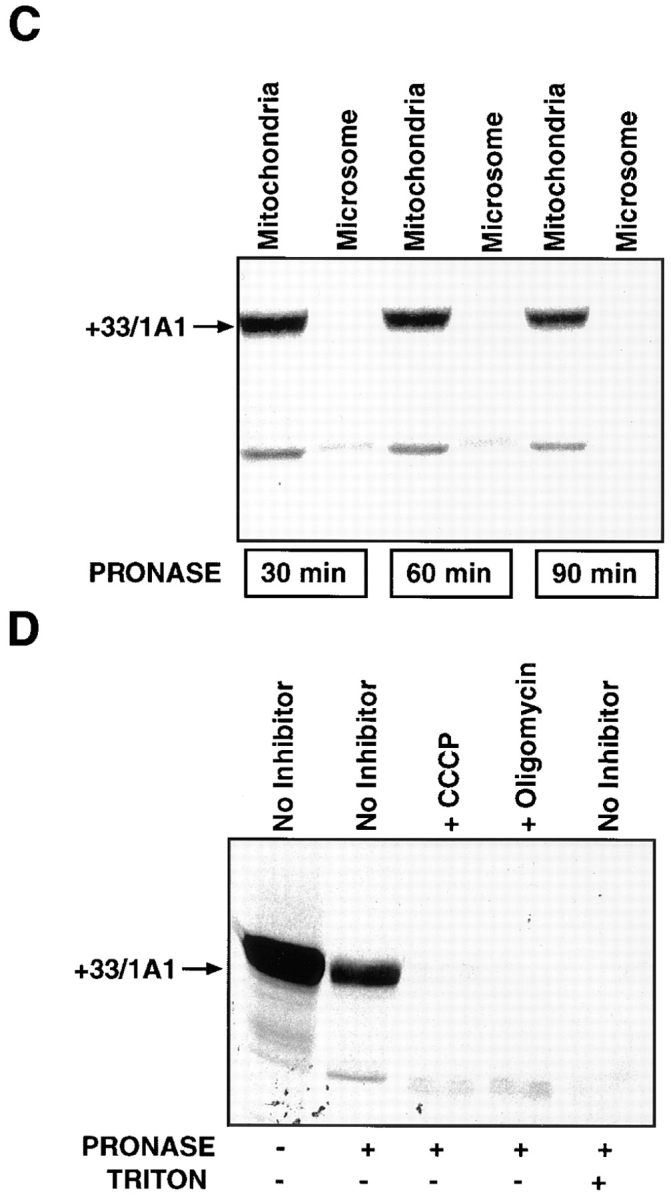
In vitro transport of P4501A1 into mitochondria. 35S-labeled in vitro translation products were programmed with the various cDNA constructs in a transcription-linked reticulocyte lysate system, and were used for in vitro transport in isolated rat liver mitochondria, as described in Materials and Methods. In each case, 200 μg of mitochondrial protein was used for electrophoresis, and the gels were subjected to fluorography. (A) 35S-labeled, full-length 1A1, +5/1A1, +33/1A1, +33/Mut, and 1A1Mut proteins were used for the in vitro transport. Faster migrating bands in some of the lanes probably represent proteolytic fragments generated as a result of endogenous mitochondrial or externally added protease action. A single + at the top of lanes represents treatment with 125 μg pronase, and ++ represents treatment with 250 μg pronase/ml of reaction. (B) In vitro transport of +33/1A1, +53/1A1, and +73/ 1A1 proteins into isolated rat liver mitochondria. Protease treatment was carried out using 125 μg of pronase/ml of reaction. (C) The specificity of the in vitro transport system was tested using 35S labeled +33/1A1 protein, as well as mitochondrial and microsomal fractions isolated from rat liver. Incubations with mitochondrial or microsomal membranes were carried out as described in A. Protease digestion was carried out for various time periods as indicated, using 125 μg pronase/ml of reaction. (D) Effects of mitochondrial inhibitors on the in vitro protein transport were tested using 35S-labeled +33/1A1 protein. The reaction mixtures were preincubated with or without added inhibitors (50 μM CCCP or 50 μM oligomycin) at 25°C for 10 min before initiating the in vitro transport by adding the 35S-labeled +33/1A1 translation product. Triton X-100 was added to the sample marked +Triton at a final concentration of 0.3% at the start of protease digestion. Protease digestion was carried out for 60 min with 125 μg pronase/ml of reaction. Radioactivity in −Pronase samples in the case of 1A1, +5/1A1, and +33/1A1 proteins represent ∼50–60% of the input counts, indicating efficient binding to mitochondria. The mutant proteins showed varied levels of binding as follows: +33/Mut = 10%, 1A1Mut and +73/1A1 = 30%, and +53/1A1 = 4% of input.
As shown in Fig. 6, C and D, ∼40% of the labeled +33/ 1A1 protein incubated with intact mitochondria is refractory to protease digestion. Disruption of mitochondrial membrane by treatment with Triton X-100, however, renders the in vitro–imported protein sensitive to protease action (Fig. 6 D). It is seen that labeled protein incubated with the microsomal fraction under these conditions is nearly completely degraded in 30 min of protease digestion (see Fig. 6 C). As shown in Fig. 6 D, both CCCP (carbonyl cyanide-m-chlorophenylhydrazone), which disrupts the mitochondrial membrane potential, and also oligomycin, which inhibits the mitochondrial ATP synthase leading to the depletion of the ATP pool, inhibit the transport. Consistent with the established views on energy requirements for mitochondrial protein transport (Glick and Schatz, 1991; Schwartz and Neupert, 1994; Neupert, 1997), these results demonstrate that the transport of +33/1A1 requires membrane potential and that it is dependent on the mitochondrial ATP pool.
Processing of P4501A1 by a Cytosolic Protease
The site of conversion of P4501A1 to +5/1A1 and +33/ 1A1 was investigated by incubating 35S-labeled translation products with (NH4)2SO4-fractionated rat liver cytosolic protein. It is seen in Fig. 7 A that the addition of protein fraction from the rat liver cytosol converted P4501A1 protein into components that resemble P450MT2a and MT2b (+5/1A1 and +33/1A1, respectively). However, the same protein fraction had no effect on the migration pattern of +5/1A1 protein, suggesting that intact 1A1 NH2 terminus is important for the proteolytic processing. These results are in accordance with our in vivo transfection data, showing that only intact 1A1 protein, but not +5/1A1 protein, was converted to faster migrating components when tested in the whole-cell extract and mitochondrial fraction (Fig. 3). Additionally, as seen in Fig. 7 A, the liver cytosolic protein was unable to process 1A1 protein carrying V32A and T33I mutations (referred to as 1A1M32/33) into faster migrating components. Results in Fig. 7 B show that the processing activity of the control cytosolic protein fraction (marked C) was abolished by incubation at 95°C for 5 min (marked B), or by addition of 5 mM EDTA. Also, a protein inhibitor mix containing leupeptin, pepstatin, chymostatin, and PMSF inhibited the processing activity. In Fig. 7 C, we tested the effects of cytosolic extract on 1A1 protein, which is in association with the ER membrane. In this experiment, 1A1 protein was translated in the presence of an added 2.5 Eq ER/50 μl of reaction volume, and the soluble (supernate) and membrane (pellet) fractions were separated by ultracentrifugation. The results in Fig. 7 C show that 1A1 protein from the soluble phase was efficiently converted by the cytosolic protein fraction into components that comigrated with +5/1A1 and +33/1A1, while 1A1 protein associated with the ER was refractory to processing. Although not shown, >90% of radioactivity partitioning with the membrane fraction was resistant to alkaline Na2CO3 extraction, suggesting its transmembrane organization. In support of the results in Fig. 7 B, only the control (C), but not the heated extract (B), was able to process the membrane-free 1A1 protein (Fig. 7 C). These results demonstrate that only membrane-free (but not membrane-bound) P4501A1 is processed by the cytosolic protease. Finally, both wheat germ and reticulocyte translation extracts did not contain this protease activity (data not shown), suggesting that it is either inactivated during the lysate preparation or it occurs in a tissue-specific manner.
Figure 7.
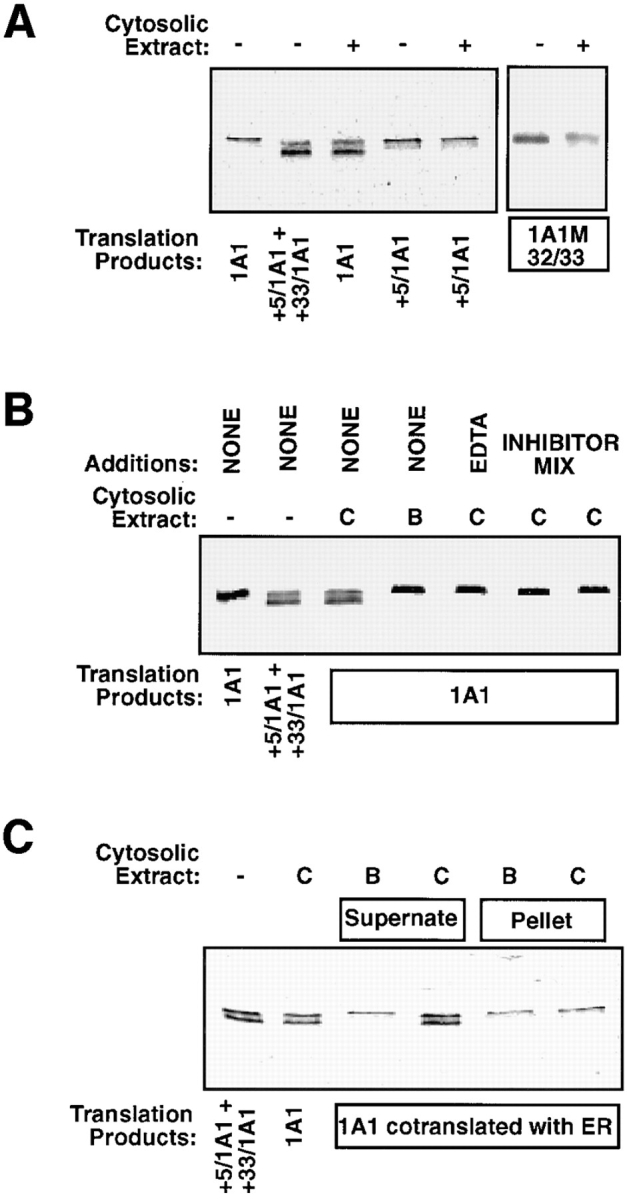
Processing of P4501A1 by a cytosolic endoprotease. (A) P4501A1, +33/1A1, and 1A1M32/33 (V32A and T33I) translation products in reticulocyte lysate (25 μl) were incubated with 15 μg of (NH4)2SO4-fractionated rat liver cytosolic protein. Incubation was carried out for 30 min at 30°C, and 3-μl aliquots each were electrophoresed on a 14–16% gradient SDS– polyacrylamide gel. A mixture of 35S-labeled +5/1A1 and +33/1A1 were run as markers. (B) P4501A1 translation product was incubated with control cytosolic extract (C) or extract incubated at 95°C for 5 min (B) in the presence or absence of added EDTA (5 mM) or protein inhibitor mix (to a final concentration of 1 mM PMSF and 20 μg/ml each of leupeptin, pepstatin, and chymostatin), as described in Materials and Methods. The incubation and electrophoresis conditions were as described in A. (C) The effects of membrane association of P4501A1 on the processing activity of the cytosolic protein extract was tested. 1A1 protein was translated in the presence of added canine pancreatic ER (2.5 Eq/50 μl reaction), and the membrane-bound fraction (pellet) was isolated by centrifugation over a layer of 0.5 M sucrose containing 100 mM KCl, 50 mM Hepes, pH 7.4, and 5 mM MgOAc2 at 100,000 g for 30 min. The soluble fraction remaining over the sucrose cushion was aspirated and used as the supernate fraction. Details of incubation with the control and heated cytosolic protein fractions were as described in A.
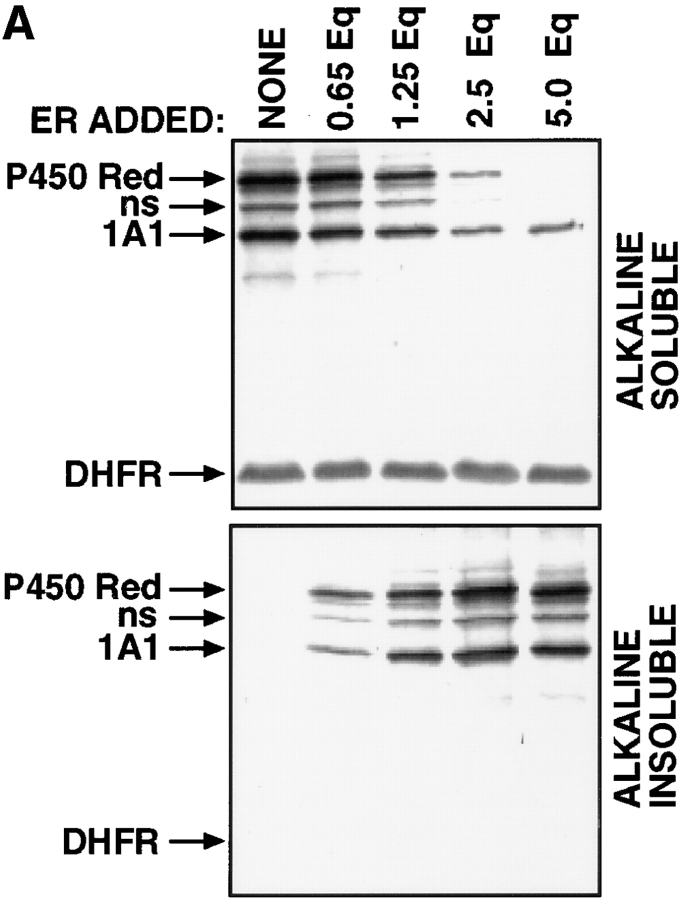
The cytosolic location of the processing protease suggested a leaky nature of the ER targeting or membrane insertion of 1A1 nascent chains. We investigated this possibility by quantitating the distribution of 1A1 nascent chains in the soluble and membrane compartments under in vitro conditions in the presence of saturating levels of the ER membrane. P4501A1 and P450 reductase, a protein exclusively targeted to the ER, and DHFR, a soluble cytosolic protein, were cotranslated in the presence of different added concentrations of canine microsomal ER. The membrane-integrated and nonintegral labeled proteins were quantitated by extraction with 0.1 M Na2CO3, pH 11.5. The autoradiogram in Fig. 8 A and quantitation of radioactivity in Fig. 8 B show that in the absence of added ER, all three proteins (i.e., 1A1, P450 reductase, and DHFR) were quantitatively extracted in the aqueous phase. The patterns in both the alkaline-soluble (top) and alkaline-insoluble (bottom) fractions show an intermediary band marked ns, which we believe represents premature termination product of P450 reductase. At increasing concentrations of added ER, increasing amounts of P450 reductase and 1A1 proteins remained in association with the membrane fraction, while DHFR was quantitatively extracted in the soluble fraction, even at the highest level of ER added. At saturating levels of ER between 2.5 and 5 Eq/50 μl of reaction, P450 reductase was quantitatively partitioned in the membrane fraction, as expected of a protein exclusively targeted to the ER. However, under saturating ER levels, a maximum of only 75% of 1A1 protein is detected in this fraction. Similar fractional ER association of both rabbit P4501A1 and rat P4502B1 proteins under the in vitro conditions were reported before (Sakaguchi et al., 1987; Monier et al., 1988). Furthermore, in transfected COS cells, ∼28–33% of the 1A1Mut protein with mutated matrix targeting sequence, but unaltered ER targeting property remains in the soluble cytosolic fraction (results not presented). These results suggest that 25–33% of the 1A1 proteins escape ER targeting under both in vivo and in vitro conditions because of an unknown mechanism.
Figure 8.
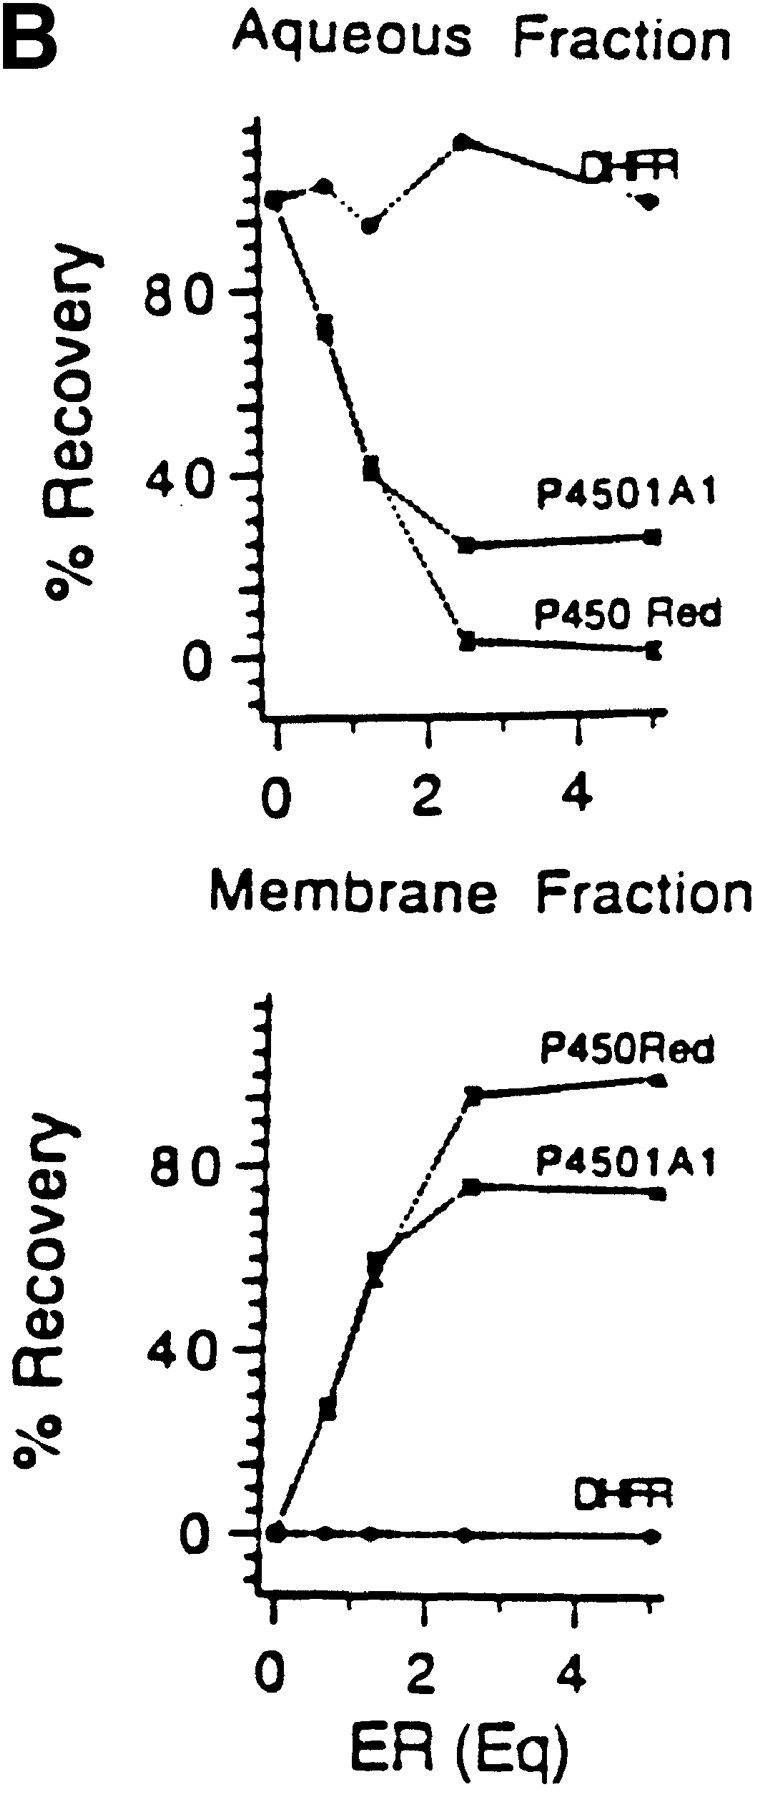
Extent of ER membrane targeting of P4501A1 under in vitro conditions. (A) P4501A1, P450 reductase, and DHFR were cotranslated in rabbit reticulocyte lysate in the presence or absence of unwashed canine pancreatic ER. The reaction mixtures were extracted with 0.1 M Na2CO3, pH 11.5, and the alkaline-soluble and -insoluble fractions were recovered and concentrated as described recently (Anandatheerthavarada et al., 1997). Protein fractions equivalent of 5 μl of initial reaction mixture in each case were subjected to electrophoresis and autoradiography. (B) The gel patterns for the alkaline-soluble and -insoluble fractions in A were quantitated in a PhosphorImager to determine the percentage of recovery in the membrane integral (Membrane Fraction) and extrinsic (Aqueous Fraction) fractions, respectively. Values represent the average of two experiments.
Discussion
Mammalian mitochondria are evolved to carry out a variety of generalized and tissue-specific metabolic functions. A number of biosynthetic and metabolic enzyme activities that are found in the nuclear-cytosolic-ER compartments are also duplicated in the mitochondrial compartment, possibly as part of the eukaryotic evolutionary process. Nevertheless, in almost all cases, the mitochondrial proteins are encoded by distinctly different sets of genes, and they are designed to carry either an NH2-terminal or internal signal that is recognized by the mitochondrial import machinery. In a limited number of cases, where the mitochondrial and cytosolic proteins are encoded by the same genes (reviewed in Jaussi, 1995; Neupert, 1997), mRNAs coding for the mitochondrially destined proteins are transcribed differently using alternate transcription start sites, alternate translation initiation sites, or differential splicing of precursor RNAs such that the translation products contain an NH2-terminal cleavable signal sequence for mitochondrial targeting (Boguta et al., 1994; Jaussi et al., 1995; Neupert, 1997). The results presented in this study on the targeting of P4501A1 to mitochondria by using multiple approaches, therefore, describe yet another pathway by which the same primary translation product, encoded by the same mRNA, can be targeted to both the ER and mitochondria.
Matrix Targeting Property of the NH2-terminal Signal Sequence of P4501A1
A majority of the mitochondrial targeting signals consist of NH2-terminal cleavable helical amphipathic sequences (Roise et al., 1988; Lemire et al., 1989; Isenman et al., 1995), although uncleaved NH2-terminal and internal signals have also been reported in some cases (for a review see Isenman et al., 1995). Recently, the signal sequence characteristics of proteins targeted to the mitochondrial outer and inner membrane compartments have been described. The yeast Mas70p and the mammalian protooncogene product Bcl-2 are two outer membrane proteins organized in opposite orientations (Li and Shore, 1992; Nguyen et al., 1993) which contain signal anchor sequences with flanking positively charged putative mitochondrial-targeting domains. In the case of yeast mitochondrial NADH cytochrome b5 reductase, the same primary translation product is targeted to both the outer membrane and intermembrane space (Hahne et al., 1994) as 34- and 32-kD species, respectively. The NH2 terminus of this protein contains a variation of the signal anchor domains of the Mas70p and Bcl-2 proteins, with an extended positively charged region resembling the matrix-targeting sequence on the NH2-terminal side of the transmembrane domain, as well as a sequence rich in charged residues on the COOH-terminal side. Recently, Hahne et al. (1994) have proposed a novel mechanism in which incomplete translocation arrest in the outer membrane results in the targeting of the same translation product to two different submitochondrial compartments. Yet another example of mitochondrial-targeted protein with membrane anchor domain is BCS1 protein, the Reiske FeS protein of the cytochrome bc1 complex, which is organized in a transmembrane Nout-Cin topology on the inner membrane (Folsch et al., 1996). The putative transmembrane domain at residues 45–68, immediately followed by an amphipathic helical structure with positively charged residues (positions 69–83), together function as an internal signal for mitochondrial targeting and correct topological positioning in the inner membrane (Folsch et al., 1996). Interestingly, the NH2-terminal signal components of +5/1A1 (and also intact 1A1) closely resemble that of the internal signal of BCS1 protein. In contrast to the integral membrane orientation of the BCS1 protein, however, both +5/1A1 and +33/1A1 are extrinsic proteins localized inside the inner membrane compartment. Additionally, although results are not shown, the mitochondrial-targeting sequence of P4501A1 differs from that of the BCS1 protein in that it is functional only when placed at the NH2 terminus, and it is not processed by the mitochondrial endoprotease.
Mechanism of NH2-terminal Processing and P450MT2 Biogenesis
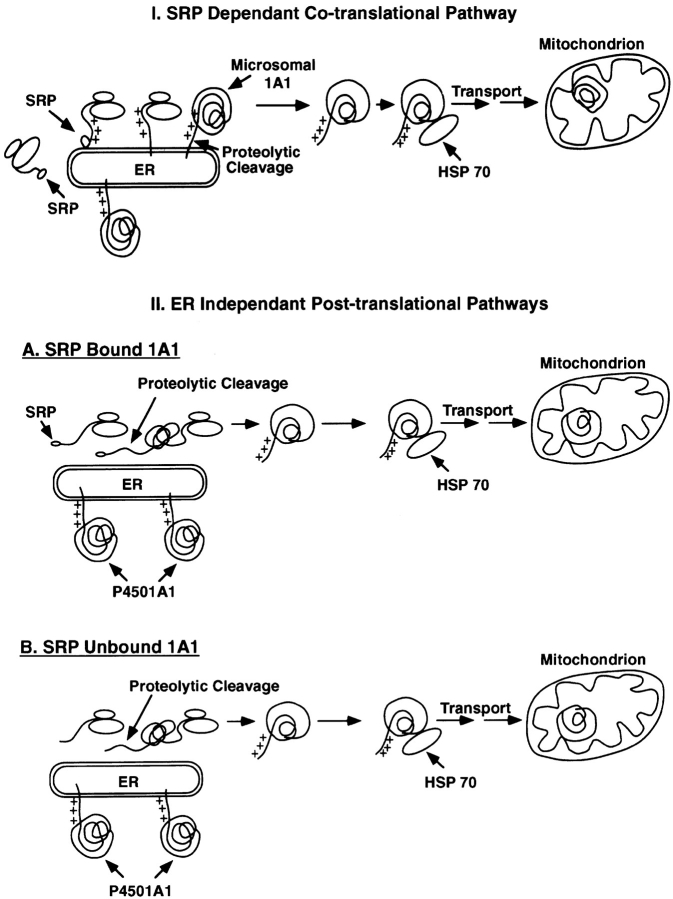
Based on our results suggesting extramitochondrial processing of P4501A1 and the current knowledge of protein targeting to the ER membrane, we considered two alternate working models for the biogenesis of P450MT2 (Fig. 9). The mechanism in model 1 proposes the initial targeting of the P450 apoprotein to the ER membrane through the SRP pathway and insertion into the membrane through a single transmembrane domain (Fujii-Kuriyama et al., 1979; Bar-Nun et al., 1980; Sakaguchi et al., 1987). As shown for the hepatitis B protein (Garcia et al., 1988), cleavage at the NH2-terminal signal region or past the transmembrane domain by endoprotease may result in the aborted translocation or release of the protein to the cytosol. In model 2, a fraction of the nascent 1A1 chains escape insertion on the ER either because of slippage of the SRP recognition (SRP-unbound 1A1), or post-SRP (SRP-bound 1A1) steps (Belin et al., 1996), that are translated as membrane-free polypeptides. The NH2-terminal segment of the polypeptide is then cleaved by a cytosolic protease, thus activating the mitochondrial-targeting sequence.
Figure 9.
Models for the biogenesis of P450MT2.
Experiments in Figs. 7 and 8 aimed at testing the validity of these two models show that ∼25–33% of 1A1 nascent chains resist membrane insertion and remain in the soluble pool. Our results also show that this pool of 1A1, which is amenable for processing by the cytosolic endoprotease, is also comparable with the 30% or so antibody-reactive proteins associated with the mitochondrial fraction under the transient transfection conditions. The NH2-terminal 32–amino acid region of 1A1 appears to be the target of the cytosolic endoprotease since removal of the NH2-terminal four residues or mutations targeted to the 32/33 positions of the protein (1A1M32/33) inhibit the processing activity. Additionally, only 1A1 protein with free NH2 terminus, but not that associated with the ER membrane, is a substrate for this endoprotease. The inability of the endoprotease to process +5/1A1 suggests that the same protease may be involved in processing past the 4th and 32nd residues of the protein, and processing at the former site may be conditional for the second processing at the latter site. We postulate that the extent of processing in different tissues and the efficiency with which the internal site is processed are rate-limiting steps that determine the level of mitochondrial P450MT2. Purification and further characterization of the endoprotease is required to understand the details of the two-site processing and differential activity of the enzyme. Thus, our experimental results clearly support model 2, although it is not clear if the nascent chains are in the SRP-bound or unbound form. The model also postulates that the NH2-terminal cleaved protein is chaperoned to the mitochondria by an ATP-dependent pathway involving HSP 70–type proteins (Glick and Schatz, 1991; Schwartz and Neupert, 1994; Ryan and Jensen, 1995). Members of the HSP 70 family of cytosolic proteins are known to play critical roles in the ATP-dependent unfolding of the protein, as well as presentation to the mitochondrial import receptor(s) in a conformational state amenable for importation (Glick and Schatz, 1991).
Physiological and Evolutionary Significance
The occurrence of chimeric signal sequences and transportation to two different cytoplasmic membrane compartments is not restricted to P4501A1; our preliminary results show that other inducible P450 forms, including P4502B1, 3A2, 2E1, and 2C6, as well as the sex-specific 2C12, exhibit similar dual transport modalities, although in some cases, intact unprocessed polypeptide chains are transported into the mitochondria. Thus, we believe that the mechanism described for P4501A1 in this study represents a novel and more general pathway designed to target the same primary translation products to two distinct membrane compartments. Our recent results also show that these mitochondrially targeted, microsomal P450s can functionally interact with Adx (Anandatheerthavarada, H.K., S. Addya, J. Mullick, and N.G. Avadhani, manuscript submitted for publication) and catalyze the metabolism of various xenobiotic chemicals, suggesting a physiological function for the imported P450s. Our results also suggest an interesting coevolutionary pattern of mitochondrial metabolic functions in parallel with the microsomal mixed function oxidase systems. Therefore, these results have implications in some of the fundamental issues of eukaryotic evolution. It should be noted that the coevolution includes the development of a chimeric signal for mitochondrial targeting and also the inclusion of structural domain(s) for interaction with the mitochondrial electron transport chain proteins Adx and Adx reductase.
Abbreviations used in this paper
- Adx
adrenodoxin
- BNF
β-napthoflavone
- COX
cytochrome c oxidase
- DHFR
dihydrofolate reductase
- PVDF
polyvinyldifluoride
- P450
cytochrome P450
- P450 reductase
NADPH cytochrome P450 reductase
- SRP
signal recognition particle
Footnotes
We are thankful to Drs. Michael Waterman, Byron Kemper, Michael Atchison, and Steven Liebhaber for critically reading the manuscript. We also thank Drs. Reid Gilmore, Michael Waterman, Frank Gonzalez, and Gordon Shore for generously providing some of the reagents and expression plasmids used in this study, and Dr. Lee Peechy and Ms. Gladys Gray-Board for the use of their confocal microscopy facility. Finally, the suggestions and help of members of the Avadhani laboratory, particularly those of Drs. C. Vijayasarathy and Nibedita Lenka on many aspects of this work, are gratefully acknowledged.
This research was supported in part by National Institutes of Health (NIH) grants GM-34883 and CA-22762, and by a grant from the Council for Tobacco Research. The microscopy facility is supported by the NIH core grant RR-2483.
Address all correspondence to Narayan G. Avadhani, University of Pennsylvania, Philadelphia, PA 19104. Tel.: (215) 898-8819; Fax: (215) 898-9923; E-mail: narayan@vet.upenn.edu
Drs. Addya and Anandatheerthavarada contributed equally to this work.
References
- Addya S, Zheng YM, Shayiq RM, Fan J, Avadhani NG. Characterization of a female-specific hepatic mitochondrial cytochrome P-450 whose steady-state level is modulated by testosterone. Biochemistry. 1991;30:8323–8330. doi: 10.1021/bi00098a007. [DOI] [PubMed] [Google Scholar]
- Anandatheerthavarada HK, Addya S, Dwivedi RS, Biswas G, Mullick J, Avadhani NG. Localization of multiple forms of inducible cytochromes P450 in rat liver mitochondria: immunological characteristics and patterns of xenobiotic substrate metabolism. Arch Biochem Biophys. 1997;339:136–150. doi: 10.1006/abbi.1996.9855. [DOI] [PubMed] [Google Scholar]
- Andersson DJ, Mostov KE, Blobel G. Mechanisms of integration of de novo-synthesized polypeptides into membranes: signal recognition particle is required for integration into microsomal membranes of calcium ATPase of lens MP26 but not of cytochrome b5 . Proc Natl Acad Sci USA. 1983;80:7249–7253. doi: 10.1073/pnas.80.23.7249. [DOI] [PMC free article] [PubMed] [Google Scholar]
- Andersson S, Davis DL, Dahlback H, Jomvall H, Russell DW. Cloning, structure, and expression of the mitochondrial cytochrome P-450 sterol 26-hydroxylase, a bile acid biosynthetic enzyme. J Biol Chem. 1989;264:8222–8229. [PubMed] [Google Scholar]
- Bar-Nun S, Kreibich G, Adesnik M, Alterman L, Negishi M, Sabatini DD. Synthesis and insertion of cytochrome P-450 into endoplasmic reticulum membranes. Proc Natl Acad Sci USA. 1980;77:965–969. doi: 10.1073/pnas.77.2.965. [DOI] [PMC free article] [PubMed] [Google Scholar]
- Belin D, Bost S, Vassalli JD, Strub K. A two-step recognition of signal sequences determines the translocation eficiency of proteins. EMBO (Eur Mol Biol Organ) J. 1996;15:468–478. [PMC free article] [PubMed] [Google Scholar]
- Bhagwat SV, Boyd MR, Ravindranath V. Brain mitochondrial cytochromes P-450: xenobiotic metabolism, presence of multiple forms and their selective inducibility. Arch Biochem Biophys. 1995;320:73–83. doi: 10.1006/abbi.1995.1344. [DOI] [PubMed] [Google Scholar]
- Black SD, Coon MJ. Structural features of liver microsomal NADPH-cytochrome P450 reductase: hydrophobic domain, hydrophilic domain and connecting region. J Biol Chem. 1982;257:5929–5938. [PubMed] [Google Scholar]
- Boguta M, Hunter LA, Shen WC, Gillman EC, Martin NC, Hopper AK. Subcellular locations of MOD5 proteins: mapping of sequences sufficient for targeting to mitochondria and demonstration that mitochondrial and nuclear isoforms commingle in the cytosol. Mol Cell Biol. 1994;14:2298–2306. doi: 10.1128/mcb.14.4.2298. [DOI] [PMC free article] [PubMed] [Google Scholar]
- Folsch H, Guiard B, Neupert W, Stuart RA. Internal targeting signal of the BCS1 protein: a novel mechanism of import into mitochondria. EMBO (Eur Mol Biol Organ) J. 1996;15:479–487. [PMC free article] [PubMed] [Google Scholar]
- Fujii-Kuriyama Y, Negishi M, Mikawa R, Tashiro Y. Biosynthesis of cytochrome P-450 on membrane-bound ribosomes and its subsequent incorporation into rough and smooth microsomes in rat hepatocytes. J Cell Biol. 1979;81:510–519. doi: 10.1083/jcb.81.3.510. [DOI] [PMC free article] [PubMed] [Google Scholar]
- Garcia PD, Ou H-H, Rutter WJ, Walter P. Targeting of the hepatitis B pre-core protein to the endoplasmic reticular membrane: after signal peptide cleavage, translocation can be aborted and the product released into the cytoplasm. J Cell Biol. 1988;106:1093–1104. doi: 10.1083/jcb.106.4.1093. [DOI] [PMC free article] [PubMed] [Google Scholar]
- Gasser SM, Daum G, Schatz G. Import of proteins into mitochondria: energy dependent uptake of precursors by isolated mitochondria. J Biol Chem. 1982;257:13034–13041. [PubMed] [Google Scholar]
- Gilmore R, Walter P, Blobel G. Protein translocation across the endoplasmic reticulum. II. Isolation and characterization of the signal recognition particle receptor. J Cell Biol. 1982;95:470–477. doi: 10.1083/jcb.95.2.470. [DOI] [PMC free article] [PubMed] [Google Scholar]
- Glick B, Schatz G. Import of proteins into mitochondria. Annu Rev Genet. 1991;25:21–44. doi: 10.1146/annurev.ge.25.120191.000321. [DOI] [PubMed] [Google Scholar]
- Gonzalez FJ. Molecular genetics of the P-450 superfamily. Pharmacol Ther. 1990;45:1–38. doi: 10.1016/0163-7258(90)90006-n. [DOI] [PubMed] [Google Scholar]
- Hachiya N, Mihara K, Suda K, Horst M, Schatz G, Lithgow T. Reconstitution of the initial steps of mitochondrial protein import. Nature (Lond) 1995;376:705–709. doi: 10.1038/376705a0. [DOI] [PubMed] [Google Scholar]
- Hahne K, Haucke V, Ramage L, Schatz G. Incomplete arrest in the outer membrane sorts NADH cytochrome b5 reductase to two different submitochondrial compartments. Cell. 1994;79:829–839. doi: 10.1016/0092-8674(94)90072-8. [DOI] [PubMed] [Google Scholar]
- Honkakowski P, Kojo A, Raunio H, Pasanen M, Juvonen R, Lang MA. Hepatic mitochondrial coumarin 7-hydroxylase: comparison with the microsomal enzyme. Arch Biochem Biophys. 1988;267:558–567. doi: 10.1016/0003-9861(88)90063-x. [DOI] [PubMed] [Google Scholar]
- Imai TM, Globerman H, Gertener JM, Kagawa N, Waterman MR. Expression and purification of functional human 17α-hydroxylase-lyase (P450c17) in Escherichia coli. . J Biol Chem. 1993;268:19681–19689. [PubMed] [Google Scholar]
- Iscan M, Reuhl K, Weiss B, Maines MD. Regional and subcellular distribution of cytochrome P-450-dependent drug metabolism in monkey brain: the olfactory bulb and the mitochondrial fraction have high levels of activity. Biochem Biophys Res Commun. 1990;169:858–863. doi: 10.1016/0006-291x(90)91972-u. [DOI] [PubMed] [Google Scholar]
- Isenman L, Liebow C, Rothman S. Transport of proteins across membranes—a paradigm in transition. Biochim Biophys Acta. 1995;1241:341–370. doi: 10.1016/0304-4157(95)00009-7. [DOI] [PubMed] [Google Scholar]
- Jaussi R. Homologous nuclear-encoded mitochondrial and cytosolic isoproteins. A review of structure, biosynthesis and genes. Eur J Biochem. 1995;228:551–561. doi: 10.1111/j.1432-1033.1995.tb20294.x. [DOI] [PubMed] [Google Scholar]
- Kang PJ, Ostermann J, Shilling J, Neupert W, Craig EA, Pfanner N. Requirement for hsp 70 in the mitochondrial matrix for translocation and folding of precursor proteins. Nature (Lond) 1990;348:137–143. doi: 10.1038/348137a0. [DOI] [PubMed] [Google Scholar]
- Kozak M. Point mutations define a sequence flanking the AUG initiator codon that modulates translation by eukaryotic ribosomes. Cell. 1986;44:283–292. doi: 10.1016/0092-8674(86)90762-2. [DOI] [PubMed] [Google Scholar]
- Lemire BD, Fankhauser C, Baker A, Schatz G. The mitochondrial targeting function of randomly generated peptide sequences correlates with predicted helical amphiphilicity. J Biol Chem. 1989;264:20206–20215. [PubMed] [Google Scholar]
- Li JM, Shore GC. Reversal of the orientation of an integral protein of the mitochondrial outer membrane. Science (Wash DC) 1992;256:1815–1817. doi: 10.1126/science.1615327. [DOI] [PubMed] [Google Scholar]
- Lill R, Nargang FE, Neupert W. Biogenesis of mitochondrial proteins. Curr Opin Cell Biol. 1996;8:505–512. doi: 10.1016/s0955-0674(96)80028-7. [DOI] [PubMed] [Google Scholar]
- Lithgow T, Junne T, Suda K, Gratzer S, Schatz G. The mitochondrial outer membrane protein Mas 22P is essential for protein import and viability of yeast. Proc Natl Acad Sci USA. 1994;91:11973–11977. doi: 10.1073/pnas.91.25.11973. [DOI] [PMC free article] [PubMed] [Google Scholar]
- Mitani F. Cytochrome P-450 in adrenocortical mitochondria. Mol Cell Biochem. 1979;24:21–43. doi: 10.1007/BF00220191. [DOI] [PubMed] [Google Scholar]
- Monier S, Van Luc P, Kreibich G, Sabatini DD, Adesnik M. Signals for the incorporation and orientation of cytochrome P450 in the endoplasmic reticulum membrane. J Cell Biol. 1988;107:457–470. doi: 10.1083/jcb.107.2.457. [DOI] [PMC free article] [PubMed] [Google Scholar]
- Murakami H, Pain D, Blobel G. 70-kD heat shock–related protein is one of at least two distinct cytosolic factors stimulating protein import into mitochondria. J Cell Biol. 1988;107:2051–2057. doi: 10.1083/jcb.107.6.2051. [DOI] [PMC free article] [PubMed] [Google Scholar]
- Neupert W. Protein import into mitochondria. Annu Rev Biochem. 1997;66:863–917. doi: 10.1146/annurev.biochem.66.1.863. [DOI] [PubMed] [Google Scholar]
- Nguyen M, Millar DG, Yong VW, Korsmeyer SJ, Shore GC. Targeting of BcL2 to the mitochondrial outer membrane by a COOH terminal signal anchor sequence. J Biol Chem. 1993;268:25265–25268. [PubMed] [Google Scholar]
- Niranjan BG, Avadhani NG. Activation of aflatoxin B1 by a mono-oxygenase system localized in rat liver mitochondria. J Biol Chem. 1980;255:6575–6578. [PubMed] [Google Scholar]
- Niranjan BG, Wilson NM, Jefcoate CR, Avadhani NG. Hepatic mitochondrial cytochrome P-450 system. J Biol Chem. 1984;259:12495–12501. [PubMed] [Google Scholar]
- Ohta S, Schatz G. A purified precursor polypeptide requires a cytosolic protein fraction for import into mitochondria. EMBO (Eur Mol Biol Organ) J. 1984;3:651–657. doi: 10.1002/j.1460-2075.1984.tb01862.x. [DOI] [PMC free article] [PubMed] [Google Scholar]
- Parkinson A, Gemzik B. Production and purification of antibodies against rat liver P450 enzymes. Methods Enzymol. 1991;206:233–245. doi: 10.1016/0076-6879(91)06094-j. [DOI] [PubMed] [Google Scholar]
- Raza H, Avadhani NG. Hepatic mitochondrial cytochrome P450 system: purification and characterization of two distinct forms of mitochondrial cytochrome P-450 from β-naphthoflavone-induced rat liver. J Biol Chem. 1988;263:9533–9541. [PubMed] [Google Scholar]
- Rizzolo LJ, Finidori J, Gonzalez A, Arpin M, Ivanov IE, Adesnik M, Sabatini DD. Biosynthesis and intracellular sorting of growth hormone-viral envelope glycoprotein hybrids. J Cell Biol. 1985;101:1351–1362. doi: 10.1083/jcb.101.4.1351. [DOI] [PMC free article] [PubMed] [Google Scholar]
- Roise D, Theiler F, Horvath SJ, Tomich JM, Richards JH, Allison DS, Schatz G. Amphiphilicity is essential for mitochondrial presequence function. EMBO (Eur Mol Biol Organ) J. 1988;7:649–653. doi: 10.1002/j.1460-2075.1988.tb02859.x. [DOI] [PMC free article] [PubMed] [Google Scholar]
- Ryan KR, Jensen RE. Protein translocation across mitochondrial membranes: what a long, strange trip it is. Cell. 1995;83:517–519. doi: 10.1016/0092-8674(95)90089-6. [DOI] [PubMed] [Google Scholar]
- Sakaguchi M, Mihara K, Sato R. A short amino-terminal segment of microsomal cytochrome P-450 functions both as an insertion signal and as a stop-transfer sequence. EMBO (Eur Mol Biol Organ) J. 1987;6:2425–2431. doi: 10.1002/j.1460-2075.1987.tb02521.x. [DOI] [PMC free article] [PubMed] [Google Scholar]
- Schatz G, Dobberstein B. Common principles of protein translocation across membranes. Science (Wash DC) 1996;271:1519–1526. doi: 10.1126/science.271.5255.1519. [DOI] [PubMed] [Google Scholar]
- Schwartz E, Neupert W. Mitochondrial protein import: mechanisms, components and energetics. Biochim Biophys Acta. 1994;1187:270–274. doi: 10.1016/0005-2728(94)90125-2. [DOI] [PubMed] [Google Scholar]
- Skerjanc IS, Sheffield WP, Randall SK, Silvius JR, Shore GC. Import of precursor proteins into mitochondria: site of polypeptide unfolding. J Biol Chem. 1990;265:9444–9451. [PubMed] [Google Scholar]
- Sollner T, Griffiths G, Pfaller R, Pfanner N, Neupert W. MOM19, an import receptor for mitochondrial precursor proteins. Cell. 1989;59:1061–1070. doi: 10.1016/0092-8674(89)90762-9. [DOI] [PubMed] [Google Scholar]
- Szczesna-Skorupa E, Kemper B. An N-terminal glycosylation signal on cytochrome P450 is restricted to the endoplasmic reticulum in a luminal orientation. J Biol Chem. 1993;268:1757–1762. [PubMed] [Google Scholar]
- Szczesna-Skorupa E, Browne N, Mead D, Kemper B. Positive charges at the NH2 terminus convert the membrane-anchor singal peptide of cytochrome p-450 to a secretory signal peptide. Proc Natl Acad Sci USA. 1988;85:738–742. doi: 10.1073/pnas.85.3.738. [DOI] [PMC free article] [PubMed] [Google Scholar]
- von Heijne G, Steppuhn J, Herrmann RG. Domain structure of mitochondrial and chloroplast targeting peptides. Eur J Biochem. 1989;180:535–545. doi: 10.1111/j.1432-1033.1989.tb14679.x. [DOI] [PubMed] [Google Scholar]
- Walter P, Ibrahimi I, Blobel G. Translocation of proteins across the endoplasmic reticulum. I. Signal recognition protein (SRP) binds to in-vitro-assembled polysomes synthesizing secretory protein. J Cell Biol. 1981;91:545–550. doi: 10.1083/jcb.91.2.545. [DOI] [PMC free article] [PubMed] [Google Scholar]
- Wickner WT, Lodish HF. Multiple mechanisms of protein insertion into and across membranes. Science (Wash DC) 1985;230:400–407. doi: 10.1126/science.4048938. [DOI] [PubMed] [Google Scholar]
- Yabusaki Y, Shimizu M, Murakami H, Nakamura K, Oeda K, Ohkawa H. Nucleotide sequence of a full-length cDNA coding for 3-methylcholanthrene-induced rat liver cytochrome P-450MC. Nucleic Acids Res. 1984;12:2929–2938. doi: 10.1093/nar/12.6.2929. [DOI] [PMC free article] [PubMed] [Google Scholar]
- Zuber MX, Mason JI, Simpson ER, Waterman MR. Simultaneous transfection of COS-1 cells with mitochondrial and microsomal steroid hydroxylases: incorporation of a steroidogenic pathway into non-steroidogenic cells. Proc Natl Acad Sci USA. 1988;85:699–703. doi: 10.1073/pnas.85.3.699. [DOI] [PMC free article] [PubMed] [Google Scholar]


