

Abstract
Brush border myosin–I (BBM-I) is a single-headed myosin found in the microvilli of intestinal epithelial cells, where it forms lateral bridges connecting the core bundle of actin filaments to the plasma membrane. Extending previous observations (Jontes, J.D., E.M. Wilson-Kubalek, and R.A. Milligan. 1995. Nature [Lond.]. 378:751–753), we have used cryoelectron microscopy and helical image analysis to generate three-dimensional (3D) maps of actin filaments decorated with BBM-I in both the presence and absence of 1 mM MgADP. In the improved 3D maps, we are able to see the entire light chain–binding domain, containing density for all three calmodulin light chains. This has enabled us to model a high resolution structure of BBM-I using the crystal structures of the chicken skeletal muscle myosin catalytic domain and essential light chain. Thus, we are able to directly measure the full magnitude of the ADP-dependent tail swing. The ∼31° swing corresponds to ∼63 Å at the end of the rigid light chain–binding domain. Comparison of the behavior of BBM-I with skeletal and smooth muscle subfragments-1 suggests that there are substantial differences in the structure and energetics of the biochemical transitions in the actomyosin ATPase cycle.
Brush border myosin–I (BBM-I)1 was the first vertebrate, unconventional myosin to be discovered and is representative of one of the more abundant classes of the myosin superfamily, the myosins-I (Pollard et al., 1991; Hammer, 1994; Mooseker and Cheney, 1995). Originally identified in the microvillus of intestinal epithelial cells as lateral bridges linking the core actin bundle to the plasma membrane (Matsudaira and Burgess, 1979; Howe and Mooseker, 1983), BBM-I has been shown to be a functional myosin motor protein, having actin-activated ATPase and in vitro motility activities (Collins and Borysenko, 1984; Conzelman and Mooseker, 1987; Collins et al., 1990; Wolenski et al., 1993).
The most common isoform of BBM-I consists of a conserved myosin catalytic domain, a light chain–binding domain (LCBD) with three associated calmodulin (CaM) light chains, and a COOH-terminal, lipid-binding domain. The LCBD consists of three tandem repeats of a 23-residue “IQ motif,” so called because of their consensus sequence, IQxxxRGxxxR (Cheney and Mooseker, 1992; Titus, 1993; Wolenski, 1995). A minor isoform contains a 29-residue splice insert, resulting in a fourth IQ motif (Halsall and Hammer, 1990). The lipid-binding domain consists of a region rich in basic amino acids (Garcia et al., 1989), and has been shown to mediate binding to anionic phospholipid vesicles (Hayden et al., 1990).
Despite the growing importance of unconventional myosins, little structural information for them exists. Recently, we have begun to characterize the three-dimensional (3D) structure of BBM-I using EM. Cryo-EM of actin filaments decorated with BBM-I in the absence or presence of 10 mM MgADP revealed an ADP-dependent conformational change in BBM-I (Jontes et al., 1995). Additionally, Whittaker and Milligan (1997) have used actoBBM-I to investigate conformational changes in the LCBD in response to calcium. Unfortunately, in both of these studies only ∼75% of the protein was visualized; no density was observed that could be attributed to either the third calmodulin light chain or the COOH-terminal, lipid-binding domain. In a separate study, tilt-series reconstruction of two-dimensional crystals of BBM-I was used to calculate a 3D map (Jontes and Milligan, 1997). Whereas density could be assigned to each of the major structural domains of BBM-I, the exact boundaries of the catalytic domain and the position of the actin-binding site could not be identified with certainty. Here, we use cryo-EM of actoBBM-I to extend the previous observations of Jontes et al. (1995), visualizing the entire BBM-I molecule. We have also generated a pseudo-atomic model of BBM-I by fitting the crystal structures of the skeletal muscle myosin catalytic domain and the skeletal muscle myosin essential light chain (ELC) into our EM envelope (Rayment et al., 1993a ). Thus, we have provided the most detailed structural information available for any unconventional myosin.
We have also extended the observation on an ADP- induced conformational change in BBM-I; actoBBM-I, in the presence of 1 mM MgADP, was found to swing through an angle of ∼31°, in agreement with the previous study that had used 10 mM MgADP (Jontes et al., 1995). Since we now see the entire LCBD, we measure the magnitude of the movement to be ∼63Å. In addition to the axial translation, the LCBD also appears to rotate about its long axis by 20 to 30° during the transition from the rigor state to the ADP state. We also discuss the potential relevance of the ADP-dependent movement to actomyosin (AM) force production, as well as its relevance to possible variation in mechanochemistry across the myosin superfamily.
Materials and Methods
Protein Purification
BBM-I was prepared as described by Collins et al. (1990) with a few modifications. Briefly, the small intestines were excised from six female White Leghorn chickens, and were split lengthwise, cut into 5–6-in segments, and then washed in 10 mM imidazole, pH 7.3, 140 mM NaCl. The brush borders were released by stirring in 10 mM sodium phosphate, pH 7.3, 10 mM EDTA, 140 mM NaCl, 100 mM sucrose, 2 mM PMSF for ∼60 min at room temperature. The intestines were then rubbed vigorously to extract as much of the epithelial layer as possible. The initial extract was centrifuged in a JA-4.3 rotor (Beckman Instuments, Inc., Palo Alto, CA) for 10 min at 4,000 rpm. After homogenization in 10 mM imidazole, pH 7.3, 4 mM EDTA, 5 mM EGTA, 0.2 mM Pefabloc-SC (Boehringer Mannheim, Mannheim, Germany), 1 mM PMSF, 5 μg/ml pepstatin, 1 μg/ml leupeptin, and 1 μg/ml aprotinin using a polytron blade homogenizer, the isolated brush borders were spun down (JA-4.3 rotor, 4,000 rpm for 15 min at 4°C), and rinsed twice in 10 mM imidazole, pH 7.3, 75 mM NaCl, 5 mM EDTA, 2 mM EGTA, and 0.2 mM Pefabloc-SC, 1 mM PMSF, 5 μg/ml pepstatin, 1 μg/ml leupeptin, 1 μg/ml aprotinin by homogenization and pelleting (JA-4.3 rotor, 4,000 rpm for 15 min at 4°C). The brush border pellet was resuspended in 20 mM imidazole, pH 6.9, 2 mM EGTA, 20 mM MgCl2, 400 mM NaCl, 5 mM ATP, 1 mM DTT with 0.2 mM Pefabloc-SC, 1 mM PMSF, 5 μg/ml pepstatin, 1 μg/ml leupeptin, and 1 μg/ml aprotinin. The pellet was resuspended by homogenization in a loose-fitting dounce, and another 5 mM ATP was added. The homogenate was spun in a Ti70 rotor (Beckman Instuments, Inc.) at 28,000 rpm for 30 min, and loaded onto two identical Sepharose CL-4B gel filtration columns. Fractions containing BBM-I were pooled and dialyzed overnight into 10 mM imidazole, pH 7.5, 50 mM NaCl, 2 mM EGTA, 0.1 mM MgCl2, 10% sucrose with 0.2 mM Pefabloc-SC, 1 mM PMSF, 5 μg/ml pepstatin, 1 μg/ml leupeptin, 1 μg/ml aprotinin. The dialysate was loaded onto a CM-Sepharose cation exchange column and step eluted with starting buffer containing 500 mM NaCl. Fractions containing BBM-I were pooled, diluted ∼fourfold, and then loaded onto a 1 ml MonoQ anion exchange column. BBM-I was eluted with a 50–500 mM NaCl gradient. Fractions containing BBM-I were then pooled and diluted fourfold into the same 50 mM NaCl buffer, loaded onto a MonoS cation exchange column and eluted with a 50–500 mM NaCl gradient.
Actin was isolated from rabbit skeletal muscle by the method of Spudich and Watt (1971).
Specimen Preparation
BBM-I was dialyzed into 10 mM imidazole, pH 7.5, 50 mM NaCl, 1 mM DTT, 1 mM EGTA, and 1 mM MgCl2. For the ADP experiment, BBM-I in the above buffer was incubated with 1 mM ADP. Actin (diluted in the above buffer) was applied to carbon-coated, copper EM grids (400 mesh) at a concentration of 20 μg/ml (0.5 μM). After ∼2 min, the grids were rinsed with two drops of buffer and BBM-I was applied to the grids. BBM-I concentrations were 0.5–1.0 mg/ml (3–6 μM) for the rigor experiments and 1.5–2.0 mg/ml (7.5–12 μM) BBM-I for the ADP experiments. After ∼2 min, the grids were blotted and plunged into ethane slush. Grids were stored under liquid nitrogen.
EM
Grids were mounted in a Gatan (Pleasanton, CA) 626 cryo-stage and inserted into a Philips CM120 transmission electron microscope (Eindhoven, Netherlands) operating at an accelerating voltage of 100 kV. Images were collected at a nominal magnification of 35,000 and at defocus values ranging from −1.4 to −2.1 μm.
Image Processing
Images were screened on an optical diffractometer for both image and filament quality. Selected images were required to be free of drift and astigmatism, and at appropriate defocus. Filaments showing good optical diffraction (symmetric about the meridian with intensity on the J2, J4, J−3, J−1, J1) were selected for densitometry and computer processing.
The images were scanned on a flatbed scanning microdensitometer (PDS 1010G; Perkin-Elmer Corp., Norwalk, CT) at spot and step sizes of 20 μm, corresponding to 5.71 Å at the specimen. The filaments were subsequently processed using the PHOELIX helical image processing package (Whittaker et al., 1995a ; Carragher et al., 1996), using the MRC (Medical Research Council, Cambridge, England) suite of programs (DeRosier and Moore, 1970). Briefly, each filament was straightened, the positions of the layer lines were determined, and an integral number of repeats was excised and floated into an array size suitable for Fourier transformation. The positions of zeroes in the contrast transfer function (CTF) were determined for each image. Each image was corrected for the effects of the CTF assuming 10% amplitude contrast. Layer line data were taken from the transform after refinement of the filament axis position. The data from the individual filaments were then fit together and averaged using an individual data set as an initial template. The fitting and averaging were integrated using the previous average as a template until the averaged layer line data ceased to change between cycles (usually three to four cycles). Fitting was performed using the peaks of the strong Bessel orders (J = 2, 4, −5, −3, −1, 1). The final averaged data set was then used to “sniff” the transforms of the individual data sets (Morgan et al., 1995). The sniffing procedure discards the assumption of perfect helical symmetry and uses the averaged data to refine the layer line position. This procedure results in an improved signal-to-noise ratio on weak layer lines. The sniffed data sets were then fit and averaged in two cycles of averaging. The final data set was truncated to 30 Å and used to calculate a 3D map in a Fourier-Bessel synthesis. Solid, 3D surfaces were rendered using the program SYNU (Hessler et al., 1992). Fitting of atomic models to EM maps was performed manually using the program O (Jones et al., 1991).
Statistical Analysis
The individual data sets were moved to a common phase origin and maps were calculated. A mean density and variance were calculated for each voxel in the 3D maps of both the rigor and ADP data sets. A Student's t test was then used to compare these two structures (Milligan and Flicker, 1987). Differences of P < 0.0001 were presumed to be statistically significant.
Results
Images and Image Analysis
Fig. 1 shows two cryoelectron micrographs of actin filaments fully decorated with purified BBM-I in the absence (Fig. 1 a) or presence (Fig. 1 b) of 1 mM ADP. These filaments do not show the characteristic arrowhead appearance of actin filaments decorated with skeletal muscle myosin subfragment-1 (S1) (Milligan and Flicker, 1987). This difference is likely due to the fact that BBM-I extends out nearly orthogonally from the actin filament (see below), as well as to the much higher background of BBM-I preparations relative to those of myosin S1. Fig. 1 , c and d, shows the computed transforms of the images in a and b, respectively. Although the images have rather low contrast, both the rigor and ADP filaments give reasonably sharp, although weak, diffraction patterns. 42 images of rigor filaments and 23 images of the actoBBM-I filaments, decorated in the presence of 1 mM ADP, were analyzed to produce the layer lines shown in Fig. 2. The layer lines shown have been truncated to 30 Å and represent all of the data used to synthesize the 3D map (below). The layer line data for the two averages are very similar with only some minor differences noticeable on the Bessel orders n = 4, −3, and 1, for example. A summary of the parameters obtained from the fitting and averaging is presented in Table I.
Figure 1.
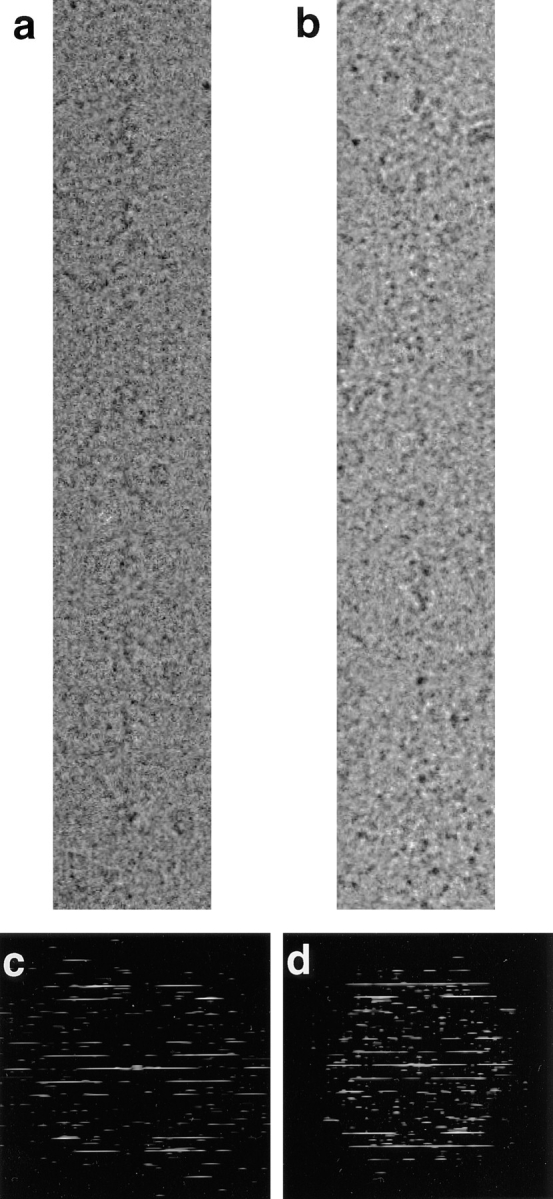
Images of actin filaments decorated with BBM-I. (a) A cryoelectron micrograph of actoBBM-I in the absence of nucleotide (rigor), which has been digitized and computationally straightened. There is very low contrast, due to an excess amount of protein in the background. (b) A cryoelectron micrograph of an actin filament decorated with BBM-I.ADP. As with the rigor images, actoBBM-I.ADP exhibits very low image contrast, due primarily to a high background. (c and d) Computed Fourier transforms of the straightened filaments shown in a and b, respectively.
Figure 2.
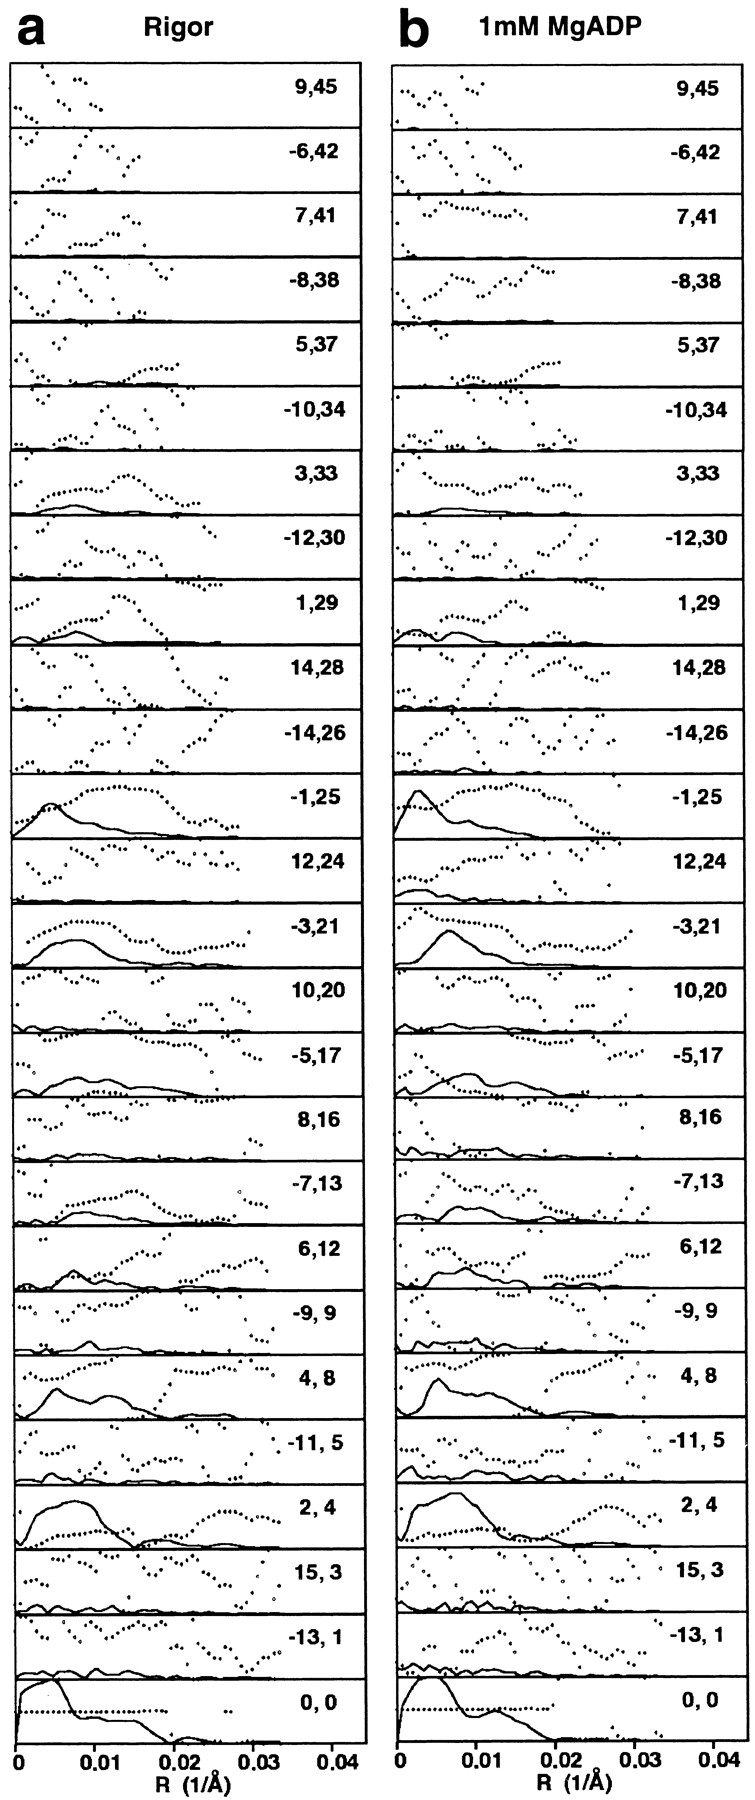
The final layer line data for actin filaments decorated with BBM-I. The layer line data in a and b were used in the Fourier-Bessel synthesis of the rigor and MgADP maps shown in Figs. 3 and 6, respectively. The data were truncated to a uniform resolution of 30 Å. The solid lines represent the amplitudes and the dotted lines represent the phases for each layer line. The ordered pairs of numbers are the Bessel order (n) and the layer line number (l) for a 54:25 helical selection rule.
Table I.
Image Processing of Actin Filaments Decorated with BBM-I
| Specimen | Data sets* | Particles‡ | Residual§ | Anti-polar residual§ | ||||
|---|---|---|---|---|---|---|---|---|
| No ADP | 54 | 8,073 | 33.1° | 69.0° | ||||
| 1 mM MgADP | 36 | 6,237 | 31.5° | 56.9° |
Near or far side data sets.
Single actoBBM-I complexes.
Average amplitude-weighted phase residual.
The actoBBM-I Rigor Complex
The averaged layer line data for the rigor filaments were truncated to 30 Å and used in a Fourier-Bessel synthesis to produce the 3D map presented in Fig. 3. The BBM-I molecule extends out from the actin filament and displays density that can be interpreted in terms of three domains: the myosin catalytic (or motor) domain, the LCBD, and the lipid-binding domain (Fig. 3). The catalytic domain is a large, globular density that binds tangentially to the actin filament, whereas the LCBD is a long density extending out orthogonally from the filament axis (Whittaker and Milligan, 1997). The LCBD consists of three densities, which presumably correspond to the three bound CaM light chains (Figs. 3 and 4). The putative, lipid-binding domain can be assigned, since it is known to be located at the COOH terminus, distal to the third CaM light chain. Additionally, its shape and position closely match that of the lipid-binding domain assigned in the tilt-series reconstruction of negatively stained crystals of BBM-I (Jontes and Milligan, 1997). Thus, consistent with the results of our earlier studies, the BBM-I molecule is an elongated and irregularly shaped molecule. The length of BBM-I as measured in the helical reconstruction is ∼230-Å long, which closely matches the length found in the map calculated by tilt-series reconstruction (Jontes and Milligan, 1997). The details of the map strongly suggest that the entire BBM-I molecule has been visualized.
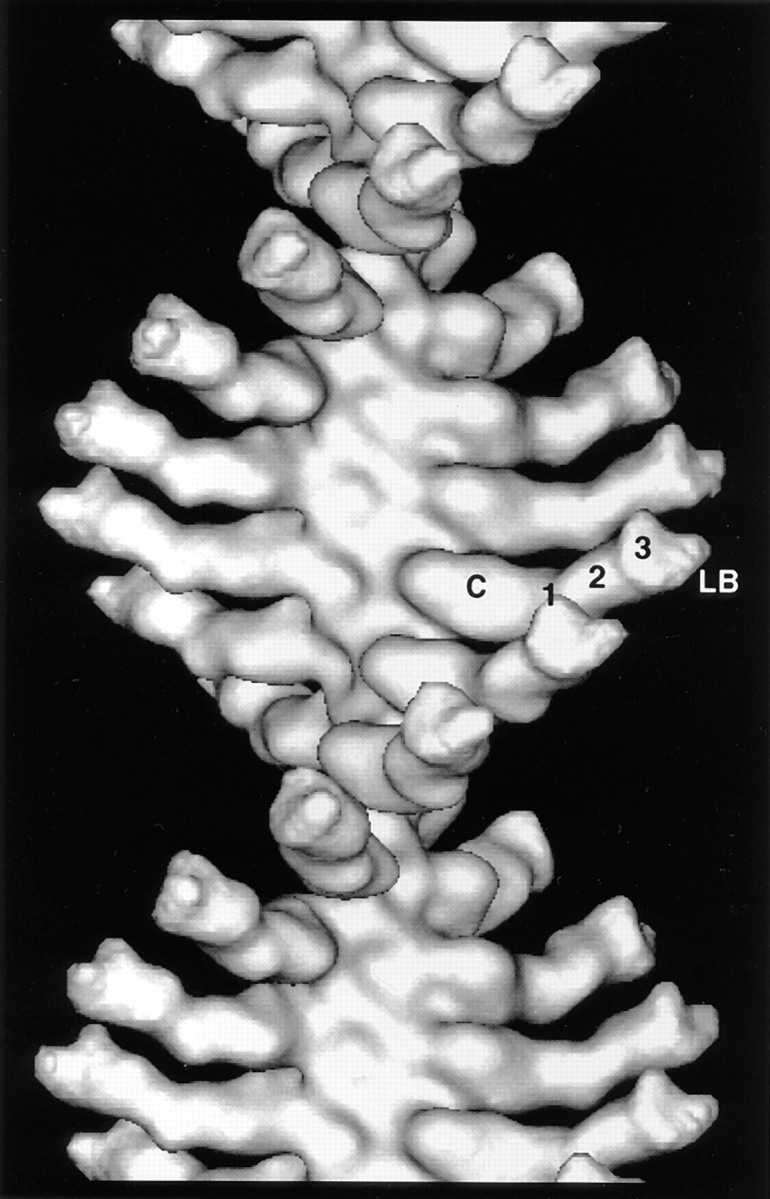
Figure 3.
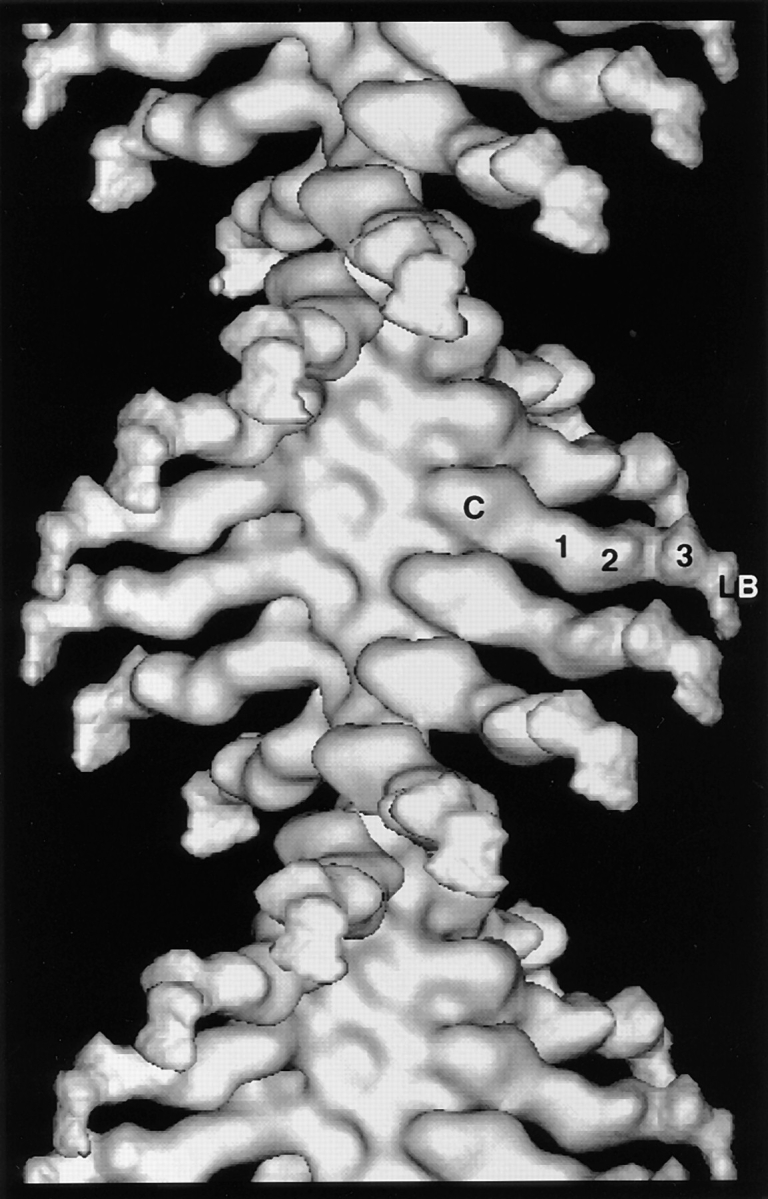
3D map of actoBBM-I in the absence of nucleotide, calculated from the layer line data shown in Fig. 2. Densities can be identified in the 3D map that are attributable to the catalytic domain, each of three calmodulin light chains, and a lipid binding domain, as indicated. C, catalytic; 1, 2, and 3, indicate the three calmodulin light chains; LB, lipid-binding domain.
Figure 4.

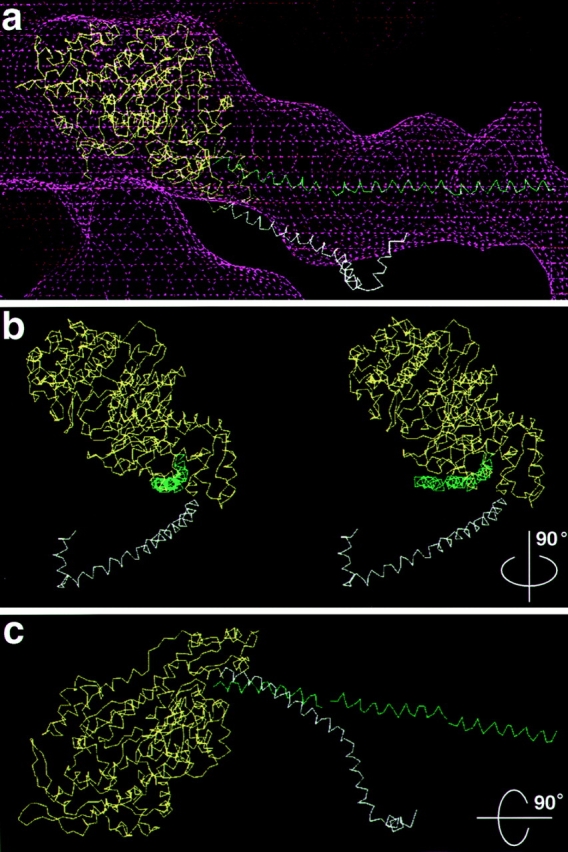
3D model of BBM-I. This model was built by fitting the x-ray structures of the myosin catalytic domain and the ELC of skeletal muscle myosin into the EM density map (magenta wire cage) for BBM-I. At the COOH-terminal end of the molecule, an extra density is found which can be attributed to the basic, lipid-binding domain. In addition to the catalytic domain, the three light chains (LC1, LC2, and LC3) and the lipid-binding domain (LB) are indicated. The Cα backbones of the catalytic domain and the three light chains are displayed in alternating yellow and white for clarity, and the HC helix is shown in green.
Pseudo-atomic Model
We used the crystal structure of the skeletal muscle myosin catalytic domain and the associated ELC to build an approximate atomic model of BBM-I (Rayment et al., 1993a ). As has been done previously (Rayment et al., 1993b ; Jontes et al., 1995; Whittaker and Milligan, 1997), the backbone of the myosin catalytic domain was fit into the EM density. Since the myosins-I lack the NH2-terminal β barrel present in myosin-II (Pollard et al., 1991; Mooseker and Cheney, 1995), these residues were removed from the crystal structure before fitting.
Similarly, three copies of the ELC crystal structure were fit into the LCBD (Fig. 4). The ELC was used, since Houdusse et al. (1996) have suggested that the structure of apocalmodulin bound to an IQ motif should assume a conformation similar to that found in the light chains of muscle myosins. Because the shapes of the light chains and the resolution of the EM map do not permit as unambiguous a fit as was obtained for the catalytic domain, a number of other constraints were used. First, it was assumed that the axis of the heavy chain (HC) helix was oriented roughly parallel to the long axis of the LCBD, and that the COOH terminus of each HC helix should point away from the catalytic domain. Additionally, the 23-residue IQ motif suggests that there should be a spacing of ∼35–40 Å and a rotation of ∼140° between successive CaMs, assuming a perfect α-helix (3.6 residues per turn, and 1.5 Å/residue). The final step was to manually fit the individual calmodulins into the EM density to produce a “best-fit,” as determined by eye. Using these criteria, the fit shown in Fig. 4 was obtained. The first and second light chains fit the EM density reasonably well while obeying each of the fitting criteria. However, the third light chain fit the EM density much better with a rotation of only ∼100°, rather than the predicted ∼140°. This may indicate that the HC helix is kinked or disordered at the junction between the second and third light chains.
Once the fitting was performed, it was then possible to compare the orientation of the BBM-I LCBD to that of skeletal muscle myosin (Fig. 5). The S1 HC crystal structure was placed in the same orientation as the BBM-I model and the HC α-helix was compared to that of BBM-I (Fig. 5 a). From these fits, it is apparent that the α-helix of BBM-I exits the catalytic domain from a slightly different position than in S1 and has a significantly different orientation. The end of the HC helix of BBM-I is displaced upward by several angstroms relative to that of S1 (Fig. 5 b). Next we compared the orientation and path taken by the BBM-I and S1 HC helices. The BBM-I HC helix projects out nearly orthogonally from the filament axis, whereas the S1 helix angles downward, defining the “barbed” end. Additionally, the BBM-I helix appears to remain quite straight throughout the length of the LCBD; the S1 helix is much more curved. Although this difference could partially be due to the fitting procedure itself, this is not very likely, since maintaining a straight, colinear helix was not a constraint of the light chain fitting. Thus, this comparison appears to highlight real differences in the two LCBDs, reflecting both the differences in the HC sequences (including IQ motif spacing) and the differences in light chain composition (ELC and regulatory light chains vs. CaM).
Figure 5.
Comparison of the BBM-I and skeletal muscle S1 light chain– binding domains. (a) Fit of the myosin catalytic domain (yellow), the BBM-I LCBD helix (green), and the skeletal muscle S1 light chain–binding domain helix (white). There is clearly a difference in the position of the LCBD between the two myosins, indicating a different exit point of the long α-helix from the catalytic domain. (b) A stereo pair of the backbones shown in a, rotated ∼90° about the filament axis. The EM density has been omitted for clarity. The S1 helix also appears displaced laterally relative to the BBM-I helix. (c) A view of the carbon backbones, looking down the filament axis, rotated 90° about the horizontal. Again, the EM density was omitted for clarity.
The Ternary Complex of Actin–BBM-I–MgADP
Fig. 6 presents the 3D map calculated from the layer line data shown in Fig. 2 b. Consistent with our previous study (Jontes et al., 1995), the structure of the actoBBM-I complex in the presence of MgADP has a similar overall shape to that of the rigor structure. As in the rigor structure, densities are found that can be attributed to the catalytic domain and the LCBD with its three associated light chains. The lipid-binding domain can not be seen, although, at lower contours mass begins to protrude from the end of the third calmodulin (Fig. 6). The catalytic domain appears to be attached to actin in a manner identical to that found in the absence of ADP. This conclusion is supported by two lines of evidence. First, the same orientation of the myosin catalytic domain fits both density maps equally well. The x-ray fits of the catalytic domain shown in Figs. 4 and 7 are identical; the position of the catalytic domain has not been altered between the separate EM maps. More quantitatively, a statistical difference map calculated for the two data sets does not reveal any significant differences in the catalytic domain (P < 0.0001), consistent with the previous study of Jontes et al. (1995).
Figure 6.
3D map of actin filaments decorated with BBM-I.ADP. The map was calculated using the layer line data shown in Fig. 2 b. Like the rigor map, mass can be seen to extend to high radius. The gross features of both the rigor and ADP maps are essentially the same: a globular catalytic domain and a long, irregular light chain– binding domain. Although the lipid-binding domain is not visible in the ADP map, mass protrudes from the end of the light chain– binding domain, at the position where the lipid-binding domain is found in the rigor map. The large conformational change is quite striking (compare to Fig. 3), giving the impression that the filament has reversed polarity. C, catalytic domain; 1, 2, and 3 indicate the three light chains; LB, the lipid-binding domain.
In stark contrast to the catalytic domain, the LCBD of BBM-I has adopted a completely different conformation. The entire LCBD appears to have rotated as a rigid body (Fig. 8). Jontes et al. (1995) measured a change in orientation of ∼32°, producing an angular movement of ∼50 Å at the end of the second light chain in response to 10 mM MgADP. Here we have used the x-ray fits to the improved maps to make more accurate estimates of the movement. The entire LCBD defined in Fig. 4 was rotated as a single unit to provide the fit shown in Fig. 7. In addition to the large axial swing, the fit was improved slightly by rotating the LCBD about its long axis by 20–30° (Fig. 8 a). This additional rotation was also observed in our earlier work (Jontes et al., 1995), but the lack of distinguishing features in the LCBD made it difficult to obtain an accurate estimate of its magnitude. The results of the fitting procedure are consistent with the proposal that the LCBD rotates as a rigid body, while the catalytic domain remains attached to the actin in a fixed orientation. These results are summarized in Fig. 8 b.
Figure 8.
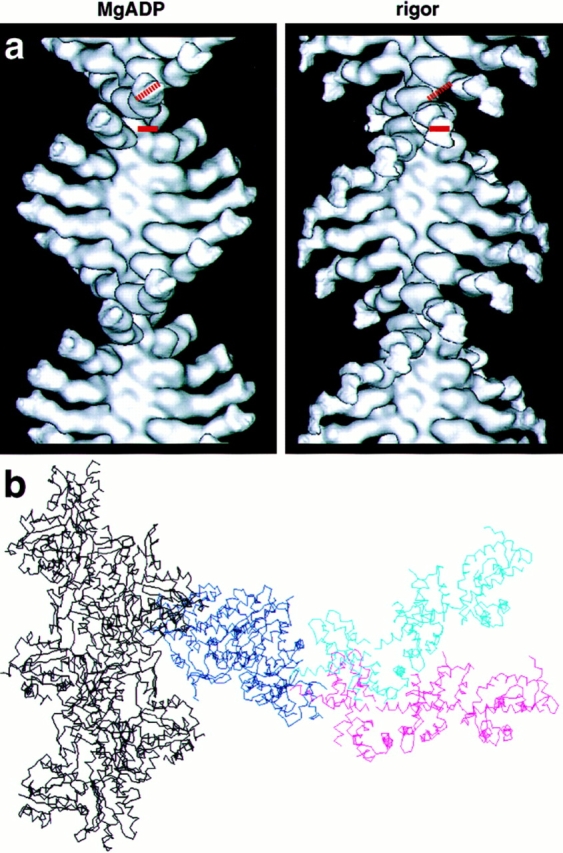
Comparison of the ADP and rigor 3D maps. (a) Direct comparison of the rigor and ADP maps clearly reveals the large swing of the BBM-I LCBD. In addition to the swing, there also appears to be a 20–30° rotation of the LCBD about its long axis. The dotted and solid red bars represent the orientation of the ADP (left) and rigor (right) LCBDs, respectively. (b) A superposition of the two x-ray fits for direct comparison of the two conformations. The common catalytic domain is in dark blue, the ADP LCBD is in cyan, and the rigor LCBD is in magenta. Shown in black are five monomers of the actin filament. This view highlights the magnitude of the BBM-I tail swing, as well as the fact that the tail moves as a rigid unit.
Figure 7.

3D model of BBM-I in the presence of 1 mM MgADP. The EM density is shown in magenta, the myosin catalytic domain is in yellow, the CaM light chains are in cyan, and the HC helix is shown in green. The results of the rigor fitting (Fig. 4) were rotated as a rigid unit to obtain the fit to the ADP map. The light chain–binding domain was rotated by ∼31° with respect to the rigor orientation, in addition to a rotation of 20 to 30° about its long axis.
Discussion
Rigor Complex
The actoBBM-I rigor complex we have visualized by cryo-EM is similar to previously characterized myosins (Milligan and Flicker, 1987; Whittaker et al., 1995b), although it also displays a number of substantial differences. Notably, the geometry of actin binding by the catalytic domain is quite similar to that of S1 (Whittaker and Milligan, 1997), as might be expected of such closely related proteins. However, the molecular envelope of the BBM-I molecule differs significantly from that of conventional myosins-II (Milligan and Flicker, 1987; Whittaker et al., 1995b ). The catalytic domain of BBM-I lacks an NH2-terminal extension present on myosin-II, which the chicken skeletal muscle (S1) crystal structure revealed to be a β barrel domain (Pollard et al., 1991; Rayment et al., 1993a , b ; Whittaker and Milligan, 1997). More significantly, the LCBD extends out from the catalytic domain in an orientation nearly orthogonal to the filament axis, whereas the S1 LCBD extends out at a more acute angle orientation (Milligan and Flicker, 1987; Rayment et al., 1993b ; Whittaker and Milligan, 1997), which is responsible for the traditional assignment of a 45° angle. This difference can be attributed to the difference in position and orientation of the long, light chain–binding helix (Fig. 5). A number of factors may contribute to the variation in LCBD position. First, the interactions of the HC “converter” region with the proximal region of the LCBD may differ depending on the type of light chain bound to the first IQ motif, i.e., CaM vs. ELC (Houdusse et al., 1996). Additionally, the absence of an NH2-terminal extension in BBM-I could also play a role in altering the position of the LCBD. Alternatively, the observed differences may be a “delocalized” property reflecting overall differences in myosin sequence and structure.
As has been discussed previously (Jontes and Milligan, 1997), the BBM-I LCBD consists of three main densities spaced ∼35–40 Å apart, consistent with the spacing expected from the 23-residue IQ motifs. We fit the crystal structure backbone of the skeletal muscle ELC into the EM density for each of the three CaM light chains. Although a crystal structure exists for CaM bound to a target peptide (Meador et al., 1992), Houdusse et al. (1996) have suggested that the conformation of apocalmodulin bound to an IQ motif will more closely resemble that of a bound ELC. Initial modeling of the CaM structure of Meador et al. (1992) produced a reasonable fit to the EM density (data not shown), but we found that the ELC backbone fit our map somewhat better. As can be seen, the fitting of the light chains into the LCBD fills the EM envelope relatively well (Fig. 4). At the resolution of our 3D map, we are unable to make any meaningful statements about the conformational states of the CaM light chains. However, neglecting the details of CaM conformation, we feel the fits are approximately correct and are sufficient to provide a qualitative model of BBM-I structure.
The Lipid-binding Domain
It is clear from comparing BBM-I in the presence and absence of ADP that the angle of the LCBD relative to the lipid-binding domain (or the plasma membrane) has to change during a BBM-I powerstroke. This change requires that the junction between the light chain 3 (LC3) and the lipid-binding domain act like a hinge. It has been argued previously that this might be the case in order for BBM-I to attach to actin filaments that approach the membrane from different angles (Jontes and Milligan, 1997). This also suggests that the extent of the translational movement should be measured from the end of the third light chain (as was done here), not from the furthest density in the map, as any structure beyond the hinge would not contribute significantly to the rigid “lever arm”. Given the apparent flexibility in the junction between LC3 and the lipid-binding domain (Hayden et al., 1990; Jontes and Milligan, 1997), this junction could be a possible location for BBM-I regulation. Swanljung-Collins and Collins (1992) have provided some evidence for a regulatory mechanism involving this part of the molecule; the BBM-I lipid-binding domain is phosphorylated by protein kinase C and this phosphorylation is potentiated by binding to phospholipids. Additionally, recent work has shown that BBM-I displays reduced motility and actin binding while bound to lipids (Zot, 1995). It could be the case that phosphorylation of the BBM-I tail affects the flexibility of the LC3–lipid-binding domain junction, possibly inducing a more upright posture of BBM-I on the membrane. In this regard, BBM-I may act like skeletal muscle myosin where crossbridges lie close to the thick filament during relaxation, and extend away from the thick filaments during activation (Huxley, 1969).
Effect of MgADP
The reorientation of the LCBD in the presence of 1 mM MgADP reveals a dramatic effect of MgADP on the conformational equilibrium of BBM-I (Fig. 8; and Jontes et al., 1995). The magnitude of the change in angle is ∼31°, resulting in an axial translation of ∼63 Å. The LCBD appears to move as a rigid body, with the attachment to actin remaining fixed. In addition to the axial translation, there appears to be a ∼20–30° rotation of the LCBD about its long axis (Fig. 8 a). As in the earlier work of Jontes et al. (1995), no significant differences were found in the catalytic domain between the rigor and ADP maps.
Whereas BBM-I clearly undergoes a large conformational change in response to ADP binding, it is not clear which biochemical state in the ATPase cycle has been trapped. Incorporation of our structural results into the existing framework of actomyosin mechanochemistry requires identifying to which step in the cycle our ADP state corresponds. Analysis of the skeletal muscle myosin and actomyosin ATPases has demonstrated that ADP binding and release occurs in at least two steps: a slow isomerization and a rapid equilibrium association/dissociation (Bagshaw and Trentham, 1972; Sleep and Hutton, 1980; Trybus and Taylor, 1982; Rosenfeld and Taylor, 1984; Taylor, 1991). Ligand binding generally occurs in two steps: rapid formation of an initial complex followed by a rate-limiting isomerization (Fersht, 1985; Gutfreund, 1995). The ADP-bound state we have trapped could either be the initial BBM-I–ADP, rapid equilibrium complex, or it could be the state formed after a subsequent isomerization. The first possibility suggests that the BBM-I tail would wag with each rapid equilibrium ADP binding/release cycle. The second possibility supposes that the observed isomerization occurs between ADP-bound states, a step distinct from the binding reaction itself. Although our data cannot distinguish between these two possibilities, we favor the latter proposal for two reasons. First, it seems more plausible that such a large structural rearrangement (Fig. 8 b) would be associated with a slower isomerization step rather than with a rapid binding reaction. Second, our structural results can be more easily incorporated into the kinetic pathway with this interpretation. In the terminology of Sleep and Hutton (1980), we have equated our ADP state with the AM′.ADP state in the following scheme:

For skeletal muscle myosin, addition of ADP to AM is insufficient to drive the ternary complex through step 2; since K2 ⩽ 0.02 (Sleep and Hutton, 1980), it would be impossible to trap the AM′.ADP state. While this appears to argue against our interpretation, we emphasize that the large free energy barrier to step 2 has not been shown to exist for BBM-I. Skeletal muscle myosin gets trapped at AM.ADP, but BBM-I and smooth muscle myosin may have access to the AM′.ADP state. Consistent with this scheme, no conformational change is observed in skeletal S1 in response to ADP (Gollub et al., 1996; Diaz-Avalos, R., and R.A. Milligan, unpublished observations). If the assignment of our structural state to AM′.ADP is correct, it would indicate a substantial difference in the kinetics and energetics between BBM-I (and smooth muscle myosin) and skeletal muscle myosin. Alternatively, skeletal muscle myosin, smooth muscle myosin, and BBM-I might all be in the AM.ADP state, which raises the difficult question of why addition of ADP elicits a conformational change in some myosins and not others. Detailed investigation of BBM-I and smooth muscle myosin kinetics will be required to settle this issue.
Involvement in Force Production
Given the above interpretation, the question can be asked: coming forward through the ATPase cycle, will reversal of the ADP-dependent conformational change (Fig. 8 b) result in force production and contribute to a myosin working stroke? On the basis of structural results alone, it is not possible to answer this question, although the movement closely matches predictions based on a variety of structural data (Huxley and Kress, 1985; Cooke, 1986; Vibert and Cohen, 1988).
The experiments most directly relevant to the mechanism of force generation have been mechanical experiments performed on muscle fibers. If a muscle fiber is stimulated to contract isometrically in the presence of added Pi, the steady-state force is reduced (Cooke and Pate, 1985). Similarly, initiation of active contraction in the presence of excess Pi accelerates the rise in tension, while decreasing the final isometric tension (Hibberd et al., 1985). These results suggest that phosphate is able to bind to an AM′.ADP state (believed to be the major force-producing state) and to reverse the force-generating transition. This conclusion is supported by flash-photolysis studies. Photorelease of caged Pi in isometrically contracting fibers causes an exponential decrease in tension (Dantzig et al., 1992, Millar and Homsher, 1992; Homsher et al., 1997), with the rate of decline showing a hyperbolic dependence on Pi concentration. These results have been interpreted to indicate that binding of phosphate to a crossbridge induces a reversal of the powerstroke. The mechanical evidence, as interpreted, is most consistent with the proposal that the force-producing step occurs before Pi release and therefore, before the state we have observed by EM.
The results of these mechanical studies make it appear very unlikely that the 63-Å movement we observe represents a force-generating transition analogous to that observed in skeletal muscle fibers, although it is not clear what event(s) the mechanical transients are actually measuring. This leads to a second possibility, first suggested by Huxley and Simmons (1971), that the myosin working stroke should occur in two or more steps. This proposal was originally based on the low values of work per crossbridge which were obtained if the working stroke was assumed to occur in a single step. Our cryo-EM results are consistent with this proposal. Given the results from mechanical experiments and our EM study, it can be suggested that force is produced in the following transitions:

with the assignment of our ADP-state to the AM′.ADP state of Sleep and Hutton (1980). This scheme would be consistent with our structural results and with the mechanical experiments, while satisfying the prediction of Huxley and Simmons (1971) that the working stroke occurs in two or more discrete steps. Ma and Taylor (1994), based on myofibril kinetics, have also suggested that there may be two force-producing transitions. A structural interpretation of this scheme is presented in Fig. 9. It is important to note that, in this scheme, neither structural transition occurs synchronously with a ligand release step; in both cases, a large conformational change is stabilized by a subsequent biochemical step. Finally, it must be mentioned that the ADP state we observe may be an additional step, having no analogue in the ATPase cycle of skeletal muscle myosin. However, we believe that the working hypothesis presented above is the simpler interpretation.
Figure 9.
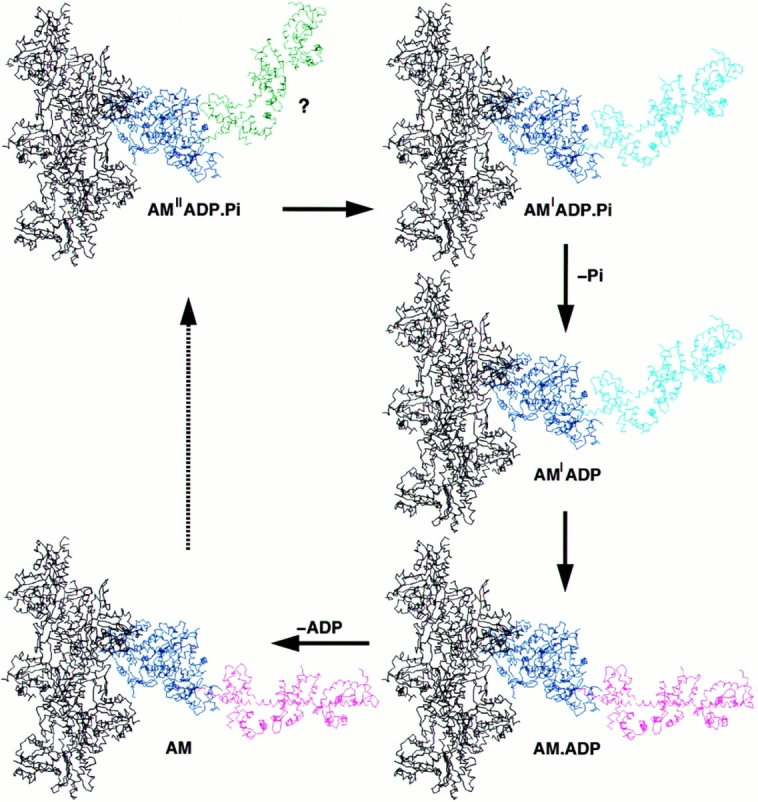
Structural interpretation of the events occurring during force production. This is a graphic representation of our interpretation of the force- generating cycle, as presented in the discussion. The transition from AM′′ADP.Pi to AM′.ADP.Pi is based on mechanical studies performed on skeletal muscle fibers. The representation of this as an additional rotation of the LCBD is purely hypothetical (emphasized by ?), as no structural rearrangements have yet been demonstrated. In this scheme, each force-producing step can be considered to be a two-step process: a force-generating isomerization followed by a ligand release step. This diagram also emphasizes that force is not directly coupled to products release, but occurs in separate steps. The steps in the cycle leading from rigor to the weakly bound states have been omitted, as indicated by the dotted arrow.
Variation within the Myosin Superfamily
Our structural results also create an apparent paradox: while we have trapped an apparent intermediate in the force-generating cycle, our ability to trap this state brings into doubt its ability to generate force. In other words, the accessibility of this state suggests that the free energy barrier between this state and rigor are relatively small. In turn, this small free energy difference indicates that relatively little work can be obtained at this step. Conversely, in the case of skeletal muscle myosin the large free energy difference between AM′.ADP and AM.ADP suggests that this step could produce work, yet this same energy difference prevents it from being visualized (Gollub et al., 1996; Diaz-Avalos, R., and R.A. Milligan, unpublished observations). A small free energy change for a given transition would appear to limit the amount of work that can be extracted from that step. However, it has been pointed out previously that free energy transduction is a property of the cycle and cannot be attributed to individual steps (Hill and Eisenberg, 1981). In the case of BBM-I, the transition between AM′.ADP and AM.ADP could be pulled forward, since any work performed during this transition would be trapped by ADP release and the subsequent dissociation of actomyosin by ATP (Gollub et al., 1996). A detailed analysis of BBM-I kinetics and mechanics will be required to provide further evidence for this suggestion.
The large free energy drop between AM.ADP states of skeletal muscle myosin could represent an adaptation of this myosin, reflecting the functional requirements of fast skeletal muscle. Destabilization of the AM′. ADP state would accelerate the flux through this part of the ATPase cycle, reducing the amount of time spent attached to actin. The increased rate would reduce the amount of drag exerted by attached, negatively strained cross-bridges and increase the maximal shortening velocity (Huxley, 1957; Siemankowksi et al., 1985). Conversely, a smaller free energy drop will make the step more reversible, reduce the V max, and increase the time spent generating force. The latter case could correspond to the situation of smooth muscle. Since much of the free energy of ATP hydrolysis is derived from the steady-state concentrations of ATP, ADP, and Pi maintained in muscle fibers (White and Taylor, 1976), the accumulation of ADP would reduce the forward driving force and slow the cycle. Similarly, most of the mechanical effects of ADP and Pi on contracting muscle fibers could be explained simply in terms of limiting the flux into (Pi) and out of (ADP) the force-producing states. These considerations may relate to the “latch” state of smooth muscle myosin (Hai and Murphy, 1989), in which smooth muscle sustains an elevated force, while ATPase activity decreases. A number of studies have suggested that this phenomenon may be a product of the higher affinity of smooth muscle myosin for ADP, relative to skeletal muscle myosin (Drew et al., 1992; Nishiye et al., 1993). From this point of view, the lack of a latch state in skeletal muscle would be a novel aspect of its kinetic cycle, allowing it to achieve higher shortening velocities.
If it is the case that we have visualized the AM′.ADP state, our results indicate that the energy difference between ADP states is not as great for BBM-I as it is for skeletal S1. This possibility suggests that although myosins presumably operate by a fundamentally similar mechanism, there are substantial variations in the kinetics and energetics of different myosins. Such variation complements the structural differences between myosins, as emphasized by Jontes et al. (1995). The magnitude of the angular swing is ∼50% greater for BBM-I than for smooth S1, ∼31° vs. ∼23° (Whittaker et al., 1995b ). This corresponds to an 80% increase in the step size, ∼63 Å vs. ∼35 Å. Additionally, as mentioned above, a number of the details also differ between these two myosins; smooth muscle S1 appears to lack the rotational component of the movement found in BBM-I, and BBM-I appears to lack the statistical differences found in the smooth S1 catalytic domain. Although the nature of the movement appears to be roughly conserved, the response of these myosins to ADP differs both qualitatively and quantitatively. It becomes clear that results obtained with one myosin are not necessarily relevant to other myosin family members. This diversity in kinetic, structural, and mechanical properties could allow for a more complete understanding of myosin function, since detailed analysis of only a single myosin type may miss salient features of the actomyosin mechanism that may not be apparent or experimentally accessible. A stronger thesis suggests that a full understanding of the myosin mechanism can only be obtained through this type of comparative analysis. It is expected that the distribution of myosin properties will reflect a corresponding range of functional requirements, as myosins of different shapes and sizes fulfill a variety of roles in the daily economy of cells and organisms.
Acknowledgments
We would like to thank M. Whittaker and B. Carragher for computational assistance. We would also like to thank D.P. Dias and M. Whittaker for critical reading of the manuscript, and for helpful discussions.
This work was supported by grants from the National Institutes of Health (AR39155 and AR44278) to R.A. Milligan. R.A. Milligan is an Established Investigator of the American Heart Association. J.D. Jontes is a predoctoral fellow of the Howard Hughes Medical Institute.
Abbreviations used in this paper
- AM
actomyosin
- BBM-I
brush border myosin–I
- CaM
calmodulin
- CTF
contrast transfer function
- ELC
essential light chain
- HC
heavy chain
- LCBD
light chain–binding domain
- 3D
three-dimensional
Footnotes
Address all correspondence to R.A. Milligan, Department of Cell Biology, The Scripps Research Institute, 10550 North Torrey Pines Road, La Jolla, CA 92037. Tel.: (619) 784-9827. Fax: (619) 784-2749. E-mail: milligan @scripps.edu
References
- Bagshaw CR, Trentham DR. The characterization of myosin-product complexes and of product-release steps during the magnesium ion-dependent adenosine triphosphatase reaction. Biochem J. 1974;141:331–349. doi: 10.1042/bj1410331. [DOI] [PMC free article] [PubMed] [Google Scholar]
- Carragher BO, Whittaker M, Milligan RA. Helical processing using PHOELIX. J Struct Biol. 1996;116:107–112. doi: 10.1006/jsbi.1996.0018. [DOI] [PubMed] [Google Scholar]
- Cheney RE, Mooseker MS. Unconventional myosins. Curr Opin Cell Biol. 1992;4:27–35. doi: 10.1016/0955-0674(92)90055-h. [DOI] [PubMed] [Google Scholar]
- Collins JH, Borysenko CW. The 110,000-dalton actin- and calmodulin-binding protein from intestinal brush border is a myosin-like ATPase. J Biol Chem. 1984;259:14128–14135. [PubMed] [Google Scholar]
- Collins K, Sellers JR, Matsudaira P. Calmodulin dissociation regulates brush border myosin I (110-kD-calmodulin) mechanochemical activity. J Cell Biol. 1990;110:1137–1147. doi: 10.1083/jcb.110.4.1137. [DOI] [PMC free article] [PubMed] [Google Scholar]
- Conzelman KA, Mooseker MS. The 110-kD protein-calmodulin complex of the intestinal microvillus is an actin-activated MgATPase. J Cell Biol. 1987;105:313–324. doi: 10.1083/jcb.105.1.313. [DOI] [PMC free article] [PubMed] [Google Scholar]
- Cooke R. The mechanism of muscle contraction. CRC Crit Rev Biochem. 1986;21:53–118. doi: 10.3109/10409238609113609. [DOI] [PubMed] [Google Scholar]
- Cooke R, Pate E. The effects of ADP and phosphate on the contraction of muscle fibers. Biophys J. 1985;48:789–798. doi: 10.1016/S0006-3495(85)83837-6. [DOI] [PMC free article] [PubMed] [Google Scholar]
- Dantzig JA, Goldman YE, Millar NC, Lacktis J, Homsher E. Reversal of the cross-bridge force-generating transition by photogeneration of phosphate in rabbit psoas muscle fibres. J Physiol (Lond) 1992;451:247–278. doi: 10.1113/jphysiol.1992.sp019163. [DOI] [PMC free article] [PubMed] [Google Scholar]
- DeRosier DJ, Moore PB. Reconstruction of three-dimensional images from electron micrographs of structures with helical symmetry. J Mol Biol. 1970;52:355–369. doi: 10.1016/0022-2836(70)90036-7. [DOI] [PubMed] [Google Scholar]
- Drew JS, Harwalkar VA, Stein LA. Product inhibition of the actomyosin subfragment-1 ATPase in skeletal, cardiac and smooth muscle. Circ Res. 1992;71:1067–1077. doi: 10.1161/01.res.71.5.1067. [DOI] [PubMed] [Google Scholar]
- Fersht, A.R. 1985. Enzyme structure and mechanism. W.H. Freeman and Co., New York. 121–154.
- Garcia A, Coudrier E, Carboni J, Anderson J, Vandekerckhove J, Mooseker M, Louvard D, Arpin M. Partial deduced sequence of the 110-kD calmodulin complex of the avian intestinal microvillus shows that this mechano-enzyme is a member of the myosin I family. J Cell Biol. 1989;109:2895–2903. doi: 10.1083/jcb.109.6.2895. [DOI] [PMC free article] [PubMed] [Google Scholar]
- Gollub J, Cremo CR, Cooke R. ADP release produces a rotation of the neck region of smooth myosin but not skeletal myosin. Nat Struct Biol. 1996;3:796–802. doi: 10.1038/nsb0996-796. [DOI] [PubMed] [Google Scholar]
- Gutfreund, H. 1995. Kinetics for the Life Sciences. Cambridge University Press, Cambridge. 138–196.
- Hai CM, Murphy RA. Ca2+, cross-bridge phosphorylation and contraction. Annu Rev Physiol. 1989;51:285–298. doi: 10.1146/annurev.ph.51.030189.001441. [DOI] [PubMed] [Google Scholar]
- Halsall DJ, Hammer JA., III A second isoform of chicken brush border myosin I contains a 29-residue inserted sequence that binds calmodulin. FEBS (Fed Eur Biochem Soc) Lett. 1990;267:126–130. doi: 10.1016/0014-5793(90)80305-3. [DOI] [PubMed] [Google Scholar]
- Hammer JA., III The structure and function of unconventional myosins: a review. J Muscle Res Cell Motil. 1994;15:1–10. doi: 10.1007/BF00123827. [DOI] [PubMed] [Google Scholar]
- Hayden SM, Wolenski JS, Mooseker MS. Binding of brush border myosin I to phospholipid vesicles. J Cell Biol. 1990;111:443–451. doi: 10.1083/jcb.111.2.443. [DOI] [PMC free article] [PubMed] [Google Scholar]
- Hessler, D., S.J. Young, B.O. Carragher, M. Martone, J.E. Hinshaw, R.A. Milligan, E. Masliah, M. Whittaker, S. Lamont, and M.H. Ellisman. 1992. SYNU: software for visualization of 3-dimensional biological structures. In Microscopy: the Key Research Tool. C.E. Lyman, L.D. Peachey, and R.M. Fisher editors. 22:73–82., EMSA Inc., Milwaukee, WI.
- Hibberd MG, Dantzig JA, Trentham DR, Goldman YE. Phosphate release and force generation in skeletal muscle fiberes. Science (Wash DC) 1985;228:1317–1319. doi: 10.1126/science.3159090. [DOI] [PubMed] [Google Scholar]
- Hill TL, Eisenberg E. Can free energy transduction be localized at some crucial part of the enzymatic cycle? . Q Rev Biophys. 1981;14:463–511. doi: 10.1017/s0033583500002468. [DOI] [PubMed] [Google Scholar]
- Homsher E, Lacktis J, Regnier M. Strain-dependent modulation of phosphate transients in rabbit skeletal muscle fibers. Biophys J. 1997;72:1780–1791. doi: 10.1016/S0006-3495(97)78824-6. [DOI] [PMC free article] [PubMed] [Google Scholar]
- Houdusse A, Silver M, Cohen C. A model of Ca2+-free calmodulin binding to unconventional myosins reveals how calmodulin acts as a regulatory switch. Structure (Lond) 1996;4:1475–1490. doi: 10.1016/s0969-2126(96)00154-2. [DOI] [PubMed] [Google Scholar]
- Howe CL, Mooseker MS. Characterization of the 110-kdalton actin-calmodulin-, and membrane-binding protein from microvilli of intestinal epithelial cells. J Cell Biol. 1983;97:974–985. doi: 10.1083/jcb.97.4.974. [DOI] [PMC free article] [PubMed] [Google Scholar]
- Huxley AF. Muscle structure and theories of contraction. Prog Biophys Biophys Chem. 1957;7:255–318. [PubMed] [Google Scholar]
- Huxley AF, Simmons RM. Proposed mechanism of force generation in striated muscle. Nature (Lond) 1971;233:533–538. doi: 10.1038/233533a0. [DOI] [PubMed] [Google Scholar]
- Huxley HE. The mechanism of muscle contraction. Science (Wash DC) 1969;164:1356–1366. [Google Scholar]
- Huxley HE, Kress M. Crossbridge behavior during muscle contraction. J Muscle Res Cell Motil. 1985;6:153–161. doi: 10.1007/BF00713057. [DOI] [PubMed] [Google Scholar]
- Jones TA, Zou JY, Cowan SW, Kjeldgaard M. Improved methods for building protein models in electron density maps and the location of errors in these models. Acta Crystallogr A. 1991;47:110–119. doi: 10.1107/s0108767390010224. [DOI] [PubMed] [Google Scholar]
- Jontes JD, Milligan RA. Three-dimensional structure of brush border myosin-I at ∼20 Å resolution by electron microscopy and image analysis. J Mol Biol. 1997;266:331–342. doi: 10.1006/jmbi.1996.0777. [DOI] [PubMed] [Google Scholar]
- Jontes JD, Wilson-Kubalek EM, Milligan RA. A 32° tail swing in brush border myosin I on ADP release. Nature (Lond) 1995;378:751–753. doi: 10.1038/378751a0. [DOI] [PubMed] [Google Scholar]
- Ma Y-Z, Taylor EW. Kinetic mechanism of myofibril ATPase. Biophys J. 1994;66:1542–1553. doi: 10.1016/S0006-3495(94)80945-2. [DOI] [PMC free article] [PubMed] [Google Scholar]
- Matsudaira PT, Burgess DR. Identification and organization of the components in the isolated microvillus cytoskeleton. J Cell Biol. 1979;83:667–673. doi: 10.1083/jcb.83.3.667. [DOI] [PMC free article] [PubMed] [Google Scholar]
- Meador WE, Means AR, Quiocho FA. Target enzyme recognition by calmodulin: 2.4Å structure of a calmodulin-peptide complex. Science (Wash DC) 1992;257:1251–1255. doi: 10.1126/science.1519061. [DOI] [PubMed] [Google Scholar]
- Millar NC, Homsher E. Kinetics of force generation and phosphate release in skinned rabbit soleus muscle fibres. Am J Physiol. 1992;262:c1239–c1245. doi: 10.1152/ajpcell.1992.262.5.C1239. [DOI] [PubMed] [Google Scholar]
- Milligan RA, Flicker P. Structural relationships of actin, myosin, and tropomyosin revealed by cryo-electron microscopy. J Cell Biol. 1987;105:29–39. doi: 10.1083/jcb.105.1.29. [DOI] [PMC free article] [PubMed] [Google Scholar]
- Mooseker MS, Cheney RE. Unconventional myosins. Annu Rev Cell Dev Biol. 1995;11:633–765. doi: 10.1146/annurev.cb.11.110195.003221. [DOI] [PubMed] [Google Scholar]
- Morgan DG, Owen C, Melanson LA, DeRosier DJ. Structure of bacterial flagellar filaments at 11Å resolution: packing of the alpha helices. J Mol Biol. 1995;249:88–110. doi: 10.1006/jmbi.1995.0282. [DOI] [PubMed] [Google Scholar]
- Nishiye E, Somlyo AV, Török K, Somlyo AP. The effects of MgADP on cross-bridge kinetics: a laser flash photolysis study of guinea-pig smooth muscle. J Phyiol. 1993;460:247–271. doi: 10.1113/jphysiol.1993.sp019470. [DOI] [PMC free article] [PubMed] [Google Scholar]
- Pollard TD, Doberstein SK, Zot HG. Myosin-I. Annu Rev Physiol. 1991;53:653–681. doi: 10.1146/annurev.ph.53.030191.003253. [DOI] [PubMed] [Google Scholar]
- Rayment I, Rypniewski WR, Schmidt-Base K, Smith R, Tomchick DR, Benning MM, Winkelmann DA, Wesenberg G, Holden HM. Three-dimensional structure of myosin subfragment-1: a molecular motor. Science (Wash DC) 1993a;261:50–58. doi: 10.1126/science.8316857. [DOI] [PubMed] [Google Scholar]
- Rayment I, Holden HM, Whittaker M, Yohn CB, Lorenz M, Holmes KC, Milligan RA. Structure of the actin-myosin complex and its implications for muscle contraction. Science (Wash DC) 1993b;261:58–65. doi: 10.1126/science.8316858. [DOI] [PubMed] [Google Scholar]
- Rosenfeld SS, Taylor EW. The ATPase mechanism of skeletal and smooth muscle acto-subfragment-1. J Biol Chem. 1984;259:11908–11919. [PubMed] [Google Scholar]
- Siemankowski RF, Wiseman MO, White HD. ADP dissociation from actomyosin subfragment 1 is sufficiently slow to limit the unloaded shortening velocity in vertebrate muscle. Proc Natl Acad Sci USA. 1985;82:658–662. doi: 10.1073/pnas.82.3.658. [DOI] [PMC free article] [PubMed] [Google Scholar]
- Sleep JA, Hutton RL. Exchange between inorganic phosphate and adenosine 5′-triphosphate in the medium by actomyosin subfragment 1. Biochemistry. 1980;19:1276–1280. doi: 10.1021/bi00548a002. [DOI] [PubMed] [Google Scholar]
- Spudich JA, Watt S. The regulation of rabbit skeletal muscle contraction. J Biol Chem. 1971;246:4866–4871. [PubMed] [Google Scholar]
- Swanljung-Collins H, Collins JH. Phosphorylation of brush border myosin I by protein kinase C is regulated by Ca2+-stimulated binding of myosin I to phosphatidylserine concerted with calmodulin dissociation. J Biol Chem. 1992;267:3445–3454. [PubMed] [Google Scholar]
- Taylor EW. Kinetic studies on the association and dissociation of myosin subfragment 1 and actin. J Biol Chem. 1991;266:294–302. [PubMed] [Google Scholar]
- Titus MA. Myosins. Curr Opin Cell Biol. 1993;5:77–81. doi: 10.1016/s0955-0674(05)80011-0. [DOI] [PubMed] [Google Scholar]
- Trybus KM, Taylor EW. Transient kinetics of adenosine 5′-diphosphate and adenosine 5′-(β,γ-Imidotriphosphate) binding to subfragment 1 and actosubfragment 1. Biochemistry. 1982;21:1284–1294. doi: 10.1021/bi00535a028. [DOI] [PubMed] [Google Scholar]
- Vibert P, Cohen C. Domains, motions and regulation in the myosin head. J Muscle Res Cell Motil. 1988;9:296–305. doi: 10.1007/BF01773873. [DOI] [PubMed] [Google Scholar]
- White HD, Taylor EW. Energetics and mechanism of actomyosin ATPase. Biochemistry. 1976;15:5818–5826. doi: 10.1021/bi00671a020. [DOI] [PubMed] [Google Scholar]
- Whittaker M, Milligan RA. Conformational changes due to calcium-induced calmodulin dissociation in brush border myosin I-decorated F-actin revealed by cryoelectron microscopy and image analysis. J Mol Biol. 1997;269:548–557. doi: 10.1006/jmbi.1997.1058. [DOI] [PubMed] [Google Scholar]
- Whittaker M, Carragher BO, Milligan RA. PHOELIX: a package for semi-automated helical reconstruction. Ultramicroscopy. 1995a;58:245–259. doi: 10.1016/0304-3991(95)00057-8. [DOI] [PubMed] [Google Scholar]
- Whittaker M, Wilson-Kubalek EM, Smith JE, Faust L, Milligan RA, Sweeney HL. A 35Å movement of smooth muscle myosin on ADP release. Nature (Lond) 1995b;378:748–751. doi: 10.1038/378748a0. [DOI] [PubMed] [Google Scholar]
- Wolenski JS. Regulation of calmodulin-binding myosins. Trends Cell Biol. 1995;5:310–316. doi: 10.1016/s0962-8924(00)89053-4. [DOI] [PubMed] [Google Scholar]
- Wolenski JS, Hayden SM, Forscher P, Mooseker MS. Calcium-calmodulin and regulation of brush border myosin-I MgATPase and mechanochemistry. J Cell Biol. 1993;122:613–621. doi: 10.1083/jcb.122.3.613. [DOI] [PMC free article] [PubMed] [Google Scholar]
- Zot HG. Phospholipid membrane-associated brush border myosin-I activity. Cell Motil Cytoskeleton. 1995;30:26–37. doi: 10.1002/cm.970300105. [DOI] [PubMed] [Google Scholar]