Abstract
Abstract. We have studied the biosynthesis and transport of the endogenous caveolins in MDCK cells. We show that in addition to homooligomers of caveolin-1, heterooligomeric complexes of caveolin-1 and -2 are formed in the ER. The oligomers become larger, increasingly detergent insoluble, and phosphorylated on caveolin-2 during transport to the cell surface. In the TGN caveolin-1/-2 heterooligomers are sorted into basolateral vesicles, whereas larger caveolin-1 homooligomers are targeted to the apical side. Caveolin-1 is present on both the apical and basolateral plasma membrane, whereas caveolin-2 is enriched on the basolateral surface where caveolae are present. This suggests that caveolin-1 and -2 heterooligomers are involved in caveolar biogenesis in the basolateral plasma membrane. Anti–caveolin-1 antibodies inhibit the apical delivery of influenza virus hemagglutinin without affecting basolateral transport of vesicular stomatitis virus G protein. Thus, we suggest that caveolin-1 homooligomers play a role in apical transport.
Caveolin-1, a 21–24-kD membrane protein, was originally isolated from two different sources: from trans-Golgi network–derived exocytic vesicles (hence its other name VIP21, vesicular integral membrane protein of 21 kD) (Kurzchalia et al., 1992), and from plasma membrane invaginations called caveolae (Rothberg et al., 1992). Caveolae can be internalized from the surface and the protein might cycle between different cellular compartments (Parton et al., 1994; Schnitzer et al., 1994), however, its functions are poorly understood thus far. Caveolin-1 plays an important structural role in forming caveolar invaginations on the plasma membrane (Fra et al., 1995), but as yet there are no studies addressing its function in the TGN. Caveolin-1 has two isoforms, α- and β-derived from the use of two alternative transcription initiation sites, the latter starting with an internal methionine at position 32 (Scherer et al., 1995). It has an unusual topology, forming a membrane-embedded hairpin structure with both the amino and carboxyl termini in the cytoplasm (Dupree et al., 1993). Furthermore, it has been reported to form high molecular weight homooligomeric complexes (>104 kD) that resolve into 200-, 400-, and 600-kD oligomers when analyzed by SDS-PAGE without boiling (Monier et al., 1995; Sargiacomo et al., 1995). Caveolin-1 has also been shown to bind tightly to cholesterol (Murata et al., 1995; Li et al., 1996b ). The primary determinants of oligomerization are protein domains of caveolin-1, but cholesterol binding promotes oligomerization that is further stabilized by the attachment of palmitoyl chains to the carboxyl-terminal region (Monier et al., 1996). The oligomers isolated from tissues or cultured cells are insoluble in detergents, such as Triton X-100 or CHAPS at 4°C (Kurzchalia et al., 1992; Sargiacomo et al., 1993). Oligomers can also be produced from in vitro–synthesized caveolin-1 after translocation into microsomal membranes. However, these oligomers are Triton X-100 soluble (Monier et al., 1995).
Recently, a related protein having 38% sequence identity to caveolin-1 was isolated from caveolin-enriched membranes and termed caveolin-2 (Scherer et al., 1996). Caveolin-2 was coexpressed with caveolin-1 in all the tissues analyzed, being most abundant in adipocytes. The epitope-tagged and overexpressed caveolin-2 colocalized with caveolin-1 in fibroblasts, as judged by immunofluorescence microscopy. However, in contrast to caveolin-1, caveolin-2 was found to exist mainly as a monomer (Scherer et al., 1996).
MDCK epithelial cells are a well-characterized model system for studying polarized membrane trafficking, and are one of the sources from which caveolin-1 was first isolated (Kurzchalia et al., 1992). These cells can form polarized monolayers with distinct apical and basolateral surfaces. Sorting of proteins destined for the two plasma membrane domains takes place in the TGN where separate apical and basolateral vesicles form to deliver cargo to the correct destinations (Griffiths and Simons, 1986). In this paper we have analyzed the routing and biochemical characteristics of endogenous, newly synthesized caveolin-1 and -2 in MDCK cells. We provide evidence that the two caveolins can form homo- and heterooligomeric complexes in the ER, and that these complexes are modified during transport to the plasma membrane. We further demonstrate that large caveolin-1 complexes are present in apical transport vesicles. In contrast, smaller caveolin-1/-2 heterooligomers are routed to the basolateral membrane where caveolin-2 is enriched and caveolar structures are found. Apical but not basolateral exocytosis can be inhibited with caveolin-1 antibodies, suggesting that two different caveolin complexes function in TGN to surface transport.
Materials and Methods
Reagents
Unless otherwise stated, all chemicals were obtained from the sources described previously by Wandinger-Ness et al. (1990) and Ikonen et al. (1995). The polyclonal anti–caveolin-1 amino-terminal antibody has been characterized (Dupree et al., 1993) and the anti–caveolin-1 antibody designated N-20 was from Santa Cruz Biotechnology, Inc. (Santa Cruz, CA). To generate anti–caveolin-2 antibodies, polyclonal sera were raised against a synthetic peptide using the residues DFGDLEQLADSGSDR of canine caveolin-2. Sera for biochemical experiments were affinity purified using a GST-His6–caveolin-2 fusion protein (see Fig. 1; Peränen, 1992). For immunofluorescence microscopy, sera were affinity purified on a column prepared by coupling the fusion protein to CNBr-activated– Sepharose 4B or a protein A–Sepharose CL-4B column, according to the manufacturer's instructions (Pharmacia Biotech, Inc., Piscataway, NJ). Antibodies were eluted at low pH (0.2 M glycine, pH 2.8). Molecular mass standards used in gradient centrifugation were from Sigma Chemical Co. (St. Louis, MO). Detergents were the following: SDS (Bio-Rad Laboratories, Hercules, CA), Triton X-100 (Serva, Heidelberg, Germany), CHAPS (Sigma Chemical Co.), and N-octyl-3-d-glucopyranoside (Calbiochem-Novabiochem, La Jolla, CA). Methyl-β-cyclodextrin was from Sigma Chemical Co. and lovastatin was from Merck, Sharp, and Dohme (Haar, Germany).
Figure 1.
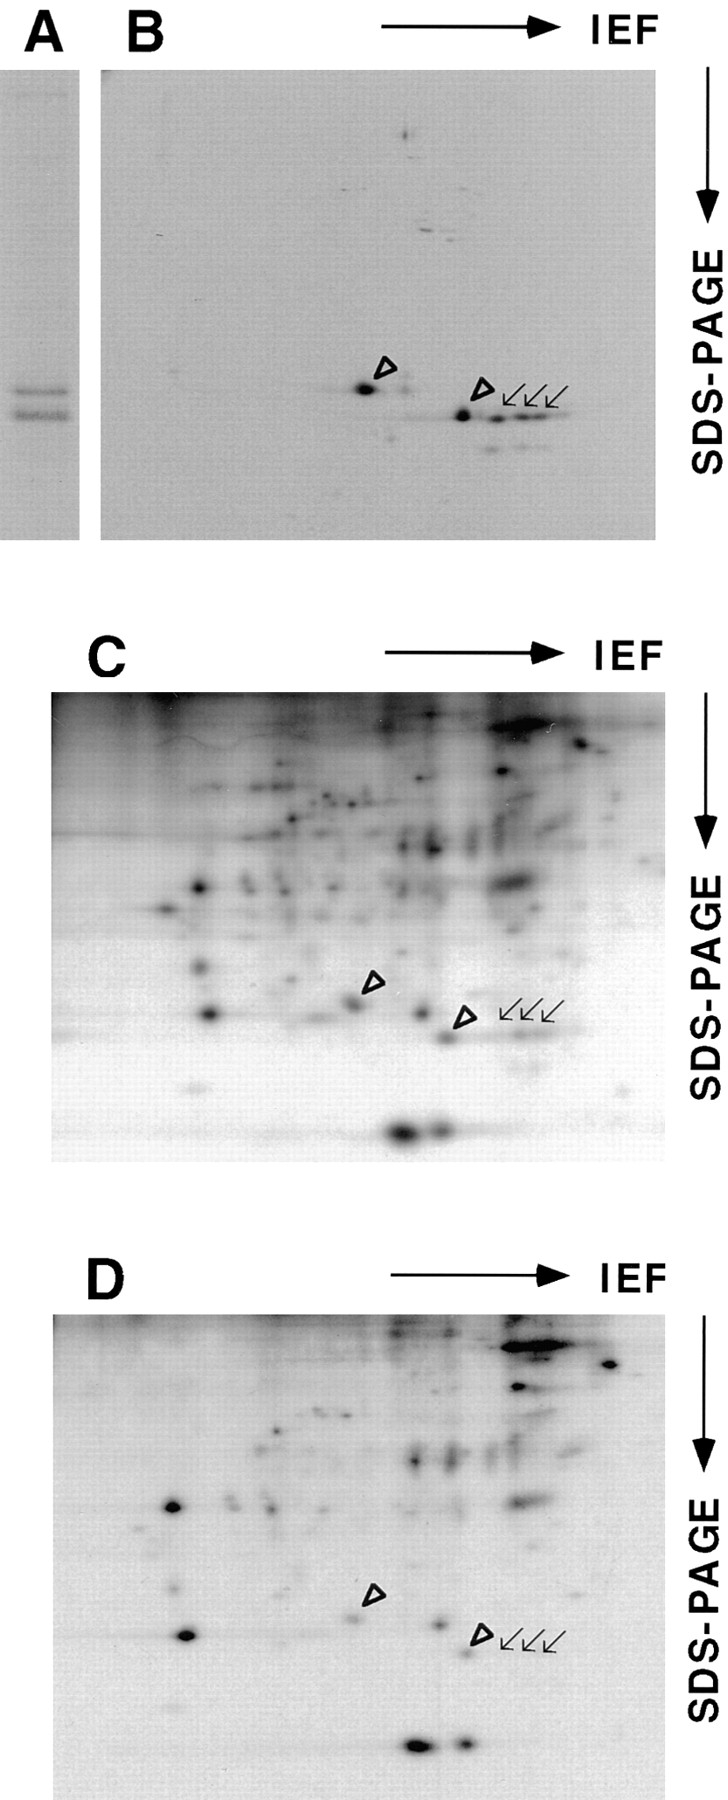
Caveolin-1 and -2 in MDCK cells. Anti–caveolin-1 immunoprecipitates were analyzed by 13% SDS-PAGE (A) and by 2D gel electrophoresis (B). For comparison, 2D gels of immunoisolated basolateral (C) and apical (D) vesicles are shown. α– and β–caveolin-1 are marked by arrowheads. Caveolin-2 is marked by arrows. Filter-grown MDCK cells metabolically labeled with [35S]methionine were lysed and then caveolin was immunoprecipitated using anti– caveolin-1 amino-terminal antibodies. The samples were boiled in alkaline sample buffer before electrophoresis.
Cell Culture
MDCK strain II cells were grown on 1.2- (Western blotting, microscopy, and transport assays), 2.4- (pulse-chase and metabolic labeling experiments), or 7.5-cm (immunoisolation of vesicles) Transwell filters (Costar, Cambridge, MA), as described previously (Pimplikar et al., 1994), plating 5 × 10⁴, 2 × 10⁵, or 2 × 10⁶ cells per filter, respectively. The filter cultures were maintained at 37°C and 5% CO2 for 3 or 4 d. MDCK strain II cells stably expressing vesicular stomatitis virus glycoprotein (VSV-G)1–tagged sialyltransferase were used in some experiments for release of TGN-derived vesicles.
Cloning of Canine Caveolin-2 cDNA
For purification of canine caveolin-2, a detergent-insoluble fraction was prepared from floated MDCK cell membranes and fractionated by affinity chromatography on hydroxylapatite as described (Shevchenko et al., 1997). Caveolin-2 was isolated by two-dimensional (2D) gel electrophoresis and then tryptic peptides from 50 Coomassie-stained spots were subjected to Edman degradation. Total RNA was purified from MDCK cells using the RNeasy kit (QUIAGEN, Inc., Santa Clarita, CA). Oligo-dT and random primed cDNA generated with M-MLV reverse transcriptase (Promega Corp., Madison, WI) was amplified by PCR with synthetic oligonucleotides designed according to the human cDNA sequence (5′-ATGGACGACGACTCCTACAGCCACCA-3′ and 5′-ACCATIARRCAIGTYTTIACRAANGGC-AT-3′) yielding a 334-bp fragment. With this fragment, 360,000 clones of a λZAPII MDCK cDNA library were screened. 12 independent positive phages were isolated containing inserts of 1.5–2.3 kbp. Sequencing of the inserts revealed that none of the obtained clones contained the full-length cDNA, therefore, 5′ RACE (GIBCO BRL, Gaithersburg, MD) was performed using synthetic oligonucleotides (5′-AACCCCTGCCGCGAAG-3′ and 5′-AAGGCCATGGGCATCGCCAGGAGCAAC-3′) for priming in reverse transcription and amplification, respectively. The obtained 5′ end was then fused to the rest of the coding sequence. The obtained full-length canine caveolin-2 sequence is available from GenBank/EMBL/DDBJ accession number AF039223. A stable MDCK II cell line was established overexpressing caveolin-2 with a carboxy-terminal myc epitope. The tag was introduced by PCR and the cDNA was inserted in the expression plasmid pcDNA3 (Invitrogen, Carlsbad, CA). The DNA was transfected using electroporation and stable clones were selected with 0.5 mg/ml G418 (GIBCO BRL). The myc-tagged caveolin-2 was found in SDS-resistant oligomers to a similar extent as the endogenous protein.
Labeling of Cells and Caveolin Immunoprecipitation
For pulse-chase experiments, cells were starved for 30 min at 37°C in methionine-free medium before labeling with [35S]methionine (500 μmCi/filter) for 7 min. The cells were then either transferred to ice-cold chase medium and lysed immediately, or chased at 20°C for 1 or 2 h or chased at 37°C for 1 or 2 h before lysis. A 2-h chase at 37°C gave results similar to a 1-h chase. In the cyclodextrin experiment (Scheiffele et al., 1997), cells were chased for 1 h at 37°C before adding 10 mM methyl-β-cyclodextrin, in chase medium containing 5 μM lovastatin and 50 mM Hepes, pH 7.4, to both sides of the filter and incubating with shaking for 1 h at 37°C. A metabolic labeling was carried out for 18 h with 100 μCi/filter [35S]methionine. The compositions of the labeling and chase media have been described previously (Wandinger-Ness et al., 1990).
For immunoprecipitation, cells were solubilized on ice in 20 mM Tris-HCl, pH 7.4, 100 mM NaCl, 0.4% SDS, 0.2% Triton X-100 in the presence of protease inhibitors (chymostatin, leupeptin, antipain, and pepstatin at 25 μg/ml each) and phosphatase inhibitors (200 μM sodium vanadate, 50 mM sodium fluoride). Lysates were incubated overnight at 4°C with the respective antibody and recovered with protein A–Sepharose (Pharmacia Biotech, Inc.). The immunoprecipitates were washed five times with 20 mM Tris-HCl, pH 7.4, 100 mM NaCl, 0.1% SDS, 0.5% Triton X-100, and phosphatase inhibitors (see above) and twice with 50 mM Tris-HCl, pH 7.5, before separation by SDS-PAGE.
For [32P], confluent MDCK cells from one 2.4-cm well of a six-well plate were washed twice with phosphate-free DME containing 0.1% FCS dialyzed against 20 mM Tris-HCl, pH 7.6, 137 mM NaCl (TBS).
After incubating for 50 min in this medium the cells were labeled for 3 h at 37°C with 500 μCi of γ[32P]ATP in 1 ml of the same medium. Cells were lysed in 100 mM NaCl, 10 mM Tris-HCl, pH 7.4, 1% Triton X-100, protease inhibitors, 2 mM sodium vanadate, and 50 mM sodium fluoride by incubating for 20 min at 37°C with intermittent vortexing. After spinning at 3,000 rpm in a microfuge (Eppendorf, Hamburg, Germany), the insoluble debris was discarded, the lysates precleared with protein A–Sepharose overnight at 4°C, and then precipitated with the anti–caveolin-1 antibody as described above. [35S]methionine carried out overnight in an identical well, and other treatments performed in parallel with the [32P] sample gave results similar to the steady-state [35S]methionine and immunoprecipitation on filter-grown cells as described above. [32P] and [35S]methionine was also carried out in 3T3 L1 preadipocytes, yielding results similar to MDCK cells.
SDS-PAGE, 2D Gel Electrophoresis, and Western Blotting
Immunoprecipitates were solubilized either in standard SDS-PAGE sample buffer or in alkaline buffer (Monier et al., 1995). The samples were incubated for 30 min at 25°C or heated to 95°C for 5 min as detailed in the figure legends. When the samples were not heated, 200-, 400-, and 600-kD oligomers could be visualized by SDS-PAGE. The proteins were resolved either on 13% linear or 3–17% gradient polyacrylamide gels. To dissociate the oligomers for 2D gel electrophoresis, immunoprecipitates were heated at 95°C for 10 min in alkaline sample buffer (in the presence of 1 mM vanadate), precipitated with chloroform/methanol, and then incubated at 37°C for 30 min in the isoelectric focusing sample buffer (Bravo, 1984). Proteins were resolved as detailed by Wandinger-Ness et al. (1990) in two dimensions by IEF and SDS-PAGE based on the method of Bravo (1984).
For Western blotting, MDCK cells were lysed in the same buffer as for immunoprecipitations, incubated for 30 min at 25°C, and then proteins were separated on polyacrylamide gels. Proteins were transferred to a nitrocellulose membrane in 25 mM Tris-HCl, 190 mM glycine, and 20% methanol and after blocking and incubation with the respective antibodies detected with enhanced chemiluminescence (Amersham Corp.).
Isolation of Budded Vesicles from Semiintact Cells
A budded fraction was prepared essentially as described by Xu and Shields (1993) using a hypotonic swelling procedure to selectively disrupt the plasma membrane (Beckers et al., 1987). Briefly, confluent MDCK cells (passages 6–25) on 10-cm dishes infected with influenza virus (PR8) or VSV were pulse labeled with [35S]methionine 3 h after infection and then the radiolabeled glycoproteins were accumulated in the TGN by a 20°C temperature block for 2 h. After washing the cells three times with ice-cold swelling buffer (10 mM Hepes [pH 7.2], 15 mM KCl) and incubation for 10 min on ice, cells were scraped in 3 ml of breaking buffer (50 mM Hepes [pH 7.2], 90 mM KCl), pelleted at 800 g, and then washed once with breaking buffer. Cells were resuspended in GGA buffer (25 mM Hepes, [pH 7.4], 38 mM potassium gluconate, 38 mM potassium glutamate, 38 mM potassium aspartate, 2.5 mM MgCl2, 0.5 mM CaCl2, 1 mM DTT, and protease inhibitors) and complemented with ATP regenerating system, 0.1 mM GTP, 1 mg/ml rat liver cytosol. After incubation for 45 min at 37°C, cells were pelleted in a microfuge at 6,000 g and the budded fraction was either analyzed directly by Western blotting or fluorography, or the sample was adjusted to 30% Optiprep (Nycomed Pharma, Oslo, Norway), overlayered with 25% Optiprep, 5% Optiprep, all in 10 mM Hepes (pH 7.4), 140 mM KCl, 2 mM EGTA, 1 mM DTT. The samples were centrifuged for 3 h at 55,000 rpm in a TLS55 rotor (Beckman, Munich, Germany) and then the vesicular fraction recovered from the 25%/5% interphase was analyzed by Western blotting, fluorography, or electron microscopy.
To determine release of the trans-Golgi marker sialyltransferase from cells, a cell line expressing VSV-G–tagged human sialyltransferase was established and protein was detected by blotting with the monoclonal antibody P5D4 (Kreis, 1986) or immunoprecipitation.
Immunoisolation of Apical and Basolateral Vesicles
Immunoisolation of apical and basolateral vesicles from perforated MDCK cells was carried out as detailed by Wandinger-Ness et al. (1990). Briefly, filter-grown MDCK cells were labeled overnight with [35S]methionine, infected with either influenza virus or VSV, and viral proteins were accumulated in the TGN by a 20°C block. The cells were perforated and membranes released during a 37°C incubation and then were floated on a sucrose gradient. Apical and basolateral vesicles were immunoisolated on cellulose fibers from the floated membrane fraction using antibodies directed against influenza virus hemagglutinin (HA) and VSV-G, respectively. Proteins were recovered from the fibers in 0.4% SDS, 0.2% Triton X-100 in TNE, and then loaded on a 5–30% sucrose gradient (see below). Caveolin complexes were immunoprecipitated from the fractions with anti–caveolin-1 antibodies and the radioactivity recovered in each fraction was counted in a liquid scintillation counter (Wallac 1410; Pharmacia Biotech, Uppsala, Sweden).
Sucrose Gradient Centrifugation
Cell lysates or immunoisolated vesicles (300 μl) in 0.4% SDS, 0.2% Triton X-100, and protease inhibitors (see above) were loaded onto a linear 5–30% sucrose gradient in 20 mM Tris-HCl, pH 7.4, 100 mM NaCl, 0.4% SDS, 0.2% Triton X-100. After centrifugation in a SW60 rotor (Beckman) for 16 h at 45,000 rpm, 500 μl fractions were collected from the top. For Western blot analysis, proteins were TCA precipitated or immunoprecipitated with anti–caveolin-1 antibodies in the case of labeled samples. Proteins were resolved on gradient polyacrylamide gels.
CHAPS Extraction
After pulse-chase labeling, the cells were scraped on ice in 500 μl of 20 mM CHAPS in 50 mM Tris-HCl, pH 7.0, 100 mM NaCl, 1 mM EDTA (TNE) in the presence of protease and phosphatase inhibitors (see above). After resuspension 10 times with a 1-ml pipet tip, they were incubated on ice for 30 min, and CHAPS-insoluble material was pelleted by centrifugation in a TLA45 rotor (Beckman) for 30 min at 45,000 rpm and 4°C. The supernatant was collected and the pellet resuspended in CHAPS extraction buffer. 4 vol of 20 mM Tris-HCl, pH 7.4, 100 mM NaCl, 0.5% SDS, and protease and phosphatase inhibitors (see above) were added and caveolin complexes immunoprecipitated.
In Vitro Transport Assays
The transport of VSV-G and HA in streptolysin O (SLO)-permeabilized MDCK cells was carried out exactly as described previously (Pimplikar et al., 1994; Ikonen et al., 1995; for review see Lafont et al., 1995). Briefly, to measure TGN-to-surface transport, filter-grown MDCK cells were infected with VSV or influenza virus, viral proteins were pulse labeled with [35S]methionine, and then chased to the TGN using a 20°C incubation. The apical or basolateral cell surface was then permeabilized with SLO, the endogenous cytosol was depleted, and transport to the intact surface reconstituted. The amount of viral proteins reaching the surface was measured by trypsinization (HA) or surface immunoprecipitation (VSV-G). To measure transport from the ER, the 20°C-chase was omitted and SLO permeabilization was carried out immediately after pulse labeling. The amount of viral proteins reaching the Golgi complex was determined by endoglycosidase H digestion. The anti–caveolin-1 amino-terminal antibody N-20 was used at a final concentration of 10 μg/ml. Before raising the temperature to 37°C to initiate transport, the cells were incubated for 30 min at 4°C with cytosol ± antibody and an ATP regenerating system. Quantitation of viral polypeptides resolved by SDS-PAGE was done with a Phosphor Imager (Molecular Dynamics, Sunnyvale, CA). Transport without added cytosol was defined as 0% and transport in the presence of cytosol as 100%, being 2.5–4.5-fold higher than without cytosol. The values obtained in the presence of antibodies were expressed as a percentage of those given without antibody addition. All transport assays were performed in triplicate and each condition was tested at least twice.
Immunofluorescence Microscopy
Filter-grown, confluent MDCK cells were rinsed once in PBS and then fixed for 10 min in 4% paraformaldehyde/PBS. The filters were rinsed briefly in PBS, cut from the holder, and then incubated for 30 min in 200 mM glycine/PBS. They then were incubated for 10 min in 0.1% Triton X-100/PBS and nonspecific antibody binding was blocked by incubating for 10 min in PBS containing 0.2% cold-water fish skin gelatin (PBS-G). The filter pieces were incubated for 2 h with either affinity-purified rabbit anti–caveolin-1 antibodies (N20) diluted 1:25 or rabbit anti–caveolin-2 antibodies diluted 1:10 in PBS-G. After extensive rinsing (more than six times at 5-min each) the filterpieces were incubated for 1 h at 37°C with fluorescein thiocyanate coupled anti-rabbit antibodies in PBS G. After extensive rinsing in PBS, the filter pieces were embedded in 50% glycerol, 100 μg/ml 1,4-diazobi-cyclo(2,2,2)-octane in PBS, and then examined under a confocal scanning light microscope (LSM410; Carl Zeiss, Inc., Thornwood, NY).
Immunoelectron Microscopy
Filter-grown confluent MDCK cell were rinsed once in PBS and fixed for 10 min in 4% paraformaldehyde/PBS. Triangular filter pieces in PBS were progressively infiltrated with gelatin at 37°C to a final concentration of 10%. They were put on ice and infiltrated with 2.1 M sucrose. The filter pieces were put on top of a cryosectioning stub and frozen in liquid nitrogen. Ultrathin cryosections were collected on grids and incubated face-down in PBS for 30 min at 37°C to dissolve the gelatin. The grids were transferred for 30 min to 10% FCS in PBS and then incubated for 1 h with affinity-purified rabbit anti–caveolin-1 antibodies (N20) diluted 1:20 or rabbit anti–caveolin-2 antibodies diluted 1:10 in 5% FCS in PBS. The grids were rinsed in PBS and incubated for 20 min with protein A–coupled 10-nm gold particles in 5% FCS in PBS. The grids were rinsed extensively with PBS and tridistilled water and then incubated for 10 min with 0.3% uranyl acetate, 1.8% methylcellulose in tridistilled water on ice. Excess fluid was removed and then the grids were air-dried. Sections were examined under a Zeiss EM1OC transmission electron microscope.
For immunolabeling of isolated vesicles, small droplets (1–2 μl) of the vesicle preparation were put on top of formvar and carbon-coated copper grids for 5 min. They were then fixed on top of a drop of 4% paraformaldehyde (PFA) in PBS for 5 min. After blocking with 200 mM glycine in PBS for 10 min and a 5-min wash in PBS containing 0.5% BSA and 0.2% cold-water fish skin gelatin (PBG), the grids were incubated for 15 h with the first primary antibody in PBG at 4°C. After a 3–5-min rinse in PBG, the grids were incubated with protein A–coupled 15-nm gold particles in PBG for 1 h and then rinsed in PBS. In a second (5 h at room temperature) and third (15 h at 4°C) round of immunoincubation, the sequence of labeling was repeated from the fixation to the washing in PBS. In the second and third round, protein A coupled to 10- and 5-nm gold particles were used, respectively. After the third round of labeling, the grids were rinsed in tridistilled water and then incubated for 5 min on ice in 0.3% uranyl acetate, 1.8% methylcellulose in tridistilled water. The excess fluid was removed and the grids were air-dried. Controls included the omission (of combinations) of primary antibodies after which the accompanying gold particles were not detected. For quantitations, routinely gold particles on 40 individual vesicles were counted. Vesicles were considered positive for the viral marker proteins when they contained at least two particles. In individual experiments similar results were obtained independently, in which the order of the antigens was labeled with the antibodies.
Results
A New Protein Coprecipitates with Caveolin-1 Antibodies
Antibodies raised against the first 20 amino-terminal amino acids of caveolin-1 recognize a single band of ∼24-kD by Western blotting, corresponding to the α isoform of caveolin-1 (Dupree et al., 1993). However, these antibodies immunoprecipitate proteins that are resolved as two bands of ∼21- and 24-kD, respectively, in SDS-PAGE (Dupree et al., 1993, Fig. 1 A). So far, these bands have been thought to represent α– and β–caveolin-1 (Monier et al., 1995). Surprisingly, when the immunoprecipitates were analyzed on a 2D gel, other spots in addition to the ones known to correspond to α– and β–caveolin-1 were revealed. By far, most abundant was a cluster of spots that corresponded in size to β–caveolin-1 but had a more acidic isoelectric point (Fig. 1 B). When comparing this pattern to the 2D gel maps of immunoisolated apical and basolateral transport vesicles, we found that this elongated pattern corresponded exactly to a protein heavily enriched in basolateral transport vesicles that was designated B12 (Fig. 1, C and D; Wandinger-Ness et al., 1990).
Cloning of Canine Caveolin-2 cDNA
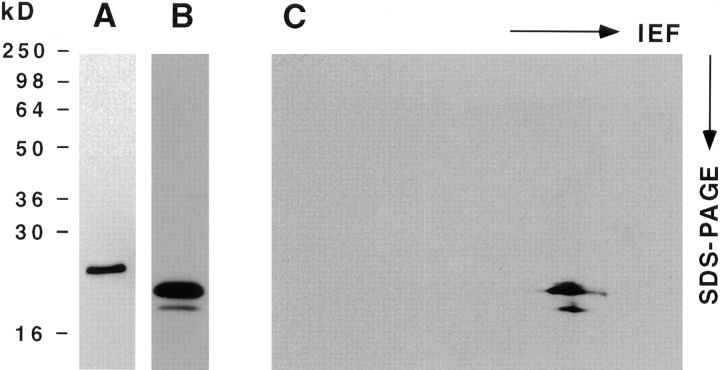
To identify this protein potentially associating with caveolin-1, a detergent-insoluble fraction of floated MDCK cell membranes was prepared, separated by affinity chromatography on hydroxylapatite as described (Shevchenko et al., 1997), and the protein was isolated from 2D gels for microsequencing. The obtained peptide sequences (X-S-A-V-D-F-G-X-L-E-Q and X-F-S-S-V-X-L-Q/L-V, see Fig. 2 D) suggested that the protein was caveolin-2. A partial canine caveolin-2 cDNA was then amplified using degenerate oligonucleotides derived from the human caveolin-2 cDNA sequence (Scherer et al., 1996) and used to screen a λZAPII MDCK cDNA library. 5′-RACE revealed that the ATG corresponding to the published initiator methionine in the highly homologous human caveolin-2 was preceded by an in-frame methionine, 13 amino acids further upstream (Fig. 2 D). The sequences flanking this ATG conform better to the Kozak consensus than those around the downstream ATG, suggesting that it may be used as the preferential initiator site. Moreover, database searches revealed a human expressed sequence tag (THC180343; GenBank/EMBL/DDBJ accession number AA367026) that also carries the upstream start codon. As the amino-terminal part was most divergent between caveolin-1 and -2, we used a peptide containing amino acids 26–40 as an immunogen to raise canine caveolin-2–specific antibodies (Fig. 2 D). In Western blotting this antibody was found to recognize two proteins of 19- and 21-kD, both distinct from α–caveolin-1 (Fig. 2, A and B). On 2D gels, the elongated group of spots representing B12 was detected (Fig. 2 C). In addition, the caveolin-2 antibodies cross-reacted with a cluster of spots of similar shape but of smaller size (∼19 kD, Fig. 2 C). These were found to correspond to minor spots beneath the original band cut for microsequencing (refer to Fig. 1 B). Based on the sequence information, it is likely to represent the product of a transcript using methionine 14 as an alternative, less favored site for initiation. Clearly, the anti–caveolin-2 antibodies were specific for these two rows of spots and did not cross-react with α– and β–caveolin-1.
Figure 2.
Specificity of the anti–caveolin-2 antibody. A MDCK cell lysate separated by SDS-PAGE (A and B) or by 2D gel electrophoresis C was analyzed by Western blotting. Blots were probed with anti–caveolin-1 amino-terminal antibodies (A) or with anti–caveolin-2 antibodies (B and C). The two spots identified in C correspond to two clusters of spots detected in the 2D gel of [35S]methionine and immunoprecipitated samples (refer to Fig. 1). The larger cluster has the same molecular weight as the spot cut for microsequencing. The 5′ cDNA sequence of canine caveolin-2 and the encoded amino acids are aligned with the human expressed sequence tag containing the upstream ATG codon (D). The sequence of a tryptic peptide is underlined. The peptide used to raise anti–caveolin-2 specific antibodies is indicated by a box.
Caveolin-2 Is Present in a Large Oligomeric Complex
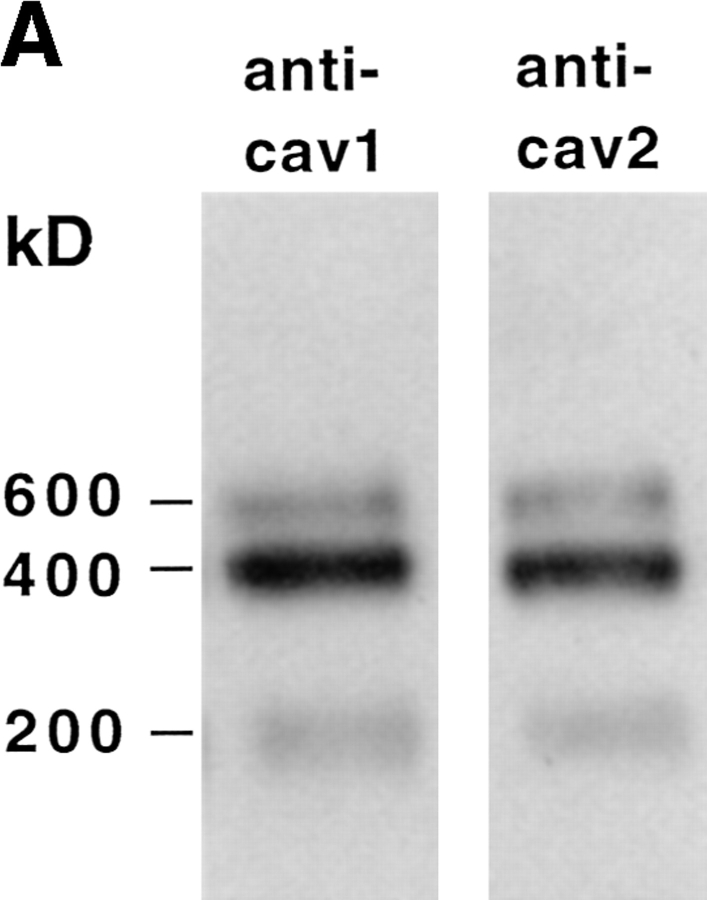
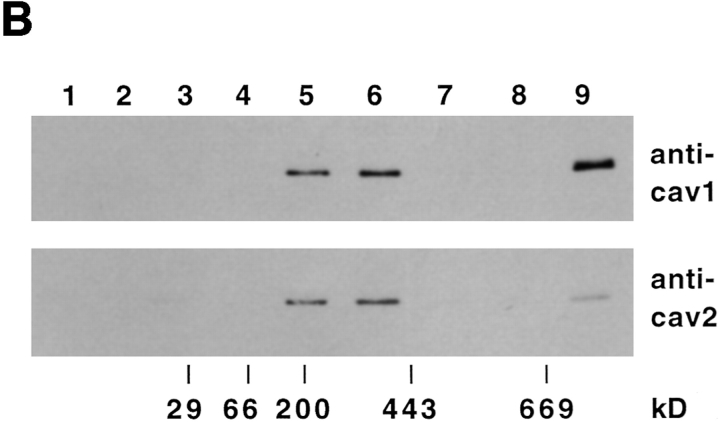
Based on their sequence similarity, caveolin-2, like caveolin-1, would be predicted to form high molecular weight complexes. Unexpectedly, the epitope-tagged overexpressed human caveolin-2 was found to exist preferentially as a monomer (Scherer et al., 1996). To find out if endogenous canine caveolin-2 is present in stable oligomers, we applied the same technique as used previously for human caveolin-1 (Monier et al., 1995), taking advantage of the stability of the oligomers in SDS and 2-mercaptoethanol. The high molecular weight proteins in the MDCK cell lysate were separated by SDS-PAGE and then analyzed by Western blotting using caveolin-1 and -2–specific antibodies. Fig. 3 A shows that both caveolins resolved into 200-, 400-, and 600-kD complexes. To further characterize the oligomers, we developed a fractionation technique that separated the complexes into several size classes. This was based on sedimentation velocity centrifugation in a sucrose gradient in the presence of SDS and Triton X-100 (refer to Materials and Methods). When a MDCK cell lysate was analyzed by this method and the caveolins visualized by immunoblotting with both anti–caveolin-1 and -2, we found that some of the oligomers migrated to the middle of the gradient (corresponding to ∼200–400-kD), whereas others sedimented as very large complexes (>600 kD) (Fig. 3 B). All complexes contained both caveolin-1 and -2. However, the large complexes contained significantly less caveolin-2 than the 200–400-kD oligomers. The vast majority of the other cellular proteins were detected in the first four fractions of the gradient (data not shown).
Figure 3.
Caveolin-2 forms high molecular weight complexes. Western blotting using anti–caveolin-1 antibody N-20 or anti– caveolin-2 antibodies was performed after separating MDCK cell lysate on SDS-PAGE without boiling (A). Alternatively, the cell lysate was first fractionated by sedimentation velocity in a 5–30% sucrose gradient, and TCA proteins precipitated from the fractions were separated by 13% SDS-PAGE after boiling in alkaline sample buffer (B). The migration of molecular mass standards in the gradient is indicated.
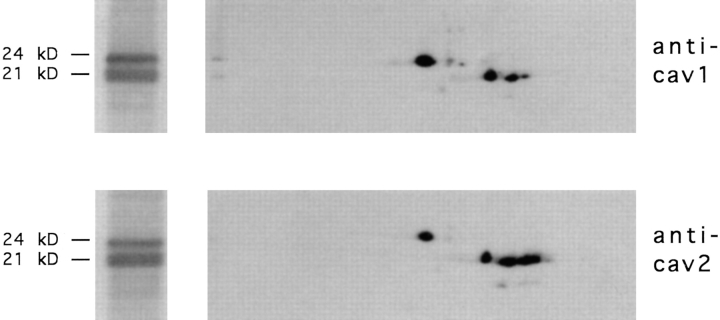
To estimate the stoichiometry of caveolin-1 and -2 in the caveolin complexes, the immunoprecipitations were performed after an overnight metabolic labeling (Fig. 4). The precipitated proteins were analyzed by 2D gelelectrophoresis and then the intensities of the 2D gel spots were quantitated by Phosphor Imager analysis (as caveolins-1 and -2 contain five or six methionine residues, respectively, incorporated radioactivity should represent approximately equivalent amounts of each protein). In the case of anti–caveolin-1 antibodies, the ratio was about 2:2:1 for α–caveolin-1/β–caveolin-1/caveolin-2 (summing the major 21- and minor 19-kD spots of caveolin-2) (Fig. 4, top). On the other hand, anti–caveolin-2 antibodies precipitated the proteins in the ratios of about 1:1:1 (one molecule of α– and one of β–caveolin for every caveolin-2 molecule) (Fig. 4, bottom). These findings demonstrate that there is about two times more caveolin-1 than -2 in the complexes at steady state. This could result from two different complexes, one type containing only caveolin-1 and another containing both caveolins.
Figure 4.
Composition of the caveolin oligomeric complex at steady state. MDCK cells were labeled overnight with [35S]methionine, proteins were immunoprecipitated with caveolin-1 (top) or -2 antibodies (bottom), and then analyzed by 1- (left) or 2D gel electrophoresis (right) after boiling in alkaline sample buffer. The anode is to the right. For quantification of the relative amounts of caveolin-1 and -2, gels were scanned by a Phosphor Imager.
Modification of the Caveolin Complexes during Biosynthetic Transport
Our data suggest that caveolin-1 and -2 form oligomeric complexes in MDCK cells. To follow the formation and intracellular transport of these complexes, we decided to analyze the properties of the newly synthesized caveolins in a pulse-chase protocol using anti–caveolin-1 antibodies. As shown above, this protocol also brings down caveolin-2. The proteins were labeled with a 7-min pulse of [35S]methionine and (a) directly cooled on ice and processed for analysis, (b) chased for 1 or 2 h at 20°C, or (c) chased for 1 or 2 h at 37°C before analysis. The 20°C samples represent the complexes present in the Golgi complex after the 20°C chase. The bulk of the pulse-labeled caveolins were localized in a density gradient fraction containing the trans-Golgi marker sialyltransferase (data not shown).
Protein Composition of the Complexes.
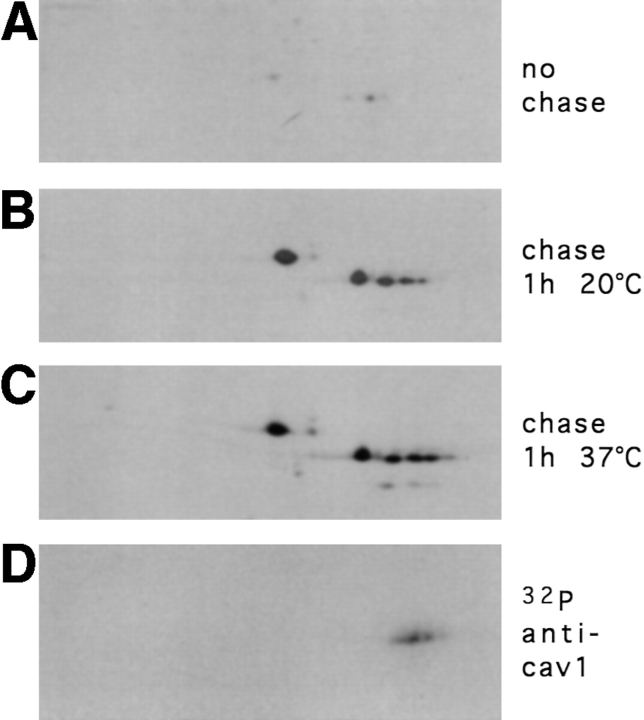
The results shown in Fig. 5 suggest that a heterooligomeric complex is formed already in the ER, as both anti–caveolin-1 (Fig. 5, A–C) and -2 antibodies (data not shown) brought down both of the proteins in all conditions tested. The relative proportions of the two proteins did not seem to change significantly during biosynthetic transport, except for slightly more caveolin-2 being precipitated without chase (in the ER) than in the other conditions (compare Fig. 5 A to B and C).
Figure 5.
Analysis of the caveolin complex by 2D gel electrophoresis during biosynthetic transport. MDCK cells were pulse labeled with [35S]methionine for 7 min and either lysed immediately (A), chased for 1 h at 20°C (B) or chased for 1 h at 37°C (C) before lysis. Alternatively, cells were labeled for 3 h with [32P]ATP (D). The caveolin complex was immunoprecipitated by anti–caveolin-1 antibodies and then analyzed on 2D gels.
This data also demonstrates that the efficiency of immunoprecipitation is low in the ER (∼10%, assuming that a constant amount of protein is present throughout the pulse-chase protocol), whereas the antibody brings down the proteins quantitatively at steady state. This was also evident in a previous report (Monier et al., 1995), and could be because of conformational changes in the epitope or more efficient precipitation of higher oligomers versus monomers or dimers (see below).
Size of the Complexes.
To monitor changes of the complex sizes, pulse-labeled proteins were subjected to fractionation in the SDS–Triton X-100 sucrose gradient followed by immunoprecipitation with anti–caveolin-1 antibodies. The newly synthesized caveolins were monomeric (Fig. 6 A, fractions 2 and 3), but a sizeable fraction had already oligomerized forming a SDS–Triton X-100 stable complex of ∼200 kD (Fig. 6 A, fractions 5 and 6). Taking into account the inefficient precipitation of the monomers in the ER, a cautious quantitative assessment would be that in the ER at least ten times more of the protein exists as a monomer than as oligomer. Nevertheless, oligomerization obviously starts early in the biosynthetic route. When the proteins were chased for 1 h at 20°C, i.e., when most of the newly synthesized proteins resided in the Golgi apparatus, the caveolin complex increased in size, peaking at ∼400-kD with some already extending to the 600-kD range (Fig. 6 B). When performed at 37°C, most of the protein was chased to the cell surface; the caveolin oligomers matured further to higher molecular weight complexes, reaching the size range of the very large structures detected at steady state (Fig. 6 C). It is noteworthy that the choice of detergent in the gradient is critical to observe the size changes. N-octyl-3-d-glucopyranoside (octylglucoside) has previously been used in comparable size fractionation schemes and reported to detect oligomers between 200– 400-kD, irrespective of the conditions (Li et al., 1996b ; Monier et al., 1996). In our experience, when SDS and Triton X-100 were replaced with octylglucoside, a similarly sized 200–400-kD oligomer was detected either in the ER or on the plasma membrane (data not shown). Therefore, the observed complex sizes do not necessarily reflect the molecular weight of the oligomers in vivo; however, they clearly demonstrate changes in size and nature of the complexes during biosynthetic transport. The maturation is likely to be achieved not only by protein–protein interactions, but might also be influenced by the lipid environment. This could explain why the choice of detergent and its capability to dissociate or preserve such protein–lipid complexes is critically influencing the resolved complex sizes.
Figure 6.
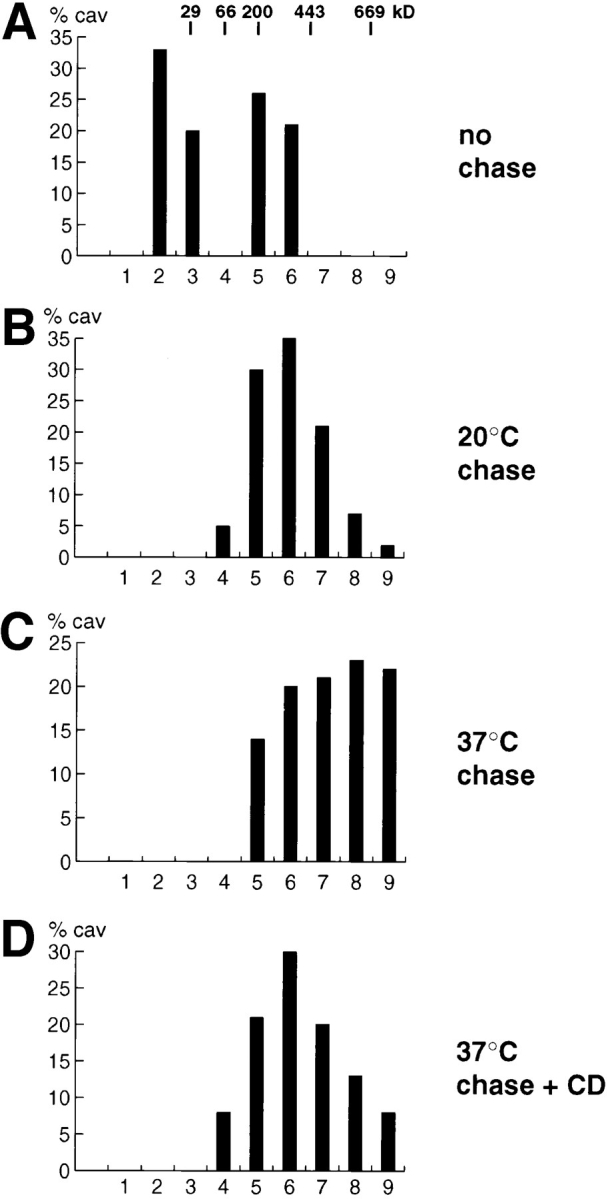
Size of the caveolin oligomeric complexes during biosynthetic transport and after cyclodextrin treatment. Filter-grown MDCK cells were pulse labeled for 7 min with [35S]methionine and then chased as indicated in A, B, and C. When cyclodextrin was added (+ CD), MDCK cells, pulsed for 7 min with [35S]methionine and chased for 1 h at 37°C, were treated for an additional 1 h at 37°C in the presence of 10 mM methyl-β-cyclodextrin as detailed in Materials and Methods. The lysates were fractionated by sedimentation velocity gradient centrifugation in 5–30% sucrose and caveolin immunoprecipitated from the fractions using anti– caveolin-1 amino-terminal antibodies. The intensities of the bands resolved by SDS-PAGE (containing caveolin-1 and -2) were scanned by a Phosphor Imager. The percentage of caveolin in each fraction is presented as bars.
Cholesterol has been demonstrated to promote homooligomerization in microsomes (Monier et al., 1996) and could regulate the oligomer size in vivo. The membrane cholesterol level is low in the ER and increases along the exocytic route towards the plasma membrane. We chased the pulse-labeled proteins to the cell surface (1 h at 37°C) and then incubated the cells with methyl-β-cyclodextrin to extract plasma membrane cholesterol. Indeed, this treatment (causing the removal of ⩾50% of cellular cholesterol; Rietveld, A.G., and K. Simons, personal communication) resulted in a decrease in size of the caveolin oligomers from the one typical for the plasma membrane to a size corresponding to the Golgi form (Fig. 6 D). It is important to note that under these conditions, the intracellular localization of caveolin-1 is not significantly changed as judged by immunofluoresence analysis (data not shown).
Phosphorylation of the Complexes.
One striking observation from the 2D gel analysis of the caveolin complexes is that the number of spots corresponding to caveolin-2 increases during transport to the cell surface, with one extra, more acidic spot in the Golgi complex (Fig. 5 B) and two after 1 h at 37°C (delivery to the cell surface) (Fig. 5 C). Furthermore, this modification is extensive at steady state, producing up to four adjacent spots of the longer and three of the shorter form of caveolin-2 (Fig. 4). We assumed that these modifications causing an increase in negative charge without changing the apparent molecular weight could be phosphorylations, and therefore, we performed metabolic labelings with [32P]ATP in parallel with [35S]methionine. After [32P] and immunoprecipitation with anti–caveolin-1, antibodies samples were separated on 2D gels. This analysis showed that in steady-state conditions, caveolin-2 is indeed heavily phosphorylated, whereas caveolin-1 is not (Fig. 5 D).
Detergent Solubility.
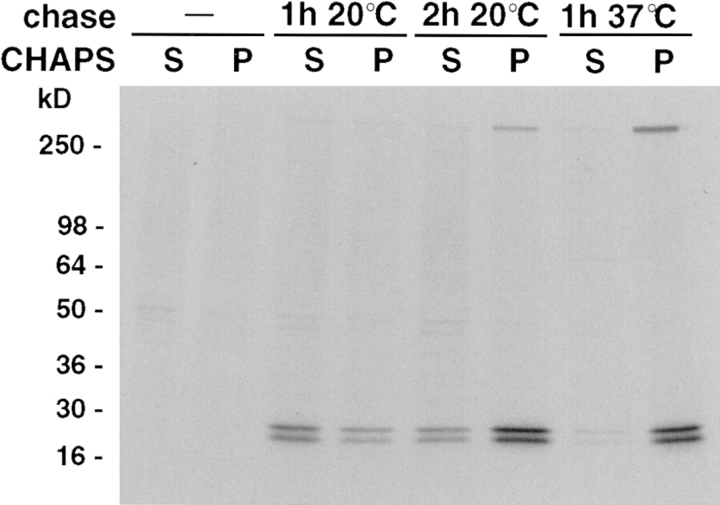
Caveolin-1 is known to be insoluble in the detergents Triton X-100 and CHAPS at 4°C, both in TGN-derived transport vesicles and in plasma membrane caveolae, whereas it is soluble when inserted into microsomes in vitro (Kurzchalia et al., 1992; Melkonian et al., 1995; Monier et al., 1995). To find out when this change occurs during biosynthetic transport, we analyzed the solubility of the caveolin complexes during a pulse-chase experiment. The oligomer was found to be entirely soluble immediately after the pulse labeling, and two-thirds of it still remained soluble after a 1-h chase at 20°C (Fig. 7). When the chase at 20°C was extended to 2 h, three-fourths of the complex had become CHAPS insoluble. If the protein was allowed to proceed along the biosynthetic route at 37°C, a 1-h chase was sufficient to convert it to a form resisting CHAPS solubilization as efficiently as the protein did at steady state (⩾90% being CHAPS insoluble). Similar changes in the detergent solubility of the caveolin complex were observed when Triton X-100 was used at 4°C instead of CHAPS (data not shown). These data suggest that only after reaching the Golgi complex do caveolins become increasingly resistant to detergent extraction.
Figure 7.
Detergent solubility of the caveolin complexes during biosynthetic transport. MDCK cells were pulsed for 7 min with [35S]methionine and then chased. Cells were lysed in 20 mM CHAPS in TNE and the caveolin complex was immunoprecipitated from the supernatant (S) and the pellet (P) and then analyzed by 3–17% SDS-PAGE after boiling. Note that the complex is precipitated increasingly efficiently during the chase. The autoradiograph had to be exposed longer to detect pulse-labeled caveolin in the ER (no chase, data not shown).
Different Caveolin Complexes Exist in Apical and Basolateral Vesicles
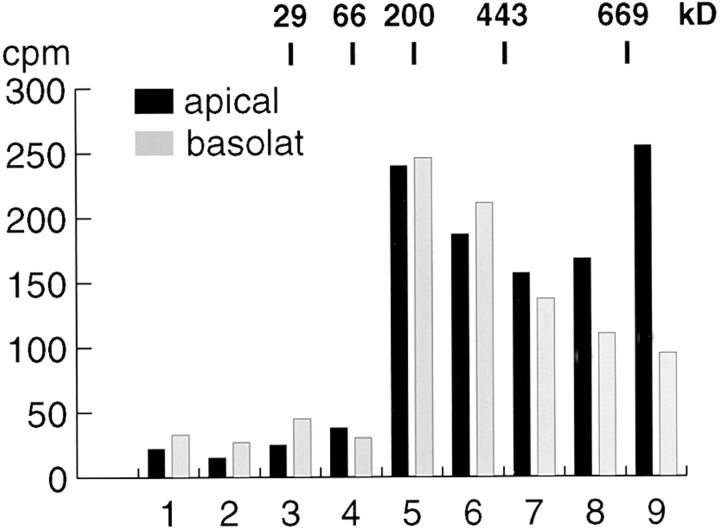
The selective recovery of caveolin-2 in immunoisolated basolateral carriers (Fig. 1) suggests that the caveolin complexes exiting the TGN along the apical and the basolateral routes may have different compositions. We fractionated metabolically labeled apical and basolateral vesicles after immunoisolation by SDS–Triton X-100 sucrose gradient centrifugation and determined the anti–caveolin-1 precipitable radioactivity in each fraction. Most of the caveolin oligomers in the basolateral vesicles were found in the middle fractions, reflecting the size range seen after the 20°C block whereas the apical vesicles, which are enriched in caveolin-1 (Fig. 1), had a significant proportion of oligomers migrating to the bottom of the gradient (Fig. 8). Thus, the caveolin complexes incorporated into the apical carriers are larger than those in the basolateral ones, as judged by sedimentation velocity centrifugation.
Figure 8.
Size of the caveolin complexes in immunoisolated apical and basolateral transport vesicles. Apical and basolateral vesicles were isolated from virally infected MDCK cells as described in Materials and Methods. The immunoisolated vesicle preparations were fractionated by sedimentation velocity centrifugation and the caveolin complex in each fraction immunoprecipitated using anti–caveolin-1 antibodies. The radioactivity recovered from each fraction is indicated.
The evidence for a differential distribution of caveolin-1 and -2 in apical and basolateral TGN–derived vesicles so far is based on the immunoisolation of vesicles and subsequent mapping of the protein components by 2D electrophoresis. To obtain larger amounts of vesicles that would allow a more quantitative analysis by Western blotting and immunoelectron microscopy, we modified the procedure previously established by Wandinger-Ness et al., 1990. TGN–derived vesicles were released from semiintact cells after disruption of the plasma membrane by hypotonic swelling as previously described by Xu and Shields (1993). The release of the viral glycoproteins from MDCK cells under this conditions was reported to be regulated in the same manner as surface transport in SLO-permeabilized cells (Pimplikar and Simons, 1993; Müsch et al., 1996). 15– 25% of the viral marker proteins were released depending on cytosol and the addition of energy (2.5–5.5-fold stimulation, data not shown). The glycoproteins acquired terminal Golgi modifications and release of proteins was not due to fragmentation of the Golgi complex, since the trans-Golgi marker sialyltransferase was efficiently retained in the cells (data not shown). Released vesicles were separated from the cytosol and heavy membrane fragments by flotation through an Optiprep step gradient. The obtained fraction predominantly contained vesicles of 80–100 nm in diameter as analyzed by negative staining and ∼50% of all vesicles could be labeled with the antibodies against the cytoplasmic tail of the viral proteins. We next analyzed the distribution of the caveolins in the vesicle popoulation by triple labeling with antibodies against caveolin-1, -2, and antibodies against the viral glycoproteins (Fig. 9). VSV-G– and HA-containing vesicles were both labeled with caveolin-1 antibodies, whereas significant caveolin-2 labeling was restricted to basolateral (VSV-G–containing) vesicles. Apical vesicles showed significantly higher labeling for caveolin-1 than the basolateral ones (Table I). Similar results were obtained independently if the vesicles were first labeled for caveolin-1 or -2 (data not shown). This clearly demonstrates that different caveolin complexes are efficiently included into post-Golgi vesicles: heterooligomers of caveolin-1 and -2 in basolateral vesicles and large homooligomers of caveolin-1 into the apical vesicles.
Figure 9.
Electron micrographs of TGN-derived vesicles labeled for influenza virus HA (15-nm gold; A) or VSV-G (15-nm gold; B and C) and caveolin-1 (10-nm gold) and caveolin-2 (5-nm gold). The scale bar in C represents 100 nm.
Table I.
Quantitative Analysis of Caveolin Distribution in Exocytic Vesicles from MDCK Cells
| cav-1 | cav-2 | cav-1/cav-2 | ||||
|---|---|---|---|---|---|---|
| HA | ||||||
| 10.0 ± 0.9 | 11.0 ± 0.8 | 0.5 ± 0.2 | 19 ± 4 | |||
| VSV-G | ||||||
| 3.8 ± 0.4 | 6.9 ± 0.7 | 4.0 ± 0.6 | 1.6 ± 0.2 |
The table shows one representative experiment. Routinely, gold label on 40 HA and 40 VSV-G–positive vesicles was quantitated. The number of gold particles counted per vesicle is shown. The ratio of label for caveolin-1 and -2 was calculated for each individual vesicle and is listed under cav-1/cav-2. Standard errors are given.
Caveolin-2 Is Enriched in the Basolateral Plasma Membrane
We next determined the subcellular localization of the caveolins. Caveolin-1 is known to be present in both apical and basolateral plasma membrane domains (Wandinger-Ness et al., 1990; Dupree et al., 1993). On the other hand, we found caveolin-2 to be strongly enriched in basolateral vesicles. Caveolin-1 is indeed present at both the apical and basolateral surface domains as observed in the z-section taken from the confocal microscope (Fig. 10 A). In contrast, caveolin-2 is enriched in the basolateral compared to the apical membrane. In x, y-sections taken at different heights through the cell, caveolin-2 was found preferentially in the basal and lateral membranes of the cell (data not shown). To improve the fluorescence staining and confirm that caveolin-2 is enriched at the basolateral membrane compared to the apical membrane, we stably transfected MDCK cells with a caveolin-2 cDNA containing a carboxy-terminal myc epitope. Also, in cells overexpressing tagged caveolin-2 the protein was preferentially found in the basolateral membrane (Fig. 10 B). In the region located above the nucleus we found, in addition to the lateral membrane staining, intracellular staining (Fig. 10 C).
Figure 10.
Confocal immunofluorescence microscopy of caveolin-1 and -2 in filter-grown MDCK cells. The cells were labeled with anti–caveolin-1 (A) or -2 antibodies (B and C). Using the confocal microscope, z-sections were taken to show basolateral and apical staining. They were chosen such that the intracellular staining was hardly visualized. C shows an x, y-section taken from the region located above the nucleus (B). Bar, 5 μm.
Immunoelectron microscopy further substantiated the differential localization of caveolin-1 and -2 in polarized MDCK cells. Caveolin-1 was found in approximately equal amounts at the apical (Fig. 11 A) and basolateral (Fig. 11 B) membrane (0.058 ± 0.006 gold particles/μm apical and 0.071 ± 0.011 gold particles/μm basolateral). At the basolateral membrane, 61% of the gold particles was associated with caveolae (or caveolar-like structures), whereas no caveolae were found at the apical membrane. Anti–caveolin-2 hardly labeled the apical membrane (data not shown) and detected the endogenous protein preferentially on the basolateral membrane (Fig. 11 C). As the labeling for the endogenous caveolin-2 was too low to allow accurate quantitation, we determined the polarity in the cell line overexpressing the protein. On the apical membrane 2.0 ± 0.2 gold particles/μm were counted, whereas basolateral 9.6 ± 1.5 gold particles/μm were found. Similar to caveolin-1, 75% of the overexpressed caveolin-2 and 54% of the endogenous protein was found in caveolar structures. These numbers probably underestimate the enrichment of the proteins in caveolae since labeled caveolar structures were also encountered more than 250 nm from the plasma membrane but not included in the quantitation.
Figure 11.
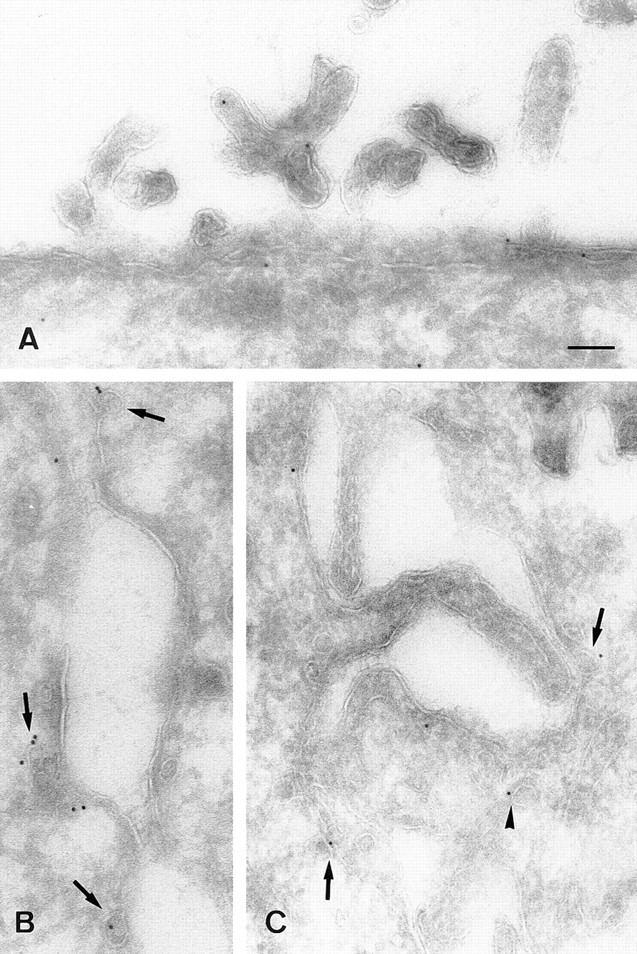
Electron micrographs showing the distribution of caveolin-1 (A and B) and -2 (C) in polarized MDCK cells. In B and C two opposing lateral membranes are shown. Caveolin-1 is present at the apical membrane (A) and at the basolateral membrane (B), where it is mainly present in caveolae (arrows). Caveolin-2 is mainly at the basolateral plasma membrane and its caveolar invaginations (C). A little further from the plasma membrane, caveolin-2 is associated with a vesicular profile (arrowhead), which resembles a caveolar profile deeper in the cell (C). Bar, 100 nm.
Anti–caveolin-1 Antibodies Inhibit Apical Transport of HA
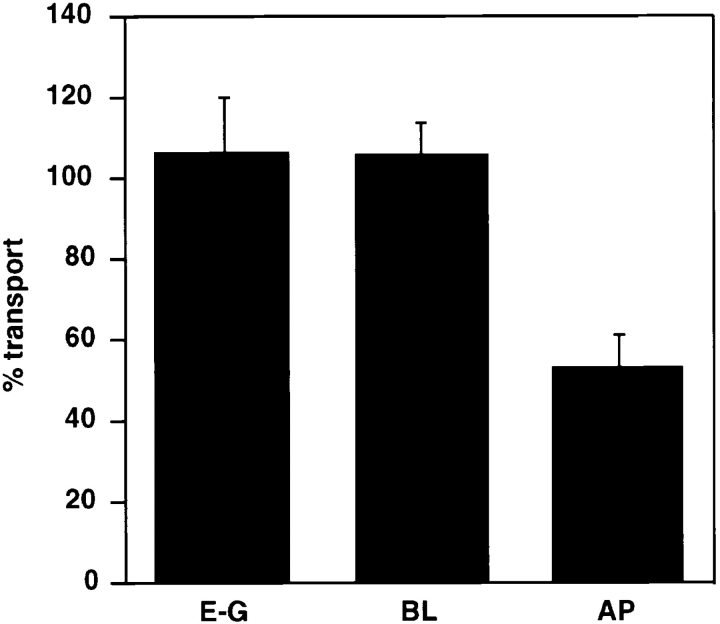
To test whether the caveolins are functionally involved in exocytic transport from the TGN to the cell surface, we took advantage of the in vitro transport assays established in our laboratory. These assays are based on monitoring the transport of viral marker proteins in polarized SLO-permeabilized MDCK cells and allowing the reconstitution of three biosynthetic transport routes: (a) transport of the apical marker influenza virus HA from the TGN to the apical cell surface, (b) transport of the basolateral marker VSV-G from the TGN to the basolateral surface, and (c) transport of either of the viral markers from the ER to the Golgi complex. We have previously demonstrated that these transport steps can be selectively inhibited by adding specific antibodies to the permeabilized cells (for review see Lafont et al., 1995). We tested the effect of the anticaveolin antibodies in the transport assays. The anti–caveolin-1 amino-terminal antibody had no effect on ER-to-Golgi transport of HA, nor on the basolateral transport of VSV-G. However, apical transport of HA was reproducibly inhibited by ∼50% (Fig. 12). This finding suggests that antibody binding to the amino-terminal part of caveolin-1 specifically interferes with the function of the caveolin complex in the apical pathway. However, binding to caveolin-1 present in basolateral vesicles is either not possible or does not interfere with transport. Anti–caveolin-2 antibodies were similarly tested in the transport assays but were found to be without effects (data not shown). These data do not prove that caveolin-1 has an essential function in apical transport, but they clearly demonstrate that caveolin-1 is in a different state in the apical vesicles as compared to the basolateral vesicles.
Figure 12.
Effect of anti– caveolin-1 antibodies on ER-to-Golgi (E–G), basolateral (BL), and apical (AP) transport. Anti–caveolin-1 antibody N-20 (10 μg/ml) was added to SLO-permeabilized MDCK cells, and then the transport of HA from the ER-to-Golgi complex or from the TGN to the apical surface or the transport of VSV-G from the TGN to the basolateral surface was measured. Transport is expressed as percentage of cytosol-dependent transport obtained in the absence of added antibody.
Discussion
Our analysis of the anti–caveolin-1 immunoprecipitate by 2D gel electrophoresis revealed, for the first time, that the caveolin complex is actually a heterooligomer of two caveolins, -1 and -2, with similar molecular weights but differing isoelectric points. This contradicts the previous result by Scherer and co-workers (1996) who failed to detect caveolin-2 in a high molecular weight complex. The fact that they analyzed only the shorter form of the overexpressed epitope-tagged caveolin-2 may account for the differences to our results. It is possible that the use of detergent in immunoprecipitation may lead to artificial association of proteins after cell lysis and coprecipitation of complexes formed in vitro. However, we demonstrated that caveolin-1 and -2 reside in the same basolateral vesicles (Fig. 9, B and C) and caveolin-2 was strongly enriched also in caveolar immunoisolations performed with anti–caveolin-1 antibodies in the absence of detergents (Fra, A.M., and K. Simons, unpublished data), corroborating our immunolocalization data that demonstrated both caveolin-1 and -2 were present in caveolae on the basolateral membrane (Fig. 11).
Another fact that has previously escaped attention is that caveolin-2 exists in two forms. Like caveolin-1, caveolin-2 seems to use alternative translation initiation sites to produce α and β isoforms. In caveolin-2, the longer alpha form is clearly more abundant, whereas the α and β isoforms of caveolin-1 are equally prevalent.
Biosynthetic Maturation of the Caveolin Complex
One of the aims of this work was to analyze the changes taking place in the physical state of the caveolins during their passage from the ER to the cell surface. Earlier work has led to the following findings: a high molecular weight oligomer forms already in the ER and an oligomeric structure is maintained when the protein complex is transported along the biosynthetic route. Caveolin isolated from tissues, which represents the steady-state distribution of the protein in the TGN and caveolae, also exists as a large complex. This oligomer is detergent-insoluble and binds cholesterol (Monier et al., 1995; Murata et al., 1995). The caveolin–cholesterol complex is a key structural element in the formation of caveolae and is also potentially important in the organization of glycosphingolipid-cholesterol microdomains (rafts) involved in protein, and lipid sorting (Fra et al., 1995; Parton and Simons, 1995; Ikonen and Simons, 1997). Because neither caveolae nor rafts exist in the ER, the caveolin complex should change its behavior during intracellular transport. We now have systematically analyzed the biochemical characteristics of the caveolin oligomers in pulse-chase experiments and found the following changes.
First, although caveolin oligomers are partially formed early in the biosynthetic route, they increase in size on their way to the cell surface. Monomeric forms can also be detected in the ER (although accurate quantitation of the ratios between monomer and oligomer is not possible because the monomer is immunoprecipitated less efficiently). We used velocity sedimentation in SDS–Triton X-100 sucrose gradients to follow the changes during maturation of the caveolin complex. We found that the newly synthesized oligomer migrates as a 200-kD complex under these conditions. After 1 h at 20°C, the structures are between 200–400-kD and after 1 h at 37°C their size increases even further. Second, the complex becomes gradually detergent-insoluble from a completely soluble ER form to an insoluble form after transport to the Golgi complex. Third, caveolin-2 was found to become modified by the addition of increasing numbers of phosphate groups, the most extensive phosphorylation being found at steady state and therefore likely to be related to the trafficking of the complex between the TGN and the cell surface. Caveolin-1, on the other hand, was not phosphorylated under these conditions, although the protein can function as a substrate for kinases (Glenney and Soppet, 1992; Mastick et al., 1995; Li et al., 1996a ). Fourth, the antibody reactivity of the complex changes during the chase period. There is not only a difference in the immunoprecipitation efficiencies between the monomeric and oligomeric forms, but also between different sizes of oligomers; the bigger the oligomer the more easily it is brought down by the anti–caveolin-1 amino-terminal antibody (Fig. 5). The same is true for the anti–caveolin-2 amino-terminal antibody (data not shown). Interestingly, we found that an anti–caveolin-1 carboxy-terminal antibody failed to immunoprecipitate the mature complex. However, this antibody recognized the ER form of the oligomer equally effectively as the amino-terminal antibody (data not shown). Similarly, the myc epitope that we introduced in the carboxy terminus of caveolin-2 is also less acccessible at the plasma membrane (data not shown), and antibodies against the carboxy terminus of caveolin-1 fail to detect the protein on the cell surface (Dupree et al., 1993). This suggests that a carboxy-terminal epitope available for antibody recognition in the ER becomes hidden during maturation of the complex. This is in agreement with the report that the carboxy terminus of caveolin is involved in oligomerization (Song et al., 1997). Also, palmitoylation of cysteine residues in the carboxy-terminal domain might interfere with antibody recognition (Dietzen et al., 1995).
Specialized Complexes of Caveolins Exist in the Apical and Basolateral Traffic Routes
These data demonstrate that the newly synthesized caveolins undergo dramatic changes during their transport to the cell surface. However, the most startling finding was the preferential routing of caveolin-2 to the basolateral cell surface as judged by its enrichment in basolateral carriers and its localization on the basolateral plasma membrane domain. Thus, the distributions of caveolin-1 and -2 are different over the polarized cell surfaces, caveolin-1 being present on both the apical and the basolateral sides. Our biochemical data and the electron microscopy analysis of apical and basolateral vesicles suggests that heterooligomers of caveolin-1 and -2 are incorporated into the basolateral transport vesicles in the TGN, whereas caveolin-1 homooligomers are included into the apical vesicles and transported to the apical plasma membrane domain. This notion is in accordance with our quantitation of the stoichiometry of the two proteins. Caveolin-1 was more abundant than caveolin-2 and caveolin-2 antibodies failed to coprecipitate caveolin-1 quantitatively. Moreover, we provided biochemical evidence for two differentially behaving caveolin oligomers. Size fractionation of the apical and basolateral caveolin complexes from immunoisolated vesicles revealed that the apical complexes formed larger oligomers than the basolateral ones. This, together with the fact that the >600-kD complexes contained less caveolin-2 (Fig. 3), further supports the presence of caveolin-1 oligomers in the apical vesicles. Finally, we found that apical protein transport can be disturbed by the addition of caveolin-1 antibodies, as reflected by reduced apical delivery of HA, whereas the transport of VSV-G protein recruited to basolateral vesicles occurred normally. Transport of HA was, however, not inhibited by the antibody earlier in the biosynthetic route, as ER-to-Golgi transport was not affected.
Working Model for the Differential Roles of Caveolin-1 and -2 in MDCK Cells
Based on these results we envisage caveolins-1 and -2 to participate in the two post-Golgi membrane traffic routes in MDCK cells as follows. The apical vesicles and the apical plasma membrane domain contain mostly caveolin-1 in a homooligomeric complex. The basolateral vesicles and the basolateral plasma membrane domain, on the other hand, contain heterooligomers of caveolin-1 and -2. The putative homooligomers of caveolin-1, formed in the ER, polymerize to larger structures by interactions with sphingolipid–cholesterol raft components during the formation of apical transport vesicles. How the heterooligomers of caveolin-1 and -2 become excluded from the apical vesicles and included in the basolateral carriers is an open question. They could become bound to another protein with basolateral sorting determinants, with binding possibly regulated by phosphorylation of caveolin-2.
One problem arising from the postulated differential sorting of caveolin-1 and -2 complexes concerns the biogenesis of caveolae. Caveolae are present in many cell types but in MDCK epithelial cells they are observed only on the basolateral but not on the apical cell surface (Fig. 11 and Parton, R.G., personal communication). On the other hand, earlier work has demonstrated that the overexpression of caveolin-1 is sufficient to trigger caveolar formation in cells normally lacking both caveolin-1 and caveolae (Fra et al., 1995; Li et al., 1996c ). Why then do not the caveolin-1 complexes on the apical surface form caveolae? One possibility is that caveolae normally are formed by caveolin heterooligomers in which the phosphorylation of caveolin-2 may somehow lower the concentration necessary for caveolar assembly. In this case, strong overexpression of caveolin-1 might allow formation of caveolae that would not be fully functional. Alternatively, functional caveolae could be generated either by one or a combination of several caveolin types. Additional factors on the apical membrane could also be hindering the generation or maintenance of caveolae. Although this problem remains to be explored, it seems most likely from our results that heterooligomers of caveolin-1 and -2 become engaged in caveolar formation upon arrival to the basolateral cell surface.
What then is the function of the caveolin-1 homooligomers included in the apical vesicles? The most likely explanation is that caveolin-1 is used to organize lipid–raft microdomains in which rafts cluster to function as platforms for apical transport. The direct association of membrane proteins with rafts depends on cholesterol (Scheiffele et al., 1997; Simons and Ikonen, 1997), and the cholesterol-binding protein caveolin-1 might polymerize in the TGN to organize an apical patch. Importantly, it has been demonstrated that cholesterol depletion from cells inhibits apical transport (Keller, P., and K. Simons, manuscript submitted for publication) highlighting the importance of protein– lipid interactions for the apical pathway.
In conclusion, our data offer the first indications of the existence of functionally specialized complexes of caveolins. Moreover, they suggest that in addition to caveolar formation, caveolins can be involved in exocytic transport. However, the presumptive function of caveolin-1 in apical transport will require further studies. From work on other epithelial cell types lacking caveolin-1 (FRT and Caco-2 cells; Zurzolo et al., 1994; Mirre et al., 1996), we must conclude that caveolin-1 cannot be a general factor for apical sorting and delivery. Future research will have to clarify how the molecular machinery responsible for transporting sphingolipid–cholesterol rafts and their associated proteins is constructed in different cell types.
Footnotes
We thank members of the Simons lab for critical support, K. Ekroos and S. Brendel for expert technical assistance, W. Huttner (Universität Heidelberg, Heidelberg, Germany) for a critical reading of the manuscript, K. Ashman for peptide sequencing, M. Zerial for the λZAP library, J. Lanoix for rat liver cytosol, S. Bhakdi (Universität Mainz) for the generous supply of SLO, A. Puolasmaa (MSD-Finland) for the kind gift of lovastatin, and Anton G. Rietveld (European Molecular Biology Laboratory) for the help with cholesterol determinations.
This work was financially supported by the Academy of Finland, Commission of the European Communities, Theleton, and SFB 352.
E. Ikonen's present address is Dept. of Biochemistry, National Public Health Institute, Mannerheimintie 166, FIN-00300 Helsinki, Finland.
Address all correspondence to K. Simons, Cell Biology Programme, European Molecular Biology Laboratory, Meyerhofstrasse 1, Postfach 10 2209, D-69012 Heidelberg, Germany. Tel.: (49) 622-138-7334. Fax: (49) 622-138-7512.
1. Abbreviations used in this paper: 2D, two-dimensional; HA, influenza virus hemagglutinin; SLO, streptolysin-O; VSV-G, vesicular stomatitis virus glycoprotein.
References
- Beckers CJM, Keller DS, Balch WE. Semi-intact cells permeable to macromolecules: Use in reconstitution of protein transport from the endoplasmatic reticulum to the Golgi complex. Cell. 1987;50:523–534. doi: 10.1016/0092-8674(87)90025-0. [DOI] [PubMed] [Google Scholar]
- Bravo, R. 1984. Two-dimensional Gel Electrophoresis: A Guide for the Beginner. In Two-dimensional Gel Electrophoresis of Proteins. J.E. Celis and R. Bravo, editors. Academic Press Inc., Orlando, FL. 3–36.
- Dietzen DJ, Hastings WR, Lublin DM. Caveolin is palmitoylated on multiple cystein residues. J Biol Chem. 1995;270:6838–6842. doi: 10.1074/jbc.270.12.6838. [DOI] [PubMed] [Google Scholar]
- Dupree P, Parton RG, Raposo G, Kurzchalia TV, Simons K. Caveolae and sorting in the trans-Golgi network of epithelial cells. EMBO (Eur Mol Biol Organ) J. 1993;12:1597–1605. doi: 10.1002/j.1460-2075.1993.tb05804.x. [DOI] [PMC free article] [PubMed] [Google Scholar]
- Fra AM, Williamson E, Simons K, Parton RG. Detergent-insoluble glycolipid microdomains in lymphocytes in the absence of caveolae. J Biol Chem. 1994;269:30745–30748. [PubMed] [Google Scholar]
- Fra AM, Williamson E, Simons K, Parton RG. De novo formation of caveolae in lymphocytes by expression of VIP21-caveolin. Proc Natl Acad Sci USA. 1995;92:8655–8659. doi: 10.1073/pnas.92.19.8655. [DOI] [PMC free article] [PubMed] [Google Scholar]
- Glenney JR, Soppet D. Sequence and expression of caveolin, a protein component of caveolae plasma membrane domains phosphorylated on tyrosine in Rous sarcoma virus-transformed fibroblasts. Proc Natl Acad Sci USA. 1992;89:10517–10521. doi: 10.1073/pnas.89.21.10517. [DOI] [PMC free article] [PubMed] [Google Scholar]
- Griffiths G, Simons K. The trans-Golgi network: sorting at the exit site of the Golgi complex. Science. 1986;234:438–443. doi: 10.1126/science.2945253. [DOI] [PubMed] [Google Scholar]
- Ikonen E, Tagaya M, Ullrich O, Montecucco C, Simons K. Different requirements for NSF, SNAP, and Rab proteins in apical and basolateral transport in MDCK cells. Cell. 1995;81:571–580. doi: 10.1016/0092-8674(95)90078-0. [DOI] [PubMed] [Google Scholar]
- Kreis TE. Microinjected antibodies against the cytoplasmic domain of vesicular stomatitis glycoprotein block its transport to the cell surface. EMBO (Eur Mol Biol Organ) J. 1986;5:931–941. doi: 10.1002/j.1460-2075.1986.tb04306.x. [DOI] [PMC free article] [PubMed] [Google Scholar]
- Kurzchalia TV, Dupree P, Parton RG, Kellner R, Virta H, Lehnert M, Simons K. VIP21, a 21-kD membrane protein is an integral component of trans-Golgi network–derived transport vesicles. J Cell Biol. 1992;118:1003–1014. doi: 10.1083/jcb.118.5.1003. [DOI] [PMC free article] [PubMed] [Google Scholar]
- Lafont F, Simons K, Ikonen E. Dissecting the molecular mechanisms of polarized membrane traffic: Reconstitution of three transport steps in epithelial cells using streptolysin-O permeabilization. Cold Spring Harbor Symp Quant Biol. 1995;60:753–762. doi: 10.1101/sqb.1995.060.01.081. [DOI] [PubMed] [Google Scholar]
- Li S, Seitz R, Lisanti MP. Phosphorylation of caveolin by src tyrosine kinases. J Biol Chem. 1996a;271:3863–3868. [PubMed] [Google Scholar]
- Li S, Song KS, Lisanti MP. Expression and characterization of recombinant caveolin. Purification by polyhistidine tagging and cholesterol-dependent incorporation into defined lipid membranes. J Biol Chem. 1996b;271:568–573. [PubMed] [Google Scholar]
- Li S, Song KS, Koh SS, Kikuchi A, Lisanti MP. Baculovirus-based expression of mammalian caveolin in Sf21 insect cells. J Biol Chem. 1996c;271:28647–28654. doi: 10.1074/jbc.271.45.28647. [DOI] [PubMed] [Google Scholar]
- Mastick CC, Brady MJ, Saltiel AR. Insulin stimulates the tyrosine phosphorylation of caveolin. J Cell Biol. 1995;129:1523–1531. doi: 10.1083/jcb.129.6.1523. [DOI] [PMC free article] [PubMed] [Google Scholar]
- Melkonian KA, Chu T, Tortorella LB, Brown DA. Characterization of proteins in detergent-resistant membrane complexes from Madin-Darby canine kidney epithelial cells. Biochemistry. 1995;34:16161–16170. doi: 10.1021/bi00049a031. [DOI] [PubMed] [Google Scholar]
- Mirre C, Monlauzeur L, Garcia M, Delgrossi M-H, Le Bivic A. Detergent-resistant membrane microdomains from Caco-2 cells do not contain caveolin. Am J Physiol. 1996;271:C887–C894. doi: 10.1152/ajpcell.1996.271.3.C887. [DOI] [PubMed] [Google Scholar]
- Monier S, Parton RG, Vogel F, Behlke J, Henske A, Kurzchalia TV. VIP21-caveolin, a membrane protein constituent of the caveolar coat, oligomerizes in vivo and in vitro. Mol Biol Cell. 1995;6:911–927. doi: 10.1091/mbc.6.7.911. [DOI] [PMC free article] [PubMed] [Google Scholar]
- Monier S, Dietzen DJ, Hastings WR, Lublin DM, Kurzchalia TV. Oligomerization of VIP21-caveolin in vitro is stabilized by long chain fatty acylation or cholesterol. FEBS (Fed Eur Biochem Soc) Lett. 1996;388:143–149. doi: 10.1016/0014-5793(96)00519-4. [DOI] [PubMed] [Google Scholar]
- Murata M, Peränen J, Schreiner R, Wieland F, Kurzchalia TV, Simons K. VIP21/caveolin is a cholesterol-binding protein. Proc Natl Acad Sci USA. 1995;92:10339–10343. doi: 10.1073/pnas.92.22.10339. [DOI] [PMC free article] [PubMed] [Google Scholar]
- Müsch A, Xu H, Shields D, Rodriguez-Boulan E. Transport of vesicular stomatitis virus G protein to the cell surface is signal mediated in polarized and nonpolarized cells. J Cell Biol. 1996;133:543–558. doi: 10.1083/jcb.133.3.543. [DOI] [PMC free article] [PubMed] [Google Scholar]
- Parton RG, Joggerst B, Simons K. Regulated internalization of caveolae. J Cell Biol. 1994;127:1199–1215. doi: 10.1083/jcb.127.5.1199. [DOI] [PMC free article] [PubMed] [Google Scholar]
- Parton RG, Simons K. Digging into caveolae. Science. 1995;269:2–3. doi: 10.1126/science.7660120. [DOI] [PubMed] [Google Scholar]
- Peränen J. Rapid affinity-purification and biotinylation of antibodies. Biotechniques. 1992;13:546–549. [PubMed] [Google Scholar]
- Pimplikar SW, Simons K. Regulation of apical transport in epithelial cells by a Gs class of heterotrimeric G protein. Nature. 1993;362:456–458. doi: 10.1038/362456a0. [DOI] [PubMed] [Google Scholar]
- Pimplikar SW, Ikonen E, Simons K. Basolateral protein transport in streptolysin O-permeabilized MDCK cells. J Cell Biol. 1994;125:1025–1035. doi: 10.1083/jcb.125.5.1025. [DOI] [PMC free article] [PubMed] [Google Scholar]
- Rothberg KG, Heuser JE, Donzell WC, Ying Y-S, Glenney JR, Anderson RGW. Caveolin, a protein component of caveolae membrane coats. Cell. 1992;68:673–682. doi: 10.1016/0092-8674(92)90143-z. [DOI] [PubMed] [Google Scholar]
- Sargiacomo M, Sudol M, Tang Z, Lisanti MP. Signal transducing molecules and glycosyl-phosphatidyinositol-linked proteins form a caveolin-rich insoluble complex in MDCK cells. J Cell Biol. 1993;122:789–807. doi: 10.1083/jcb.122.4.789. [DOI] [PMC free article] [PubMed] [Google Scholar]
- Sargiacomo M, Scherer PE, Tang Z, Kubler E, Song KS, Sanders MC, Lisanti MP. Oligomeric structure of caveolin: implications for caveolae membrane organization. Proc Natl Acad Sci USA. 1995;92:9407–9411. doi: 10.1073/pnas.92.20.9407. [DOI] [PMC free article] [PubMed] [Google Scholar]
- Scheiffele P, Roth MG, Simons K. Interaction of influenza virus hemagglutinin with sphingolipid-cholesterol membrane domains via its transmembrane domain. EMBO (Eur Mol Biol Organ) J. 1997;16:5501–5508. doi: 10.1093/emboj/16.18.5501. [DOI] [PMC free article] [PubMed] [Google Scholar]
- Scherer PE, Tang Z, Chun M, Sargiacomo M, Lodish HF, Lisanti MP. Caveolin isoforms differ in their N-terminal protein sequence and subcellular distribution. Identification and epitope mapping of an isoform-specific monoclonal antibody probe. J Biol Chem. 1995;270:16395–16401. doi: 10.1074/jbc.270.27.16395. [DOI] [PubMed] [Google Scholar]
- Scherer PE, Okamoto T, Chun M, Nishimoto I, Lodish HF, Lisanti MP. Identification, sequence and expression of caveolin-2 defines a caveolin gene family. Proc Natl Acad Sci USA. 1996;93:131–135. doi: 10.1073/pnas.93.1.131. [DOI] [PMC free article] [PubMed] [Google Scholar]
- Schnitzer JE, Oh P, Pinney E, Allard J. Filipin-sensitive transport in endothelium: Reduced transcytosis, scavenger endocytosis, and capillary permeability of select macromolecules. J Cell Biol. 1994;127:1217–1232. doi: 10.1083/jcb.127.5.1217. [DOI] [PMC free article] [PubMed] [Google Scholar]
- Shevchenko A, Keller P, Scheiffele P, Mann M, Simons K. Identification of components of trans-Golgi network-derived transport vesicles and detergent-insoluble complexes by nanoelectrospray tandem mass spectrometry. Electrophoresis. 1997;18:2591–2600. doi: 10.1002/elps.1150181415. [DOI] [PubMed] [Google Scholar]
- Simons K, Ikonen E. Sphingolipid-cholesterol rafts in membrane trafficking and signalling. Nature. 1997;387:569–572. doi: 10.1038/42408. [DOI] [PubMed] [Google Scholar]
- Song KS, Tang Z, Li S, Lisanti MP. Mutational analysis of the properties of caveolin-1. J Biol Chem. 1997;272:4398–4403. doi: 10.1074/jbc.272.7.4398. [DOI] [PubMed] [Google Scholar]
- Wandinger-Ness A, Bennett MK, Antony C, Simons K. Distinct transport vesicles mediate the delivery of plasma membrane proteins to the apical and basolateral domains of MDCK cells. J Cell Biol. 1990;111:987–1000. doi: 10.1083/jcb.111.3.987. [DOI] [PMC free article] [PubMed] [Google Scholar]
- Xu H, Shields D. Prohormone processing in the trans-Golgi network: endoproteolytic cleavage of prosomatostatin and formation of nascent secretory vesicles in permeabilized cells. J Cell Biol. 1993;122:1169–1184. doi: 10.1083/jcb.122.6.1169. [DOI] [PMC free article] [PubMed] [Google Scholar]
- Zurzolo C, van't Hof W, van Meer G, Rodriguez-Boulan E. VIP21/caveolin, glycosphingolipid clusters and the sorting of glycosylphosphatidylinositol-anchored proteins in epithelial cells. EMBO (Eur Mol Biol Organ) J. 1994;13:42–53. doi: 10.1002/j.1460-2075.1994.tb06233.x. [DOI] [PMC free article] [PubMed] [Google Scholar]


