

Abstract
Abstract. It is thought that the high protein density in the mitochondrial matrix results in severely restricted solute diffusion and metabolite channeling from one enzyme to another without free aqueous-phase diffusion. To test this hypothesis, we measured the diffusion of green fluorescent protein (GFP) expressed in the mitochondrial matrix of fibroblast, liver, skeletal muscle, and epithelial cell lines. Spot photobleaching of GFP with a 100× objective (0.8-μm spot diam) gave half-times for fluorescence recovery of 15–19 ms with >90% of the GFP mobile. As predicted for aqueous-phase diffusion in a confined compartment, fluorescence recovery was slowed or abolished by increased laser spot size or bleach time, and by paraformaldehyde fixation. Quantitative analysis of bleach data using a mathematical model of matrix diffusion gave GFP diffusion coefficients of 2–3 × 10⁻⁷ cm2/s, only three to fourfold less than that for GFP diffusion in water. In contrast, little recovery was found for bleaching of GFP in fusion with subunits of the fatty acid β-oxidation multienzyme complex that are normally present in the matrix. Measurement of the rotation of unconjugated GFP by time-resolved anisotropy gave a rotational correlation time of 23.3 ± 1 ns, similar to that of 20 ns for GFP rotation in water. A rapid rotational correlation time of 325 ps was also found for a small fluorescent probe (BCECF, ∼0.5 kD) in the matrix of isolated liver mitochondria. The rapid and unrestricted diffusion of solutes in the mitochondrial matrix suggests that metabolite channeling may not be required to overcome diffusive barriers. We propose that the clustering of matrix enzymes in membrane-associated complexes might serve to establish a relatively uncrowded aqueous space in which solutes can freely diffuse.
The mitochondrial matrix is the aqueous compartment enclosed by the inner mitochondrial membrane. The very high density of enzymes and other proteins in the matrix, which may be as high as 270–560 mg protein/ml (Srere, 1980; Goodsell, 1991), makes it the most crowded aqueous cellular compartment. Theoretical considerations have suggested that the diffusion of metabolite- and enzyme-sized solutes might be severely restricted in the mitochondrial matrix (Hackenbrock et al., 1986; Watford, 1990; Welch and Easterby, 1994). It has been proposed that biochemical events occur by a metabolite channeling mechanism, where metabolites are passed from one enzyme to another in an organized complex without aqueous-phase diffusion (Srere, 1987; Somogyi et al., 1987; Ovadi et al., 1991; Watford, 1990; Westerhoff and Welch, 1992). Although extensive evidence for enzyme clustering in the mitochondrial matrix has been reported (Welch, 1977; Von Hippel and Berg, 1989; Srere and Ovadi, 1990; Robinson and Srere, 1995), which is consistent with metabolite channeling, there has been no direct measurement of solute diffusion in the matrix.
The challenges to measure solute diffusion in the mitochondrial matrix of living cells are to selectively label the matrix with probes that do not bind to resident proteins, and to visualize probe diffusion in a compartment whose caliber is near the resolution limit of the light microscope. The only report on solute mobility in the mitochondrial matrix uses isolated liver mitochondria and labeling by carboxyfluorescein (CF)1, a small fluorescent probe that crosses the mitochondrial limiting membranes and becomes deesterified and trapped in the matrix (Scalettar et al., 1991). A high steady state fluorescence anisotropy for CF was found, which was taken as evidence for severely restricted solute mobility in the matrix. A concern of the CF study, in addition to the use of isolated mitochondria and the measurement of rotational rather than translational diffusion, was that CF binding to matrix protein was not considered. As will be shown here, BCECF (a CF analogue) binding in isolated mitochondria gives high steady state anisotropy values that cannot be interpreted in terms of solute mobility in the aqueous-phase of the mitochondrial matrix.
The purpose of this study was to measure solute translational and rotational mobility in the mitochondrial matrix of intact cells. Our strategy was to label the matrix with GFP alone and in fusion with resident matrix proteins. GFP translation was measured by photobleaching recovery and GFP rotation by time-resolved anisotropy. GFP has been shown to be an excellent reporter solute for the analysis of cytoplasmic viscosity (Swaminathan et al., 1997) and for the labeling of various intracellular compartments including mitochondria (Rizzuto et al., 1995; Cole et al., 1996; De Giorgi et al., 1996; Gerdes and Kaether, 1996). Many of the optical and analytic methods used in this study had been developed in our laboratory for the analysis of solute rotational mobility (Fushimi and Verkman, 1991; Bicknese et al., 1993) and translational mobility (Kao et al., 1993; Seksek et al., 1997) in the cytoplasm and nucleus. The photobleaching recovery experiments indicated that nearly all GFP in the mitochondrial matrix was mobile and diffused only a few times slower than if the matrix contained only saline; the time-resolved anisotropy measurements indicated very little hindrance of the matrix to GFP rotation. In addition, time-resolved anisotropy measurements of BCECF rotation in isolated rat liver mitochondria prepared and labeled as described by Scalettar et al. (1991) indicated that although a substantial fraction of BCECF was in a bound state, unbound BCECF rotated rapidly within the matrix. Together these studies indicate relatively free and rapid diffusion of solutes within the mitochondrial matrix and do not support the view that protein crowding severely restricts solute movement.
Materials and Methods
Cell Culture and Transfection
CHO-K1 cells (ATCC CRL9618), L6 cells (CRL1458), HepG2 cells (HB8065), and LLC-PK1 cells (CL101.1) were cultured on 18-mm-diam round glass coverslips at 37°C in 95% air, 5% CO2. CHO cells were cultured in Ham's F12 medium, L6 and LLC-PK1 cells in DME-H21, and HepG2 cells in Eagle's MEM supplemented with nonessential amino acids and Na pyruvate; all media contained 10% fetal bovine serum, penicillin (100 U/ml), and streptomycin (100 μg/ml). Cells were transfected 1 d after plating at which time they were ∼80% confluent. Cells in each well of a six-well plastic dish containing a coverglass were transfected with a mixture consisting of 1 μg of plasmid DNA encoding various GFP-fusion constructs and 12 μg Lipofect-AMINE reagent (GIBCO BRL, Gaithersburg, MD) in a 0.2-ml vol of OPTI-MEM (GIBCO BRL). After 5 h the transfection mixture was replaced with 1 ml of culture medium. Cells were used 2 d after transient transfection.
GFP Targeting Constructs
For expression of COX8-GFP, the targeting presequence of subunit VIII of human cytochrome c oxidase (COX8; Rizzuto et al., 1992) was PCR amplified using human kidney cDNA as template and primers: sense 5′-GCCCAAGCTTATCATGTCCGTCCTGACGCC-3′; antisense, 5′-CGAATTCCTTCCCCTCCGGCGGCAACG-3′ (engineered HindIII and EcoRI restriction sites underlined). COX8 was subcloned into eukaryotic expression vector pcDNA3.1 (Invitrogen Corp., Carlsbad, CA) at HindIII/EcoRI sites. The coding sequence of humanized GFP was PCR amplified from plasmid pEGFP-C1 (CLONTECH Laboratories, Inc., Palo Alto, CA) using primers: sense 5′-GGAATTCGTGTGCAAGGGCGAGGAGCTGTTCAC-3′; antisense 5′-GCTCTAGATTA CTTGTACAGCTCGTCCATGCCG-3′ (engineered EcoRI and XbaI sites underlined). GFP was ligated downstream and in frame with COX8 at EcoRI/ XbaI sites.
Fusion constructs containing αMFAB or βMFAB (α and β subunits of rat mitochondrial fatty acid β-oxidation multienzyme complex) downstream from COX8-GFP were prepared as follows. The mature peptide of αMFAB (78.6 kD; these data are available from GenBank/EMBL/DDBJ under accession number D16478; Kamijo et al., 1993) was amplified using primers: sense 5′-GGACTAGTTCTAGAACCATATTAATTATGGAGT-3′, antisense 5′-GGACTAGTTCACTGGTAGAACTTCTTGCGAGTT-3′ (engineered SpeI restriction sites underlined), and βMFAB (47.5 kD, accession number D16478) using primers: sense 5′-GGACTAGTTCTGCCCCAGCTGTCCAGACCAAG-3′, antisense 5′-GGACTAGTTTTTGGGTAGGCTTCCACAATCAT-3′ (engineered SpeI restriction sites underlined) using rat liver cDNA as template. αMFAB or βMFAB were ligated downstream and in frame with COX8-GFP at an XbaI site and orientation was screened by restriction digestion. All constructs were confirmed by sequence analysis and cell-free translation.
Isolation and Labeling of Mitochondria
Liver mitochondria were isolated by a modification of the original procedure of Schneider et al. (1948). The liver from a male Sprague-Dawley rat (∼250 g) was excised, cooled in isotonic KCl, cut into 5-mm slices, and then transferred to homogenization buffer (250 mM sucrose, 10 mM Na phosphate, pH 7.4). The liver was homogenized with a Potter-Eljvehem homogenizer, nuclei and debris were sedimented at 600 g for 10 min, and the supernatant was centrifuged at 8,500 g for 10 min to pellet mitochondria. The pellet was washed twice, resuspended in 3 ml of the sucrose buffer, and loaded with the fluorescent probe BCECF within 4 h of isolation. A 0.5-ml aliquot of the mitochondrial suspension (2 mg protein/ml) was incubated with 10 μM BCECF for 15 min at 23°C, and external BCECF was removed by 4–6 washes. By fluorescence microscopy at 100×, mitochondria appeared as bright green dots on a black background.
Fluorescence Recovery After Photobleaching
Fluorescence recovery after photobleaching (FRAP) measurements were carried out on an apparatus described previously (Kao et al., 1996). An Argon ion laser beam (488 nm, Innova 70-4; Coherent Inc., Palo Alto, CA) was modulated by two serial acoustooptic modulators (1.5 μs response time) and directed onto the stage of an inverted epifluorescence microscope (Diaphot; Nikon Inc., Melville, NY). The microscope was also equipped for full-field epiillumination to visualize all cells to target the focused laser beam. The full-field and laser beams were reflected by a dichroic mirror (510 nm) onto the sample by an objective lens (100× oil Fluor NA 1.3 [Nikon Inc.]; Leitz 40× quartz glycerol NA 0.65 [The Leitz Co., Overland Park, KS]; or 20× dry NA 0.75 [Nikon Inc.]). For most experiments, the laser beam power was set to 200–500 mW (488 nm) and the attenuation ratio (the ratio of bleach to probe beam intensity) was set to 5,000–15,000. Sample fluorescence was filtered by serial barrier (Schott glass OG 515) and interference (530 ± 15 nm) filters and detected with a photomultiplier, transimpedance amplifier and 14-bit analog-to-digital converter. A gating circuit that controls the voltage of the second dynode was used to decrease photomultiplier gain during photobleaching. Signals were sampled before the bleach and over three different time intervals after the bleach: high resolution data (1 MHz sampling rate) over 10–100 ms, low resolution data (generally 104 points) over 0.1–10 s, and final signal data (103 points) at a specified late time. High and low resolution data were binned into 200 points each for storage and analysis. For FRAP measurements in mitochondria, 10–15 individual fluorescence recovery curves (each from a different cell) were averaged. For experiments in which cell volume was changed, cells were exposed to hypoosmolar (150 mOsm, 1:1 PBS/water) or hyperosmolar (600 or 900 mOsm, PBS containing 300 or 600 mM sucrose) buffer for 5–15 min. Unless otherwise specified, measurements were done at 23°C in a temperature-controlled darkroom.
Analysis of FRAP Data
As described in the Appendix, fluorophore diffusion coefficients (D, in cm2/s) were determined from recovery half-times (t 1/2) using a mathematical model of diffusion in the mitochondrial matrix. The t 1/2 value was determined as the time after the bleach pulse at which the fluorescence was equal to the mean of the fluorescence just after the bleach and that when essentially all recovery had occurred (post-bleach). The fluorescence just after the bleach was determined operationally as the average fluorescence at 50–75 μs after the end of the bleach. The post-bleach fluorescence was generally determined as the average fluorescence at a time equal to >100 t 1/2 intervals. The percentage recovery was computed from pre- and post-bleach fluorescence and the percentage bleaching. t 1/2 was computed using a quadratic polynomial fitted to a small interval of the recovery curve surrounding an estimated t 1/2 computed from an initial exponential regression of the full recovery curve.
Time-resolved Anisotropy Measurements
Fluorescence lifetime and anisotropy decay measurements were carried out in the frequency domain by cuvette fluorimetry using a Fourier Transform Fluorimeter (48000 MHF; SLM Instruments Inc., Urbana, IL), or by fluorescence microscopy using epifluorescence microscope optics in place of the cuvette compartment (Fushimi and Verkman, 1991). For microscopy measurements, the impulse-modulated, vertically polarized light (488 nm) was reflected onto the sample by a 510-nm dichroic mirror and objective lens; emitted fluorescence was filtered by a 515-nm cut-on filter and passed through a rotatable analyzing calcite polarizer. Analysis of lifetime and time-resolved anisotropy were performed by a comparative approach as described previously (Verkman et al., 1991). Fluorescein in 0.1 N NaOH was used as a 4.0-ns lifetime standard. Anisotropy decay measurements done by microscopy required the inclusion of a geometric factor (generally ∼1.2) to correct for the differential detection of parallel versus perpendicular emission polarization arising mainly from differential reflectivity of the dichroic mirror.
Confocal Microscopy
Cells were visualized using a Nipkow wheel confocal microscope (The Leitz Co. with Technical Instruments coaxial-confocal attachment) and cooled CCD camera detector (Photometrics Ltd., Tuscon, AZ) as described previously (Seksek et al., 1995). Cells were viewed using a 100× oil immersion objective (NA 1.4) with a z-resolution of ∼1 μm.
Results
To label the mitochondrial matrix of living cells with a fluorescent probe, cells were transfected with cDNA encoding humanized GFP fused in frame with the targeting presequence of subunit VIII of human cytochrome c oxidase. After entering the matrix the presequence is cleaved to give unconjugated, soluble GFP. GFP translational diffusion was measured by FRAP and rotational diffusion by time-resolved anisotropy. Fig. 1 A shows a confocal fluorescence micrograph of CHO cells transfected with the GFP construct. GFP was localized selectively to the mitochondrial matrix, seen as elongated structures present throughout the cytoplasm. Similar mitochondrial appearance was found for transfected HepG2 liver cells, L6 skeletal muscle cells and LLC-PK1 epithelial cells (not shown). These cell lines were chosen for study because of the importance of mitochondrial metabolism in liver, muscle, and epithelial cell physiology.
Figure 1.

Spot photobleaching of GFP in the mitochondrial matrix. (A) Confocal fluorescence micrograph of CHO cells expressing GFP in mitochondria (100× objective, NA 1.4). (B) Photobleaching of GFP in the mitochondrial matrix of indicated cells. Measurements were done using a 100× objective (0.8-μm-diam spot) and 40 μs bleach time at 23°C. Each curve is the average of 10–15 fluorescence recovery curves from different cells. Bar, 5 μm.
Spot photobleaching was carried out to measure GFP translational diffusion. Fig. 1 B shows the kinetics of fluorescence recovery after photobleaching of cells expressing GFP in the matrix. Bleaching was done using a 0.8-μm-diam spot and a brief bleach time of 40 μs. Laser intensity was set to give 15–20% bleaching. Similar recovery kinetics were observed for each of the cell types with recovery to 82–91% of initial fluorescence, with t 1/2 for recovery of 15–19 ms. Because of the finite mitochondrial size, the 82– 91% recovery indicates that >90% of the GFP is mobile. The prompt and nearly complete fluorescence recovery was an unexpected observation, and suggested relatively free and rapid diffusion of GFP in the mitochondrial matrix.
Photobleaching experiments were done to confirm that the recovery curves in Fig. 1 B represent GFP translational diffusion in the matrix. Fluorescence recovery was sensitive to laser spot diameter (Fig. 2 A), with t 1/2 of 17 ± 2, 61 ± 6, and 305 ± 28 ms for diameters of 0.8, 1.3, and 4 μm, respectively. t 1/2 would not depend on spot size if recovery were due to reversible GFP photobleaching such as that involving triplet state relaxation (Periasamy et al., 1996; Swaminathan et al., 1996). Further evidence that the fluorescence recovery results exclusively from GFP translational diffusion is that paraformaldehyde fixation, which immobilizes GFP without affecting its fluorescence, abolished the recovery (Fig. 2 B). Therefore, the recovery signal arises from irreversible GFP bleaching and diffusion of unbleached GFP into the bleached area. Finally, it was predicted that increased bleach time would result in a decreased rate and extent of recovery due to the finite length and volume of individual mitochondria. As bleach time increases, unbleached GFP from outside of the bleach spot diffuses into the bleach beam, effectively widening the bleach zone and depleting unbleached GFP from the matrix. Fig. 2 C shows that increased bleach time gives slowed and less complete fluorescence recovery, with no recovery for very long (500 ms) bleach time. By visual inspection, individual mitochondria of 4–7 μm length could be made nonfluorescent by a 500-ms bleach time (0.8-μm-diam spot), indicating a continuously open mitochondrial lumen.
Figure 2.

Photobleaching of GFP-labeled mitochondria in CHO cells. (A) Photobleaching with 40 μs bleach time using indicated objectives. Corresponding spot diameters in the focal plane were 0.8 (100×), 1.3 (60×), and 4 μm (20×). (B) Photobleaching as in A. (100× objective) in cells after 6 h fixation in 4% paraformaldehyde. (C) Photobleaching (100× objective) with indicated bleach times. Laser intensity was adjusted to give 20–30% bleach depth. (D) Effect of mitochondrial configuration on GFP diffusion. Cells were incubated with PBS, an hypoosmolar solution (150 mOsm, 1:1 PBS/water), or an hyperosmolar solution (600 mOsm, PBS + 300 mM sucrose) for 5–15 min before bleaching. Each curve is the average of 10–15 fluorescence recovery curves from different cells.
Mitochondria can assume two configurations that are interconvertable in response to metabolic status (Hackenbrock, 1968; Halestrap, 1989; Scalettar et al., 1991): an orthodox state where the matrix takes up ∼90% of mitochondrial volume and a condensed state where the matrix contracts to ∼55%. Experimental induction of the condensed state by hyperosmolality slowed fluorescence recovery giving a t 1/2 of 41 ± 4 ms (Fig. 2 D). Similar results were obtained with 2-deoxyglucose to induce the condensed state. Recovery was the same in isosmolar and hypoosmolar solutions (15–17 ms), consistent with the expectation that under normal metabolic conditions mitochondria are in the orthodox state.
To relate t 1/2 to diffusion coefficients (D) for GFP translational mobility in the mitochondrial matrix, a mathematical model was developed that predicted fluorescence recovery from laser spot diameter, mitochondrial geometry, and D (see Appendix). Fig. 3 A (top) shows a mitochondrion as a cylinder of length 2L with laser beam of diameter 2h. The beam is directed to a spot at position ε along the mitochondrial axis. For this simple situation, Fig. 3 B shows the computed time evolution of unbleached fluorophores along the mitochondrion (see legend for parameters). There is progressive broadening of the bleached area as diffusion along the axis of the mitochondrial matrix occurs. The fluorescence distribution is uniform throughout the matrix at infinite time, but lower than initial fluorescence because of the finite matrix volume. To compute the fluorescence recovery kinetics, F(t), for FRAP studies as done in Fig. 1 B, the diffusion equation was solved taking into account different orientations of mitochondria with respect to the bleach beam (angle θ, Fig. 3 A, bottom) and different bleaching locations along the mitochondrial axis (parameter ε). As given in the Appendix, appropriate integration and normalization was done over the probe beam zone, as well as over parameters θ and ε.
Figure 3.

Predictions of the model for solute diffusion in the mitochondrial matrix. (A) Model of mitochondria as a long thin cylinder with unobstructed lumen oriented at an angle θ. See text and Appendix for details. (B) Time evolution of unbleached fluorophore concentration along the mitochondrial axis. The initial bleach profile is shown as dashed lines. Mitochondrial length was 5 μm, laser spot diameter 0.8 μm and D of 5 × 10⁻⁷ cm2/s. (C) Model predictions for fluorescence recovery at different D for bleaching with 100× objective and short bleach time; bottom, data from CHO cells with fitted D of 2.6 × 10⁻⁷ cm2/s. Model parameters: L = 5 μm, h = 0.4 μm, θmax = 20 degrees. (D) Predicted dependence of measured t 1/2 for fluorescence recovery on diffusion coefficient. D values are indicated for GFP diffusion in mitochondria vs. water and for fluorescein in water. (E) Photobleaching of 1 μM fluorescein in PBS in a 0.5-μm inner diameter glass capillary tube using 25-μs bleach time and indicated objective.
Fig. 3 C shows the predicted time dependence of fluorescence recovery on diffusion coefficient D for relevant model parameters. Recovery rate increased with increasing D, with a best fit to the experimental data for D = 2.6 × 10⁻⁷ cm2/s. As explained in the model development (see Appendix), D values were fairly insensitive to mitochondrial geometry and the precise angular distribution. Fig. 3 D gives the relationship between t 1/2 and D, showing D for GFP in the mitochondrial matrix versus water and fluorescein in water.
A simplified form of the model (open cylinder, where L is infinite) was tested by measuring the fluorescence recovery of an aqueous solution of fluorescein in a thin (∼0.5-μm-diam) glass capillary. Thin capillaries were pulled as done for single cell microinjection (Seksek et al., 1997) and filled with the aqueous solution. Fig. 3 E shows fluorescence recoveries measured with 100× and 20× objectives. Effective beam diameters for these objectives were predicted from optical parameters to be 0.8 and 4 μm, respectively, and confirmed experimentally (Kao et al., 1993). Recovery t 1/2 values of 0.82 and 18 ms were measured using the 100× and 20× objectives, predicting the correct D of 2.5–2.8 × 10⁻⁶ cm2/s.
The GFP translational diffusion coefficients determined above represent a lower limit. In relating t 1/2 to D it was assumed that the mitochondrial lumen does not contain obstructions such as cristae (see Discussion), and that GFP does not bind to matrix components. To estimate the mobile fraction of GFP and to determine the GFP rotational diffusion coefficient, time-resolved anisotropy decay was measured by frequency-domain microfluorimetry. In water, GFP has a fluorescence lifetime of ∼2.8 ns and rotates freely with an apparent correlation time of 20 ns (Swaminathan et al., 1997). The fluorescence lifetime of GFP in mitochondria was 2.4–2.7 ns and the GFP rotational correlation time was 23.3 ± 1 ns (n = 10; Fig. 4 A), similar to that of 20 ns in water. Therefore, GFP is not bound and the matrix does not hinder GFP rotation. This result is consistent with the paradigm that rotation of unbound solutes is affected only to a small extent even in crowded media (Fushimi and Verkman, 1991).
Figure 4.

Solute rotation in the mitochondrial matrix measured by time-resolved anisotropy. Phase-modulation plots of differential phase angle (filled circles) and modulation factor (open circles) as a function of modulation frequency. (A) GFP rotation in the mitochondrial matrix of CHO cells. Fitted curves correspond to a rotational correlation time of 21.4 ns (lifetime 2.5 ns, limiting anisotropy ro 0.4). Dashed curves shown for 15 and 35 ns correlation times. (B) Rotation of BCECF in the matrix of isolated liver mitochondria. Curves correspond to rotational correlation times of 0.35 and 46 ns with a fractional amplitude of the fast component of 0.56 (lifetime 3.6 ns, ro 0.392). Dashed curves shown for short correlation times of 0.2 and 0.6 ns.
As explained in the Introduction, the steady state anisotropy of CF in the matrix of isolated mitochondria was reported to be high, suggesting hindered diffusion (Scalettar et al., 1991). Our results with GFP in the mitochondrial matrix of living cells suggest that much smaller molecules like CF or BCECF should diffuse rapidly unless highly bound. To resolve this apparent discrepancy, we reexamined the rotational mobility of BCECF in suspensions of freshly isolated mitochondria from rat liver. The BCECF steady state anisotropy was measured to be 0.23 ± 0.01, similar to that of ∼0.25 reported for CF by Scalettar et al. (1991). A fluorescence lifetime of 3.5–3.7 ns was found for BCECF in the matrix, the same as that in saline. Analysis of time-resolved anisotropy (Fig. 4 B) indicated anisotropic rotation with two correlation times: a short time of 325 ± 11 ps (fraction 0.51) corresponding to rapid rotation of unbound BCECF, and a longer time of 59 ± 4 ns for bound BCECF (n = 20). Short rotational correlation times (260–375 ps) were also measured in mitochondria that were suspended in buffers with osmolalities of 200–600 mOsm. Control measurements on mitochondria with different amounts of BCECF labeling (by changing concentration and labeling time) and different amounts of solution scattering (by adding unlabeled mitochondria) indicated no depolarization or scattering artifact (not shown). These results indicate rapid rotational diffusion of a metabolite-size solute in the mitochondrial matrix, and that the high BCECF steady state anisotropy is related to BCECF binding rather than to slowed aqueous-phase rotational diffusion.
As discussed below, one proposed explanation for the rapid diffusion of GFP in the matrix is that many matrix proteins reside in membrane-associated complexes so as to create an uncrowded central aqueous space. To investigate this possibility, we tried to measure the mobility of a soluble protein normally present in the matrix. Fusion constructs were made in which GFP was fused downstream and in-frame from several different matrix enzymes (very long chain acyl CoA dehydrogenase, α and β subunits of rat mitochondrial fatty acid β-oxidation multienzyme complex, δ-aminolevulinate synthase). Transient expression of each of these constructs gave GFP targeting to a vesicular compartment with poor mitochondrial localization. After testing various other GFP-fusion constructs, selective mitochondrial targeting was achieved by inserting the α or β subunits of the rat mitochondrial fatty acid β-oxidation multienzyme complex (Kamijo et al., 1993) downstream from the COX8-GFP construct (Fig. 5 A). Transfected cells had the same appearance as those expressing the COX8-GFP cDNA, and immunoblot analysis with GFP antibody showed the predicted sizes of the fusion proteins. Fig. 5 B shows photobleaching results for CHO cells transfected in parallel with the COX8-GFP and the two fusion constructs. Whereas the majority of the unconjugated GFP (from COX8-GFP cDNA) was mobile and diffused rapidly as found above, the GFP-fusion proteins had little mobility. These results suggest that the fusion proteins bind strongly to slowly moving components of the matrix or are located in a highly viscous subcompartment of the matrix.
Figure 5.
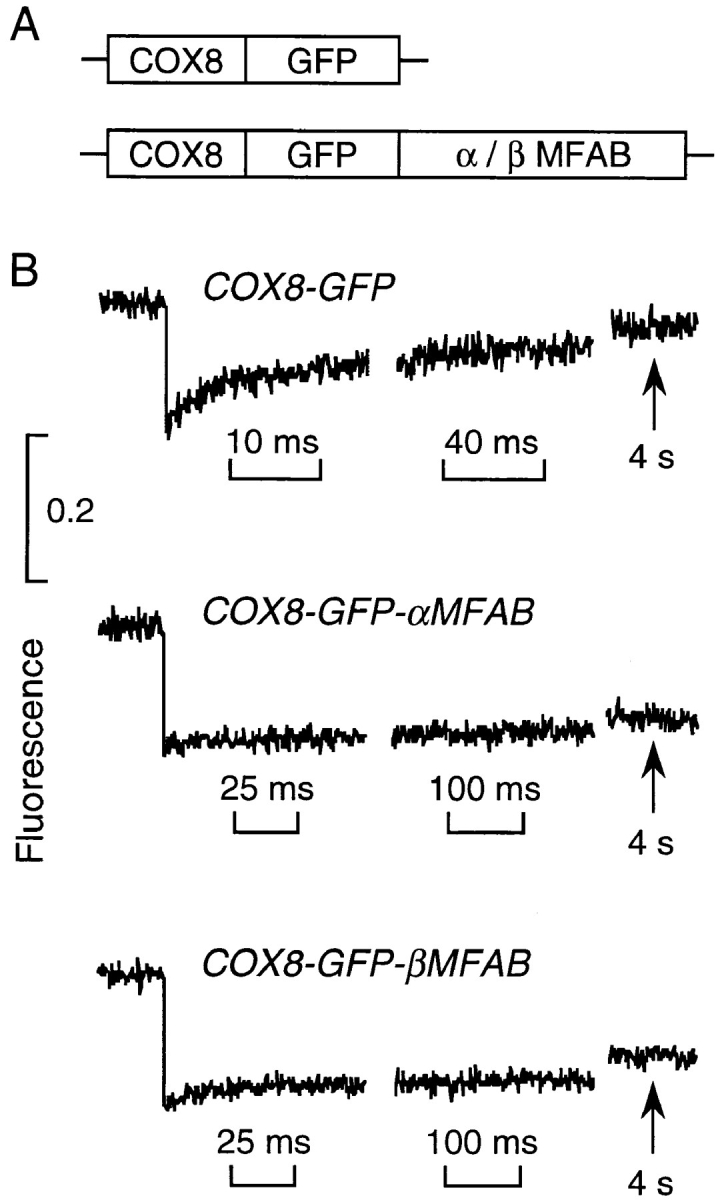
Translational diffusion of GFP in fusion with two soluble matrix enzymes. (A) Fusion constructs containing the targeting presequence of subunit VIII of human cytochrome c oxidase (COX8) and the αMFAB and βMFAB. See text for explanations. (B) Photobleaching of transfected CHO cells was carried out under the conditions as in Fig. 1. Each curve is the average of 10–15 fluorescence recovery curves from different cells.
Discussion
The mitochondrion is the cellular organelle involved in oxidative metabolism and energy production. It is spatially organized into a porous outer membrane, an intermembrane space, an inner membrane, and an inner aqueous compartment known as the matrix. The inner membrane is the site of the electron transport pathway, whereas the matrix is the site of numerous biochemical events such as the tricarboxylic acid cycle and the fatty acid oxidation pathway. Although both the sites and sequences of these and other mitochondrial reactions are well established, little is known about the spatial organization of metabolism or the diffusional mobilities of enzymes and substrates. It is widely believed that mitochondrial enzymes and substrates are spatially organized and fairly static (for review see Ovadi, 1995). It has even been proposed that mitochondrial water is in an organized or vicinal state, and that protein crowding in the matrix changes the basic physical chemistry of enzyme reactions. This study was done to measure for the first time the translational mobility of molecular solutes in the matrix.
Several a priori considerations predict that solute translational diffusion in the mitochondrial matrix might be slow and severely hindered. Polymer theory (Phillies, 1987, 1989; Han and Herzfeld, 1993) and measurements of solute diffusion in solutions containing dextrans and proteins (Furakawa et al., 1991; Kao et al., 1993) suggest that solute diffusion time (proportional to inverse diffusion coefficient) is an increasing exponential function of the concentration of macromolecular solutes. Thus, it is predicted that the diffusion of a small solute in the crowded mitochondrial matrix (27–56 vol% solids) might be slowed by 50–1,000-fold compared with its diffusion in water. The translational diffusion of larger, enzyme-sized solutes might be slowed even more. In addition, recent measurements of the motion of FITC-dextrans and Ficolls (4–2,000 kD) in cytoplasm suggest a percolation phenomenon (Seksek et al., 1997), where the translational diffusion of solutes greater than a certain size is severely hindered. The percolation threshold is predicted theoretically to be strongly dependent on obstacle density (Saxton, 1993), and it was found that the motion of even small FITC-dextrans was hindered in shrunken cells (Seksek et al., 1997). Together these considerations suggest that the mitochondrial matrix, if it is indeed a crowded protein solution, would severely hinder solute diffusion.
Our strategy to measure the mobility of enzyme-size macromolecules in the mitochondrial matrix of living cells was to target GFP fusion constructs to the matrix and to use biophysical methods to measure GFP diffusion. GFP has suitable photophysical properties for use as a probe of solute mobility. The three–amino acid chromophore in GFP is fixed rigidly within a barrel structure (Yang et al., 1996; Örmo et al., 1996). The consequent absence of depolarizing GFP rotations due to segmental chromophore motion permits interpretation of the GFP rotational correlation time in terms of the microviscosity of surrounding fluid (Swaminathan et al., 1997). The brightness, relative photostability (compared with fluorescein), and irreversible photobleaching properties of GFP facilitate the measurement of its translational diffusion. Recent measurements of GFP translational diffusion in cytoplasm (Swaminathan et al., 1997) are in agreement with measurements of the diffusion of comparably-sized FITC-dextrans and Ficolls (Seksek et al., 1997). Although individual mitochondria were easily visualized by fluorescence microscopy at high magnification, rapid photobleaching could not easily be done on single mitochondria because of the poor signal-to-noise ratios associated with wide amplifier bandwidth and practical difficulties in locating and targeting single mitochondria by the probe beam with minimal bleaching. Our approach was to use signal averaging by measuring the fluorescence recovery of multiple mitochondria. The fluorescence recovery signals obtained from multiple mitochondria were quite good; however, the quantitative determination of absolute diffusion coefficients required the development of a mathematical model of solute diffusion in the mitochondrial matrix.
The mathematical model was used to deduce diffusion coefficients from fluorescence recovery kinetics. The model assumed the mitochondrial matrix to be a thin cylinder of specified length without internal barriers. The curved shape of some mitochondria (see Fig. 1 A) would have little effect on the validity of the one-dimensional computation since mitochondria are thin and have small radii of curvature compared with beam diameter. Average mitochondrial length and the angular spread of orientations were estimated from serial confocal micrographs. It was assumed that bleach time is very short compared with diffusional recovery time. This assumption is valid even for the 100× objective where the bleach time of <0.25 ms was much less than the recovery times of 15–20 ms. The computations shown were done for uniform beam profile. As discussed by Axelrod et al. (1976) for conventional two-dimensional spot photobleaching, this approximation is reasonably valid for practical laser/lens systems; the same considerations would apply for bleaching of long thin mitochondria where bleach profile is nearly constant across the thin cylindrical matrix compartment. The determination of absolute diffusion coefficient by the model was validated experimentally by measurements of fluorescein diffusion in water that was confined to thin capillary tubes. In addition, the model was found to be fairly insensitive to exact values of the mitochondrial length and angular distribution parameters.
From these considerations, the assumption of most questionable validity in the computation of GFP diffusion coefficient is that the matrix does not contain internal barriers. Electron micrographs of mitochondria show cristae of various sizes and shapes that may be cell type specific. Notwithstanding the potential of fixation artifacts in the micrographs, the dimensions of the cristae generally appear to be small compared with mitochondrial diameter. Therefore, the D values reported here must formally be considered as lower limits to actual D. We recently used a Monte-Carlo random walk approach to quantify the effect of fixed barriers on diffusion in complex organellar geometries (Ölveczky and Verkman, 1998). A general conclusion of the computations on mitochondria-like cylinders was that significant slowing of diffusion required quite large and/or numerous internal cristae-like barriers. In simulated spot photobleaching experiments, an ∼25% decrease in apparent diffusive transport rate required a single thin transverse obstacle occluding 93% of mitochondrial lumen area, a single obstacle occluding 50% of the lumen but of width >0.5 μm, or 10 equally spaced thin 50% obstacles alternately occluding opposite halves of the cylinder. From these considerations, we conclude that the mitochondrial cristae probably have minimal influence on apparent GFP diffusion in mitochondria. In any case, the presence of cristae could only yield a higher GFP diffusion coefficient, which does not affect the principal conclusion of our study concerning free and rapid solute diffusion in the mitochondrial matrix.
The relatively mild hindrance to solute translational diffusion by the matrix was an unexpected observation in view of the theoretical expectations mentioned above. Several explanations for the mild hindrance are proposed. The degree of solute crowding in the mitochondrial matrix has not been accurately determined and may be less than the generally quoted values of 27–56 vol%. An intriguing possibility is that many of the matrix proteins may be organized peripherally in membrane-associated macromolecular complexes. A central region with relatively low protein density and low viscosity might thus be created in which solute diffusion is rapid and unrestricted. Last, it is becoming evident that the description of solute translational diffusion in cellular aqueous compartments will require considerations of anomalous diffusion mechanisms such as percolation, sieving, and possibly superdiffusion and diffusive channeling (Nagle, 1992; Saxton, 1994; Feder et al., 1996). Although preliminary theoretical treatment of these issues has been done for two-dimensional diffusion in membranes (Saxton, 1993, 1994), adequate models do not exist for analysis of anomalous diffusion in three-dimensional cellular aqueous compartments.
Time-resolved anisotropy measurements of BCECF in the matrix of isolated liver mitochondria indicated that the rotational mobility of unbound BCECF was very rapid. A slowly rotating component was also identified and attributed to BCECF binding. The alternative possibility for the slow component, slow rotation of unbound BCECF in a viscous microenvironment, is unlikely based on our previous analyses of BCECF anisotropy decay in various cellular compartments. Rapid rotation of unbound BCECF and slow rotation of bound BCECF were also reported in bulk (Fushimi and Verkman, 1991) and membrane-adjacent (Bicknese et al., 1993) cytoplasm. It was concluded that the rotation of a small unbound fluorophore provides information about the fluid-phase or short-range microviscosity of an aqueous environment. Conceptually, the in situ rotation of a small fluorophore that does not undergo collisional interactions with macromolecular solutes should probe the local aqueous environment; for example, the rotation of fluorescein is not altered in agarose gels or gelatin because the fluid pockets containing fluorescein are water-filled. The results in mitochondria suggest that the fluid environment is waterlike and do not support the existence of vicinal-type water that is much more viscous than normal water. Further, the resolution of the rotation of bound and unbound BCECF in the matrix of liver mitochondria provides an explanation for the high CF steady state anisotropy measured by Scalettar et al. (1991). Thus, as concluded for analysis of fluorophore rotation in cytoplasm (Dix and Verkman, 1990; Fushimi and Verkman, 1991), steady state anisotropy cannot be related directly to aqueous-phase microviscosity.
The significance of enzyme clustering and metabolite channeling in the mitochondrial matrix has been controversial. Metabolite channeling has been described as the sequential transfer, by covalent or noncovalent binding, of metabolites from one active site to another on a clustered assembly of enzymes (Watford, 1990; Ovadi, 1991; Welch and Easterby, 1994). Metabolite channeling would provide an efficient mechanism to accelerate metabolic events if the rate-limiting step is substrate diffusion to an active site on an enzyme rather than the subsequent biochemical reaction. There is a substantial body of kinetic evidence supporting an apparent channeling mechanism for certain metabolic reactions (Ovadi, 1995; Lindbladh et al., 1994; Elcock and McCammon, 1996). The results reported here do not directly address whether metabolic channeling occurs, because it is possible that GFP does not report on the environment in which soluble intermediates move from enzyme to enzyme. But if GFP does report on the environment of soluble intermediates, then the rapid GFP diffusion suggests that channeling mediated by enzyme clusters may not be necessary to overcome solute diffusive barriers. The biophysical measurements indicated rapid and unhindered GFP rotational diffusion in the mitochondrial matrix and only mildly slowed translational diffusion compared with that in water. Solute rotation can occur in nanoseconds and translation across the width of a 0.5-μm mitochondrion in tens of milliseconds. These rates are substantially higher than those of most biochemical reactions. We would propose that enzyme clustering occurs not for metabolite channeling, but for establishing an uncrowded, relatively enzyme-free aqueous space in which solutes can freely diffuse. Thus, enzyme clustering could provide a simple and elegant solution to the problem of maintaining rapid diffusion in a crowded cellular environment.
Appendix
Mathematical Model of Diffusion in Mitochondria
A mathematical model was developed to compute the time course of fluorescence recovery, F(t), in mitochondria as a function of fluorophore diffusion coefficient, D, and mitochondrial geometry. Each mitochondrion was modeled as a cylinder of length 2L, at an orientation defined by angle θ with respect to the laser beam (Fig. 3 A). The laser beam was assumed to have a uniform circular disk profile with radius h. The bleach time was taken to be infinitely short. One-dimensional diffusion (along the length axis of the mitochondrion) of unbleached fluorophore, C(x,t), is described by the diffusion equation:
 |
A1 |
subject to the initial conditions: C(x,0) = (1 − K1)C0 for ε − h < x < ε + h, and C(x,0) = C0 for all other x, and the boundary conditions: dC(−L, t)/dx = dC(L, t)/dx = 0. K1 is the bleach depth that depends on the intensity of the bleach pulse, and the distance between the center of the mitochondrion and the center of the laser beam.
The solution to Eq. A1 with the specified initial and boundary conditions is:
 |
A2 |
where
 |
Eq. A2 describes fluorescence recovery when the laser beam is perpendicular to the axis of the mitochondrion. For a mitochondrion orientated at an angle, θ, the effective laser beam diameter (2h′) is a function of θ: h′(θ) = h/cosθ (see Fig. 3 A). This consideration makes C(x, t, ε) in Eq. A2 a function of θ, C(x, t, ε, θ), where h is replaced by h/cosθ. The fluorescence recovery is computed by averaging the time-dependent fluorescence emission over ε, assuming equal probability for bleaching along the length of the mitochondria:
 |
A3 |
where the mitochondrial orientation is assumed to be random for θ between 0 and θ max. Analysis showed the computed diffusion coefficient to be relatively insensitive to θ max. (Less than 14% change in predicted D for 0 <θ max <45° when t 1/2 = 15 ms.) The cosθ term in the integrand accounts for the random orientational distribution.
The normalized fluorescence, F(t)/F(0), was computed by solving the Eqs. A2 and A3 numerically using an algorithm written in C. The integration step sizes were L/20, π/30, and h/100 for ε, θ, and x, respectively.
Footnotes
1. Abbreviations used in this paper: αMFAB, α-subunit of rat mitochondrial fatty acid β-oxidation multienzyme complex; βMFAB, β-subunit of rat mitochondrial fatty acid β-oxidation multienzyme complex; BCECF, 2,7-bis-(2-carboxyethyl)-5-(and 6-)-carboxyfluorescein; CF, carboxyfluorescein; COX8, targeting presequence of subunit VIII of human cytochrome C oxidase; D, diffusion coefficient; FRAP, fluorescence recovery after photobleaching; GFP, green fluorescent protein (humanized with red-shifted excitation); t 1/2, half-time for fluorescence recovery after photobleaching.
We thank Katherine Chen for cell culture and transfections, Drs. Javier Farinas, Tonghui Ma, and N. Periasamy for advice in design of the GFP constructs and in the computational analysis.
This work was supported by grants DK43840, HL42368, DK35124, and DK16095 from the National Institutes of Health. A. Partikian was the recipient of a summer student stipend from the American Heart Association, California Affiliate.
Address correspondence to Alan S. Verkman, M.D., Ph.D., 1246 Health Sciences East Tower, Cardiovascular Research Institute, University of California, San Francisco, CA 94143-0521. Tel.: (415) 476-8530. Fax: (415) 665-3847. E-mail: verkman@itsa.ucsf.edu
References
- Axelrod D, Koppel DE, Schlessinger J, Elson E, Webb WW. Mobility measurement by analysis of fluorescence photobleaching recovery kinetics. Biophys J. 1976;16:1055–1069. doi: 10.1016/S0006-3495(76)85755-4. [DOI] [PMC free article] [PubMed] [Google Scholar]
- Bicknese S, Periasamy N, Shohet SB, Verkman AS. Cytoplasmic viscosity near the cell plasma membrane: measurement by evanescent field frequency-domain microfluorimetry. Biophys J. 1993;165:1272–1282. doi: 10.1016/S0006-3495(93)81179-2. [DOI] [PMC free article] [PubMed] [Google Scholar]
- Cole NB, Smith CL, Sciaky N, Terasaki M, Edidin M, Lippincott-Schwartz J. Diffusional mobility of Golgi proteins in membranes of living cells. Science. 1996;273:797–801. doi: 10.1126/science.273.5276.797. [DOI] [PubMed] [Google Scholar]
- DeGiorgi F, Brini M, Bastianutto C, Marsault R, Montero M, Pizzo P, Rozzi R, Rizzuto R. Targeting aequorin and green fluorescent protein to intracellular organelles. Gene. 1996;173:113–117. doi: 10.1016/0378-1119(95)00687-7. [DOI] [PubMed] [Google Scholar]
- Dix JA, Verkman AS. Mapping of fluorescence anisotropy in living cells by ratio imaging: application to cytoplasmic viscosity. Biophys J. 1990;57:231–240. doi: 10.1016/S0006-3495(90)82526-1. [DOI] [PMC free article] [PubMed] [Google Scholar]
- Elcock AH, Macammon JA. Evidence for electrostatic channeling in a fusion protein of malate dehydrogenase and citrate synthase. Biochemistry. 1996;35:12652–12658. doi: 10.1021/bi9614747. [DOI] [PubMed] [Google Scholar]
- Feder TJ, Brust-Mascher I, Slattery JP, Baird B, Webb WW. Constrained diffusion or immobile fraction on cell surfaces: a new interpretation. Biophys J. 1996;70:2767–2773. doi: 10.1016/S0006-3495(96)79846-6. [DOI] [PMC free article] [PubMed] [Google Scholar]
- Furakawa R, Arauz-Lara JL, Ware BR. Self-diffusion and probe diffusion in dilute and semidilute aqueous solutions of dextran. Macromolecules. 1991;24:599–605. [Google Scholar]
- Fushimi K, Verkman AS. Low viscosity in the aqueous domain of cytoplasm measured by picosecond polarization microscopy. J Cell Biol. 1991;112:719–725. doi: 10.1083/jcb.112.4.719. [DOI] [PMC free article] [PubMed] [Google Scholar]
- Gerdes HH, Kaether C. Green fluorescent protein applications in living cells. FEBS Lett. 1996;389:44–47. doi: 10.1016/0014-5793(96)00586-8. [DOI] [PubMed] [Google Scholar]
- Goodsell DS. Inside a living cell. Trends Biochem Sci. 1991;16:203–206. doi: 10.1016/0968-0004(91)90083-8. [DOI] [PubMed] [Google Scholar]
- Hackenbrock CR. Chemical and physical fixation of isolated mitochondria in low energy and high energy states. Proc Natl Acad Sci USA. 1968;61:598–605. doi: 10.1073/pnas.61.2.598. [DOI] [PMC free article] [PubMed] [Google Scholar]
- Hackenbrock CR, Chazotte B, Gupte SS. The random collision model and a critical assessment of diffusion and collision in mitochondrial electron transport. J Bioenerg Biomembr. 1986;18:331–368. doi: 10.1007/BF00743010. [DOI] [PubMed] [Google Scholar]
- Halestrap AP. The regulation of the matrix volume of mammalian mitochondria in vivo and in vitro and its role in the control of mitochondrial metabolism. Biochim Biophys Acta. 1989;973:355–382. doi: 10.1016/s0005-2728(89)80378-0. [DOI] [PubMed] [Google Scholar]
- Han J, Herzfeld J. Macromolecular diffusion in crowded solutions. Biophys J. 1993;65:1155–1243. doi: 10.1016/S0006-3495(93)81145-7. [DOI] [PMC free article] [PubMed] [Google Scholar]
- Kamijo T, Aoyama T, Miyazaki J, Hashimoto T. Molecular cloning of the cDNAs for the subunits of rat mitochondrial fatty acid β-oxidation multienzyme complex. J Biol Chem. 1993;268:26452–26460. [PubMed] [Google Scholar]
- Kao HP, Verkman AS. Construction and performance of a FRAP instrument with microsecond time resolution. Biophys Chem. 1996;59:203–210. doi: 10.1016/0301-4622(95)00139-5. [DOI] [PubMed] [Google Scholar]
- Kao HP, Abney JR, Verkman AS. Determinants of the translational diffusion of a small solute in cytoplasm. J Cell Biol. 1993;120:175–184. doi: 10.1083/jcb.120.1.175. [DOI] [PMC free article] [PubMed] [Google Scholar]
- Lindbladh C, Brodeur RD, Lilius G, Bulow L. Metabolic studies on saccharomyces cervisiae containing fused citrate synthase malate dehydrogenase. Biochemistry. 1994;94:11684–11691. doi: 10.1021/bi00205a003. [DOI] [PubMed] [Google Scholar]
- Nagle JF. Long tail kinetics in biophysics? . Biophys J. 1992;63:366–370. doi: 10.1016/S0006-3495(92)81602-8. [DOI] [PMC free article] [PubMed] [Google Scholar]
- Ölveczky, B.P., and A.S. Verkman. 1998. Monte-Carlo analysis of obstructed diffusion in 3 dimensions: application to molecular diffusion in organelles. Biophys. J. In press. [DOI] [PMC free article] [PubMed]
- Ormö M, Cubitt AB, Kallio K, Gross LA, Tsien RY, Remington SJ. Crystal structure of the Aequorea victoria green fluorescent protein. Science. 1996;273:1392–1395. doi: 10.1126/science.273.5280.1392. [DOI] [PubMed] [Google Scholar]
- Ovadi J. Physiological significance of metabolic channeling. J Theor Biol. 1991;152:1–22. [PubMed] [Google Scholar]
- Ovadi, J. 1995. Cell Architecture and Metabolic Channeling. R.G. Landes Co. Austin, TX.
- Periasamy N, Bicknese S, Verkman AS. Reversible photobleaching of fluorescein conjugates in air-saturated viscous solutions: molecular tryptophan as a triplet state quencher. Photochem Photobiol. 1996;63:265–271. doi: 10.1111/j.1751-1097.1996.tb03023.x. [DOI] [PubMed] [Google Scholar]
- Phillies GDJ. Dynamics of polymers in concentrated solutions: the universal scaling equation derived. Macromolecules. 1987;20:558–564. [Google Scholar]
- Phillies GDJ. The hydrodynamic scaling method for polymer self-diffusion. J Phys Chem. 1989;93:5029–5039. [Google Scholar]
- Robinson JB, Srere PA. Organizations of Krebs tricarboxylic acid cycle enzymes in mitochondria. J Biol Chem. 1985;260:10800–10805. [PubMed] [Google Scholar]
- Rizzuto R, Simpson AWM, Brini M, Pozzan T. Rapid changes of mitochondrial Ca2+revealed by specifically targeted aequorin. Nature. 1992;358:325–327. doi: 10.1038/358325a0. [DOI] [PubMed] [Google Scholar]
- Rizzuto R, Brini M, Pizzo P, Murgia M, Pozzan T. Chimeric green fluorescent protein as a tool for visualizing subcellular organelles in living cells. Curr Biol. 1995;5:636–642. doi: 10.1016/s0960-9822(95)00128-x. [DOI] [PubMed] [Google Scholar]
- Saxton MJ. Lateral diffusion in an archielago. Dependence on tracer size. Biophys J. 1993;64:1053–1062. doi: 10.1016/S0006-3495(93)81471-1. [DOI] [PMC free article] [PubMed] [Google Scholar]
- Saxton MJ. Anomalous diffusion due to obstacles: a Monte Carlo study. Biophys J. 1994;66:394–401. doi: 10.1016/s0006-3495(94)80789-1. [DOI] [PMC free article] [PubMed] [Google Scholar]
- Scalettar BA, Abney JR, Hackenbrock CR. Dynamics, structure, and function are coupled in the mitochondrial matrix. Proc Natl Acad Sci USA. 1991;88:8057–8061. doi: 10.1073/pnas.88.18.8057. [DOI] [PMC free article] [PubMed] [Google Scholar]
- Schneider WC. Intracellular distribution of enzymes III. The oxidation of octanoic acid by rat liver fractions. J Biol Chem. 1948;176:259–266. [PubMed] [Google Scholar]
- Seksek O, Biwersi J, Verkman AS. Direct measurement of trans-Golgi pH in living cells and regulation by second messengers. J Biol Chem. 1995;270:4967–4970. doi: 10.1074/jbc.270.10.4967. [DOI] [PubMed] [Google Scholar]
- Seksek O, Biwersi J, Verkman AS. Translational diffusion of macromolecule-size solutes in cytoplasm and nucleus. J Cell Biol. 1997;138:131–142. doi: 10.1083/jcb.138.1.131. [DOI] [PMC free article] [PubMed] [Google Scholar]
- Somogyi B, Karasz F, Tron L, Couchman PR. The effect of viscosity on the apparent decomposition rate of enzyme-ligand complexes. J Theor Biol. 1987;74:209–216. doi: 10.1016/0022-5193(78)90072-3. [DOI] [PubMed] [Google Scholar]
- Srere PA. The infrastructure of the mitochondrial matrix. Trends Biochem Sci. 1980;5:120–121. [Google Scholar]
- Srere PA. Complexes of sequential metabolic enzymes. Annu Rev Biochem. 1987;56:89–124. doi: 10.1146/annurev.bi.56.070187.000513. [DOI] [PubMed] [Google Scholar]
- Srere PA, Ovadi J. Enzyme-enzyme interactions and their metabolic role. A minireview. FEBS Lett. 1990;268:360–367. doi: 10.1016/0014-5793(90)81286-w. [DOI] [PubMed] [Google Scholar]
- Swaminathan R, Bicknese S, Periasamy N, Verkman AS. Cytoplasmic viscosity near the cell plasma membrane: translation of BCECF measured by total internal reflection-fluorescence photobleaching recovery. Biophys J. 1996;71:1140–1151. doi: 10.1016/S0006-3495(96)79316-5. [DOI] [PMC free article] [PubMed] [Google Scholar]
- Swaminathan R, Hoang CP, Verkman AS. Photochemical properties of green fluorescent protein GFP-S65T in solution and transfected CHO cells: analysis of cytoplasmic viscosity by GFP translational and rotational diffusion. Biophys J. 1997;72:1900–1907. doi: 10.1016/S0006-3495(97)78835-0. [DOI] [PMC free article] [PubMed] [Google Scholar]
- Verkman AS, Armijo M, Fushimi K. Construction and evaluation of a frequency-domain epifluorescence microscope for lifetime and anisotropy decay measurements in subcellular domains. Biophys Chem. 1991;40:117–125. doi: 10.1016/0301-4622(91)85036-p. [DOI] [PubMed] [Google Scholar]
- Von Hippel PH, Berg OG. Facilitated target location in biological systems. J Biol Chem. 1989;264:675–678. [PubMed] [Google Scholar]
- Watford M. A “swell” way to regulate metabolism. Trends Biochem Sci. 1990;15:329–330. doi: 10.1016/0968-0004(90)90065-j. [DOI] [PubMed] [Google Scholar]
- Welch GR. On the role of organized multienzyme systems in cellular metabolism: a general synthesis. Prog Biophys Mol Biol. 1977;32:103–191. [PubMed] [Google Scholar]
- Welch GR, Easterby JS. Metabolic channeling versus free diffusion: transition-time analysis. Trends Biochem Sci. 1994;19:193–197. doi: 10.1016/0968-0004(94)90019-1. [DOI] [PubMed] [Google Scholar]
- Westerhoff HV, Welch GR. Enzyme organization and the direction of metabolic flow: physicochemical considerations. Curr Top Cell Regul. 1992;33:361–390. doi: 10.1016/b978-0-12-152833-1.50026-5. [DOI] [PubMed] [Google Scholar]
- Yang F, Moss LG, Phillips GN., Jr The molecular structure of green fluorescent protein. Nat Biotechnol. 1996;14:1246–1251. doi: 10.1038/nbt1096-1246. [DOI] [PubMed] [Google Scholar]