

Abstract
Actin in eukaryotic cells is found in different pools, with filaments being organized into a variety of supramolecular assemblies. To investigate the assembly and functional relationships between different parts of the actin cytoskeleton in one cell, we studied the morphology and dynamics of cables and patches in yeast. The fine structure of actin cables and the manner in which cables disassemble support a model in which cables are composed of a number of overlapping actin filaments. No evidence for intrinsic polarity of cables was found.
To investigate to what extent different parts of the actin cytoskeleton depend on each other, we looked for relationships between cables and patches. Patches and cables were often associated, and their polarized distributions were highly correlated. Therefore, patches and cables do appear to depend on each other for assembly and function.
Many cell types show rearrangements of the actin cytoskeleton, which can occur via assembly or movement of actin filaments. In our studies, dramatic changes in actin polarization did not include changes in filamentous actin. In addition, the concentration of actin patches was relatively constant as cells grew. Therefore, cells do not have bursts of activity in which new parts of the actin cytoskeleton are created.
Keywords: actin, cytoskeleton, yeast, fluorescence microscopy, 3-D reconstructions
How the actin cytoskeleton of eukaryotic cells assembles and functions, including how its assembly relates to its function, are fundamental problems in cell biology. Actin is organized into different pools, both filamentous and nonfilamentous. For example, in cultured fibroblasts, some nonfilamentous actin is organized as foci that form in the cell periphery and move centripetally with the actin cytoskeleton. Filamentous actin is found in a variety of supramolecular assemblies, such as networks, bundles, and foci. These pools can be highly dynamic, changing their size and distribution during development and differentiation and as part of cell physiology in normal and disease states. These changes may involve assembly or movement of actin in the form of these different pools.
Important questions at present include why these different pools of actin exist, how they are organized into the pools, what their individual functions are, and how they depend on each for their assembly and function. In particular, the dynamics of how actin behaves with respect to the pools is a timely question for many cell types.
Yeast is a good model organism in which to study these questions because yeast has a relatively simple actin cytoskeleton and offers powerful experimental tools. The filamentous actin of the yeast actin cytoskeleton is found in two morphologically identified pools, patches and cables, which are similar in certain aspects to the pools of filamentous actin found in other eukaryotic cells.
Patches are foci of actin and actin-binding proteins located near the plasma membrane, based on fluorescence microscopy and thin-section immunoelectron microscopy studies (28, 38). Immunoelectron microscopy has also revealed that patches are associated with plasma membrane invaginations and contain thin filaments whose width is similar to that of actin filaments (38). Other electron microscopy studies have described “undulations” of the plasma membrane and filamentous aggregates termed “filasomes” (8). The relationship of these structures to actin patches is unclear. Patches move along the plasma membrane (45). Cultured vertebrate cells have recently been found to contain dynamic motile patches of filamentous actin in association with membranes (Schafer, D.A., M.D. Welch, L.M. Machesky, and S.M. Meyer, manuscript submitted for publication). Yeast and vertebrate patches have a number of similar components, including capping protein and Arp2/3 complex. One key difference is that actin polymerization is necessary for the motility of vertebrate patches but not yeast patches.
Cables are fibers that course longitudinally through the cytoplasm. Cables presumably represent bundles of actin filaments. Thin-section electron microscopy has occasionally revealed bundles of thin filaments, whose appearance is similar to that of actin filaments (1, 7). However, the relationship of these electron microscopy filament bundles to the cables observed by fluorescence microscopy is not well established. The number of electron microscopy filament bundles seems to be less than expected based on the number of the cables observed by fluorescence microscopy. In particular, the supramolecular arrangement of filaments within a bundle that comprises a cable is unknown. The locations of the ends of the filaments is not known, and neither is the polarity of the filaments. Many different eukaryotic cell types contain bundles of actin filaments, such as stress fibers and microvilli.
Relationships between patches and cables have been described. In two-dimensional (2-D)1 fluorescence images, patches often appear to be associated with cable ends (28). Thin-section immunoelectron microscopy also indicates that patches and cables may be connected (38). In addition, when patches are clustered, the cables are oriented in the direction of the cluster (28), which is consistent with the idea that cable ends are attached to patches.
The functions of patches and cables, as part of the actin cytoskeleton, are not well defined or understood at a molecular level. Genetic studies implicate actin as necessary for both secretion and endocytosis without specifically indicating a role for patches or cables (for review see reference 9). Since patches are close to the plasma membrane, investigators have speculated that patches may be essential machinery for secretion or endocytosis (1, 38). Cables are speculated to serve as actin tracks for myosin motors to move secretory vesicles to the membrane for exocytosis (25). If cables do end on patches, then the actin tracks may deliver the vesicle to the exocytosis machinery.
Assembly of cables and patches is not well understood. Cells replicate themselves, including their actin cables and patches, as they grow. Where, when, and how the new cables and patches form is not known. The spatial relationship between cables and patches suggests that assembly of one may depend on the other. Many viable mutants have been described that have few or even no cables, but only one viable mutant, bee1/las17, has been described as lacking patches (30). This observation suggests that the assembly of cables may require patches.
To investigate these questions, we have used new fluorescence microscopy techniques, including digital video collection, image deconvolution, and three-dimensional (3-D) reconstruction. We examined yeast cells through the cell cycle, responding to environmental stimuli, and carrying specific mutations, all situations in which the actin cytoskeleton changes its assembly and function. We also observed the dynamics of how patches and cables disassemble in response to a pharmacologic agent that depolymerizes filaments. These results provide new information about the structure and organization of the actin cytoskeleton that bears on actin assembly and function. Cables and patches are often associated, and their distributions change simultaneously, suggesting they are parts of one integrated system. Cables appear to have variable numbers of filaments along their length and show no obvious polarity. Cables are present and the overall concentration of filamentous actin is constant throughout the cell cycle, suggesting that filament rearrangement, as opposed to assembly, may mediate changes in actin distribution. Finally, patches increase in number continuously as budded cells grow, not in bursts.
Materials and Methods
Strains, Media, and Growth Conditions
A diploid wild-type strain, YJC1411 MAT a /MATα leu2/leu2 ura3/ura3 his3-Δ200/his3-Δ200, was used for cell cycle and heat shock experiments. Haploid strains YJC097 MAT a his6 and YJC098 MATα his6 were used for mating experiments. Mutants with an altered actin cytoskeleton included YJC 078 MAT a cap2-1::URA3 leu2 ura3-52 his4-539 (4), RLY157 MAT a bee1Δ::LEU2 ura3-52 his3-Δ200 leu2-3,112 lys2-801 (30), RLY1 MAT a ura3-52 his3-200 leu2-3 lys2-801, RLY193 MAT a arp3::ΔHIS3 ura3-52 his3-200 leu2-3 lys2-801 (pDW25: arp3-2 LEU2) (47), and YJC160 MAT a tpm1-Δ1::URA3 ura3 his3Δ ade2 lys2, a haploid segregant of YJC140 (3, 32). RLY strains were provided by Dr. R. Li (Harvard Medical School, Boston, MA). Strains were grown at 28°C unless noted otherwise.
To image cells at different stages of the cell cycle, we fixed an asynchronous early log phase culture of the diploid YJC1411 in liquid YPD medium (26) (BIO 101, Vista, CA). For heat shock experiments, the diploid YJC1411 in liquid YPD medium at 22°C was diluted 1:10 into 37°C YPD medium, as described (31).
The haploid cells used in mating experiments often formed clumps as they grew, which impaired imaging. To avoid clumps, we prepared unbudded cells with a method slightly modified from a published procedure (6). Liquid YPD cultures were started from a fresh plate. After 16 h, cells were sedimented, suspended in 50% YPD with 1 M sorbitol (Fisher Scientific Co., Pittsburgh, PA), and centrifuged for 5–7 min at 500 g. The supernatant contained 75% unbudded cells, which were collected by filtration.
To obtain cells with mating projections, unbudded cells of YJC097 were treated with 3 μM α-factor (Sigma Chemical Co., St. Louis, MO) in liquid synthetic complete medium (26) for 1 h (43). To obtain zygotes, unbudded cells of YJC097 and YJC098 were mixed, concentrated by sedimentation, and placed on the surface of a YPD plate (26). After 2 h, the cell mixture was suspended and fixed.
Depolymerization of Actin with Latrunculin
Latrunculin A (a gift of Dr. Philip Crews, University of California, Santa Cruz, CA) was added to cells in YPD (6). Several concentrations of latrunculin A were tested in a pilot experiment. 800 μM was the highest concentration tested and gave the maximal effect in terms of speed of disassembly. After 50 s, <10% of cells retained any detectable remnants of cables or patches.
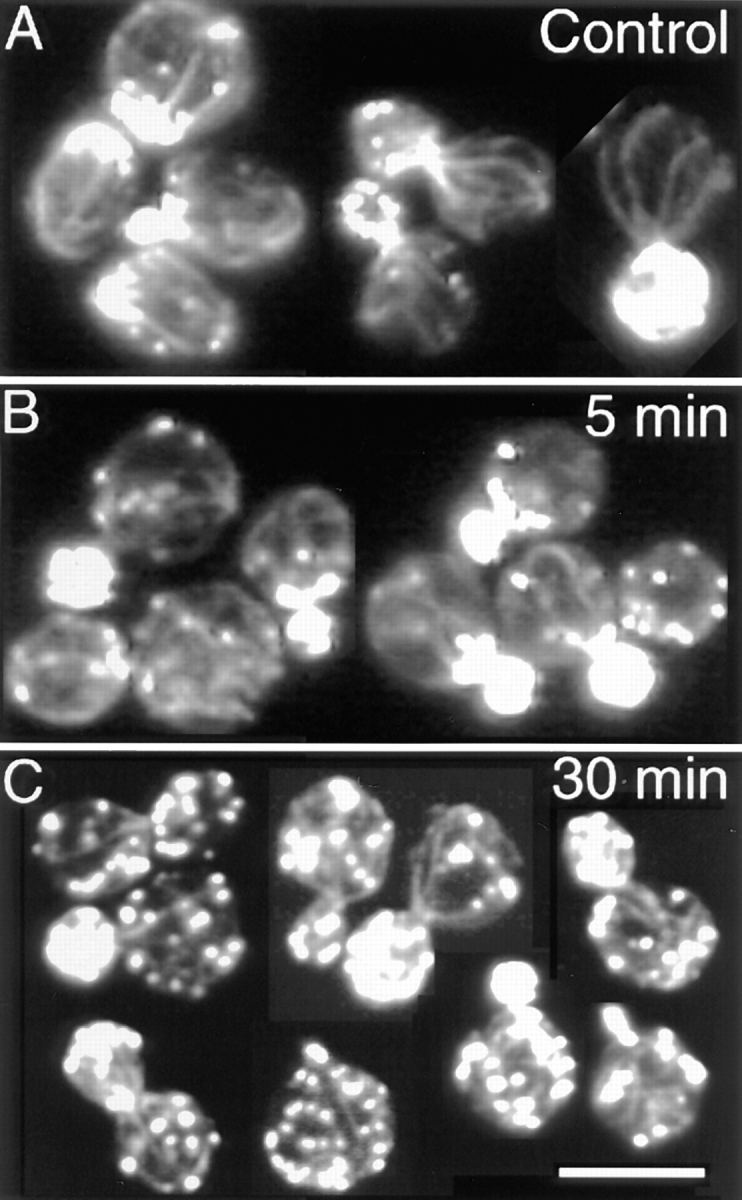
For the experiment in Fig. 2, cell samples were mixed with an equal volume of 2× (1,600 μM) latrunculin A in YPD at room temperature at time zero. At the indicated times, one-tenth volume of 37% formaldehyde was added, and the sample was mixed immediately by trituration. The fixed cells were stained with rhodamine-phalloidin.
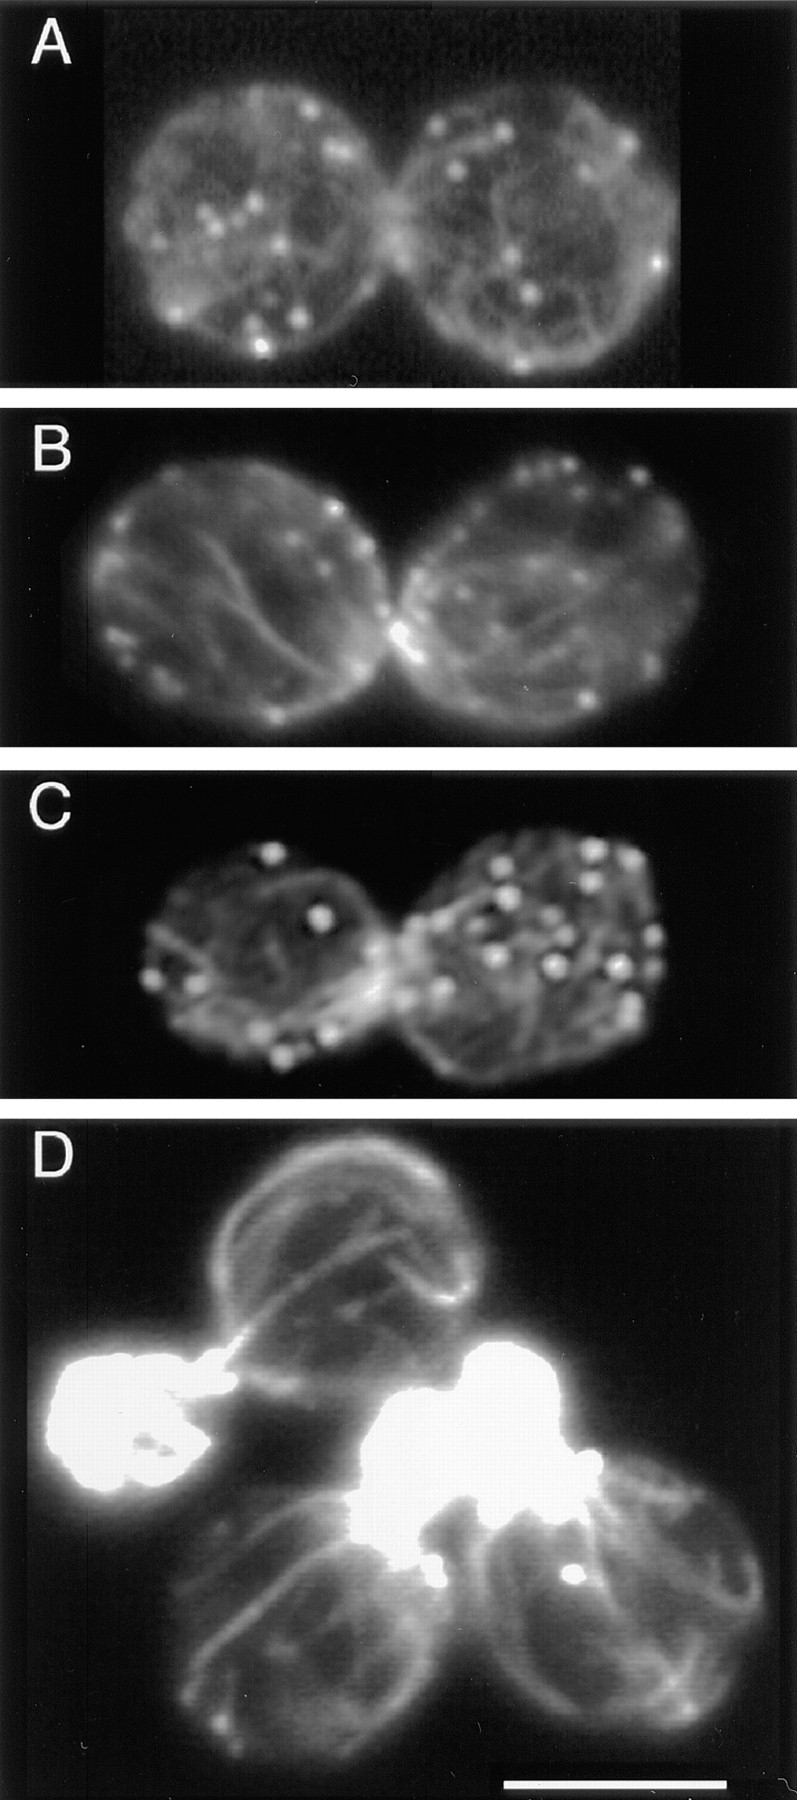
Figure 2.

Filamentous actin disassembly in cells treated with latrunculin. Time points as labeled on the figure. Cells were stained with rhodamine-phalloidin. Bar, 5 μm.
Cell Staining and Image Acquisition
Cells were fixed for 15 min in 3.7% formaldehyde and added directly to the medium from commercial 37% stock (Fisher Scientific). Fixed cells were stained with 0.165 μM rhodamine-phalloidin (Molecular Probes, Eugene, OR) in PBS for 1 h on ice and then washed twice with PBS. This procedure is modified from previous ones (1, 26).
In experiments involving collection of images from only a single focal plane, cells were mounted on conventional glass slides and imaged on a microscope (model Bmax-60F; Olympus America, Inc., Melville, NY) with a 1.35 NA 100X× UPlanApo objective and a U-MNG rhodamine filter set. Photobleaching was reduced by placing a neutral density filter in the excitation light path. Images were collected with a cooled CCD video camera (model 470-DEI-T; Optronics, Goleta, CA).
In experiments involving 3-D reconstructions of cells, optical sectioning was performed. The antibleaching agent p-phenylenediamine (Sigma Chemical Co.) (1 mg/ml) was added. In some experiments (Figs. 3 and 4), small volumes of culture were mounted on conventional glass slides such that cells were immobilized by contact with the coverslip. Agents typically used for cell immobilization were omitted because they enhance background fluorescence. This preparation revealed the features of the actin cytoskeleton, especially thin cables, well. On the other hand, the cells in this preparation were slightly flattened. Therefore, in experiments to prepare rotating 3-D images (Figs. 1, 6, and 7), we avoided cell flattening by mounting cells on multiwell slides (ICN Biomedicals, Inc., Aurora, OH) treated with 1 mg/ml concanavalin A (Vector Laboratories, Burlingame, CA) in water.
Figure 3.

Stereopairs of the actin cytoskeleton in sequential stages of the cell cycle (A–D). Arrows indicate cells with thin cables in a random meshwork. Cells were stained with rhodamine-phalloidin. Deconvolution was with the LLS method (A and D) or the EM method (B and C). Bar, 10 μm.
Figure 4.

Optical sectioning of a large-budded cell with a meshwork of thin cables. The distance (μm) of sequential planes along the z-axis is indicated. This cell is also shown as a stereopair in Fig. 3 D. The cell was stained with rhodamine-phalloidin. Deconvolution was with the PWLS method. Bar, 10 μm.
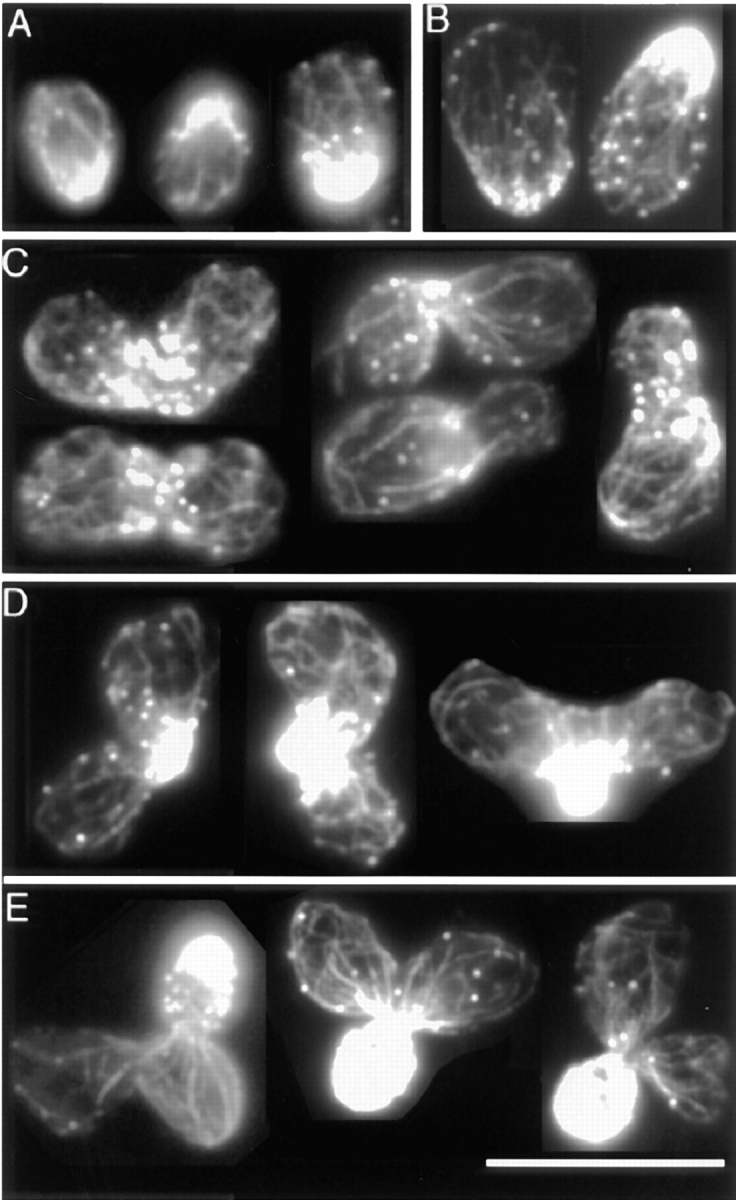
Figure 1.
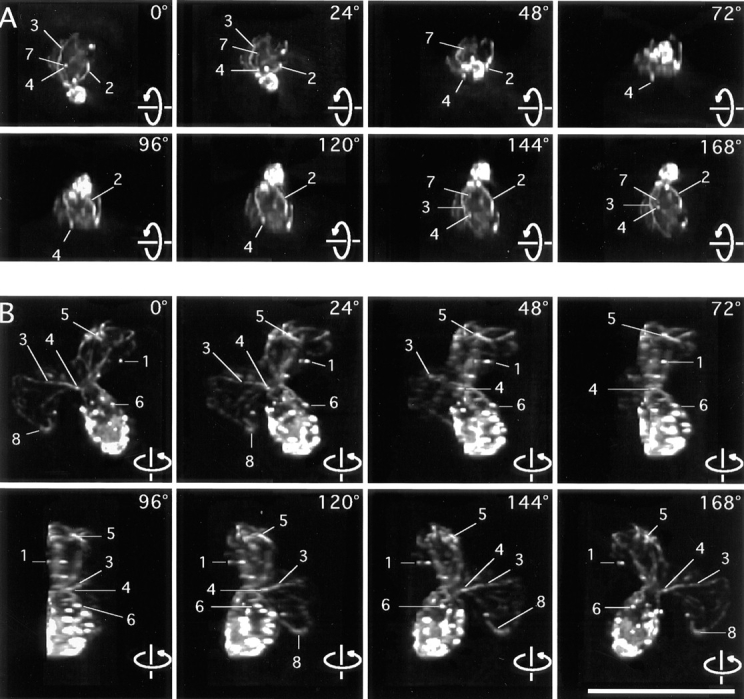
Rotating images of 3-D reconstructions of the actin cytoskeleton. (A) A small-budded cell. (B) A budding zygote. Lines point to features of interest. 1, patches that overlap at certain angles. 2, an elongated patch that appears round at a certain angle of view. 3, a cable of uneven thickness along its length. 4, round patches at the ends of thin cables. 5, an elongated patch at the end of a thick cable. 6, a cable in the bud ending on a patch. 7, a cable end that is free but appears to overlap with a patch at certain angles of view. 8, a cable, both ends of which are not associated with a patch. These frames are sequential 2-D projections of rotating images of a vegetative cell and of a zygote with a step size of 24°. Angles of view are marked. The full data set in each case contains 180 frames with sequential projections at 2° angles. The movies are available at the authors' Web site, www.cooperlab.wustl.edu. Cells were stained with rhodamine-phalloidin. Deconvolution was with the EM method. Bar, 10 μm.
Figure 6.
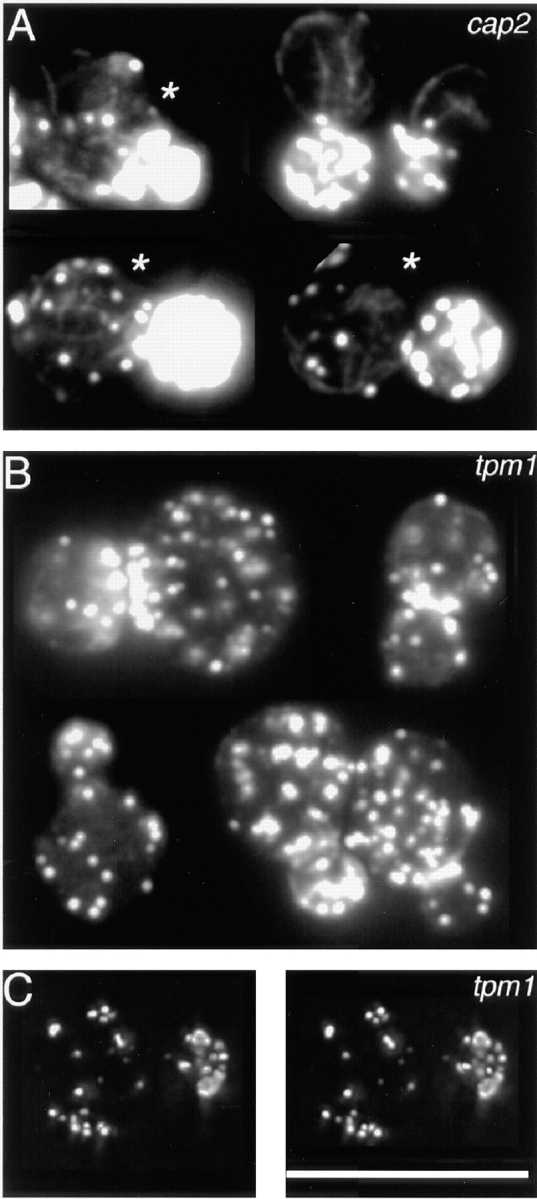
The actin cytoskeleton in cap2Δ (A) and tpm1Δ (B and C) mutants. Single–focal plane images of cells at different stages of the cell cycle are presented in A and B. Asterisks mark the cells with partially delocalized patches, in which cables are thinner and less well oriented than the cables in wild-type cells. C shows a stereopair of a tpm1 cell. A rotating movie of the data set for C, with 180 frames at sequential projections of 2° angles, is available at the authors' Web site, www.cooperlab.wustl.edu. Cells were stained with rhodamine-phalloidin. Deconvolution was with the EM method (C). Bar, 10 μm.
Figure 7.
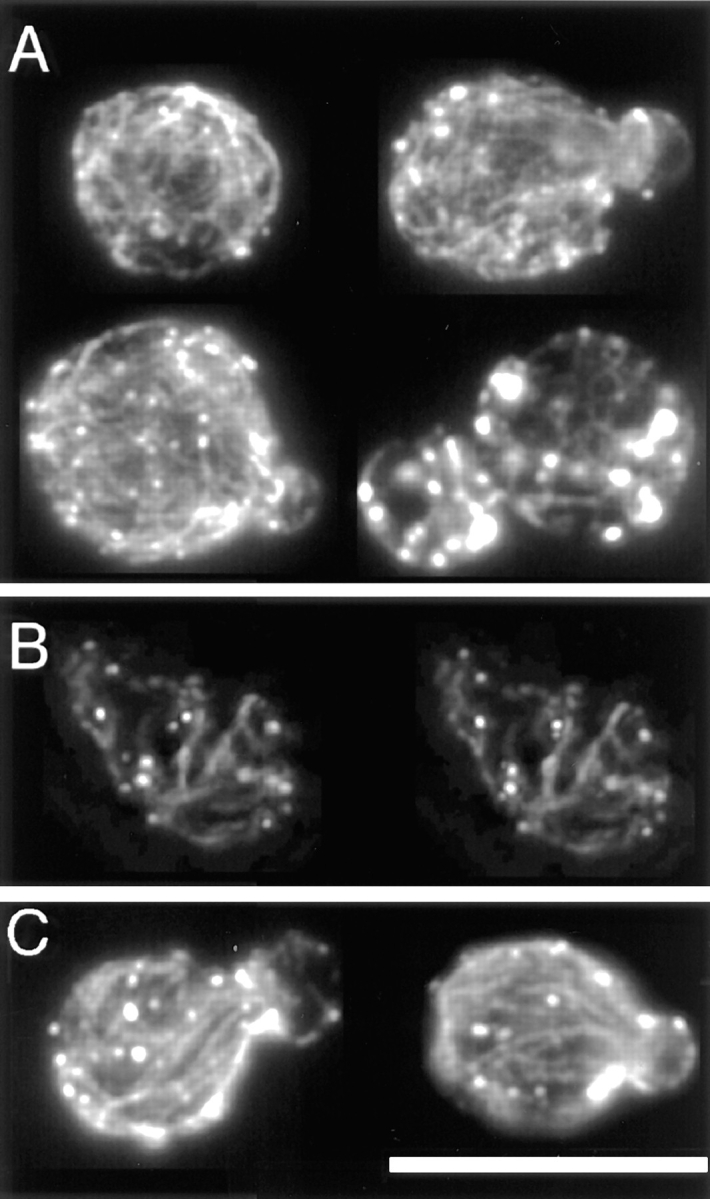
The actin cytoskeleton of the bee1/las17 mutant. (A) Single–focal plane images of four cells at different stages of the cell cycle with a completely random cable meshwork. (B) A stereopair of another such cell. Movie 3 shows rotating images of this cell, with 180 frames at sequential projections of 2° angles. Movies are available at www.cooperlab.wustl.edu. (C) Single– focal plane images of two cells with partial orientation of cables. Cells were stained with rhodamine-phalloidin. Deconvolution was with the EM method. Bar, 10 μm.
Cells were imaged on an inverted microscope (model IMT-2; Olympus America, Inc.) with a 1.4 NA 60× objective and a rhodamine filter set (XF32; Omega Optical, Brattleboro, VT). Images were collected with a 12-bit, scientific-grade, cooled CCD camera (Series 200; Photometrics, Tuscon, AZ) with a KAF 1400 chip. Pixels were not binned, and the pixel size was 0.11 μm in x and y. z steps were set to 0.11 μm, yielding cubic voxels. Image sizes were typically 128 × 128 × 128, which defined a cube with sides ∼14 μm long, large enough to encompass a single cell or a dividing cell.
For rotating 3-D images, images were flat-field corrected for slight spatial variations in the intensity of illumination and the sensitivity of the CCD wells in preparation for deconvolution. First, we corrected for bias and dark current. Bias is the intensity value of a CCD well caused by an imposed voltage on the chip. Bias was measured by recording intensities for a 0-ms exposure time. Dark current is the intensity that arises because of thermal noise. Dark current was measured using the same exposure time as used for a typical experiment but with the shutter closed so that no light reached the CCD chip. Next, we collected 100 images from a uniformly fluorescent plastic slide (Applied Precision, Inc., Mercer Island, WA) using the same region of the CCD chip used for image collection. Bias and dark current were subtracted from each image, and the 100 images were averaged. The averaged image was then used to scale the intensity values at each pixel location in the experimental images of cells.
Image Processing and Deconvolution
The deconvolution procedures used here are designed to restore out-of-focus light to its points of origin in the specimen. Images of a standardized test specimen obtained with these deconvolution procedures are comparable to or in some cases better than those obtained by confocal microscopy (34, 35). These procedures are particularly suited to low light level images with low contrast. The procedures required imaging of 128 focal planes through a single cell without substantial photobleaching.
To obtain a point-spread function (PSF) for deconvolution, we computed a theoretical PSF as supplied by the XCOSM software package (available at www.ibc.wustl.edu/bcl/xcosm, the Institute for Biomedical Computing, Washington University, St. Louis, MO). Previous studies have shown that this theoretical PSF closely matches measured PSFs (33). Moreover, these studies have shown that both measured and theoretical PSFs yield comparable restorations of a well-defined test specimen and that one advantage of the theoretical PSF is lower noise levels in the resultant restoration.
The XCOSM settings for the PSF calculation were the defaults for a 60× 1.4 NA objective (Olympus America, Inc.) except for the thickness into the specimen, which was set at 4.0 μm. The value of 4.0 μm was chosen empirically for producing the least amount of asymmetry in xz and yz profiles. The value is reasonable because yeast cells are ∼5 μm in diameter.
Several aspects of the experimental data presented significant challenges for image deconvolution. First, the apparent diameter of a cable or a patch was ∼0.3–0.4 μm, near the resolution limit of light microscopy. Second, patches and cables differed substantially in average brightness. Consequently, the signal from patches could approach saturation while the cables remained dim.
To address these challenges, we tested three different deconvolution methods. One was a regularized linear least-squares method (LLS) (40). For the images presented here, we set the LLS parameter at 0.0001, which yielded the best compromise between resolution of fine detail and amplification of noise. The LLS method is noniterative, and computations for one image typically required less than a minute running on one 200 MHz R10000 processor of a Silicon Graphics Power Challenge (Mountain View, CA).
The second method was a penalized, weighted least-squares method (PWLS) with a nonnegativity constraint, solved using a preconditioned conjugate gradient method (16). We typically used 80–100 iterations for this method and a penalty value of 5 × 10⁻⁷. Processing times were on the order of 1.5 h on a 175 MHz DEC Station Alpha (Digital Equipment Corporation, Maynard, MA).
The third method was a maximum-likelihood estimation–maximization method (EM) (19). For this method, which converges much more slowly than the PWLS method, we typically used 400 iterations, which required 2 h of computation on a single processor of a Silicon Graphic Power Challenge. The LLS and EM methods are incorporated into the XCOSM software package described above.
Most of the 3-D images were processed by both the EM method and the LLS method. Some images were processed with all three methods. The use of different deconvolution methods for the same image helped to ensure consistency of the results. In general, by restoring out-of-focus light to its points of origin, each method reduced background haze in the specimen, thereby improving contrast. Each method also sharpened structures within the specimen, thereby improving resolution, particularly along the optical axis (or z direction).
When used improperly, all deconvolution methods can produce obviously defective images characterized by, for example, planes that become uniformly brighter than their neighbors, or “ringing” patterns of dark annuli growing in diameter as the focal plane changes. These defects may arise, for example, when not enough out-of-focus light is collected above and below the specimen or when the point-spread function used for restoration is inaccurate. In practice, such limitations arise to some degree in any 3-D image, and some deconvolution algorithms are less sensitive than others to such inaccuracies. In our studies, we found that the EM algorithm was the most robust, yielding no such distortions in any of the images examined.
The EM method failed to resolve extremely thin cables observed in raw images of certain cell types. In these cases, we used the LLS or the PWLS method. LLS was fast to compute but more sensitive to the processing artifacts described above. When such artifacts were observed, PWLS was used. In many cases, none of the deconvolution methods preserved extremely thin cables. When thin cables were not preserved, the 3-D images were not used for analysis of cables. These images were suitable for experiments in which patches were counted.
In all cases, we were able to correlate structures of interest in the processed data with dim or blurred counterparts in the raw data, thereby ensuring that the structures were real and not introduced by the processing method.
In examination of patch shapes, we took into consideration the fact that because of optical constraints, a small structure will be slightly stretched in the z direction (33). To be conservative, we only considered patches to be elongated if they appeared as elongated in the xy plane.
Rotating images and stereoimages were prepared with NIH Image 1.62 (written by Wayne Rasband at the National Institutes of Health, available by anonymous ftp at zippy.nimh.nih.gov). Rotating images are available at the authors' Web site (www.cooperlab.wustl.edu). The authors can supply the movies on CD-ROM or video tape upon request.
Cell Volume
To determine cell volume, the diameters of the mother and the bud along all three axes were measured with NIH Image from either a 3-D fluorescence image or from a 2-D bright-field image focused at the center of the cell. For 2-D images, the height was assumed to be equal to the diameter in the direction perpendicular to the long axis of the cell. Volume was calculated from the diameters assuming that the mother and the bud were prolate spheroids.
Measurement of Filamentous Actin through the Cell Cycle
Filamentous actin levels in different stages of the cell cycle were determined from digital fluorescence images of diploid YJC1411 cells stained with rhodamine-phalloidin as described above. Cells were imaged on a microscope (model Bmax-60F; Olympus America, Inc.) with a 1.35 NA 100× UPlanApo objective and a U-MNG rhodamine filter set. Photobleaching was reduced with neutral density filters in the excitation light path. Images were acquired with a cooled CCD camera (model 300T-RC; DAGE-MTI, Michigan City, IN), a framegrabber (model LG-3; Scion Corporation, Frederick, MD), and a Power Macintosh 9500/132 (Cupertino, CA). Image capturing and measurements of fluorescence intensity were performed with NIH Image 1.62.
The fluorescence intensity associated with each cell was determined. In wide-field microscopy, each focal plane collects the light from the whole specimen, so fluorescence from the specimen at one focal plane adequately represents the fluorescence of the whole specimen. We confirmed this assumption empirically by measuring the fluorescence from several focal planes of the same cell and showing that the fluorescence was constant. For experimental measurements, we imaged the middle focal plane of the cell. Background fluorescence was obtained from a nearby area of the same size and subtracted. The fluorescence intensity of individual cells was normalized to their volume determined as described above.
To determine the level of nonspecific binding of rhodamine-phalloidin, an 1,800-fold molar excess of unlabeled phalloidin was added. The fluorescence intensity normalized to volume was 0 ± 9 (mean ± SEM, n = 20) arbitrary units per fl in the presence of unlabeled phalloidin, and 675 ± 76 (mean ± SEM, n = 23) arbitrary units per fl in the absence of unlabeled phalloidin. Therefore, the amount of nonspecific binding was insignificant, and no correction for nonspecific binding was necessary.
To compare filamentous actin levels with cell cycle stage, we quantitatively determined the position of each cell in the cell cycle from the ratio of bud volume to total volume (46). In addition, cells were divided into three groups based on a qualitative assessment of their morphology. Nuclei were observed by 4′,6-diamidino-2-phenylindole (DAPI) staining. Unbudded cells were called UB. Cells with a bud and a single nucleus (mass of DNA) were called SMB because their bud size was small to medium. Cells with a bud and two nuclei (masses of DNA) were called LB because their bud size was large. The ratio of bud volume to total volume was 4–38% in SMB cells and 37–48% in LB cells.
Measurement of Filamentous Actin in Response to Heat Shock
Filamentous actin levels in response to heat shock were determined in an asynchronous population of YJC1411 cells. First, we examined the time course of actin cytoskeleton depolarization after heat shock. At 1-min time intervals for the first 10 min and 10-min intervals thereafter, we qualitatively assessed the polarization of the actin cytoskeleton in 100 cells. Each cell was scored as having complete, partial, or no polarization. The cells were divided into UB, SMB, and LB groups as defined above. Polarization was lost rapidly and with similar kinetics in all three cell groups. After 10 min, ∼50% of cells were partially or completely depolarized, and after 30 min, 95–100% of cells were partially or completely depolarized. Without heat shock, ∼10% of the cells in each group were partially or completely depolarized at each time point.
These results showed that heat shock rapidly and efficiently induced depolarization of the actin cytoskeleton at all points of the cell cycle, including points at which the actin cytoskeleton is normally polarized. Since the cell population was so homogeneous, we measured the level of filamentous actin in the population as a whole instead of in individual cells as we had done for the cell cycle experiment above. Fluorescence of rhodamine-phalloidin bound to cellular filamentous actin was measured with a fluorometer (FluoroMax; Instruments S.A., Inc., Edison, NJ) as described (31). Fluorescence was normalized to total protein content determined by a Bradford assay.
Patch Counts
We counted patches in 3-D reconstructions of cells at different stages of the cell cycle. Patches were counted in rotating images of seven unbudded cells, eight polarized budded cells, and nine depolarized budded cells. Cells were considered polarized if the mother cell contained <25% patches. Budded cells were chosen for this analysis if their bud was sufficiently large for individual patches to be identified. Budded cells were scored as polarized or depolarized, indicating their cell cycle position as relatively early or late. The ratio of bud volume to total volume was 19– 43% for polarized cells and 37–49% for depolarized cells. Therefore, as expected, depolarized cells were more advanced in the cell cycle than were polarized cells.
Statistical Analyses
The standard error of percentage (SEP) was calculated as described (42). Student's t test was calculated with the QuickTTest program (Dr. S. Ashcroft, John Radcliffe Hospital, Headington, Oxford, UK).
Results
Cable and Patch Morphology
The structure of cables and patches is essential information for understanding the molecular mechanism of their assembly and function. We describe here several features of cable and patch morphology that have not been appreciated in previous studies.
Some microscopy experiments reported here include optical sectioning and 3-D reconstruction. This approach provides a substantial improvement in imaging of cable and patch morphology relative to wide-field and even confocal fluorescence microscopy. To analyze these data, we viewed movies of rotating images, examples of which are available to the reader at the authors' Web site, www. cooperlab.wustl.edu, and can be supplied on CD-ROM or video tape upon request. Some of the advantages of the 3-D reconstructions are illustrated by the features indicated in Fig. 1.
Cables were generally curved or straight, depending on their length. Cables did not have sharp bends at acute angles. These features are consistent with the generally held notion that cables are a bundle of a small number of actin filaments.
The thickness of cables was generally uneven along their length. Cables often contained thick lumps or thin isthmuses (Feature 3 in A and B of Fig. 1/Movie 1). This variation in thickness suggests that the number of actin filaments in a cable may vary along the length of the cable. The ends of the filaments may thus reside at different locations along the cable, not exclusively at the ends of the cables.
Cables occasionally demonstrated branching (4%, 3/69) (Feature 3 in frames 0° and 168° of Fig. 1 A/Movie 1 A), in which thick cables appeared to split into two thinner cables. The presence of branching is consistent with the notion that cables are bundles of actin filaments. The presence of branching indicates that cables may be capable of fusion or fission, which are possible mechanisms for the changes in cables observed in the cell cycle and other conditions, described below.
Patches varied in shape. Some were round (Feature 4 of Fig. 1/Movie 1), while others were rod-shaped (Feature 2 of Fig. 1 A/Movie 1 A and Feature 5 of Fig. 1 B/Movie 1 B). In general, thin cables were associated with round patches, and thick cables were associated with rod-shaped patches. In extreme cases, the boundary between a thick cable and a rod-shaped patch was subtle but distinct. This correlation suggests that the assembly of cables and patches may depend on each other, an issue also addressed later.
Dynamics of Cable and Patch Disassembly
We wish to understand the structure and dynamics of actin filaments in cables and patches. When actin monomers are sequestered and filaments thereby depolymerize, the rate of filament depolymerization depends on the length of the filament and whether the filament is stabilized by other proteins. Therefore, we determined how filaments depolymerize when living cells are treated with the toxin latrunculin, which permeates the plasma membrane and sequesters actin monomers in vivo and in vitro (6, 20, 41).
We determined the concentration of latrunculin that would give the maximal rate of disassembly of filamentous actin in cells. At that concentration, the system most closely approximates the limiting condition in which the actin monomer concentration is zero, and therefore actin subunits only leave from and do not add to filaments. Both cables and patches disassembled and disappeared in less than 1 min. We examined how cables and patches disassemble over this time course by fixing cells at 2-s intervals and staining with rhodamine-phalloidin (Fig. 2). Several aspects of the disassembly process provide important information about the structure and assembly of cables and patches.
First, patches disappear before cables, as seen by their relative absence at 6 s (Fig. 2 B) and 10 s (Fig. 2 C). This result differs from a previous publication in which cables were lost before patches (6). The most likely reason for the difference is the improved ability to detect faint cables here. The strain and concentration of latrunculin also differed but are less likely to account for the difference, in our view.
The disappearance of patches before cables is consistent with the actin filaments in patches being shorter than those in cables, as predicted from the overall dimensions of cables and patches. In vitro, pure actin filaments depolymerize by losing subunits from their two ends combined at a rate of 5–10 per second (39). Patches are almost completely depolymerized at 10 s, which suggests that filaments in patches are 50–100 subunits in length, which translates to 0.1–0.3 μm based on 370 subunits per micrometer (24). Actin-binding proteins can decrease or increase the depolymerization rate of filaments, but this value of 0.1–0.3 μm is similar to the width of a patch in electron microscope images (38).
Second, cables appear to be shortened and more numerous but of relatively normal intensity at intermediate times. These features can be appreciated by comparing representative images of cells at 10 s (Fig. 2 C) with those of control cells at 0 s (Fig. 2 A). Therefore, cables appear to be depolymerizing from their ends and also from points along their middle, which causes them to break into pieces. At later times (Fig. 2 D), cables can still be observed, but at much reduced intensity.
A typical long cable may span 5 μm in a mother cell. A filament 5 μm long would contain 1,850 subunits, for which a dissociation rate of 5–10 per second implies a depolymerization time of 185–390 s. In our experiment, cables were nearly completely depolymerized at 15 s, which implies that actin filaments in cables are shorter than the length of the cable. This interpretation is also consistent with the observation above that cables have uneven thickness.
An alternative hypothesis to explain the short disassembly time is that cables may contain an actin-binding protein that accelerates the monomer dissociation rate constant, as has been proposed for cofilin (13, 29). However, yeast cofilin has been localized to patches but not cables (36).
Together, our observations on cable structure and disassembly are consistent with a model in which a cable is composed of a number of actin filaments that overlap with each other and are shorter than the cable.
Are Cables and Patches Parts of One Integrated System?
The extent to which cables and patches function and assemble as one integrated system versus independently of each other is not known. We addressed this question in three ways. First, we asked whether it was possible for patches to exist in the absence of cables and vice-versa. We looked at several mutants in addition to various physiological conditions. Second, we determined to what extent patches and cables are associated with each other. Third, we determined whether patches and cables changed their distributions together or separately.
Existence of Cables: Cell Cycle and Heat Shock.
To determine whether patches and cables depend on each other for assembly, we first asked whether wild-type cells can contain patches without cables. Cables are generally considered to be absent or very difficult to observe in the later stages of the cell cycle. For example, in previously published images of postanaphase cells, cables are barely visible or absent (28). In addition, cables have been reported to disappear in response to heat shock and osmotic shock (15, 31).
In repeating these experiments, we found that cables were indeed present both during the later stages of the cell cycle (Figs. 3 D and 4) and after heat shock (Fig. 5).
Figure 5.
Cables after heat shock. (A) Control cells, no heat shock applied. (B) Cells after 5 min of heat shock. (C) Cells after 30 min of heat shock. Single–focal plane images of cells stained with rhodamine-phalloidin are shown. Bar, 10 μm.
During progression through the cell cycle, cables became progressively thinner but could always be detected, including before cell division (Fig. 3 D). These thin cables were more readily observed in serial focal planes from a deconvolved image (Fig. 4) than in 3-D rotating images. Unbudded and large-budded cells with a random distribution of patches were screened for the presence of cables. Cables were found in 100 ± 3% (±SEP, n = 50) of unbudded cells and 94 ± 3% (±SEP, n = 50) of large-budded cells with randomized patch distribution.
Similarly, the cables became thinner during the course of heat shock but never disappeared completely. Cables were visible in 94 ± 3% (±SEP, n = 50) of small-budded cells even after 30 min of heat shock, when patch distribution was almost random (Fig. 5 C).
In sum, cables in wild-type cells did not disassemble during the cell cycle or after heat shock. Cables did change in thickness, suggesting that the number of actin filaments in a cable can vary over time.
Existence of Cables: Mutants.
One argument against the existence of an integrated system of patches and cables is that many actin cytoskeleton mutants have been reported to have patches but no cables (9). We looked for cables in some of these mutants because our improved techniques of observation revealed cables in wild-type cells under conditions when cables were not seen before.
One of the mutations was a disruption of the CAP2 gene, encoding the β-subunit of capping protein. In our previous work, rhodamine-phalloidin staining did not reveal cables in this mutant, while antibody staining did show cables in some cells (3–5). Our improved techniques now show, even with rhodamine-phalloidin staining, that nearly all the cells contain cables (Fig. 6 A). Cables were found in 89 ± 3% (±SEP, n = 100) of small-budded cap2Δ cells. The other 11% of small-budded cells were abnormally large and contained many patches, which obscured the observation of cables. Cables in cap2Δ cells were often thinner than cables in wild-type cells, which accounts for the failure of previous techniques to detect them.
Another mutation previously described as lacking cables is the disruption of TPM1, which encodes tropomyosin, a component of cables but not patches (32). Our observations here confirmed that tpm1Δ mutant cells do not have cables, regardless of the cell stage. None of the 100 small-budded cells contained cables (Fig. 6 B), whereas all small-budded wild-type cells contained cables. Patches in tpm1Δ cells were substantially depolarized, (Figs. 6 B, 7 C, and Movie 2), as expected from previous work (32). Therefore, the presence of patches without cables in the tpm1Δ mutant shows that actin can assemble into patches in the absence of cables. In this regard, patches do not depend on cables.
Existence of Patches.
Since patches can exist without cables, we next asked whether the converse was true: Can cables exist without patches? Only one condition or mutation has ever been described as leading to the loss of patches in a viable cell—the bee1/las17 null mutation (30). In our observations, the number of patches in the bee1/ las17 null mutant was similar to the number observed here in several wild-type and mutant strains, such as tpm1Δ and cap2Δ (Fig. 7). The number of patches was not severely low, as described previously (30). In addition, irregularly shaped clusters of filamentous actin in the bud and neck region, described previously as common (30), were rare in our observations. Patches were randomly dispersed throughout the mother and bud at all stages of the cell cycle, with no clustering at all. The number of cables in bee1/ las17 null cells was substantially greater than the number seen in other cases of actin depolarization, such as the late stages of the cell cycle, the heat shock response, or a completely depolarized cap2Δ mutant.
Our new observations eliminate the one exception to the rule that all viable mutants contain patches. An alternative approach to this question is to monitor the presence of cables in a cell induced to lose patches. Even though such a cell is inviable, we can still determine whether cables can exist without patches, which relates to the question of whether cables depend on patches for assembly and stability. Patches have been described as disappearing in response to treatment with the toxin latrunculin (6) and in response to the arp3-2 conditional mutation (47). We examined both of these situations, looking for times at which cells lost patches but not cables. For latrunculin, as discussed above, cables were lost at a slightly later time than were patches, but cables were still lost rapidly (Fig. 2). In the arp3-2 mutant at restrictive temperature, over 3 h, the number and intensity of patches and cables decreased but not to zero, and aggregates of filamentous actin appeared, as described previously (47). No cells contained only cables or only patches. The aggregates appeared in the same location where patches clustered, suggesting that the aggregates might form from or be related to patches and therefore function as patches to stabilize cables. In all these experiments, we found no clear cases where cables were stable in the absence of patches.
Spatial Relationships between Patches and Cables.
If cables and patches depend on each other for assembly or function, then they may be associated with each other spatially. We asked whether patches and cable ends were associated.
We observed that cables and patches could either be free (not associated with each other) or associated in a 1:1 complex. Higher-order association was not observed. That is, we never observed two or more cables end on the same patch, and any one patch was only associated with one cable.
We did not observe patches associated with the middle of cables. As noted above, cables did have regions of increased staining intensity along their length; however, these “lumps” were less thick and bright than patches at the ends of the cables (e.g., Feature 3 of Fig. 1/Movie 1).
Rotating images of 3-D reconstructions were essential for this analysis. We analyzed the mother cells of 3 small-budded and 11 medium-budded cells. We excluded cells in which patches and cables were not visualized well. Buds of small- and medium-budded cells were excluded because their patches were too dense to identify as individuals. Large-budded and unbudded cells were excluded because their cables were too thin and dim to be preserved well in 3-D reconstructions. The analyzed cells may have contained at most a small percentage of thin cables not preserved well in 3-D reconstructions. On the other hand, patches were always preserved well in 3-D reconstructions. Therefore, the observed values for the percentages of patches and cables associated with each other may be slightly different than the actual values.
The data for the frequency of association between patches and cables are presented in Table I. Patches and cables ends were often found in association with each other, but not always. Patches and cable ends occupy only a small part of the cell surface; therefore, the frequency of their association is much higher than would be expected by chance. Together, the results demonstrate that connections between patches and cable ends do exist.
Table I.
Spatial Relationships between Cables and Patches
| Number | Features | |||
|---|---|---|---|---|
| Patch association with cables | ||||
| Patches at ends of cables | 32 (37 ± 5%) | 2, 4, 5, and 6 | ||
| Patches free | 50 | 1 | ||
| Total patches | 82 | |||
| Cable association with patches | ||||
| Counting cables as units | ||||
| Both ends on patch | 4 | 2 | ||
| One end on cluster, one end on patch | 9 | 4 | ||
| One end on patch, one end free | 14 | |||
| One end on cluster, one end free | 23 | 7 | ||
| Total associated | 50 (74 ± 5%) | |||
| Both ends free | 18 | 8 | ||
| Total cables | 68 | |||
| Counting cable ends as units* | ||||
| Ends on patches | 31 (30 ± 4%) | |||
| Ends free | 73 | |||
| Total ends | 104 |
We examined the association between 82 patches and 68 cables in 14 cells. In some cases, patches were densely clustered at the neck and could not be distinguished as individuals. For certain key numbers, percentage ± SEP is given. Examples are shown as features in Fig. 1/Movie 1.
Cable ends associated with dense patch clusters were excluded from this analysis because of the relative lack of certainty about the location of the end. 32 (= 23 + 9) cable ends were excluded. The other end of such a cable was included.
Correlation between Patch and Cable Rearrangement.
If cables and patches are associated, then one predicts that cables and patches should change their distribution simultaneously. When cables are oriented, the patches should be clustered, and when cables are not oriented, patches should be distributed randomly. Previous studies showed that when patches were clustered in the bud, the cables were oriented along the mother–bud axis (28). However, in cells with depolarized patches, cables were usually not observed (15, 28, 31). Using improved techniques, we were able to observe cables in cells in which patches were depolarized, so we could also assess the relationship between cable orientation and patch polarization more thoroughly than in the past.
We found that changes in patch distribution were tightly correlated with changes in cable distribution. The results in this section are summarized in Fig. 8.
Figure 8.
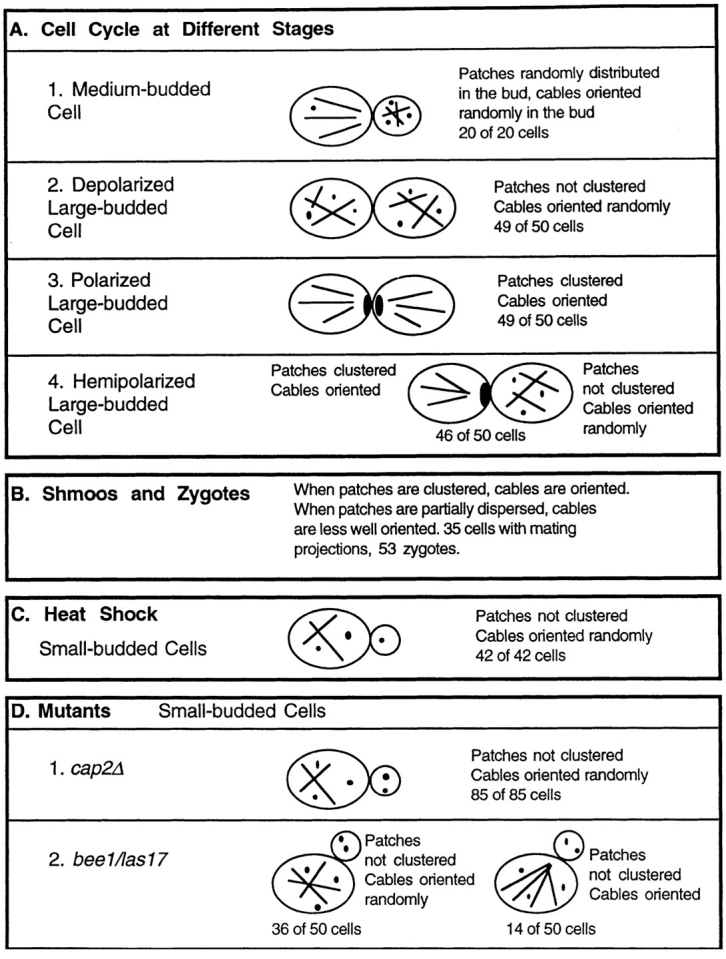
Diagram summarizing results testing for correlations between patch and cable rearrangement.
First, we examined patch and cable distribution in the changes the actin cytoskeleton undergoes during the cell cycle. Results from several points in the cell cycle were particularly informative and are presented here. One stage is the medium-budded cell in which patches are distributed randomly throughout the bud but have not yet moved to the mother (Figs. 8 A1 and 3 C). The mother– bud cell pair is still polarized, in the sense that all the patches are in the bud; however, the patches in the bud are not clustered at the tip of the bud, as they are at earlier times. Patches often obscure cables in these buds, but we identified cells in which cables were clearly visible. In all of 20 such cells with patches randomly distributed in the bud, cables in the bud formed an isotropic meshwork without an orientation. Later in the cell cycle, large-budded cells have patches randomly distributed about both the mother and the bud. In all of 50 such cells, we observed that the cables formed a random meshwork, lacking any predominant orientation (Figs. 8 A2, 3 D, and 9, A–C).
In the final stage of the cell cycle, large-budded cells cluster their patches at the site of cell division. First, patch clusters are present in both mother and daughter on each side of the cell division site (45). In 49 of 50 such cells, cables in both mother and daughter were oriented toward the patch cluster (Fig. 8 A3). Next, the patch cluster in the mother is dispersed while the cluster in the daughter persists (45). In 46 of 50 such cells, cables were oriented in the daughter cell, which had a patch cluster, and were not oriented in the mother cell, which did not have a patch cluster (Fig. 8 A4).
Next, we examined the morphogenetic processes of cell mating, which also include extensive changes in the actin cytoskeleton (Fig. 8 B). We examined 35 cells with mating projections (shmoos). First, patches formed a cluster in the tip of the projection. In all such cells, cables were oriented towards the cluster (Fig. 10 A). If cells of the opposite mating type were not provided, then cells could not mate and underwent adaptation. Patches partially dispersed from the tip cluster during adaptation. Correspondingly, cables also became less well oriented in all these cells (Fig. 10 B). When cells of the opposite mating type were provided, cells fused to form zygotes. We examined 53 zygotes. First, patches partially dispersed, and cables were less well oriented (Fig. 10 C). Later, when the first bud started to form, patches clustered again, and cables became well oriented (Fig. 10, D and E).
Figure 10.
Cables in zygote formation and development. (A) Cells with mating projections after 1 h of α-factor treatment. (B) Cells with mating projections after 3 h of α-factor treatment. (C– E) Sequential stages of zygote formation and development. Single–focal plane images of cells stained with rhodamine-phalloidin are shown. Bar, 10 μm.
Next, we examined cable and patch distribution in two mutants with a depolarized actin cytoskeleton and in wild-type cells after heat shock. In these cases, we were able to observe cables that were not seen well in previous studies. Therefore, we were able to ask whether cable orientation correlated with patch polarization.
During heat shock of wild-type cells, polarization was lost. At 30 min, depolarization was complete. The degree of patch clustering correlated strongly with the degree of cable orientation. Among 42 small-budded cells with a random distribution of patches, all cells contained a random meshwork of cables (Figs. 8 C and 5 C).
We studied two mutants, one with a moderate defect in actin polarization and one with a severe defect. The cap2Δ mutant had a moderate polarization defect. Some cells had well-polarized patches and well-oriented cables (e.g., the two cells not marked by an asterisk in Fig. 6 A). Most cells had partially delocalized patches, and their cables were not well oriented (e.g., the three cells marked by asterisks in Fig. 6 A). A small fraction of the cells had a random distribution of patches and a random meshwork of cables. Among small-budded cells, which are most likely to have a polarized actin cytoskeleton, all of the 85 cells with a random patch distribution had a random meshwork of cables (Fig. 8 D1).
The bee1/las17 null mutant (30) served as an example of a severe actin polarization defect. All bee1/las17 cells, including small-budded cells, had a random distribution of patches. 72 ± 6% (±SEP, n = 50) of small-budded cells contained an isotropic meshwork of numerous thin cables (Figs. 8 D2, 7 A, 5 B, and Movie 3). The other 28 ± 6% of small-budded cells showed some polarization of their cables, with most cables oriented along the long axis of the cell (Figs. 8 D2 and 7 C). These cells represent the only case of a lack of correlation between patch and cable distribution in our studies. The number of cables in these cells was not as high as that observed in the majority of the cells, the group without any polarization.
In sum, there was a strong correlation in the behavior of patches and cables. The correlation was observed at different cell cycle stages, during mating, in different mutants, and after heat shock. We almost never observed polarization of patches without polarization of cables or vice versa. When patches were clustered, cables were oriented along the mother–bud axis in a direction such that cable ends colocalized with patch clusters. When the patch distribution was random, cables were not oriented. Partial delocalization of patches was associated with partial loss of cable orientation. The strength of this correlation suggests that patches interact with the ends of the cables.
Assembly of the Actin Cytoskeleton
The Level of Filamentous Actin.
One might have predicted that the previously reported loss of actin cables through the cell cycle and in response to heat shock would be associated with depolymerization of actin filaments in the cables. On the other hand, our observation here that actin cables did not disappear suggests that actin filaments may not depolymerize but instead rearrange their positions. To discriminate between these possibilities, we measured the level of filamentous actin through the cell cycle and in response to heat shock.
Cell Cycle.
The level of filamentous actin per volume was constant, independent of the stage of the cell cycle and the degree of polarization of the actin cytoskeleton (Fig. 11 A). In these experiments, we measured filamentous actin levels using digital fluorescence microscopy of individual cells stained with rhodamine-phalloidin. This approach provides better information than a conventional analysis of an entire synchronized cell population. For each individual cell, we determined the stage of the cell cycle, the degree of polarization of the actin cytoskeleton, the level of filamentous actin, and the volume of the cell. The rhodamine-phalloidin fluorescence associated with each cell was then normalized to cell volume.
Figure 11.
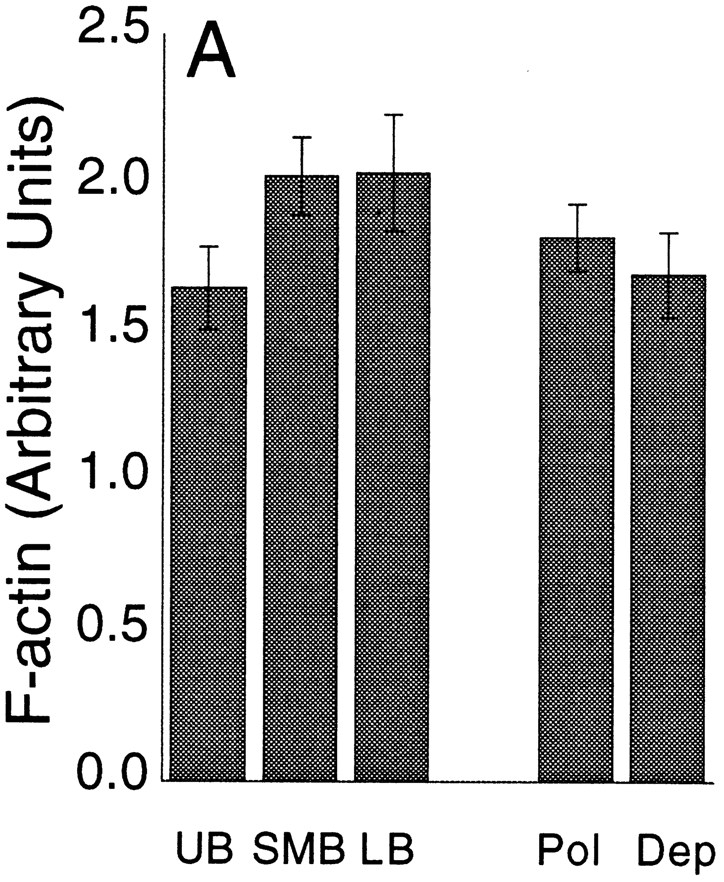
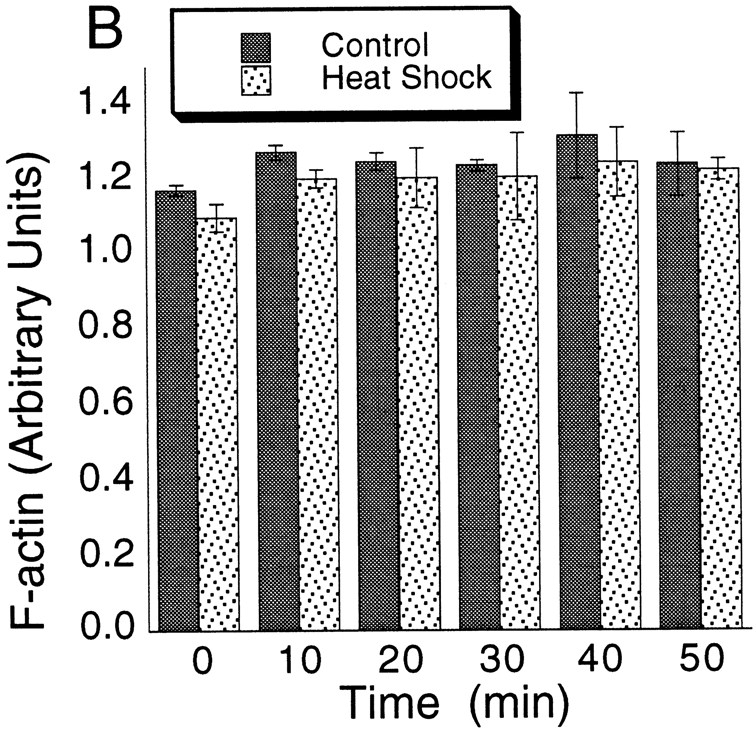
Filamentous actin levels in cells. (A) The filamentous actin level for cells at different stages of the cell cycle. UB, unbudded cells; SMB, small- to medium-budded cells; LB, large-budded cells; Pol, total polarized; Dep, total depolarized cells. Individual cells were analyzed by digital video microscopy. Rhodamine-phalloidin fluorescence normalized to cell volume was determined for each cell. The values shown represent the mean. The error bars represent SEM. None of the differences between mean values are statistically significant, according to a t test. (B) The filamentous actin level in cells responding to heat shock. For a cell suspension, the rhodamine-phalloidin fluorescence normalized to protein content is plotted. The values represent the mean of four determinations. The error bars represent SEM.
The data were grouped according to the position of the cells in the cell cycle, assessed from bud per mother volume and nuclear morphology. The groups were unbudded cells (UB, n = 15), cells with a small to medium bud and a single nucleus (SMB, n = 33), and cells with a large bud and two nuclei (LB, n = 10). The level of filamentous actin per cell volume was the same in all three groups (Fig. 11 A). The data were also analyzed by plotting rhodamine-phalloidin fluorescence per cell volume vs. the ratio of bud volume to mother volume, a quantitative index of position in the cell cycle. No significant changes were seen in this plot (data not shown). Therefore, neither analysis showed any significant increase or decrease in the level of filamentous actin per cell volume through the cell cycle.
The same data were also analyzed in terms of whether the cells were polarized (n = 42) or depolarized (n = 16). There was no difference in the filamentous actin level per cell volume comparing polarized cells with depolarized cells (Fig. 11 A, Pol vs. Dep). Therefore, depolarization of the actin cytoskeleton in the cell cycle is not accompanied by an overall shift from filamentous to nonpolymerized actin.
Heat Shock.
We measured the filamentous actin concentration at time intervals after heat shock. Cells were highly homogeneous in their actin depolarization in response to heat shock (described in Materials and Methods), so we measured rhodamine-phalloidin binding in the population as a whole instead of in individual cells. Rhodamine-phalloidin binding was normalized to total protein content of the sample instead of cell volume. The normalized level of filamentous actin remained constant over time after heat shock, identical to the normalized level in a control sample (Fig. 11 B). Therefore, depolarization of the actin cytoskeleton during heat shock was not accompanied by significant filamentous actin depolymerization.
In conclusion, the extensive changes in the distribution of the actin cytoskeleton that occur during cell cycle and in response to heat shock do not involve significant changes in the overall concentration of filamentous actin in the cell.
Timing of Patch Assembly.
To investigate further how the actin cytoskeleton assembles, we examined how patches formed. Cell replication must include an increase in the number of patches at some point in the cell cycle, but we do not know when or how that occurs. To address this question, we determined the number of patches in cells at different positions in the cell cycle. 3-D images allowed us, for the first time, to count all the patches within a cell. The structure and organization of cables are so complex that a similar analysis for cables is not yet feasible.
First, we determined the number of patches in newborn daughter cells. We identified the daughter cell before birth as the bud, the smaller of the pair, in a cell about to divide. In these cells, the numbers of patches in the daughter and mother cells were similar, 22 ± 3 (mean ± SEM, n = 9) and 17 ± 2 (mean ± SEM, n = 9), respectively. The volume of the daughters was less than the volume of the mothers; therefore, the ratio of patch number to volume for the daughters, 0.54 ± 0.08 per fl (mean ± SEM, n = 9), was greater than for the mothers, 0.31 ± 0.04 per fl (mean ± SEM, n = 9) (P < 0.05).
Next, to follow patch number in daughter cells after birth, we identified unbudded single cells. In our actively growing cultures, mother cells began to form a new bud before the previous bud was separated, as observed by ourselves and others previously (37, 45). Therefore, unbudded single cells represent only daughters before their first bud and does not include mothers that have budded previously. Newly born daughter cells have a longer G1 phase than mother cells do, permitting the daughters to grow until they reach the size necessary for budding (14).
We also determined the number of patches at later points in the cell cycle as the bud grew. Cell volume and morphology were used to determine the position of individual cells in the cell cycle. We counted patches and measured cell volume for 7 unbudded cells and 17 budded cells. Cells with patches in tight clusters in small buds and at the site of cell division were excluded because individual patches in these clusters could not be identified and counted.
The data from all the cells, including daughter cells before birth, daughter cells after cell separation but before budding, and budding cells, are plotted in Fig. 12 A. The number of patches and the cell volume increased together, so that the ratio of patch number to cell volume was relatively constant.
Figure 12.
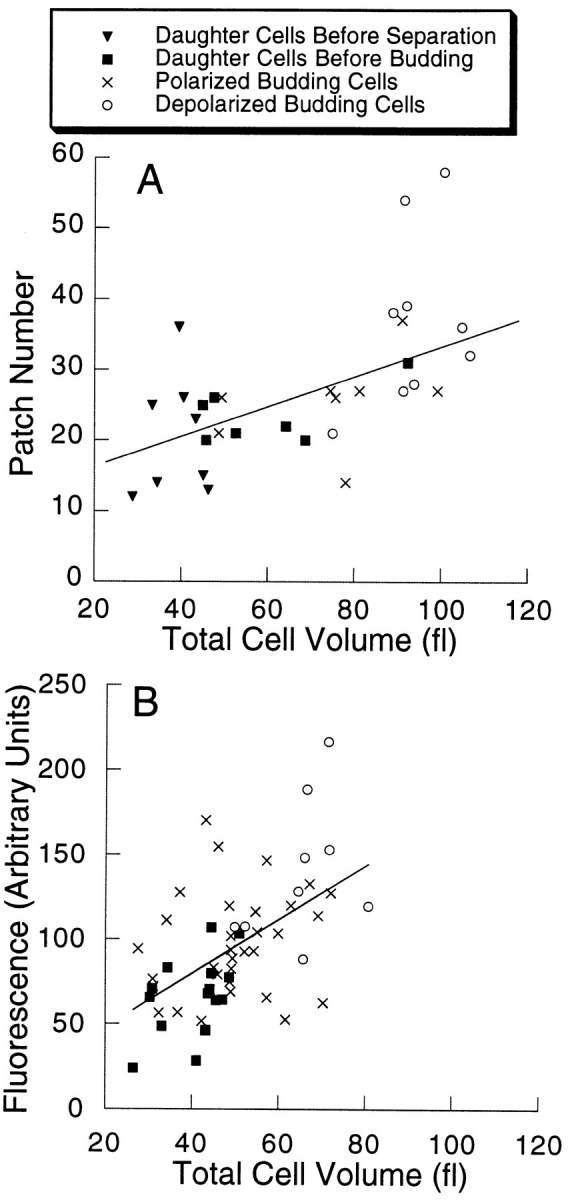
Patch number and filamentous actin level through the cell cycle. (A) Patch number is plotted vs. cell volume. (B) Filamentous actin (arbitrary units of fluorescence) is plotted vs. cell volume. Each point represents one cell. Cells at different stages of the cell cycle are indicated by different symbols, as shown in the figure. The lines were produced by a linear regression analysis of the data. For A, r = 0.61 and P ≤ 0.001, and for B, r = 0.54 and P = 0.001.
To address the question of whether patches contain equal amounts of filamentous actin at different points in the cycle, we plotted the data for filamentous actin vs. cell volume, which is the same way that we plotted the data for patch number. As seen in Fig. 12 B, the amount of filamentous actin, not normalized in any way, also increased at a relatively constant rate relative to cell volume. Patch number and filamentous actin amount increased together.
Discussion
The actin cytoskeleton of many eukaryotic cell types contains parts that can be distinguished morphologically, functionally, and biochemically. Understanding the relationships between these parts is an important question. In these studies, we used yeast as a model organism to study the compartmentalization and dynamics of different pools of filamentous actin, namely patches and cables, in one cell.
Our results provide new information about patch and cable morphology, cable polarity, the structural association of cables and patches, and the dynamics of the actin cytoskeleton in yeast. Some of these results were provided by improved techniques in fluorescence microscopy, including sensitive digital video analysis, image deconvolution, and 3-D reconstruction.
Cables and Patches as Parts of One Integrated System
An important question is whether the parts of the yeast actin cytoskeleton depend on each other for assembly or function. We addressed the question of the relationship between patches and cables in several ways.
First, we asked whether one could find cases in which patches exist in the absence of cables or vice-versa. Previous studies observed the presence of patches in the absence of cables in several situations. However, our improved microscopy techniques provided increased ability to detect cables, and we were able to observe cables in several situations where they were not appreciated previously. Those situations included wild-type cells in M phase with depolarized actin, wild-type cells subjected to heat shock, and the cap2 mutant.
Our results do confirm one case of absence of cables with presence of patches: the tpm1 mutant. This result is predicted from the fact that Tpm1p is located in cables but not patches. Therefore, patches can exist without cables and do not require cables to assemble and remain stable. Patches are defined as rhodamine-phalloidin–stained dots at the cell cortex. Whether tpm1Δ patches contain other components of wild-type patches is not known. In preliminary experiments with green fluorescent protein tagging, we find that fimbrin, Sac6p, and a myosin-I, Myo5p, are present in patches in tpm1Δ cells (Karpova, T.S., and J.A. Cooper, unpublished results), which provides additional evidence that these patches have assembled normally. As concluded previously, the absence of cables and the presence of patches in the tpm1 mutant suggests that patches may be essential for viability but cables may not be (32).
To test whether cables can exist in the absence of patches, we examined the only situation in which patches have been described as absent in a viable cell: the bee1/ las17 null mutant. In our observations, bee1/las17 null mutant cells did contain cortical actin patches, in an amount similar to that found in wild-type and other mutant cells. Therefore, we find no evidence that cables can exist and remain stable without patches.
We also examined two situations in which patches are lost as part of a lethal process, asking whether one could identify a time at which cables were present and relatively stable despite the loss of patches. In latrunculin, cables were lost very quickly after patches were lost. In the arp3-2 conditional mutant at restrictive temperature, a fraction of cells did contain cables without patches. However, filamentous actin in these cells forms aggregates in the same subcellular localization as patches, suggesting that the aggregates may even be altered forms of patches. Therefore, one cannot be certain that these cables are stable in the absence of patches. Together, these results do not disprove the hypothesis that assembly or stability of cables is independent of patches. The results here with latrunculin in yeast contrast with results from neutrophils in which different pools of filamentous actin showed large differences in their tendency to depolymerize (11).
Second, we asked whether there was a spatial relationship between patches and cables, specifically whether cables end on patches. This spatial relationship is one feature of models in which myosin-laden secretory vesicles are transported in the cytoplasm along actin cables and delivered to actin patches at the plasma membrane for secretion.
We observed that patches are often located at the ends of cables, and most cables are associated with patches. Previous light and electron microscopy studies, which had certain limitations relative to the approaches here, suggested that association between patches and cables was the typical case (28, 38). Our findings here about the level of association of cables and patches do support the conclusion that association of patches and cables is typical. The existence of this spatial relationship supports the hypothesis that cables and patches depend on each other for assembly or function.
Third, we asked whether cables and patches, both of which undergo extensive changes in their distribution throughout the cell, undergo those changes together or independently of each other. We found that the distribution of cables and the distribution of patches changed concomitantly under a wide variety of circumstances, which included mild to severe changes in the actin cytoskeleton. These circumstances included the cell cycle, heat shock, mating, and mutations in bee1/las17 or cap2. These results support the conclusion that patches and cables depend on each other for their organization within the cell.
Together, the results from the three approaches suggest that the association of patches and cables may be essential for actin cytoskeleton assembly and/or function, and therefore that patches and cables may represent parts of an integrated system.
Assembly of the Actin Cytoskeleton
Stability of Filamentous Actin.
Yeast cells show dramatic changes in the distribution of their actin filaments through the cell cycle and in response to heat shock. Previously, we found that mutations in actin and actin-binding proteins can cause decreases in the level of filamentous actin (27). These decreases in filamentous actin are compatible with life, and the mutations cause a loss of actin polarization. Therefore, we reasoned that the dramatic changes in actin polarization observed in wild-type cells during the cell cycle and in response to heat shock might also involve loss of filamentous actin. To the contrary, we found that those changes in polarization did not require changes in the level of filamentous actin.
In this respect, yeast are unlike cells such as platelets, neutrophils, and Dictyostelium, in which changes in the distribution of the actin cytoskeleton involve large changes in the assembly state of actin from unpolymerized to filamentous (10, 22, 23). Movements of actin filaments have been proposed to account for the change in their distribution that accompanies cytokinesis in animal cells (12). Similarly, polarization and depolarization of the actin cytoskeleton in yeast may involve movements of patches and cables as complete entities, as opposed to disassembly and reassembly of these structures. Movements of patches have been observed in vivo (21, 45). The existence of branched cables, detected here rarely, shows that cables may be able to fuse with one another or split into thinner cables, which also involves the movement of filaments as opposed to disassembly/reassembly.
Constant Patch Concentration in Growing Cells.
Our analysis of filamentous actin levels showed that filamentous actin increases in proportion to cell volume as cells grow. As part of cell growth and replication, cells must create new actin patches. How and when patches are created is not known. Our analysis provides new information about this question. For the first time, we were able to count the patches in individual cells. We found that cells increase their number of patches at a relatively constant rate while they grow. Therefore, the density of patches, total number per total volume, remains relatively constant. Cell growth may require a certain level of patch density, and cells may continuously create patches to maintain that density as they grow. We found no evidence for discrete jumps in the number of actin patches, as would be expected if patches only assembled at certain times in the cell cycle.
The data for patch number and filamentous actin level (Fig. 12) have relatively large variances, although the correlations do achieve statistical significance. Therefore, the possibility remains that discrete jumps might be detected by a better analysis. These data are measurements of many different cells, and cell-to-cell variation is likely to be an important contributor to the variance. If one could make these measurements on a single cell over time, the ability to detect discrete jumps would be higher.
Cable Morphology: Implications for Filament Organization
A combination of our results indicates that cables contain a number of filaments, that the filaments within one cable have different lengths, and that the ends of the filaments are not aligned with each other. One striking finding in our analysis was that cables have uneven thickness along their length, which alone strongly supports this model. The model is also supported by the result that cables shorten and fragment when their filaments are depolymerized by latrunculin.
Together, our observations on cable structure and disassembly are most consistent with a model in which a cable contains a number of actin filaments that overlap with each other and are shorter than the cable but not very short. This model is diagrammed in Fig. 13 C. Fig. 13 also shows two other extreme models, which are not as consistent with our results. In one model (Fig. 13 A), cables have long filaments that extend the length of the cable. The uneven thickness of cables and the increased number of cables during disassembly argues against this model. At the other extreme, another model (Fig. 13 B) has cables composed of very short filaments. The uneven thickness of cables might be consistent with this model. However, this model predicts that during latrunculin-induced disassembly, cables should lose intensity relatively uniformly along their length, which is not the case.
Figure 13.

Models for actin filament organization in cables. (A) A cable contains only long filaments that extend the length of the cable. (B) A cable contains short, overlapping filaments. (C) A cable contains a combination of long and short filaments that overlap.
Since cable ends are associated with patches, one might hypothesize that patches function to nucleate assembly of cables. An extreme version of this hypothesis is that all the actin filaments in a cable are nucleated from a patch. This model predicts that a cable should be of constant thickness or become progressively thinner as one moves away from the nucleation site. In contrast, our results show that thick regions alternate with thinner regions along the length of an individual cable. Thus, the filaments in a cable are unlikely to be attached via their ends to one site at the end of the cable and to have been nucleated from that site. An alternative model is that only some filaments of a cable may be nucleated from or captured by a patch and therefore have their ends at the patch. The other filaments in the cable may nucleate from and be attached to these filaments via side interactions that may require actin filament cross-linking proteins.
We also found that the fluorescence intensity of the cables changes throughout the cell cycle, which indicates that the number of filaments in a cable can vary. At the later stages of the cell cycle, when the cables are randomly oriented, they are thin and numerous. At early times, cables are thicker, fewer in number, and polarized. Therefore, thick cables may be formed by the fusion of thinner cables. In support of this notion, branches were occasionally observed in cells with a polarized actin cytoskeleton. Therefore, the number of filaments in the cable depends on the cell cycle stage.
A current hypothesis for the function of cables is that cables serve as tracks for myosin-powered movement of organelles, such as secretory vesicles and mitochondria. This hypothesis requires that the filaments in a cable be oriented in the same direction. Cables contain fimbrin, and in vitro fimbrin bundles actin filaments of the same polarity (17). In some cases, uniform polarity of filaments within a bundle is reflected in asymmetry in the structure of the bundle. In Limulus sperm, for example, the end of the bundle with filament barbed ends is thicker than the end of the bundle with pointed ends (18). Our observations do not reveal any features of asymmetry in the structure of cables, which does not support the notion of uniform filament polarity within the cable.
Furthermore, both ends of a cable can be associated with a patch, and cables passing from mother to bud sometimes have a patch at their end in the mother. A model for polarized growth in which secretory vesicles move unidirectionally along cables to patches does not predict that cables have a patch at their end in the mother or at both ends.
One limitation of this experimental approach is the assumption that the fluorescence signal accurately reports the protein of interest. In this case, the possibility exists that an actin-binding protein might alter the binding of rhodamine-phalloidin. For example, the uneven distribution of rhodamine-phalloidin along a cable might reflect an uneven distribution of an actin-binding protein instead of filamentous actin. At present, we know of no cases of actin-binding proteins with distributions that would account for the rhodamine-phalloidin staining pattern seen here.
Implications for Other Organisms
The actin cytoskeleton of yeast shares a number of features with the actin cytoskeleton of other cells that lend these results general relevance. First, many cells show different pools of filamentous actin that appear to have structural connections. Here we find evidence for an association between cables and patches, which suggests that in other cell types, links between different structures with filamentous actin may exist and be functionally relevant. Second, cells in general create new filamentous actin and enlarge their pools of actin as they grow. Studies in other cell types have focused on cases where rapid and dramatic changes in actin assembly accompany the formation of new actin filaments and structures containing actin filaments (10, 22, 23). The extent to which cells in general follow this rule is not well understood. Our results here show that in yeast the assembly of new actin filament structures does not entail a burst of assembly of filamentous actin. This situation in yeast may represent the more common case for cells in general as they grow. Finally, small G-proteins affect the distribution of filamentous actin in many cell types (44). In yeast, Cdc42 is required for the polarization of actin patches (2). Our results indicate that polarization does not require a burst of assembly of filamentous actin. Therefore, in other cell types, small G-proteins may be able to affect the distribution of actin without inducing actin assembly.
Figure 9.
The random meshwork of thin cables in large-budded cells. A–C show three examples. D shows three small-budded polarized cells for comparison. Single–focal plane images of cells stained with rhodamine-phalloidin are shown. Bar, 5 μm.
Acknowledgments
We gratefully acknowledge the helpful discussions and valuable technical support of Drs. Jose Conchello, Joanne Markham, and Fred Rosenberger (Institute for Biomedical Computing, Washington University, St. Louis, MO). We are grateful to Dr. R. Li (Harvard Medical School, Boston, MA) for several strains and to Applied Precision (Mercer Island, WA) for a kind gift of fluorescent plastic slides.
This work was supported by grants from NIH (GM47337 to J.A. Cooper, GM47730 to J.G. McNally, GM55708 to J.A. Conchello, and CA47135 to P. Crews for preparation of latrunculin A). J.A. Cooper is an Established Investigator of the American Heart Association.
Abbreviations used in this paper
- 2-D and 3-D
two- and three-dimensional
- EM
maximum-likelihood estimation–maximization method
- LLS
linear least-squares method
- PSF
point-spread function
- PWLS
penalized, weighted least-squares method
- SEO
standard error of percentage
- UB
SMB, and sLB, unbudded, small- to medium-budded, and large-budded
Footnotes
Address all correspondence to John Cooper, Box 8228, 660 S. Euclid Ave., St. Louis, MO 63110. Tel.: (314) 362-3964. Fax: (314) 362-0098. E-mail: jcooper@cellbio.wustl.edu
References
- 1.Adams AEM, Pringle JR. Relationship of actin and tubulin distribution to bud growth in wild-type and morphogenetic-mutant Saccharomyces cerevisiae. . J Cell Biol. 1984;98:934–945. doi: 10.1083/jcb.98.3.934. [DOI] [PMC free article] [PubMed] [Google Scholar]
- 2.Adams AEM, Johnson DI, Longnecker RM, Sloat BF, Pringle JR. CDC42 and CDC43, two additional genes involved in budding and the establishment of cell polarity in the yeast Saccharomyces cerevisiae. . J Cell Biol. 1990;111:131–142. doi: 10.1083/jcb.111.1.131. [DOI] [PMC free article] [PubMed] [Google Scholar]
- 3.Adams AEM, Cooper JA, Drubin DG. Unexpected combinations of null mutations in genes encoding the actin cytoskeleton are lethal in yeast. Mol Biol Cell. 1993;4:459–468. doi: 10.1091/mbc.4.5.459. [DOI] [PMC free article] [PubMed] [Google Scholar]
- 4.Amatruda JF, Cannon JF, Tatchell K, Hug C, Cooper JA. Disruption of the actin cytoskeleton in yeast capping protein mutants. Nature. 1990;344:352–354. doi: 10.1038/344352a0. [DOI] [PubMed] [Google Scholar]
- 5.Amatruda JF, Gattermeir DJ, Karpova TS, Cooper JA. Effects of null mutations and overexpression of capping protein on morphogenesis, actin distribution and polarized secretion in yeast. J Cell Biol. 1992;119:1151–1162. doi: 10.1083/jcb.119.5.1151. [DOI] [PMC free article] [PubMed] [Google Scholar]
- 6.Ayscough KR, Stryker J, Pokala N, Sanders M, Crews P, Drubin DG. High rates of actin filament turnover in budding yeast and roles for actin in establishment and maintenance of cell polarity revealed using the actin inhibitor latrunculin-A. J Cell Biol. 1997;137:399–416. doi: 10.1083/jcb.137.2.399. [DOI] [PMC free article] [PubMed] [Google Scholar]
- 7.Baba M, Ozumi M. Transmission and scanning electron microscopic examination of intracellular organelles in freeze-substituted Kloeckera and Saccharomyces cerevisiaeyeast cells. J Electron Microsc Tech. 1987;5:249–261. [Google Scholar]
- 8.Baba M, Baba N, Ohsumi Y, Kanaya K, Osumi M. Three-dimensional analysis of morphogenesis induced by mating pheromone α factor in Saccharomyces cerevisiae. . J Cell Sci. 1989;94:207–216. doi: 10.1242/jcs.94.2.207. [DOI] [PubMed] [Google Scholar]
- 9.Botstein, D., D. Amberg, J. Mulholland, T. Huffaker, A. Adams, D. Drubin, and T. Stearns. 1997. The yeast cytoskeleton. In The Molecular and Cellular Biology of the Yeast Saccharomyces. Cell Cycle and Cell Biology. J.R. Pringle, J.R. Broach, and E.W. Jones, editors. Cold Spring Harbor Laboratory Press. Cold Spring Harbor, NY. 1–92.
- 10.Cano ML, Cassimeris L, Fechheimer M, Zigmond SH. Mechanisms responsible for F-actin stabilization after lysis of polymorphonuclear leukocytes. J Cell Biol. 1992;116:1123–1134. doi: 10.1083/jcb.116.5.1123. [DOI] [PMC free article] [PubMed] [Google Scholar]
- 11.Cano ML, Lauffenburger D, Zigmond SH. Kinetic analysis of F-actin depolymerization in polymorphonuclear leukocyte lysates indicates that chemoattractant stimulation increases actin filament number without altering the filament length distribution. J Cell Biol. 1991;115:677–687. doi: 10.1083/jcb.115.3.677. [DOI] [PMC free article] [PubMed] [Google Scholar]
- 12.Cao LG, Wang YL. Mechanism of the formation of contractile ring in dividing cultured animal cells. I. Recruitment of preexisting actin filaments into the cleavage furrow. J Cell Biol. 1990;110:1089–1095. doi: 10.1083/jcb.110.4.1089. [DOI] [PMC free article] [PubMed] [Google Scholar]
- 13.Carlier MF, Laurent V, Santolini J, Melki R, Didry D, Xia GX, Hong Y, Chua NH, Pantaloni D. Actin depolymerizing factor (ADF/cofilin) enhances the rate of filament turnover—implication in actin-based motility. J Cell Biol. 1997;136:1307–1322. doi: 10.1083/jcb.136.6.1307. [DOI] [PMC free article] [PubMed] [Google Scholar]
- 14.Carter BL, Jagadish MN. The relationship between cell size and cell division in the yeast Saccharomyces cerevisiae. . Exp Cell Res. 1978;112:15–24. doi: 10.1016/0014-4827(78)90520-7. [DOI] [PubMed] [Google Scholar]
- 15.Chowdhury S, Smith K, Gustin M. Osmotic stress and the yeast cytoskeleton: phenotype-specific suppression of an actin mutation. J Cell Biol. 1992;118:561–571. doi: 10.1083/jcb.118.3.561. [DOI] [PMC free article] [PubMed] [Google Scholar]
- 16.Clinthorne NJ, Pan T-S, Chiao P-C, Rogers WL, Stamos JA. Preconditioning methods for improved convergence rates in iterative reconstructions. IEEE (Inst Electr Electron Eng) Trans Med Imaging. 1993;12:78–83. doi: 10.1109/42.222670. [DOI] [PubMed] [Google Scholar]
- 17.Coluccio LM, Bretscher A. Reassociation of microvillar core proteins: making a microvillar core in vitro. J Cell Biol. 1989;108:495–502. doi: 10.1083/jcb.108.2.495. [DOI] [PMC free article] [PubMed] [Google Scholar]
- 18.Coluccio LM, Tilney LG. Under physiological conditions actin disassembles slowly from the nonpreferred end of an actin filament. J Cell Biol. 1983;97:1629–1634. doi: 10.1083/jcb.97.5.1629. [DOI] [PMC free article] [PubMed] [Google Scholar]
- 19.Conchello, J.A., and J.G. McNally. 1996. Fast regularization technique for expectation maximization algorithm for optical sectioning microscopy. In 3D Microscopy. Proceedings of IS&T/SPIE Symposium on Electronic Imaging: Science and Technology. C.J. Cogswell, G.S. Kino, and T. Wilson, editors. The International Society for Optical Engineering, San Jose, CA. 199–208.
- 20.Coue M, Brenner SL, Spector I, Korn ED. Inhibition of actin polymerization by latrunculin A. FEBS Lett. 1987;213:316–318. doi: 10.1016/0014-5793(87)81513-2. [DOI] [PubMed] [Google Scholar]
- 21.Doyle T, Botstein D. Movement of yeast cortical actin cytoskeleton visualized in vivo. Proc Natl Acad Sci USA. 1996;93:3886–3891. doi: 10.1073/pnas.93.9.3886. [DOI] [PMC free article] [PubMed] [Google Scholar]
- 22.Hall AL, Warren V, Dharmawardhane S, Condeelis J. Identification of actin nucleation activity and polymerization inhibitor in ameboid cells: their regulation by chemotactic stimulation. J Cell Biol. 1989;109:2207–2213. doi: 10.1083/jcb.109.5.2207. [DOI] [PMC free article] [PubMed] [Google Scholar]
- 23.Hartwig JH. Mechanisms of actin rearrangements mediating platelet activation. J Cell Biol. 1992;118:1421–1442. doi: 10.1083/jcb.118.6.1421. [DOI] [PMC free article] [PubMed] [Google Scholar]
- 24.Huxley HE. Electron microscope studies on the structure of natural and synthetic protein filaments from striated muscle. J Mol Biol. 1963;7:281–308. doi: 10.1016/s0022-2836(63)80008-x. [DOI] [PubMed] [Google Scholar]
- 25.Johnston GC, Prendergast JA, Singer RA. The Saccharomyces cerevisiae MYO2gene encodes an essential myosin for vectorial transport of vesicles. J Cell Biol. 1991;113:539–551. doi: 10.1083/jcb.113.3.539. [DOI] [PMC free article] [PubMed] [Google Scholar]
- 26.Kaiser, C., S. Michaelis, and A. Mitchell. 1994. Methods in Yeast Genetics. Cold Spring Harbor Laboratory Press, Cold Spring Harbor, NY. 234 pp.
- 27.Karpova TS, Tatchell K, Cooper JA. Actin filaments in yeast are unstable in the absence of capping protein or fimbrin. J Cell Biol. 1995;131:1483–1493. doi: 10.1083/jcb.131.6.1483. [DOI] [PMC free article] [PubMed] [Google Scholar]
- 28.Kilmartin JV, Adams AEM. Structural rearrangements of tubulin and actin during the cell cycle of the yeast Saccharomyces. . J Cell Biol. 1984;98:922–933. doi: 10.1083/jcb.98.3.922. [DOI] [PMC free article] [PubMed] [Google Scholar]
- 29.Lappalainen P, Drubin DG. Cofilin promotes rapid actin filament turnover in vivo. Nature. 1997;388:78–82. doi: 10.1038/40418. [DOI] [PubMed] [Google Scholar]
- 30.Li R. Bee1, a yeast protein with homology to Wiskott-Aldrich syndrome protein, is critical for the assembly of cortical actin cytoskeleton. J Cell Biol. 1997;136:649–658. doi: 10.1083/jcb.136.3.649. [DOI] [PMC free article] [PubMed] [Google Scholar]
- 31.Lillie SH, Brown SS. Immunofluorescence localization of the unconventional myosin, Myo2p, and the putative kinesin-related protein, Smy1p, to the same regions of polarized growth in Saccharomyces cerevisiae. . J Cell Biol. 1994;125:825–842. doi: 10.1083/jcb.125.4.825. [DOI] [PMC free article] [PubMed] [Google Scholar]
- 32.Liu HP, Bretscher A. Disruption of the single tropomyosin gene in yeast results in the disappearance of actin cables from the cytoskeleton. Cell. 1989;57:233–242. doi: 10.1016/0092-8674(89)90961-6. [DOI] [PubMed] [Google Scholar]
- 33.McNally JG, Preza C, Conchello J-A, Thomas LJ. Artifacts in computational optical-sectioning microscopy. J Opt Soc Am. 1994;11:1056–1067. doi: 10.1364/josaa.11.001056. [DOI] [PubMed] [Google Scholar]
- 34.McNally, J.G., C.J. Cogswell, P.W. Fekete, and J.A. Conchello. 1997. Comparison of 3D microscopy methods by imaging a well characterized test object. In Proceedings of Three-dimensional Microscopy: Image Acquisition and Processing IV. C.J. Cogswell, J.A. Conchello, and T. Wilson, editors. The International Society for Optical Engineering, San Jose, CA. 52–63.
- 35.McNally, J.G., J. Markham, and J.A. Conchello. 1998. Comparing methods for 3D microscopy. In Proceedings of Three-dimensional and Multidimensional Microscopy: Image Acquisition and Processing V. C.J. Cogswell, J.A. Conchello, J.M. Lerner, T. Lu, and T. Wilson, editors. The International Society for Optical Engineering, San Jose, CA. 108–116.
- 36.Moon AL, Janmey PA, Louie KA, Drubin D. Cofilin is an essential component of the yeast cortical cytoskeleton. J Cell Biol. 1993;120:421–435. doi: 10.1083/jcb.120.2.421. [DOI] [PMC free article] [PubMed] [Google Scholar]
- 37.Mortimer R, Johnston J. Life span of individual yeast cells. Nature. 1959;183:1751–1752. doi: 10.1038/1831751a0. [DOI] [PubMed] [Google Scholar]
- 38.Mulholland J, Preuss D, Moon A, Wong A, Drubin D, Botstein D. Ultrastructure of the yeast actin cytoskeleton and its association with the plasma membrane. J Cell Biol. 1994;125:381–391. doi: 10.1083/jcb.125.2.381. [DOI] [PMC free article] [PubMed] [Google Scholar]
- 39.Pollard TD. Rate constants for the reactions of ATP- and ADP-actin with the ends of actin filaments. J Cell Biol. 1986;103:2747–2754. doi: 10.1083/jcb.103.6.2747. [DOI] [PMC free article] [PubMed] [Google Scholar]
- 40.Preza C, Miller MI, Thomas LJ, Jr, McNally JG. Regularized linear reconstruction of three-dimensional microscopic objects from optical sections. J Opt Soc Am. 1992;9:219–228. doi: 10.1364/josaa.9.000219. [DOI] [PubMed] [Google Scholar]
- 41.Spector I, Shochet NR, Blasberger D, Kashman Y. Latrunculins—novel marine macrolides that disrupt microfilament organization and affect cell growth: I. Comparison with cytochalasin D. Cell Motil Cytoskel. 1989;13:127–144. doi: 10.1002/cm.970130302. [DOI] [PubMed] [Google Scholar]
- 42.Spiegel, M.R. 1975. Shaum's outline of theory and problems of probability and statistics. McGraw-Hill Book Company, New York. 372 pp.
- 43.Sprague GF. Assay of yeast mating reaction. Methods Enzymol. 1991;194:77–93. doi: 10.1016/0076-6879(91)94008-z. [DOI] [PubMed] [Google Scholar]
- 44.Tapon N, Hall A. Rho, Rac and Cdc42 GTPases regulate the organization of the actin cytoskeleton. Curr Opin Cell Biol. 1997;9:86–92. doi: 10.1016/s0955-0674(97)80156-1. [DOI] [PubMed] [Google Scholar]
- 45.Waddle JA, Karpova TS, Waterston RH, Cooper JA. Movement of cortical actin patches in yeast. J Cell Biol. 1996;132:861–870. doi: 10.1083/jcb.132.5.861. [DOI] [PMC free article] [PubMed] [Google Scholar]
- 46.Williamson DH. The timing of deoxyribonucleic acid synthesis in the cell cycle of Saccharomyces cerevisiae. . J Cell Biol. 1965;25:517–528. doi: 10.1083/jcb.25.3.517. [DOI] [PMC free article] [PubMed] [Google Scholar]
- 47.Winter D, Podtelejnikov AV, Mann M, Li R. The complex containing actin-related proteins Arp2 and Arp3 is required for the motility and integrity of yeast actin patches. Curr Biol. 1997;7:519–529. doi: 10.1016/s0960-9822(06)00223-5. [DOI] [PubMed] [Google Scholar]