Abstract
Molybdenum (Mo) is a trace element essential for living organisms, however no molybdate transporter has been identified in eukaryotes. Here, we report the identification of a molybdate transporter, MOT1, from Arabidopsis thaliana. MOT1 is expressed in both roots and shoots, and the MOT1 protein is localized, in part, to plasma membranes and to vesicles. MOT1 is required for efficient uptake and translocation of molybdate and for normal growth under conditions of limited molybdate supply. Kinetics studies in yeast revealed that the Km value of MOT1 for molybdate is ≈20 nM. Furthermore, Mo uptake by MOT1 in yeast was not affected by coexistent sulfate, and MOT1 did not complement a sulfate transporter-deficient yeast mutant strain. These data confirmed that MOT1 is specific for molybdate and that the high affinity of MOT1 allows plants to obtain scarce Mo from soil.
Keywords: molybdenum, nutrition
Molybdenum (Mo) is an essential element for prokaryotes and eukaryotes (1). Mo is a transition element, and is used by several enzymes that participate in reduction and oxidation reactions. In molybdenum-requiring enzymes (molybdoenzymes), except for bacterial nitrogenase, Mo is bound to pterin to form Mo-cofactor (Moco) (2). In plants, nitrate reductase, aldehyde oxidase, sulfite oxidase, and xanthine oxidase are known as molybdoenzymes (3). Nitrate reductase catalyzes reduction of nitrate to nitrite, the first step of nitrate assimilation to ammonia and amino acids. Aldehyde oxidase is involved in an oxidation reaction that leads to the synthesis of abscisic acid. Plants that are incapable of using Moco are shown to be defective in nitrate reduction (4) and abscisic acid biosynthesis (5, 6).
Plants take up Mo from soil as molybdate (MoO42−). Molybdate is a weak Lewis acid, and the availability of Mo depends on soil pH. Mo deficiency is a widespread agricultural problem, especially in acid soils (7). Regarding to the mechanism of Mo uptake from environment, molybdate transporters (ModABC), which belong to the ATP-binding cassette protein superfamily, have been described in eubacteria (8) and archaea (9). The members of the ATP-binding cassette protein superfamily exist in eukaryotes; however, molybdate-specific transporters have not been identified from this superfamily in eukaryotes. It is possible that molybdate is transported by other transporters in eukaryotes.
Molybdate concentrations in soils are diverse, but the average of that in surface waters is reported to be ≈10 nM (10). Many of the other known high-affinity transporters for mineral nutrients in plants (11–17) have Km values in the μM range. Through the analysis of two accessions, we identified a molybdate transporter, MOT1, from Arabidopsis thaliana. We demonstrate that the Km value of MOT1 for molybdate is 20 nM, and this high-affinity MOT1 allows to plants to take up scarce molybdate in soils.
Results and Discussion
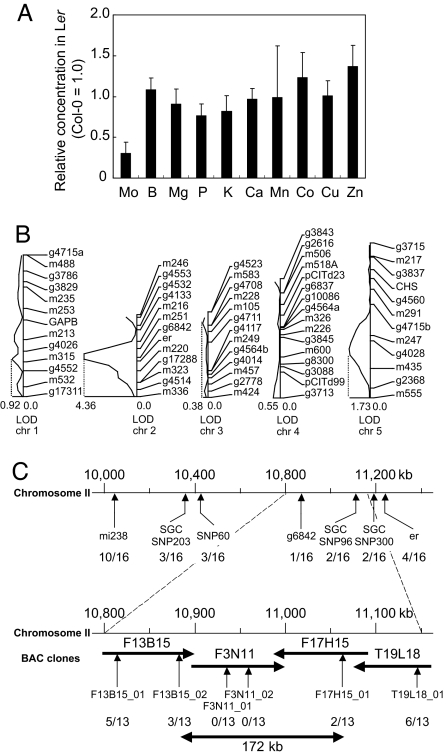
In our effort to characterize the A. thaliana mutant bor1-1 (18, 19), we determined the concentrations of 10 elements in shoots of A. thaliana plants grown hydroponically in a standard medium (20). We found that bor1-1 specifically reduces boron concentration in rosette leaves but not the other elements examined. In this analysis, we also noticed that the concentrations of Mo, but not those of the other nine elements examined, differed by approximately 3-fold between the accessions Col-0 and Ler (Fig. 1A). A similar result has also been reported (21).
Fig. 1.
Difference in Mo concentration between Col-0 and Ler and quantitative trait loci mapping. (A) Comparison of elemental concentrations in shoots of A. thaliana Col-0 and Ler. Col-0 and Ler plants were grown hydroponically in a standard medium (20) for 18 days. The concentration of each element in Ler plants is shown relative to those in Col-0 plants. Averages and standard deviations are shown; n = 5. (B) Quantitative trait loci mapping of Mo concentration. Logarithm of odds (LOD) score curves of chromosomes 1–5 were obtained from the Mo concentration in shoots of the basic set of RI lines derived from a cross between Ler and Col-0 (22). The 18 RI lines and the parental lines were grown hydroponically with the standard medium for 26 days. The curves are derived from the interval-mapping methods by using QGENE software (23). The highest LOD scores on each chromosome are presented. (C) Mapping of MOT1. 16 recombinant inbred lines (Col-0 × Ler) containing recombination between the markers mi238 and er were scored for Mo concentrations and genetic markers. The RI mapping data referred to the data published by the Nottingham Arabidopsis Stock Centre. The RI lines were sorted into two classes based on their shoot Mo concentrations (high, Col-0 type; low, Ler type). The class of each was compared with the genotype in each marker, and the number of mismatches was counted. The arrow and number indicate the position of genetic markers and the count of mismatches. To identify the single locus correlated with the shoot Mo concentration, Col-0 × Ler F2 lines were analyzed in the same manner. The genotype in each marker in these plants was compared with the class into which they sorted, and the number of mismatches was counted. Thirteen F2 lines containing recombinations between the markers F3B15_01 and T19L18_01 were found and the count of mismatches in each marker is shown as described above. BAC, bacterial artificial chromosome.
To understand the genetic mechanism that controls Mo concentration in shoots, Col-0 × Ler recombinant inbred lines (22) were grown, and their Mo concentrations were determined. The results indicated that the trait is mostly regulated by a single locus on chromosome 2 (Fig. 1B). Further genetic analysis of Col-0 × Ler RI lines and F2 lines delimited the locus in a 172-kb region of chromosome 2 between polymorphisms located at 10,887,652 bp (F13B15_02) and 11,060,616 bp (F17B15_01) (Fig. 1C). This region is predicted to contain 36 genes including a gene (At2g25680) annotated as Sultr5;2 (representing a member of sulfate transporter) (13). However, to our knowledge, no sulfate transport activity has been demonstrated for this protein. A transcriptome study indicated that the accumulation of At2g25680 transcripts is not affected by sulfur deficiency, unlike the transcripts of other major sulfate transporters (24). Mo is taken up from soil by plants in the form of molybdate (MoO42−), which is chemically similar to sulfate (7). We speculated that At2g25680 was a molybdate transporter, and the causal gene of the difference in Mo concentration in shoots between the two accessions. Analysis of the nucleotide sequences of this intronless gene in Col-0 and Ler identified two differences (25). One is a single nucleotide substitution at position 1,286 (relative to the initiation codon). In Col-0 and Ler, this nucleotide was A and T, respectively, corresponding to an amino acid residue difference of Asp429 in Col-0 to Val429 in Ler. The other is a deletion/insertion of a 53-bp sequence just upstream of the initiation codon. The nucleotide sequence corresponding to −27 to −79 upstream of the start codon in Col-0 is not present in Ler. These differences were inferred to affect activity of the translation product and the gene expression level, respectively.
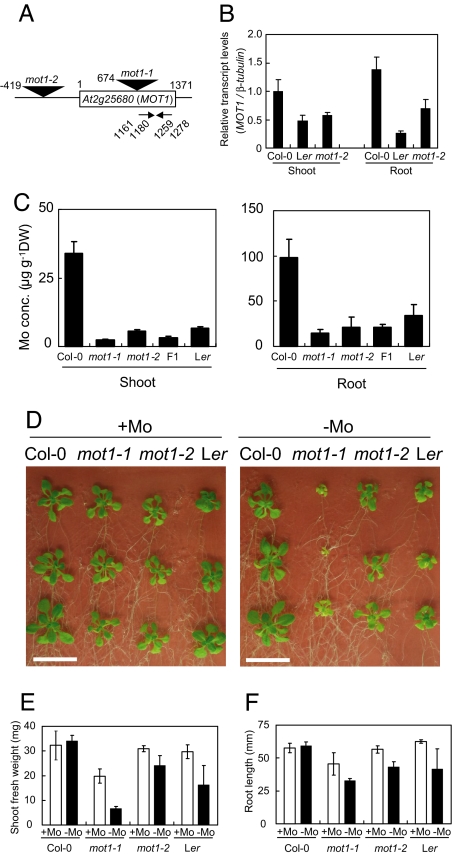
To confirm that At2g25680 is the gene responsible for the differences in shoot Mo concentrations, two independent transgenic plant lines carrying transferred DNA (T-DNA) inserted in At2g25680 were obtained from the Arabidopsis Biological Resource Center at Ohio State University (Columbus, OH). Sequence analysis of the junction of the T-DNA with the genomic DNA confirmed that the lines SALK_118311 and SALK_069683 carry T-DNAs in the coding and promoter regions of At2g25680, respectively (Fig. 2A). These lines will be referred to as mot1-1 and mot1-2 (for molybdate transporter). Considering the position of the T-DNA insertion, the mot1-1 mutant is unlikely capable of producing a normal At2g25680. The levels of At2g25680 transcript accumulation in mot1-2 mutant plants were found to be ≈50% of that in wild-type plants, in both shoots and roots (Fig. 2B). Accumulation of At2g25680 transcripts in Ler was also reduced to ≈50% and 20% of the levels in shoots and roots, respectively, of Col-0 (Fig. 2B). It is possible that the deletion in the promoter region of At2g25680 in Ler is the cause of the reduced accumulation of At2g25680 transcripts in this accession.
Fig. 2.
Characterization of T-DNA insertion mutants of A. thaliana. (A) Sites of T-DNA insertion and primers used for transcript amplification. The locations of the T-DNA insertions and positions of the left border are represented with triangles and numbers. For the nucleotide numbers, the A in the ATG translation initiation codon was designated as +1. The two primers contained sequences between the nucleotide numbers indicated were used for the determination of transcript accumulation. (B) Relative accumulation of the MOT1 transcript measured by using reverse-transcription-mediated quantitative real-time PCR. Plants were grown on a solid standard medium (20). The accumulation of the MOT1 transcript is expressed relative to that of the β-tubulin transcript. Averages and standard deviations are shown; n = 3. (C) Mo concentrations in roots and shoots. Plants were grown hydroponically for 5 weeks in the standard medium (20). Averages and standard deviations are shown; n = 5. (D) Effect of Mo deprivation on plant growth. Wild-type and mutant plants were grown for 18 days on vertically placed solid medium. Molybdate (170 nM) was added in +Mo medium and not in −Mo medium. (Scale bars: 2 cm.) (E) Growth of mot1 mutants. The seeds harvested from the plants grown on rockwool supplied with standard medium (20) without molybdate were used for this growth test. Plants were grown on solid standard medium with an added 14 mM KNO3 with and without 170 nM molybdate. The shoot fresh weights of plants grown for 15 days were measured, and averages and standard deviations are shown; n = 4. (F) The root length of plants grown for 8 days. Averages and standard deviations are shown; n = 4.
We next determined the Mo concentration in shoots and roots of the mutant lines. The lines were grown in the presence of 170 nM molybdate for 5 weeks, after which the Mo concentrations in shoots and roots were determined (Fig. 2C). The Mo concentrations in shoots of the mot1-1 and mot1-2 mutant plants were reduced to 10% and 20%, respectively, of that in the wild type, and, in roots, the Mo concentrations were reduced to 20% and 25% of that in the wild type. These results indicate that At2g25680 is the determinant of the Mo concentration in both roots and shoots. For further confirmation, the Mo concentration in shoots of F1 progeny from crosses between mot1-1 and mot1-2 were determined and found to be <20% of that in wild-type plants (Fig. 2C). Mo concentrations were also determined in shoots of individual F2 progeny from crosses between the mot1-1 mutant and Col-0. Among the 41 F2 plants examined, 4 plants were found to be homozygous for the T-DNA insertion. Each of the four lines had Mo concentrations ≈10% of that in the wild type. In all of the other F2 plants, each of which carried the intact At2g25680 gene, the Mo levels in shoots were similar to that in wild type (data not shown). These results further confirm that At2g25680 is the causal gene for the phenotype. We therefore named the At2g25680 gene MOT1.
Because shoots and roots of mot1-1 and mot1-2 mutant plants contain reduced levels of Mo, we postulated that the growth of the mutants would be affected under conditions of limited Mo supply. To test this hypothesis, the mot1 mutant, Col-0, and Ler plants were grown together on medium (20) with and without supplementation of Mo (Fig. 2D). Because Mo stored in seeds may influence plant growth, the seeds used for these tests were harvested from plants grown on rockwool supplied with the standard medium without molybdate. When compared with growth under conditions of normal Mo supply, growth under Mo limitation reduced shoot growth to 35%, 80%, and 55% in mot1-1, mot1-2 mutants and Ler plants, respectively (Fig. 2E). In contrast, the shoot fresh weight of Col-0 did not change significantly (P > 0.05). Root lengths were also reduced to ≈70%, 75%, and 65% in mot1-1, mot1-2 mutants and Ler plants, respectively (Fig. 2F). These results suggest that MOT1 is required for efficient growth of both roots and shoots under conditions of limited Mo supply. It is likely that plant growth on medium without supplementation of Mo is supported by Mo contamination in the medium or Mo stored in seeds. The levels of Mo contamination in our media were found to be <5 nM (data not shown).
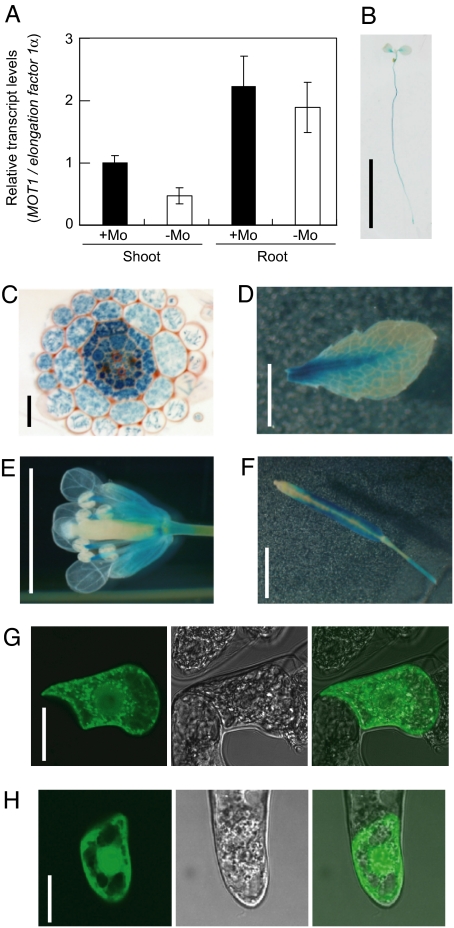
To investigate regulation of MOT1 gene expression by Mo availability, we performed quantitative RT-PCR to quantify MOT1 mRNA from plants grown under sufficient or limited Mo conditions. Plants were grown on the solid standard medium with and without molybdate for 14 days, and total RNA was isolated from shoots and roots. Under Mo limitation, MOT1 expression in shoots was decreased to 50% of that in plants supplied with sufficient Mo. MOT1 expression in roots was slightly but significantly reduced under Mo limitation (Fig. 3A).
Fig. 3.
Tissue specificity of MOT1 expression and subcellular localization of MOT1. (A) Quantitative RT-PCR was performed to analysis the expression level of MOT1 in shoots and roots of plants grown on Mo-sufficient or -deficient solid media. The accumulation of the MOT1 transcript is expressed relative to that of the elongation factor 1α transcript. Averages and standard deviations are shown; n = 3. (B–F) GUS staining of transgenic plants carrying the MOT1 promoter–GUS construct. Whole plant (B) and cross-section of the root (C) of a seedling, rosette leaf (D), flower (E), and silique (F) of plants at the reproductive stage are shown. Similar results were obtained from five independently transformed lines. (G and H) Tobacco cultured cells expressing GFP-MOT1 fusion (G) or free GFP (H) under control of a cauliflower mosaic virus 35S RNA promoter. The cells were observed under a confocal laser scanning microscope. Fluorescence (Left), transmission (Center), and merged (Right) images are shown. (Scale bars: B, 1 cm; C, 25 μm; D–F, 5 mm; G and H, 25 μm.)
We then examined the tissue specificity of MOT1 expression in transgenic Col-0 plants expressing the β-glucuronidase (GUS) under control of the MOT1 promoter. Plants were grown on the solid standard medium or on rockwool supplied with the Mo-supplemented standard medium. In 7-day-old seedlings, GUS activity was observed in roots and petioles of cotyledons (Fig. 3B) and in all cells in the mature portion of roots (Fig. 3C). In plants at the reproductive stage, GUS activity was observed in mesophylls and petioles of leaves, stamen, and calyx in flowers and siliques (Fig. 3 D–F). These expression patterns were observed consistently in five independent transgenic lines. These results suggest that MOT1 is expressed mostly throughout the plant body and may be important for Mo uptake in various types of cells in both roots and shoots.
We next investigated subcellular localization of MOT1. GFP-MOT1 was expressed in tobacco (Nicotiana tabacum L.) BY-2 cells were cultured under control of the cauliflower mosaic virus 35S RNA promoter, and GFP fluorescence was observed by using a laser scanning confocal microscope. Typical images of tobacco cells expressing GFP-MOT1 (Fig. 3G) or GFP alone (Fig. 3H) are shown. Fluorescence was observed in dot-like structures and in the periphery of the cells bombarded with GFP-MOT1. Compared with the pattern observed with free GFP, fluorescence of GFP-MOT1 cells is more confined to near the plasma membrane (see right-hand side of the cells in Fig. 3 G and H). These results suggest that MOT1 is localized to the plasma membrane and the endomembrane presumably in the secretory and/or endocytic pathways.
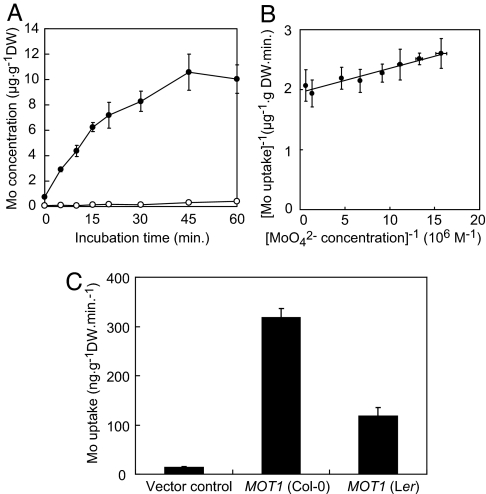
To examine the molybdate transport activity of the protein, MOT1 was expressed in the yeast Saccharomyces cerevisiae. Yeast transformants cultured in Mo-free SD medium (26) to the midlog phase were transferred to synthetic defined (SD) medium containing 170 nM molybdate, and after various exposure times, Mo concentrations in cells were determined. In cells containing the empty vector, the Mo concentration remained low for the duration of the experiment (Fig. 4A, open circles). In contrast, in cells expressing MOT1, the Mo concentrations increased linearly up to 15 min, and a steady-state level [≈10 μg·g−1DW as Mo, which is ≈100 nmol·g−1 dry weight (DW)], was attained within 45 min (Fig. 4A, filled circles). The dry weight of yeast cells is hypothesized to be ≈30% of fresh weight (26). The stationary level of Mo concentration in cells expressing MOT1 was estimated to be roughly 30 μM; >100-fold higher than that in the medium used for the uptake study. These results indicated that MOT1 is a molybdate transporter capable of transporting molybdate against a concentration gradient.
Fig. 4.
Transport properties of MOT1. (A) Time course of molybdate uptake in S. cerevisiae cells expressing MOT1 (filled circles) or cells containing the empty vector (open circles). (B) Lineweaver–Burk plot of molybdate uptake in S. cerevisiae cells expressing MOT1 under various Mo conditions. (C) Molybdate uptake in S. cerevisiae cells expressing MOT1 cloned from Col-0 or Ler. The cells were incubated with 170 nM molybdate for 15 min. Averages and standard deviations are shown; n = 4 (A and C) or 3 (B).
We then investigated the molybdate transport kinetics of MOT1. Yeast transformants expressing MOT1 were exposed to SD medium containing various concentrations of Mo for 15 min, and total Mo concentrations in the cells were determined. Kinetics analysis of the results showed that Km and Vmax values for molybdate uptake of yeast expressing MOT1 were 21 ± 4 nM and 0.5 ± 0.1 μg·g−1DW·min−1, respectively (Fig. 4B). To our knowledge, 20 nM is the lowest Km values of the mineral–nutrient transporters in plants reported (11–17) thus far.
In planta, the Mo concentrations in roots and shoots of Ler were lower than those of Col-0 (Fig. 2C). We measured the Mo concentrations in cells expressing MOT1 from Ler and found that the Ler type MOT1 also has molybdate transport activity, but Mo levels in cells were lower than that of cells expressing MOT1 from Col-0 (Fig. 4C). It is possible that the amino acid substitution in MOT1 in Ler affects molybdate transport activity.
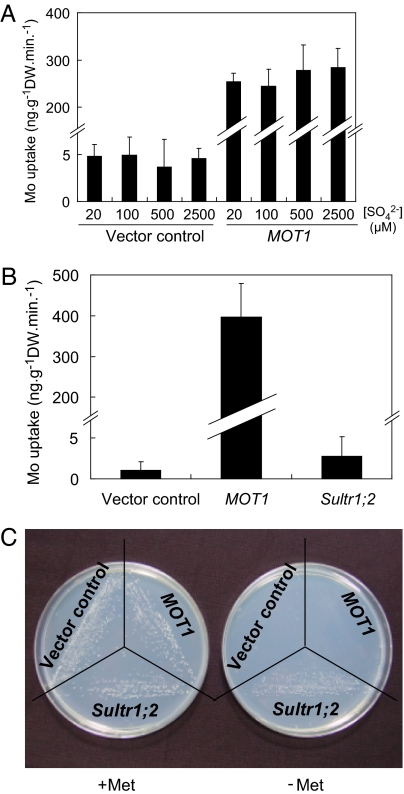
Because the chemical properties of molybdate are similar to sulfate, we investigated the effect of coexistent sulfate on molybdate uptake by MOT1. Yeast transformants expressing MOT1 were cultured in Mo-free SD medium (26) to the midlog phase and were transferred to SD medium containing 170 nM molybdate and 20, 100, 500, or 2,500 μM sulfate. The cells were incubated for 15 min, and Mo concentrations in cells were determined. No significant differences were found in their Mo concentrations (Fig. 5A).
Fig. 5.
Specificity of MOT1 transporter. (A) Effect of sulfate on molybdate uptake in S. cerevisiae cells expressing MOT1. The cells were incubated with 170 nM molybdate and 20, 100, 500, or 2500 μM sulfate for 15 min. Averages and standard deviations are shown; n = 4. (B) Molybdate uptake in S. cerevisiae cells expressing Sultr1;2 or MOT1 cloned from Col-0. These cells, together with those carrying only vector (Vector control), were incubated with 170 nM molybdate for 15 min. Averages and standard deviations are shown; n = 4. (C) Complementation analysis of a S. cerevisiae mutant defective in sulfate uptake. The mutant strain was transformed with vector, vector carrying Sultr1;2, or MOT1 and incubated in media with and without Met, as described (27).
Because MOT1 is similar to sulfate transporters, we examined molybdate transport activity of a sulfate transporter from A. thaliana. Yeast cells expressing Sultr1;2, a high-affinity sulfate transporter required for sulfate uptake from soil, were exposed to molybdate, and Mo concentrations in cells were determined. Unlike that observed for MOT1, expression of Sultr1;2 did not cause high accumulation of Mo (Fig. 5B). We also examined the possible sulfate transport activity of MOT1. MOT1 was expressed in yeast mutant CP154-7B (27, 28), which is defective in two high-affinity sulfate transporters, and growth of the transformants were compared on the media containing sulfate as a sole source of sulfur. Expression of MOT1 did not complement the growth defect of the mutant strain on −Met media, whereas Sultr1;2 complemented the defect (Fig. 5C). This result suggests that MOT1 does not transport sulfate to the extent of high-affinity transporters. It is likely that MOT1 and sultr1;2 are specific to molybdate and sulfate, respectively. It is possible that MOT1 evolved from an ancestral sulfate transporter gene and diverged to obtain a molybdate-specific transport function.
Taken together, the present results demonstrate that MOT1 is a high-affinity transporter essential for plants to take up scant molybdate from soil. MOT1 is expressed in the whole-cell layer in root, especially at higher levels in endodermis and stele cells. These results suggest that MOT1 accumulates molybdate in the stele cells, and different transporters may exist for loading accumulated molybdate to xylem. In addition, MOT1 is expressed in the shoot, and Mo concentrations in the shoots of mot1 mutants were decreased. These facts suggest that MOT1 enhances molybdate uptake from soil into root cells for utilization and also for translocation to shoots.
Materials and Methods
Plant Materials.
Col-0 and Ler of A. thaliana (L.) Heynh were derived from our laboratory stock. The SALK_118311 (mot1-1) and SALK_069683 (mot1-2) lines were obtained, and homozygous lines for the T-DNA insertion were selected by using gene-specific primers in combination with the T-DNA left border-specific primer. The resulting PCR products were sequenced to determine the location of the T-DNA insertion. The seeds used for growth tests were harvested from the plants grown on rockwool supplied with standard medium (20) without molybdate.
Mapping of MOT.
Eighteen recombinant inbred lines (Col-0 × Ler) (22) were scored for shoot Mo concentration for quantitative trait loci analysis. Shoot Mo concentration in Col-0 × Ler F2 lines were determined for fine mapping, and 13 F2 lines with recombinations between two MOT1 franking markers were used to further delimit the MOT1 locus.
Quantitative RT-PCR.
Total RNA was isolated from plant materials and subjected to quantitative RT-PCR analysis (29). The sizes of the amplified fragments were confirmed by gel electrophoresis.
Plasmid Construction and Plant Transformation.
Details of the construction are described in supporting information (SI) Text. Plant transformations with Agrobacterium and particle bombardment were carried out as described (30).
Expression of MOT1 in S. cerevisiae and Molybdate Transport Assay.
The MOT1 ORF was amplified by PCR and cloned into the yeast expression vector pYX222x (27), which contains the triose phosphate isomerase promoter for constitutive expression of MOT1. The S. cerevisiae strains BY4741 and CP154-7B (27) were transformed with the pYX222x vector containing MOT1 or A. thaliana Sultr1;2 (27). For time-course analysis of molybdate uptake, cells were transferred to the medium supplemented with 24 nM hexaammonium heptamolybdate, and shaken at 30°C for 0, 5, 10, 15, 20, 30, 45, or 60 min. For kinetic analysis of molybdate uptake, cells were transferred to the medium supplemented with 7, 8, 10, 12, 16, 24, 97 or 194 nM hexaammonium heptamolybdate, and shaken at 30°C for 15 min. Then, cells were harvested by centrifugation and washed twice with ice-cold deionized water. Yeast pellets were oven-dried, and their dry weights were determined. The experiment was performed on three or four independent transformants.
Analysis of Nutrient Concentration.
Plant and yeast samples were prepared as described (30). Nutrient concentrations in the samples were determined as described (19).
Supplementary Material
Acknowledgments
We thank Y. Kawara and K. Aizawa for excellent technical assistance. We acknowledge Drs. Y. Niwa (University of Shizuoka, Shizuoka, Japan), K. Schumacher (Universität Tübingen, Tübingen, Germany), G. Schaaf (Universität Hohenheim, Hohenheim, Germany), M. D. Curtis, and U. Grossniklaus (Universität Zürich, Zürich, Switzerland) for providing plasmids; Dr. Akiko Yamamoto (Mie University, Mie-ken, Japan) for providing QGENE software; Nottingham Arabidopsis Stock Centre (Loughborough, U.K.) for providing seeds of the RI lines. We thank Dr. Emilio Fernández for sharing unpublished information about their recently identified molybdate transporter from Chlamydomonas reinhardtii, Drs. T. Uemura and T. Ueda for detailed advice on transformation of Arabidopsis cultured cells, and K. Miwa and D. Goto for critical reading of the manuscript. This work was supported, in part, by grants for Scientific Research on Priority Areas from the Japanese Ministry of Education, Culture, Sports, and Science, by a Grant-in-Aid for Scientific Research (B), from a 21st Century Center of Excellence project, and from the Greentechno Project by the Ministry of Agriculture of Japan (to T.F.).
Footnotes
The authors declare no conflict of interest.
This article is a PNAS Direct Submission.
This article contains supporting information online at www.pnas.org/cgi/content/full/0706373104/DC1.
References
- 1.Mendel RR, Bittner F. Biochim Biophys Acta Mol Cell Res. 2006;1763:621–635. doi: 10.1016/j.bbamcr.2006.03.013. [DOI] [PubMed] [Google Scholar]
- 2.Johnson JL, Hainline BE, Rajagopalan KV. J Biol Chem. 1980;255:1783–1786. [PubMed] [Google Scholar]
- 3.Mendel RR, Hänsch R. J Exp Bot. 2002;53:1689–1698. doi: 10.1093/jxb/erf038. [DOI] [PubMed] [Google Scholar]
- 4.Mendel RR, Alikulov ZA, Lvov NP, Müller AJ. Mol Gen Genet. 1981;181:395–399. [Google Scholar]
- 5.Bittner F, Oreb M, Mendel RR. J Biol Chem. 2001;276:40381–40384. doi: 10.1074/jbc.C100472200. [DOI] [PubMed] [Google Scholar]
- 6.Xiong LM, Ishitani M, Lee H, Zhu JK. Plant Cell. 2001;13:2063–2083. doi: 10.1105/TPC.010101. [DOI] [PMC free article] [PubMed] [Google Scholar]
- 7.Marschner H. Mineral Nutrition of Higher Plants. 2nd Ed. London: Academic; 1995. pp. 369–379. [Google Scholar]
- 8.Zahalak M, Pratte B, Werth KJ, Thiel T. Mol Microbiol. 2004;51:539–549. doi: 10.1046/j.1365-2958.2003.03851.x. [DOI] [PubMed] [Google Scholar]
- 9.Wanner C, Soppa J. Genetics. 1999;152:1417–1428. doi: 10.1093/genetics/152.4.1417. [DOI] [PMC free article] [PubMed] [Google Scholar]
- 10.Smith KS, Balistrieri LS, Smith SM, Srivastava RC. In: Molybdenum in Agriculture. Gupta UC, editor. Cambridge, UK: Cambridge Univ Press; 1997. pp. 23–46. [Google Scholar]
- 11.Smith FW, Rae AL, Hawkesford MJ. Biochem Biophys Acta Biomembr. 2000;1465:236–245. doi: 10.1016/s0005-2736(00)00141-3. [DOI] [PubMed] [Google Scholar]
- 12.Glass ADM, Britto DT, Kaiser BN, Kinghorn JR, Kronzucker HJ, Kumar A, Okamoto M, Rawat S, Siddiqi MY, Unkles SE, et al. J Exp Bot. 2002;53:855–864. doi: 10.1093/jexbot/53.370.855. [DOI] [PubMed] [Google Scholar]
- 13.Buchner P, Takahashi H, Hawkesford MJ. J Exp Bot. 2004;55:1765–1773. doi: 10.1093/jxb/erh206. [DOI] [PubMed] [Google Scholar]
- 14.Eide D, Broderius M, Fett J, Guerinot ML. Proc Natl Acad Sci USA. 1996;93:5624–5628. doi: 10.1073/pnas.93.11.5624. [DOI] [PMC free article] [PubMed] [Google Scholar]
- 15.Li LG, Tutone AF, Drummond RSM, Gardner RC, Luan S. Plant Cell. 2001;13:2761–2775. doi: 10.1105/tpc.010352. [DOI] [PMC free article] [PubMed] [Google Scholar]
- 16.Korshunova YO, Eide D, Clark WG, Guerinot ML, Pakrasi HB. Plant Mol Biol. 1999;40:37–44. doi: 10.1023/a:1026438615520. [DOI] [PubMed] [Google Scholar]
- 17.Grotz N, Fox T, Connolly E, Park W, Guerinot ML, Eide D. Proc Natl Acad Sci USA. 1998;95:7220–7224. doi: 10.1073/pnas.95.12.7220. [DOI] [PMC free article] [PubMed] [Google Scholar]
- 18.Noguchi K, Yasumori M, Imai T, Naito S, Matsunaga T, Oda H, Hayashi H, Chino M, Fujiwara T. Plant Physiol. 1997;115:901–906. doi: 10.1104/pp.115.3.901. [DOI] [PMC free article] [PubMed] [Google Scholar]
- 19.Takano J, Yamagami M, Noguchi K, Hayashi H, Fujiwara T. Soil Sci Plant Nutr. 2001;47:345–357. [Google Scholar]
- 20.Fujiwara T, Hirai MY, Chino M, Komeda Y, Naito S. Plant Physiol. 1992;99:263–268. doi: 10.1104/pp.99.1.263. [DOI] [PMC free article] [PubMed] [Google Scholar]
- 21.Lahner B, Gong J, Mahmoudian M, Smith EL, Abid KB, Rogers EE, Guerinot ML, Harper JF, Ward JM, McIntyre L, et al. Nat Biotech. 2003;21:1215–1221. doi: 10.1038/nbt865. [DOI] [PubMed] [Google Scholar]
- 22.Lister C, Dean C. Plant J. 1993;4:745–750. [Google Scholar]
- 23.Nelson JC. Mol Breed. 1997;3:239–245. [Google Scholar]
- 24.Maruyama-Nakashita A, Nakamura Y, Watanabe-Takahashi A, Inoue E, Yamaya T, Takahashi H. Plant J. 2005;42:305–314. doi: 10.1111/j.1365-313X.2005.02363.x. [DOI] [PubMed] [Google Scholar]
- 25.Jander G, Norris SR, Rounsley SD, Bush DF, Levin IM, Last RL. Plant Physiol. 2002;129:440–450. doi: 10.1104/pp.003533. [DOI] [PMC free article] [PubMed] [Google Scholar]
- 26.Sherman F. Method Enzymol. 1991;194:3–21. doi: 10.1016/0076-6879(91)94004-v. [DOI] [PubMed] [Google Scholar]
- 27.Shibagaki N, Rose A, McDermott JP, Fujiwara T, Hayashi H, Yoneyama T, Davies JP. Plant J. 2002;29:475–486. doi: 10.1046/j.0960-7412.2001.01232.x. [DOI] [PubMed] [Google Scholar]
- 28.Yoshimoto N, Takahashi H, Smith FW, Yamaya T, Saito K. Plant J. 2002;29:465–473. doi: 10.1046/j.0960-7412.2001.01231.x. [DOI] [PubMed] [Google Scholar]
- 29.Ohkama N, Takei K, Sakakibara H, Hayashi H, Yoneyama T, Fujiwara T. Plant Cell Physiol. 2002;43:1493–1501. doi: 10.1093/pcp/pcf183. [DOI] [PubMed] [Google Scholar]
- 30.Takano J, Noguchi K, Yasumori M, Kobayashi M, Gajdos Z, Miwa K, Hayashi H, Yoneyama T, Fujiwara T. Nature. 2002;420:337–340. doi: 10.1038/nature01139. [DOI] [PubMed] [Google Scholar]
Associated Data
This section collects any data citations, data availability statements, or supplementary materials included in this article.


