Abstract
Nitrous oxide reductase (N2OR) is a dimeric copper-dependent bacterial enzyme that catalyzes the reduction of N2O to N2 as part of the denitrification pathway. In the absence of an x-ray crystal structure, the current model of the nature of the copper sites within the enzyme is based on four copper atoms per monomer and assigns two copper atoms to an electron transfer center, CuA, a bis-thiolate-bridged dinuclear copper center found to date only in N2OR and cytochrome c oxidase, and two copper atoms to a second dinuclear center, CuZ, presumed to be the site of catalysis. Based on detailed analysis of the low temperature magnetic CD spectra of N2OR, this paper revises the current model and proposes that both CuA and CuZ are variants of an electron transfer center and hence that all of the observed optical features are due to this electron transfer center. It is proposed further that the presence of these different forms provides a mechanism for the delivery of two electrons to an active site comprising copper ions lacking thiolate coordination.
Nitrous oxide reductase (N2OR) catalyzes the two electron reduction of N2O to N2 as one component in the pathway of the reduction of nitrate to N2 by denitrifying bacteria (1, 2). The enzyme has been isolated from a variety of sources, including Pseudomonas stutzeri (3), Rhodobacter capsulatus (4), and Paracoccus denitrificans (5). N2OR is a soluble periplasmic enzyme, except for the enzyme from Flexibacter canadiensis, which is membrane-bound (6). The physiological electron donor is believed to be either a c-type cytochrome or pseudoazurin (2). All of the enzymes isolated to date contain between six and nine copper atoms per homodimer. Enzyme from Wollinella succinogenes (7) contains two heme groups in addition to copper.
Although no crystal structure is yet available, extensive spectroscopic characterization has been carried out, particularly on the enzyme from P. stutzeri. This has established the presence of a dinuclear copper–thiolate chromophore called CuA, a Class III (8) mixed-valence (MV) [Cu(II)Cu(I)] center so far identified in both N2OR and subunit II of cytochrome c oxidase (COX) (9, 10). The x-ray structures of a soluble domain of subunit II from Escherichia coli quinol oxidase into which the CuA ligands have been introduced (11) and of COX, from both P. denitrificans (12) and bovine heart (13), confirm earlier spectroscopic assignments of CuA as a dimeric copper center (9, 10) with two bridging cysteine thiolate ligands and two terminal histidine nitrogen ligands. There is evidence of variation in the CuA center, either in the second coordination sphere as observed for the center in purple CyoA (14) or in the ligands of the first coordination sphere, e.g., in a high pH form and in site-directed mutants of the P. denitrificans CuA domain (15). The recent synthesis of an inorganic bis-thiolate-bridged MV di-copper complex (16) has added to the known structural variants of MV copper–thiolate clusters.
Although much effort has been aimed at establishing the presence of CuA in N2OR, relatively little attention has been paid either to the role or to the structure of the other copper centers present in the enzyme. A widely accepted model of the arrangement of these copper atoms, following a proposal based on the EPR and low temperature magnetic CD (LT-MCD) spectroscopic characterization of P. stutzeri N2OR (17) and assuming four copper atoms per monomer, assigns two copper atoms to a CuA center and two copper atoms to a second center, CuZ. Both centers were suggested to be dinuclear with thiolate ligation but to undergo different one electron redox cycles, namely, [Cu(II)Cu(I)] [/] [Cu(I)Cu(I)] for CuA and [Cu(II)Cu(II)] [/] [Cu(II)Cu(I)] for CuZ. In this model, CuA was presumed to act as an electron transfer center, by analogy with the role of this center in COX (18), and CuZ was proposed to be the catalytic center.
The work presented in this paper is an analysis of the electronic structure of the center designated CuZ. This leads to the conclusion that CuZ is a nonplanar bis-thiolate bridged dinuclear copper site. However, comparison of protein sequences and evidence from site-directed mutagenesis show that only two cysteines are conserved positionally. This poses the paradox that there are insufficient thiolate ligands to bind two pairs of copper ions per N2OR monomer. We propose a resolution, based on spectroscopic quantification of the amount of CuA and CuZ, concluding that both are structural variants of a single dinuclear copper center, that this center is the electron entry site to the enzyme, and hence that the electron transfer center can undergo a two-electron redox change from [Cu(I)Cu(I)] to [Cu(II)Cu(II)]. This model then leaves open questions about the nature of the catalytic site of N2OR.
MATERIALS AND METHODS
The N2OR used in this work was prepared as described (19). Metal content was determined by atomic absorption spectroscopy, and protein concentration was determined by the method of Lowry et al. (20) assuming a molecular mass of 74 kDa/monomer. The analytical data for the three samples used in this study are as follows: sample 1 = 3.175 copper/monomer, [native monomer] = 1,290 μM, [native EPR] = 970 μM, [reduced monomer] = 1,068 μM, [reduced EPR] = 275 μM; sample 2 = 3.37 copper/monomer, [native monomer] = 570 μM, [native EPR] = 415 μM, [reduced monomer] = 402 μM, [reduced EPR] = 135 μM; sample 3 = 3.89 copper/monomer, [native monomer] = 108 μM, [native EPR] = 80 μM, [reduced monomer] = 92 μM, [reduced EPR] = 40 μM.
X-band (9.4 GHz) EPR spectra were measured by using a Bruker ER200D spectrometer and an Oxford Instruments ESR-9 liquid helium flow cryostat. To determine the spin concentration of a sample, the EPR spectrum was recorded under nonsaturating conditions, typically 30 K and 0.2 mW, and the area under the experimental curve was compared with that obtained under identical conditions for a sample of Cu(II)EDTA, according to the method of Aasa and Vänngård (21). Absorption spectra were recorded by using either an Hitachi U3200 spectrophotometer or an Hitachi U4001 spectrophotometer. MCD spectra at 4.2 K and 5 T were recorded as described (22). LT-MCD spectra are dominated by the contributions from paramagnetic chromophores [C-terms (23)], and thus the Δɛ values (ɛL − ɛR) quoted are in terms of the paramagnetic concentration determined by EPR spectroscopy and are not normalized for magnetic field.
Samples from three different enzyme preparations were characterized by absorption, MCD, and EPR spectroscopies followed by Gaussian deconvolution of the MCD data. MCD spectra from both the native and dithionite-reduced states of all samples were recorded and analyzed. Identification of the nature and quantity of the different chromophores present in N2OR followed Gaussian deconvolution of the individual transitions within the MCD spectrum by using the origin graphical analysis package (Microcal Software). Chromophore concentrations are quoted relative to the monomer concentration, i.e., centers per monomer (CPM) (or spins per monomer for the EPR data). This method of quantifying the centers does not depend on the maximum number of coppers per monomer and takes no account of the analytical copper content of individual samples. This method gives a more reliable comparison between samples than relying on the percentage of the copper giving rise to an EPR signal that varies according to the analytical copper content of each sample. For example, a single center would give a value of between 25.7% and 31.5% of the total copper for the samples studied in this work. The enzyme as-prepared is termed “native enzyme,” as opposed to “oxidized enzyme,” because the presence of a MV chromophore allows for the possibility of higher oxidation states.
RESULTS
Assignment of the CuZ Electronic Spectrum.
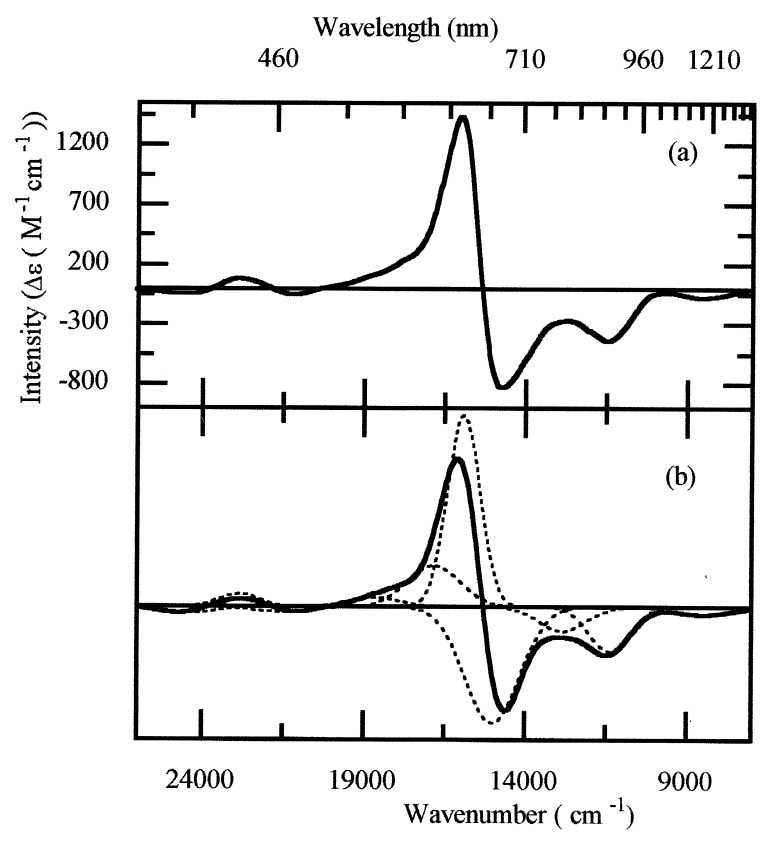
A key feature of copper dimers is the variation in spectroscopic and magnetic properties with oxidation state. If the copper ions are strongly exchange-coupled, only the MV [Cu(II)Cu(I)] state will be paramagnetic and EPR active, S = 1/2. This state also will exhibit optical absorption bands because of electronic transitions into the single hole on the Cu(II) ion. Both optical absorption bands and paramagnetism are required to observe an intense LT-MCD signal. The oxidized [Cu(II)Cu(II)] state will be diamagnetic if the copper ions are anti-ferromagnetically coupled but will still possess optical bands because of d-d and CT transitions, whereas the reduced [Cu(I)Cu(I)] state will be both diamagnetic and colorless in the visible region. In dithionite-reduced N2OR, only CuZ is in the MV state and hence only this center contributes to the LT-MCD and EPR spectra. The EPR spectrum, with g values of 2.16 and 2.05 (24), shows little resolved hyperfine. The intense, oppositely signed bands in the LT-MCD spectrum (Fig. 1) arise from a pair of perpendicularly polarized transitions. The electronic spectrum of the CuZ center has been analyzed by fitting the LT-MCD spectrum to a sum of Gaussian curves. This procedure identifies 10 optical transitions between 26,000 and 7,000 cm−1. No additional transitions are present to 5,000 cm−1. The simulated spectrum together with the individual Gaussian curves are presented in Fig. 1b for sample 1 and detailed for the three samples in Table 1.
Figure 1.
(a) 4.2 K of MCD spectrum of dithionite-reduced N2OR, sample 1. (b) The solid line shows a fit of the experimental MCD data, obtained as a sum of the individual Gaussian curves shown as dotted lines. Full details of the curve parameters are given in Table 1.
Table 1.
The LT-MCD transitions of the Cu2 center
| Gaussian band | Transition* | Position, cm−1† | Intensity†‡ |
|---|---|---|---|
| 1 | 2 | 8,539 − | −0.064 − |
| 2 | 3 | 11,620 ± 243 | −0.244 ± 0.040 |
| 3 | 4 | 12,830 ± 0 | −0.126 ± 0.052 |
| 4 | 5 | 14,999 ± 19 | −1 |
| 5 | 6 | 15,875 ± 32 | +0.955 ± 0.042 |
| 6 | 8 | 16,906 ± 80 | +0.323 ± 0.037 |
| 7 | 9 | 18,877 ± 199 | +0.080 ± 0.007 |
| 8 | 10 | 21,933 ± 376 | −0.037 ± 0.009 |
| 9 | 11 | 22,944 ± 95 | +0.062 ± 0.020 |
| 10 | 12 | 24,396 ± 76 | −0.030 ± 0.019 |
Identified in Fig. 2.
Spread of values due to the variation within the three different samples of N2OR.
Relative band intensities, normalized to that of transition 5.
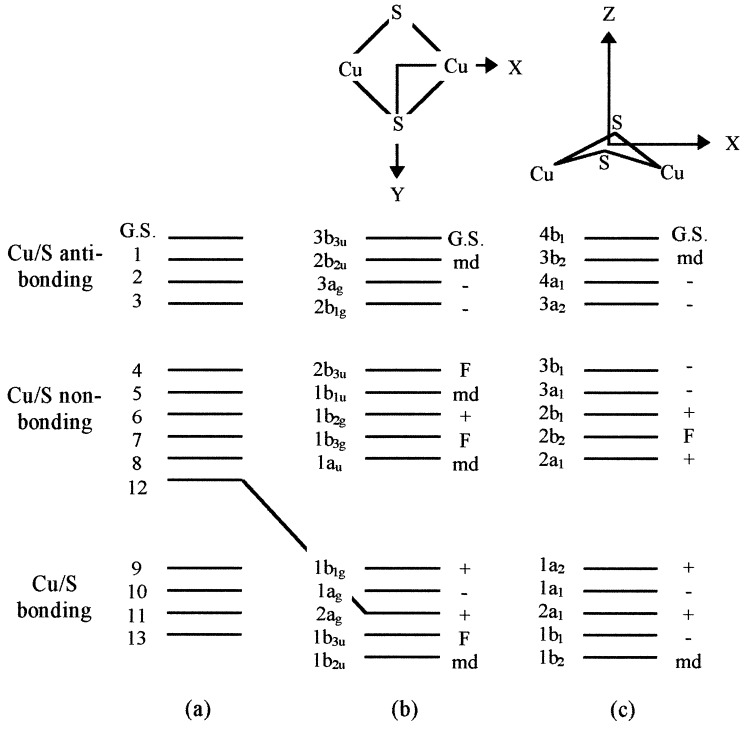
The position and intensity of the optical bands show that the most likely ligands to the CuZ center are thiolate. Thiolate ligation is confirmed by identification of copper–thiolate stretches in the resonance Raman spectrum of this state (25). In view of the similarity between the main features of the MCD spectra of CuA and CuZ, we take as the starting point for the assignment the Cu2S2 rhomb used successfully to assign the CuA electronic spectrum (14). This has 14 copper/sulfur-based molecular orbitals, which divide into three subsets: 6 copper-based 3dxz, 3dyz, and 3dz2 orbitals that form nonbonding combinations with respect to the copper–sulfur interaction and 4 copper 3dxy and 3dx2-y2 orbitals that overlap with the sulfur 2px and 2py orbitals to form 4 bonding and 4 anti-bonding combinations (Fig. 2). The sulfur 2pz orbitals are σ bonding within the cysteine ligand, and transitions from these orbitals to the ground state orbital are expected to be too high in energy to be observed here (26). In the [Cu(II)Cu(II)] state, the highest energy orbital is empty, whereas in the one-electron-reduced, MV state, it is singly occupied. All other orbitals are doubly occupied, and hence the MV ground and excited states are spin doublets. Six electric dipole transitions are allowed within this manifold if the chromophore is planar (D2h), as is the CuA center, Fig. 2b. Because 10 electric dipole transitions have been identified in the MCD spectrum of the CuZ center, the chromophore must have lower symmetry: C2v rather than D2h. This implies either that the CuZ center has undergone a distortion about the Z-axis such that the copper ions lie below the sulfur ligands, as shown in Fig. 2c, or that additional ligands are bound. Such changes must not remove the equivalence of the two copper ions required for valence delocalization. Keeping the same ordering of excited states as observed for the CuA center, the ground state under C2v is 2B1. All of the electric dipole allowed transitions identified in Fig. 2c have been assigned in the LT-MCD spectrum of reduced N2OR (Table 1). The high degree of covalency within the Cu2S2 chromophore (14) ensures that d-d and charge-transfer transitions are mixed heavily.
Figure 2.
(a) One-electron orbitals used to assign the electronic transitions within the CuA and CuZ centers of N2OR, formed by combination of the copper 3d and sulfur 2px and 2py atomic orbitals. (b) The allowed transitions for the CuA center under D2h symmetry. (c) The allowed transitions when a bis-thiolate-bridged dicopper center is distorted within the XY plane to give local C2v symmetry as in the case of the CuZ center. F, forbidden transition; md, magnetic-dipole allowed transition; −, electric dipole-allowed transition that results in a negative experimental MCD band; +, electric dipole-allowed transition that results in a positive experimental MCD band.
Although we propose here that CuZ is a nonplanar bis-thiolate bridged chromophore, neither replacement of one bridging thiol by another ligand, such as an oxo-, hydroxo-, or an inorganic sulfido- group, nor even the presence of an additional ligand can be excluded as possibilities to explain the differences between the CuA and CuZ MCD spectra. To date, there are no appropriate spectroscopic models for the properties of a MV mono-thiolate bridged dimeric copper center. If CuZ were such a species, the maximum number of electric dipole allowed transitions, under C2v symmetry, would be nine, in contrast to the 10 transitions clearly identified in Fig. 1b. The broadness of the bands means that Gaussian analysis of the absorption spectrum does not help in this matter.
Deconvolution of the Copper Centers Present in N2OR.
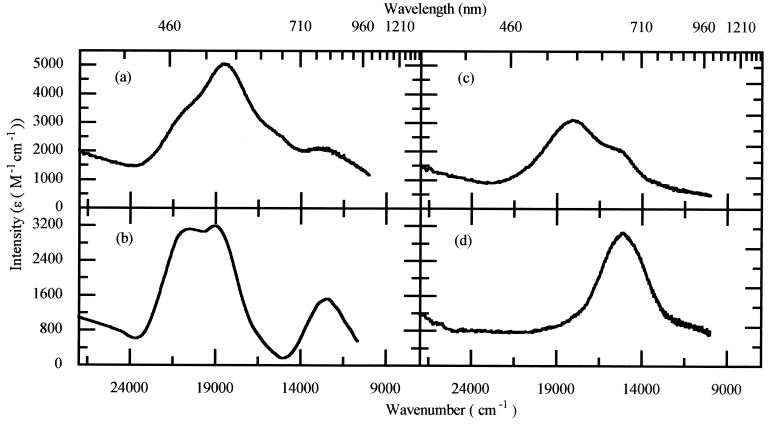
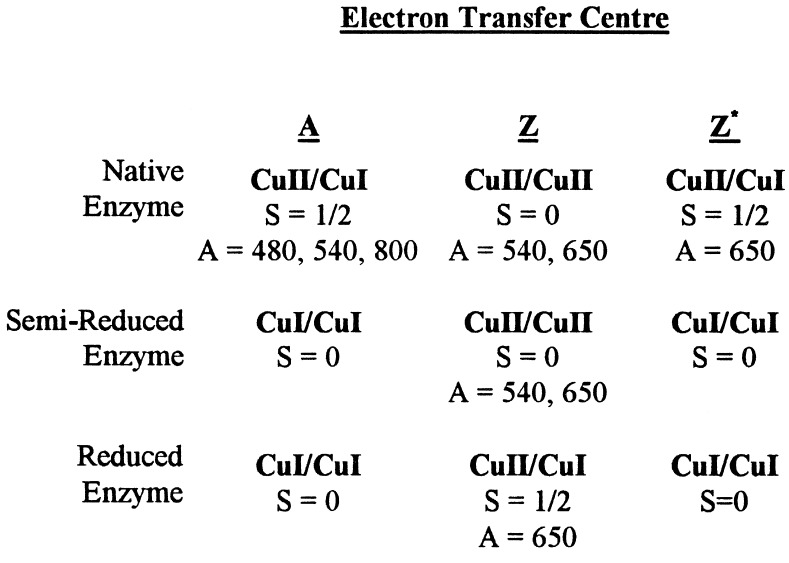
Three oxidation levels of the enzyme [native, semi-reduced (S-R) and dithionite-reduced] have been studied by absorption, EPR, and MCD spectroscopies. The absorption spectra of these oxidation states are presented in Fig. 3. Native wild-type enzyme (Fig. 3a) is dominated by the MV CuA center with broad bands at 480, 540, and 800 nm (see Fig. 3b for comparison). Additional intensity at 540 nm and 650 nm also is observed. Reduction with excess sodium ascorbate results in S-R enzyme (17, 27). This state is largely EPR silent. Although no EPR active species is present, there remain relatively intense optical bands at 540 nm and 650 nm (ɛ ≈ 1,500–2,500 M−1 cm−1) characteristic of thiolate–copper transitions (Fig. 3c). LT-MCD studies confirm that this chromophore is not a ferro-magnetically coupled (S = 1) [Cu(II)Cu(II)] center (data not shown). Additional reduction with sodium dithionite converts S-R enzyme into the “blue” form with a single broad absorption band at 650 nm (Fig. 3d). Interconversion between the S-R and dithionite-reduced species occurs with an isosbestic at 615 nm in the absorption spectrum, showing that two chromophores are in equilibrium. Because a single chromophore, MV CuZ with Amax = 650 nm, is present in dithionite-reduced N2OR, the chromophore present in the S-R state of the enzyme, with Amax = 540 nm and 650 nm, must be the fully oxidized, anti-ferromagnetically coupled [Cu(II)Cu(II)] state of the CuZ center. This is the highest oxidation state for a copper dimer, and so oxidized CuZ also must be present in native enzyme.
Figure 3.
The 298 K of absorption spectra of N2OR in Hepes (pH 7.2), sample 3. (a) Native enzyme, showing optical bands due to the CuA, CuZ, and Cu*Z centers. (b) Absorption spectrum of the MV CuA chromophore in N2OR V. (c) S-R enzyme obtained after reduction with sodium ascorbate, showing optical bands of the fully oxidized [Cu(II)Cu(II)] state of the CuZ center only. (d) N2OR obtained after reduction with excess sodium dithionite, showing optical bands due to the MV state of CuZ only.
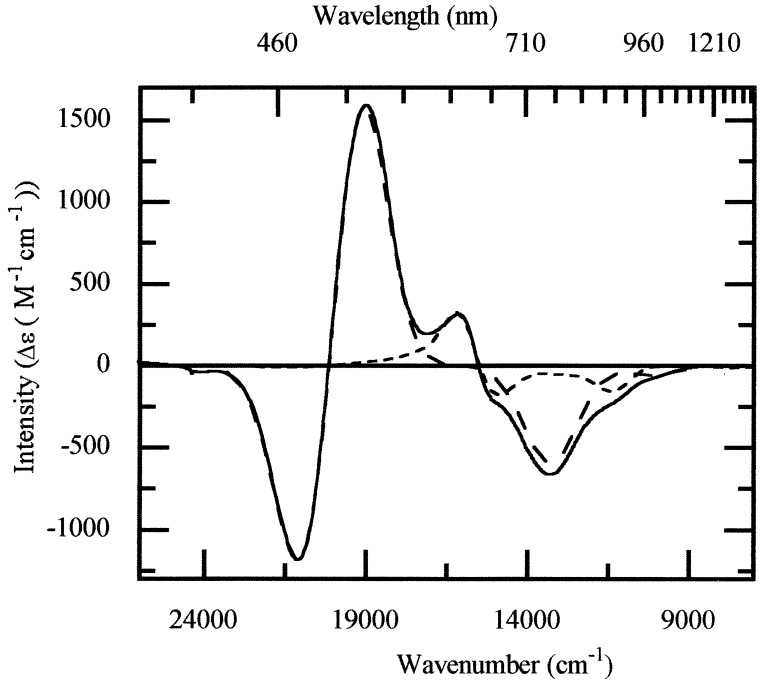
The distinctive characteristics of the MCD spectrum of dithionite-reduced N2OR (Fig. 1a) are the two oppositely signed bands at 625 nm (+1,440 M−1 cm−1) and 680 nm (−830 M−1 cm−1). The spectrum has been assigned to the MV state of a thiol-ligated copper dimer, section 1. Comparison of the MCD spectra of mutant N2OR, in which only the CuA center is present (N2OR V) (14), and native wild-type enzyme shows the presence of two additional oppositely signed bands centered at 645 nm in wild-type enzyme (Fig. 4). These bands arise from a second paramagnet, previously designated Cu*Z. Gaussian analysis has been used to show that the MCD spectrum of native wild-type enzyme has contributions from a MV CuA center and a MV CuZ center (Fig. 4). This shows that Cu*Z is a variant of CuZ present in the MV state in native enzyme. There is no evidence for any additional paramagnetic chromophores. Thus, MV Cu*Z can be identified with the second paramagnet observed in the EPR spectrum of native N2OR (10). By analogy with dithionite-reduced N2OR, it may be expected that MV Cu*Z will have a single broad absorption band centered around 650 nm.
Figure 4.
MCD spectrum of native N2OR (solid line), sample 1. The individual spectra of the MV CuA center (long dash line) and the MV Cu*Z center (short dash line) have been obtained by Gaussian deconvolution of the spectrum.
We are now in a position to assign all of the features of the absorption spectrum of native N2OR in Fig. 3a. There are contributions from three centers: CuA, Cu*Z, and CuZ. MV CuA has bands at 480, 540, and 800 nm, MV Cu*Z has a single band at 650 nm, and oxidized CuZ has two bands at 540 and 650 nm. The conclusions reached are summarized in Scheme S1. Quantification of these three species is presented in the next section.
Scheme 1.
Quantification of the CuA, CuZ, and Cu*Z Centers.
The LT-MCD spectrum measures those chromophores that are paramagnetic in a given oxidation state of the enzyme; thus, the CPM value for each of the species (CuA, CuZ, and Cu*Z) in the various oxidation states of the enzyme (native, S-R, and reduced) can be determined based on EPR and MCD quantification. The quantification of centers in nonparamagnetic states can be deduced providing the assumptions are made that the different forms do not interconvert as the reduction proceeds¶ and that each form undergoes only a one-electron redox process. The existence of a diamagnetic S-R state means that those Cu*Z centers that are paramagnetic in the native state are not the same CuZ centers that are paramagnetic in dithionite-reduced enzyme. Because no other chromophores are present in N2OR, the total concentration of centers [CuA + CuZ + Cu*Z] at each oxidation level of the enzyme should be 2 CPM if CuA and CuZ/Cu*Z are distinct centers and 1 CPM if CuA, CuZ and Cu*Z are variants of a single dimeric copper center. The CPM value for CuZ in reduced enzyme is necessarily the same via both MCD and EPR quantification because the MCD intensity is based on the EPR concentration. The CPM values for the CuA and Cu*Z centers in native enzyme are obtained by comparison of the intensities of the individual deconvoluted spectra (Fig. 4) with those for CuA in N2OR V and CuZ in dithionite-reduced N2OR, respectively. The values obtained by this method are in agreement with that determined by EPR quantification, which gives an average value of 0.743 spins per monomer in native enzyme, due to both CuA and Cu*Z. The results based on MCD quantification are presented in Table 2 and show that the total number of centers is one per protein monomer. This is an unexpected finding, the implications of which are discussed below.
Table 2.
Average distribution of the three forms of the copper–thiolate center in N2OR based on Gaussian analysis of the MCD spectra
| State | Contribution of each center†
|
Total | |||||
|---|---|---|---|---|---|---|---|
| CuA
|
CuZ
|
CuZ*
|
|||||
| II/I | I/I | II/II | II/I | II/I | I/I | ||
| Native | 0.521 ± 0.07‡ | 0 | (0.343)§ | 0 | 0.162 ± 0.04‡ | 0 | 1.026 |
| S-R | 0 | (0.521) | (0.343) | 0 | 0 | (0.162) | 1.026 |
| Reduced | 0 | (0.521) | 0 | 0.343 ± 0.09‡ | 0 | (0.162) | 1.026 |
Shown as the CPM value.
This variation represents the spread of values obtained for the three enzyme preparations studied, and thus the distribution of the different forms depends somewhat on the enzyme preparation.
Values in parentheses are for diamagnetic or spectroscopically silent oxidation states whose presence is deduced from data on paramagnetic oxidation states.
DISCUSSION
Three conclusions can be drawn from the spectroscopic data presented here. First, the MV CuZ chromophore observed in dithionite-reduced N2OR is a thiolate-bridged dinuclear copper center that can undergo the redox cycle [Cu(II)Cu(II)] to [Cu(II)Cu(I)]; second, N2OR contains three forms of copper–thiolate center, CuA, CuZ, and Cu*Z, each form being restricted to a single one-electron redox cycle either [Cu(II)Cu(II)] [/] [Cu(II)Cu(I)] for CuZ or [Cu(II)Cu(I)] [/] [Cu(I)Cu(I)] for CuA and Cu*Z; and, finally, that the sum of the total concentrations of these three forms is never more than one center per protein monomer. The conclusions do not depend on the presence of two bridging thiolates in every form of the center.
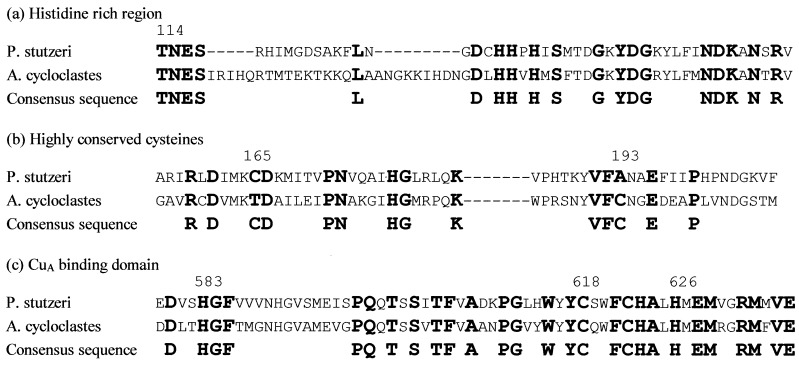
Support for the presence of only one thiolate–copper center comes from study of the published amino acid sequences. Fig. 5 shows an alignment of nosZ sequences [for P. stutzeri (28), Ralstonia eutrophus (formerly Alcaligenes eutrophus) (29), Pseudomonas aeruginosa (29), P. denitrificans (30), Sinorhizobium meliloti (formerly Rhizobium meliloti) (31), and Achromobacter cycloclastes (EMBL databank accession no. X94977)]. A CuA binding domain, analogous to that in subunit II of COX, can be identified in the C-terminal region with strictly conserved cysteine and histidine residues, Cys 618, Cys 622, His 583, and His 626 (P. stutzeri numbering). A third cysteine, Cys 165 in P. stutzeri, is not conserved in A. cycloclastes, although the latter has a cysteine only five residues removed. Residue 193 is Ala in P. stutzeri and a cysteine in the other 5 sequences. It is important that mutation of Cys 165 in P. stutzeri to glycine results in a specific activity in vivo similar to that of the WT enzyme (32). Therefore, it would seem that there are insufficient positionally conserved cysteines to enable two bis-thiolate-bridged dinuclear copper centers to be formed.
Figure 5.
Selected regions of NosZ sequence showing (a) the histidine-rich region, (b) the third highly conserved cysteine, and (c) the CuA binding domain.
These conclusions raise intriguing questions about the copper centers of N2OR. The first concerns the functional roles of the three forms of the copper–thiolate dimer, CuA, CuZ, and Cu*Z. By analogy with the role established for CuA in COX and because of the relative insensitivity of the spectra to the addition of substrate (24) and exogenous ligands (24, 27), they appear to have a role as an electron transfer/electron storage center. The observed oxidation states, summarized in Scheme S1, serve to emphasize that, in these variants, it is possible to access all three oxidation states available to a dimeric copper center. Thus, this center could provide a two-electron storage site, being in effect analogous to quinone. However, it is to be expected that there will be difficulty in transferring two electrons from a single center at similar potentials. For example, the potentials for the [Cu(II)Cu(II)] to [Cu(II)Cu(I)] and [Cu(II)Cu(I)] to [Cu(I)Cu(I)] couples are separated by >500 mV in CuA (33). But, by switching structure to stabilize the [Cu(II)Cu(II)] state, the delivery of a second electron at a similar potential to that of the first could occur. One way of stabilizing the higher, [Cu(II)Cu(II)] oxidation state would be to increase the coordination number of each copper ion, for example, so as to become more nearly tetrahedral. We have suggested that nonplanarity of the Cu2S2 rhomb could account for the spectroscopic differences between CuZ/Cu*Z and CuA. This distortion could be induced by additional ligation to the copper ions, possibly an hydroxide ion or a μ-oxo bridge. Because the delocalization of the MV state is retained, the copper sites must have similar geometries. We note that a model compound with a stable [Cu(II)Cu(II)] state (34) has been reported with a tetrahedral geometry at each copper ion.
Thus, it is envisaged that during turnover there is interconversion between the CuA and CuZ forms to access all three oxidation states. This conversion of CuA-type centers into CuZ-type centers may be part of a control mechanism to prevent the delivery of reducing equivalents to the catalytic center in the absence of substrate. It remains to be shown why the modified CuZ/Cu*Z form of the electron transfer center is only observed in wild-type N2OR and not in either N2OR V or in copper-reconstituted N2OR. Neither N2OR V nor reconstituted N2OR have enzymatic activity, presumably because of the absence of the catalytic site, and it may be that the changes at the electron transfer center that gives rise to the CuZ structural variant only take place when the catalytic center is present. The samples studied here show rather little variation in the CuA:CuZ:Cu*Z ratio, and it remains to be seen whether conditions can be found that trap this electron transfer center entirely in one form.
The Nature of the Catalytic Center.
The proposal that N2OR possesses only one thiolate-bridged center per monomer that is involved in electron storage and transfer raises questions about the nature of the catalytic center. If N2OR contains four copper ions per monomer, maximally, then two copper ions remain unaccounted for. There are nine histidines strictly conserved, in addition to the histidine ligands of CuA. Three are found in a histidine-rich region (Fig. 5a), and one, which is not present in COX, is found within the CuA binding domain of N2OR (Fig. 5c). This high number of conserved histidines leads to the proposal that the catalytic site may be a copper–histidine center with magnetic interaction between a pair of copper ions to render it EPR and optically silent, as with a type III-like [Cu(II)Cu(II)] center (35). However, the total number of copper ions in fully active N2OR is still uncertain, and the difficulty in reconstituting active enzyme from apo-protein may suggest a more complex active center than a simple binuclear type III site. The distribution of conserved histidines does not follow a structurally characterized copper binding motif. However, His 621 conserved within the CuA domain is a candidate for a ligand to the catalytic site. A motif of adjacent cysteine and histidine residues is reminiscent of the copper-containing nitrite reductases (36, 37) and ascorbate oxidase (38) in which histidine ligand(s) to the catalytic site are adjacent to the cysteine ligand of the electron transfer site. This may provide a mechanism for cooperativity between the electron transfer site and the catalytic site and hence allow the switch in structure at the electron transfer site to be determined by events at the catalytic site.
In conclusion, we have presented spectroscopic analysis and quantification that lead to a new model of the metal centers of N2OR. This model proposes the presence a single bis-thiolate-bridged, dinuclear copper center that can undergo a two-electron oxidation from the [Cu(I)Cu(I)] state, both electrons being delivered into a catalytic site at approximately the same potential gated by a structural “switch.” It is further proposed, on the basis of the analytical copper content, that the catalytic site contains two copper ions ligated primarily by histidine residues.
Acknowledgments
A.J.T. and J.A.F. acknowledge support from the U.K. Engineering and Physical Sciences Research Council (EPSRC) and Biotechnology and Biological Research Council (BBSRC) for funding via the Centre for Metalloprotein Spectroscopy and Biology. W.G.Z. acknowledges funding from the Deutsche Forschungsgemeinschaft and Fonds der Chemischen Industrie.
ABBREVIATIONS
- N2OR
nitrous oxide reductase
- N2OR V
inactive mutant form of N2OR containing only CuA centers
- COX
cytochrome c oxidase, MV, mixed valence, S-R, semi-reduced
- LT-MCD
low temperature magnetic CD
- CPM
centers per monomer
Footnotes
This does not imply that the distribution within the three forms is fixed for any given enzyme preparation. Extensive redox cycling experiments in the presence of inhibitors or substrates have not been done.
References
- 1.Zumft W G, Kroneck P M H. In: Denitrification in Soil and Sediment. Revsbech N P, Sørensen J, editors. New York: Plenum; 1990. pp. 37–55. [Google Scholar]
- 2.Berks B C, Ferguson S J, Moir J W B, Richardson D J. Biochim Biophys Acta. 1995;1232:97–173. doi: 10.1016/0005-2728(95)00092-5. [DOI] [PubMed] [Google Scholar]
- 3.Zumft W G, Matsubara T. FEBS Lett. 1982;148:107–112. [Google Scholar]
- 4.McEwan A G, Greenfield A J, Wetzstein H G, Jackson J B, Ferguson S J. J Bacteriol. 1985;164:823–830. doi: 10.1128/jb.164.2.823-830.1985. [DOI] [PMC free article] [PubMed] [Google Scholar]
- 5.Snyder S W, Hollocher T C. J Biol Chem. 1987;262:6515–6525. [PubMed] [Google Scholar]
- 6.Jones A M, Hollocher T C, Knowles R. FEMS Microbiol Lett. 1992;92:205–209. [Google Scholar]
- 7.Teraguchi S, Hollocher T C. J Biol Chem. 1989;264:1972–1979. [PubMed] [Google Scholar]
- 8.Robin M B, Day P. Adv Inorg Chem Radiochem. 1967;10:247–422. [Google Scholar]
- 9.Kroneck P M H, Riester J, Zumft W G, Antholine W E. Biol Metals. 1990;3:103–109. doi: 10.1007/BF01179514. [DOI] [PubMed] [Google Scholar]
- 10.Antholine W E, Kastrau D H W, Steffens G C M, Buse G, Zumft W G, Kroneck P M H. Eur J Biochem. 1992;209:875–881. doi: 10.1111/j.1432-1033.1992.tb17360.x. [DOI] [PubMed] [Google Scholar]
- 11.Wilmanns M, Lappalainen P, Kelly M, Sauer-Eriksson E, Saraste M. Proc Natl Acad Sci USA. 1995;92:11955–11959. doi: 10.1073/pnas.92.26.11955. [DOI] [PMC free article] [PubMed] [Google Scholar]
- 12.Iwata S, Ostermeier C, Ludwig B, Michel H. Nature (London) 1995;376:660–669. doi: 10.1038/376660a0. [DOI] [PubMed] [Google Scholar]
- 13.Tsukihara T, Aoyama H, Yamshita E, Tomizaki T, Yamaguchi H, Shinzawa-Itoh K, Nakashima R, Yaono R, Yoshikawa S. Science. 1996;272:1136–1144. doi: 10.1126/science.272.5265.1136. [DOI] [PubMed] [Google Scholar]
- 14.Farrar J A, Neese F, Lappalainen P, Kroneck P M H, Saraste M, Zumft W G, Thomson A J. J Am Chem Soc. 1996;118:11501–11514. [Google Scholar]
- 15.Farrar J A, Lappalainen P, Zumft W G, Saraste M, Thomson A J. Eur J Biochem. 1995;232:294–303. doi: 10.1111/j.1432-1033.1995.tb20811.x. [DOI] [PubMed] [Google Scholar]
- 16.Houser R P, Young V G, Jr, Tolman W B. J Am Chem Soc. 1996;118:2101–2102. [Google Scholar]
- 17.Farrar J A, Thomson A J, Cheesman M R, Dooley D M, Zumft W G. FEBS Lett. 1991;294:11–15. doi: 10.1016/0014-5793(91)81331-2. [DOI] [PubMed] [Google Scholar]
- 18.Hill B C. J Bioenerg Biomembr. 1993;25:115–120. doi: 10.1007/BF00762853. [DOI] [PubMed] [Google Scholar]
- 19.Coyle C L, Zumft W G, Kroneck P M H, Korner H, Jakob W. Eur J Biochem. 1985;153:459–467. doi: 10.1111/j.1432-1033.1985.tb09324.x. [DOI] [PubMed] [Google Scholar]
- 20.Lowry O H, Rosebrough N J, Farr A L, Randall R J. J Biol Chem. 1951;193:265–275. [PubMed] [Google Scholar]
- 21.Aasa R, Vänngård T. J Magn Reson. 1975;19:308–315. [Google Scholar]
- 22.Thomson A J, Cheesman M R, George S J. Methods Enzymol. 1993;226:199–231. doi: 10.1016/0076-6879(93)26011-w. [DOI] [PubMed] [Google Scholar]
- 23.Piepho S B, Schatz P N. Group Theory in Spectroscopy with Applications to Magnetic Circular Dichroism. New York: Wiley-Interscience; 1983. [Google Scholar]
- 24.Riester J, Zumft W G, Kroneck P M H. Eur J Biochem. 1989;178:751–762. doi: 10.1111/j.1432-1033.1989.tb14506.x. [DOI] [PubMed] [Google Scholar]
- 25.Dooley D M, Moog R S, Zumft W G. J Am Chem Soc. 1987;109:6730–6735. [Google Scholar]
- 26.Gewirth A A, Solomon E I. J Am Chem Soc. 1988;110:3811–3819. [Google Scholar]
- 27.Dooley D M, Alvarez M L, Rosenzweig A C, Hollis R C, Zumft W G. Inorganica Chimica Acta. 1996;242:239–244. [Google Scholar]
- 28.Viebrock A, Zumft W G. J Bacteriol. 1988;170:4658–4668. doi: 10.1128/jb.170.10.4658-4668.1988. [DOI] [PMC free article] [PubMed] [Google Scholar]
- 29.Zumft W G, Dreusch A, Lochelt S, Cuypers H, Friedrich B, Schneider B. Eur J Biochem. 1992;208:31–40. doi: 10.1111/j.1432-1033.1992.tb17156.x. [DOI] [PubMed] [Google Scholar]
- 30.Hoeren F U, Berks B C, Ferguson S J, McCarthy J E G. Eur J Biochem. 1993;218:49–57. doi: 10.1111/j.1432-1033.1993.tb18350.x. [DOI] [PubMed] [Google Scholar]
- 31.Holloway P, McCormick W, Watson R J, Chan Y K. J Bacteriol. 1996;178:1505–1514. doi: 10.1128/jb.178.6.1505-1514.1996. [DOI] [PMC free article] [PubMed] [Google Scholar]
- 32.Dreusch A, Riester J, Kroneck P M H, Zumft W G. Eur J Biochem. 1996;237:447–453. doi: 10.1111/j.1432-1033.1996.0447k.x. [DOI] [PubMed] [Google Scholar]
- 33.Immoos C, Hill M G, Sanders D, Fee J A, Slutter C E, Richards J H, Gray H B. J Bioinorg Chem. 1996;1:529–531. [Google Scholar]
- 34.Houser R P, Halfen J A, Young V G, Jr, Blackburn N J, Tolman W B. J Am Chem Soc. 1995;117:10745–10746. [Google Scholar]
- 35.Solomon E L. In: Copper Proteins. Spiro T G, editor. Vol. 3. New York: Wiley; 1981. [Google Scholar]
- 36.Nishiyama M, Suzuki J, Kukimoto M, Ohnuki T, Horinouchi S, Beppu T. J Gen Microbiol. 1993;139:725–733. doi: 10.1099/00221287-139-4-725. [DOI] [PubMed] [Google Scholar]
- 37.Glockner A B, Juengst A, Zumft W G. Arch Microbiol. 1993;160:18–26. doi: 10.1007/BF00258141. [DOI] [PubMed] [Google Scholar]
- 38.Messerschmidt A, Rossi A, Ladenstein R, Huber R, Bolognesi M, Gatti G, Marchesini A, Petruzelli T, Finazzi-Agro A. J Mol Biol. 1989;206:513–530. doi: 10.1016/0022-2836(89)90498-1. [DOI] [PubMed] [Google Scholar]


